Introduction
Colorectal carcinoma (CRC) is one of the most common
cancers worldwide. However, the early diagnosis rate of CRC is low,
and surgery is less effective in patients with more advanced CRC
(stage III), for whom the mortality rate is high and the prognosis
is poor. Early diagnosis depends on a combination of early
screening of non-specific biomarkers such as CEA and CA199 and
pathological endoscopic biopsies (1,2).
Consequently, most patients are diagnosed at the intermediate or
late stages and deprived of the opportunity for surgery. Therefore,
the lack of specific biomarkers for earlier diagnosis and
therapeutic targets leads to high CRC mortality worldwide (2–4), and
CRC is one of the primary causes of cancer-related death in the
world. Intervention in the early stage could cure colorectal
cancer, and the identification of CRC biomarkers may be a
convenient way to achieve this objective.
Recent studies show that the pathogenesis of cancer
is highly related to glycosylation (5,6). The
increased expression of N-acetylgalactosamine (GalNAc) on
the surface of cancer cells is one of the characteristics of the
altered glycosylation pathway (7).
Mucins are highly O-glycosylated proteins that play pivotal
roles in cell adhesion, inflammation, cell proliferation, apoptosis
and tumorigenesis (8–11). The mucin-associated carbohydrate Tn
antigen is composed of a GalNAc residue covalently O-linked
to a serine/threonine (12,13), which is shielded in healthy tissues
and benign tumors but occurs in ~90% of all human primary
carcinomas (14). The synthesis of
sialyl-Tn antigen (sTn) is regulated by the sialyltransferase
ST6GalNAc, which competes against O-glycan elongating
glycosyltransferases and prevents tumors from exhibiting longer
O-glycans (12,15). Abnormal Tn antigen expression has
been observed in lung, breast, ovarian and CRC (16–20).
Tn antigen is also associated with malignancy and represents a
potential marker of malignant transformation (17,21,22).
Recent studies have shown that higher Tn antigen expression is
observed in CRC patients (14,23,24).
Tn antigen may promote cancer metastasis by secretion of
transforming growth factor-β (TGF-β) in the tumor microenvironment
(25). In addition, Tn was found to
be expressed in moderately differentiated tumors but not in poorly
differentiated carcinomas (26),
and a deficiency of core-1-derived O-glycans could delay the
onset and progression of breast cancer (18). Furthermore, Tn antigen is related to
poor prognosis in patients with breast cancer (27). Above all, we hypothesized that the
Tn antigen plays a central role in the early diagnosis and the
development of CRC. However, the Tn-related proteins participating
in its pathogenic progression remain unclear. It is therefore
worthwhile to analyze the expression of Tn-related proteins. In the
present study, we used iTRAQ to screen differentially expressed
proteins between Tn-positive and Tn-negative CRC tissues and to
identify accessible proteins as useful diagnostic biomarkers or new
therapeutic candidates for CRC.
Materials and methods
Patient information and sample
preparation
A series of primary colon resections were
prospectively collected between November 2011 and March 2012 from
the Department of Minimally Invasive Surgery of the Second Xiangya
Hospital in Changsha. Each resection contained both colon tumor
samples and adjacent healthy tissues, and lymph nodes were also
collected. Some of the samples were kept at −80°C until analysis,
and the remaining samples were fixed in 4% paraformaldehyde and
sent to the Pathology Department for further analysis. CRC samples
were screened for Tn staining via immunochemical examination by Dr
Lijun Xia from the Oklahoma Medical Research Foundation (OMRF;
Oklahoma City, OK, USA). Based on the Tn antigen expression, the
samples were divided into three groups as follows: CRC with
negative Tn expression (CRC Tn−), CRC with positive Tn
expression (CRC Tn+) and normal control without Tn
expression (NC). No patient was treated with any kind of
chemotherapy. The patient information is shown in Table I.
 | Table IPatient characteristics. |
Table I
Patient characteristics.
| Pt. no. | Mean age
(years) | Gender | Histological
assessment | TNM | Tn | Category |
|---|
| 1 | 64 | Male | Rectal
tubulovillous adenocarcinoma | Tis0 | − | Tn− |
| 2 | 50 | Female | Moderately-poorly
differentiated rectal adenocarcinoma | T3N1bM0 (IIIB) | − |
Tn−/normal |
| 3 | 81 | Male | Moderately
differentiated colon adenocarcinoma | T3N0M0 (IIA) | − | Tn− |
| 4 | 56 | Female | Moderately
differentiated rectal adenocarcinoma | T4aN1aM0
(IIIB) | + |
Tn+/normal |
| 5 | 70 | Male | Moderately and
poorly differentiated rectal adenocarcinoma | T3N0M0 (IIA) | + |
Tn+/normal |
| 6 | 52 | Male | Moderately
differentiated colon adenocarcinoma | T3N0M0 (IIA) | + | Tn+ |
This study was approved by the Institutional Ethics
Committee of the Second Xiangya Hospital of Central South
University. All participants provided written informed consent.
Protein extraction and iTRAQ
labeling
One gram of fresh tissues was ground in liquid
nitrogen and suspended in 5 ml of lysis buffer with supplements (7
mM urea, 2 mM sulfourea, 0.1% PMSF, 65 mM DTT) on ice for 30 min,
followed by centrifugation for 15 min at 24,1488 × g. The
supernatant was collected, and the protein concentration was
determined using the Bradford Protein Assay kit (Bio-Rad, USA).
For peptide labeling, a peptide mixture from each
group was labeled with iTRAQ tags according to the kit's protocol
(Applied Biosystems, Foster City, CA, USA). Protein samples from
adjacent healthy tissues were labeled with reagent 114.
Tn− CRC and Tn+ CRC samples were labeled with
reagent 117 and 118, respectively.
2D LC-MS/MS
The peptide mixture was reconstituted and acidified
with buffer A (10 mM KH2PO4, pH 2.6, and 25%
acetonitrile) (ACN; Thermo Fisher Scientific, Inc., Fair Lawn, NJ,
USA) and loaded onto a strong cation exchange (SCX) chromatography
column (The Nest Group, Inc., Southborough, MA, USA) on a 20AD
high-performance liquid chromatography (HPLC) system (Shimadzu,
Kyoto, Japan). The peptides were eluted at a flow rate of 200
µl/min with a gradient of 0–80% buffer B for 60 min. The
elution was monitored by absorbance at 214/280 nm, and fractions
were collected every minute. The collected fractions were combined
and desalted on a C18 cartridge (Waters Corp., Milford, MA,
USA).
All samples were resuspended in 50 µl HPLC
buffer A (5% ACN and 0.1% formic acid), loaded in the ZORBAX
300SB-C18 reverse-phase column (5 µm, 300 Å, 0.1×150 mm;
Michrom BioResources, Auburn, CA, USA). The peptides were separated
for >90 min using a linear gradient of 5–35% HPLC buffer B (95%
ACN and 0.1% formic acid) at a flow rate of 300 nl/min. The MS
analysis was performed using a QSTAR XL analyzer (Applied
Biosystems) coupled with a 20AD HPLC system (Shimadzu). Precursor
ions were selected across the mass range of 400–1,800 m/z.
Four precursors were selected for MS/MS analyses across the mass
range of 100–2,000 m/z.
Data analysis and bioinformatics
Protein identification and relative iTRAQ
quantification were performed with the Paragon algorithm in the
ProteinPilot Software 3.0 (revision 114732; Applied Biosystems).
The results were further processed using the Pro Group algorithm
(Applied Biosystems), where isoform-specific quantification was
adopted to trace the differences between the expression levels of
various isoforms. Quantitative ratios of reporter ions, calculated
by comparing the peak areas of each of these reporter ions in the
mass spectrum, were used to evaluate the expression change of the
protein in different samples. Normalization was performed during
the quantification to correct the experimental bias. To accept
proteins as showing differential expression between different
groups, we strictly followed the following criteria. It was
mandatory for proteins to be identified with >95% confidence,
and the protein confidence threshold cutoff was 1.3 (unused
ProtScore). Proteins with significant P-values (P<0.05) were
considered differentially expressed. The false discovery rate (FDR)
for protein detection was calculated as FDR = (2 ×
reverse)/(forward + reverse). UniProt was used to annotate the
proteins in the biological process and molecular function
categories in the human UniProtKB/Swiss-prot database (version
3.52, November 2008).
Gene Ontology and pathway analysis
Gene Ontology (GO) was used to annotate the proteins
by biological process and molecular function. We translated the
genes into putative amino acid sequences and aligned these genes
against a set of protein sequences from the Kyoto Encyclopedia of
Genes and Genomes (KEGG) database. Each protein was assigned to
KEGG orthology (KO), and differentially enriched KO pathways were
identified.
Cell culture and immunofluorescence
staining of the Tn antigen
LS174T cells (a gift from Dr Lijun Xia, OMRF), were
cultured in Dulbecco's modified Eagle's medium (DMEM; Hyclone,
Logan, UT, USA) supplemented with 10% fetal bovine serum (FBS;
Zhejiang Tianhang Biological Technology Stock Co., Ltd., Zhejiang,
China) and antibiotics (100 U/ml penicillin and 100 mg/ml
streptomycin; Gibco, USA).
For immunofluorescence staining of the Tn antigen,
LS174T cells on cover slips were fixed in 4% paraformaldehyde
(Sigma), permeabilized with 0.1% Triton X-100 (Promega) at room
temperature for 15 min, and blocked with 1% BSA (Gibco) for 30 min
at room temperature. The slides were incubated with a mouse
monoclonal antibody against Tn (made by OMRF) at 1:50 overnight at
4°C, followed by a 1-h incubation at room temperature with the
secondary antibody (anti-mouse antibody, 1:2,000; Jackson
ImmunoResearch, West Grove, PA, USA). The sections were
counterstained with DAPI for 2 min and then visualized and
photographed under a confocal laser scanning microscope (LaVision
BioTec GmbH, Bielefeld, Germany). To confirm the expression of
Decorin or SORBS1, 3×10⁶ LS174T cells were harvested,
and the total proteins were prepared for subsequent western
blotting.
Western blotting
The extracted proteins from tissues or cells were
resolved by SDS-PAGE gradient gel (5% spacer gel and 8% separation
gel). After electrophoresis, samples were transferred to a
polyvinylidene fluoride membrane, blocked at room temperature for 1
h with 5% milk, and incubated with a mouse antibody against Decorin
(1:500; Abcam, USA), a rabbit antibody against SORBS1 (1:1,000;
Abgent, USA) or a mouse antibody against β-actin (1:1,000; Abcam)
at 4°C overnight. The membranes were washed with buffer three
times, incubated with an HRP-conjugated anti-rabbit secondary
antibody (1:5,000) or anti-mouse secondary antibody (1:20,000)
(both from Abcam) at room temperature for 1 h, and visualized with
an ECL kit (GE Healthcare). Specific signals were quantified from
exposed X-ray film using a scanner with BandScan 4.30 densitometry
software and are expressed as integrated intensity units relative
to the β-actin signals.
Immunohistochemistry assay in
tissues
To detect the immunohistochemical expression of
Decorin or SORBS1, the embedded tissues were cut into 5-µm
thin sections. These sections were incubated with an antibody
against Decorin (1:50) or SORBS1 at 1:100 overnight at 4°C after
blocking with 2% BSA. Subsequently, the sections were treated with
an HRP-conjugated anti-rabbit (1:5,000) or anti-mouse secondary
antibody (1:20,000) at room temperature for 1 h. The DAB Detection
kit (EliVision Super DAB; Maixin-Bio, Fuzhou China) for blocking
non-specific binding and antibody detection was used. The sections
were then counterstained with hematoxylin. The immunostaining
results were detected under a light microscope.
Statistics
All observations were confirmed by at least three
independent experiments. Image-Pro Plus 6.0 was used to analyze the
results from IHC, and Quantity One v4.6.2 was used for western
blotting. For quantitative data, t-test and ANOVA were used for
statistical analysis. The analyses were performed using SPSS
Statistics 20 (SPSS Inc. Chicago, IL, USA). P<0.05 was
considered statistically significant.
Results
Tn antigen expression and
clinicopathological factors in CRC patients
Sixteen patients with a confirmed diagnosis of CRC
were included. The enrolled patients included three males and three
females, with ages ranging from 50 to 81 years (mean age, 62). Most
were diagnosed with moderately differentiated cancer. The Tn
antigen expression was detected in 3 patients, as shown in Table I.
Identification of Decroin and SORBS1 as
differentially expressed glycoproteins in CRC by iTRAQ
A total of 1,051 non-redundant proteins in the
genome (UniProt) were significantly identified from the number of
MS/MS spectra and number of peptides using a 2% false discovery
rate (FDR) as the cutoff in the triplicate independent experiments.
Of these, 750 had quantitative information, and more than two
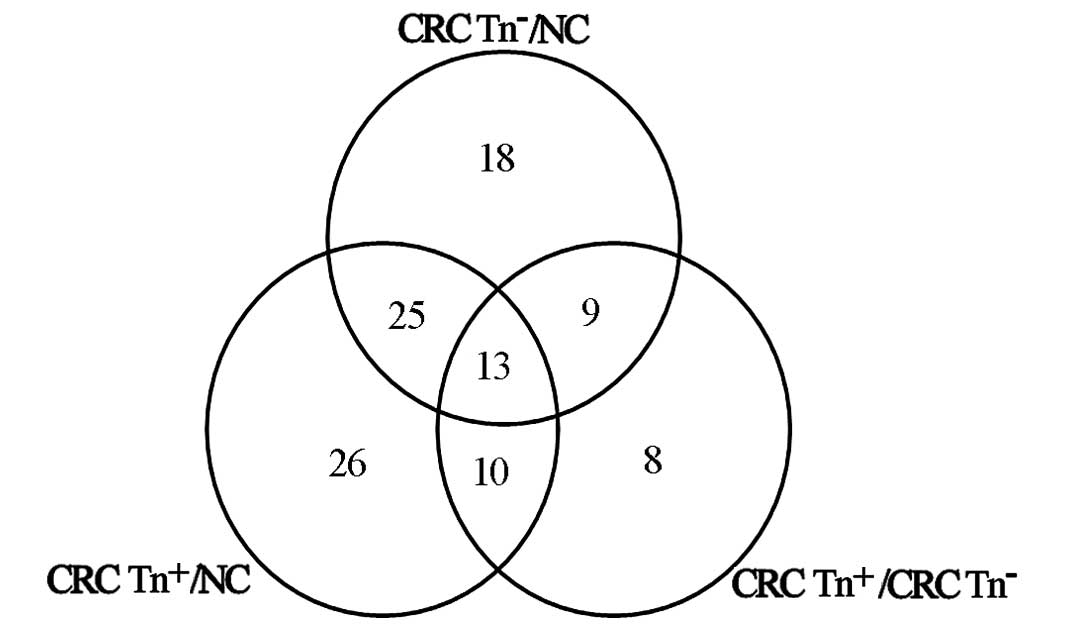
peptides were matched to these proteins. There were 330
differentially expressed proteins between CRC Tn− and NC
tissues, 317 between CRC Tn+ and NC tissues, and 316
between CRC Tn− and CRC Tn+ tissues. Among
the 316 proteins, there were 55 glycoproteins and 19
O-glycoproteins. Twelve of the 19 O-glycoproteins
were also differentially expressed between the CRC
Tn−/CRC Tn+ tissues and normal mucosal
tissues (Tables II and III).
| Table IIDifferentially expressed proteins in
Tn+ compared with Tn− tissues. |
Table II
Differentially expressed proteins in
Tn+ compared with Tn− tissues.
| Pt. no. | Accession | Name |
Tn+:Tn− |
PValTn+:Tn− |
EFTn+:Tn− |
|---|
| 1 | P24821 | Tenascin | 0.61944109201 | 0.041761569679 | 1.1803209782 |
| 2 | P27797 | Calreticulin | 1.2941960096 | 0.10105329752 | 1.1912419796 |
| 3 | O43852 | Calumenin | 1.5275659561 | 0.13953730464 | 1.2022639513 |
| 4 | P02768 | Serum albumin | 2.0137240887 | 0.13020549715 | 1.213389039 |
| 5 | P05787 | Keratin, type II
cytoskeletal 8 | 0.81658238173 | 0.38406300545 | 1.1168630123 |
| 6 | P05783 | Keratin, type I
cytoskeletal 18 | 0.47424200177 |
0.00049924501218 | 1.213389039 |
| 7 | P11047 | Laminin subunit
γ-1 | 0.65463608503 | 0.18409490585 | 1.2473829985 |
| 8 | P12110 | Collagen α-2(VI)
chain | 1.2589249611 | 0.007290690206 | 1.2705739737 |
| 9 | Q01082 | Spectrin β chain,
brain 1 | 1.3677289486 | 0.18495669961 | 1.2941960096 |
| 10 | P01023 |
α-2-macroglobulin | 0.66680681705 | 0.34203439951 | 1.3061709404 |
| 11 | P02766 | Transthyretin | 0.69823241234 | 0.21042379737 | 1.3182569742 |
| 12 | P02763 | α-1-acid
glycoprotein 1 | 1.6749429703 | 0.49577480555 | 1.3304539919 |
| 13 | Q9Y4L1 | Hypoxia upregulated
protein 1 | 1.5135610104 | 0.065106026828 | 1.3304539919 |
| 14 | P55268 | Laminin subunit
β-2 | 0.71121352911 | 0.17134909332 | 1.3304539919 |
| 15 | P02452 | Collagen α-1(I)
chain | 0.55462568998 | 0.019404709339 | 1.3427649736 |
| 16 | Q12864 | Cadherin-17 | 0.74473202229 | 0.21211579442 | 1.3551889658 |
| 17 | P05164 |
Myeloperoxidase | 0.64863437414 | 0.12027399987 | 1.3677289486 |
| 18 | P02787 |
Serotransferrin | 1.8365379572 | 0.19530679286 | 1.4190570116 |
| 19 | Q9Y6R7 | IgG Fc-binding
protein | 1.3061709404 | 0.29926979542 | 1.4190570116 |
| 20 | P08294 | Extracellular
superoxide dismutase [Cu-Zn] | 0.64268767834 | 0.30398610234 | 1.4321880341 |
| 21 | P10153 | Non-secretory
ribonuclease | 1.3551889658 | 0.13421760499 | 1.4454400539 |
| 22 | P69905 | Hemoglobin subunit
α | 0.42461958528 |
0.0031579970382 | 1.4454400539 |
| 23 | P01833 | Polymeric
immunoglobulin receptor | 3.3419499397 | 2.79E-06 | 1.4859360456 |
| 24 | P02675 | Fibrinogen β
chain | 0.51050502062 | 0.46312698722 | 1.4859360456 |
| 25 | P08123 | Collagen α-2(I)
chain | 0.46131759882 | 0.20906309783 | 1.4859360456 |
| 26 | P98160 | Basement
membrane-specific | 1.3803839684 | 0.35451129079 | 1.4996850491 |
| 27 | P01857 | Ig γ-1 chain C
region | 1.3551889658 | 0.50612038374 | 1.4996850491 |
| 28 | P00738 | Haptoglobin | 0.45289760828 | 0.10523310304 | 1.4996850491 |
| 29 | P08238 | Heat shock protein
HSP90-β | 1.7378009558 | 0.32500821352 | 1.5135610104 |
| 30 | P01876 | Ig α-1 chain C
region | 1.6443719864 | 0.16751100123 | 1.5135610104 |
| 31 | P05155 | Plasma protease C1
inhibitor | 0.63679552078 | 0.38150951266 | 1.5135610104 |
| 32 | P01009 |
α-1-antitrypsin | 0.57543987036 | 0.51836198568 | 1.5135610104 |
| 33 | P02788 |
Lactotransferrin | 1.3803839684 | 0.40739420056 | 1.5275659561 |
| 34 | P10645 | Chromogranin A | 2.6791679859 | 0.020165350288 | 1.5703630447 |
| 35 | P10909 | Clusterin | 0.67920362949 | 0.50286757946 | 1.5995579958 |
| 36 | P01871 | IgM chain C
region | 0.66069352627 | 0.67946302891 | 1.5995579958 |
| 37 | Q9BX66 | Sorbin and SH3
domain-containing protein 1 | 0.47424200177 | 0.098883867264 | 1.6292959452 |
| 38 | P01877 | Ig α-2 chain C
region | 0.66680681705 | 0.44289419055 | 1.6443719864 |
| 39 | P22105 | Tenascin-X | 0.79432821274 | 0.49807879329 | 1.6595870256 |
| 40 | P02750 | Leucine-rich
α-2-glycoprotein | 0.50118720531 | 0.26861310005 | 1.6904410124 |
| 41 | P51888 | Prolargin | 1.3182569742 | 0.95629411936 | 1.7060819864 |
| 42 | P62807 | Histone H2B type
1-C/E/F/G/I | 0.48752850294 | 0.098780490458 | 1.7060819864 |
| 43 | P02671 | Fibrinogen α
chain | 0.082413807511 | 1.61E-06 | 1.7060819864 |
| 44 | P04217 |
α-1B-glycoprotein | 0.40550848842 | 0.16042810678 | 1.7060819864 |
| 45 | P16070 | CD44 antigen | 0.67920362949 | 0.49087619781 | 1.7218689919 |
| 46 | P02790 | Hemopexin | 1.7378009558 | 0.30744469166 | 1.7378009558 |
| 47 | Q02817 | Mucin-2 | 5.3951058388 |
0.0025611699093 | 1.9054609537 |
| 48 | O00748 | Cocainee
sterase | 1.9230920076 | 0.1603616029 | 1.7538809776 |
| 49 | P04196 | Histidine-rich
glycoprotein | 0.46558609605 | 0.19744589925 | 1.8197009563 |
| 50 | P62937 | Peptidyl-prolyl
cis-trans isomerase A | 3.0478949547 |
0.00011998559785 | 1.9230920076 |
| 51 | P07585 | Decorin | 0.731139123 | 0.635718882 | 1.99843504 |
| 52 | Q16363 | Laminin subunit
α-4 | 0.71121352911 | 0.70577037334 | 1.9230920076 |
| 53 | P02751 | Fibronectin | 0.81658238173 | 0.24489469826 | 1.213389039 |
| 54 | P12109 | Collagen α-1(VI)
chain | 0.80167812109 | 0.50682651997 | 1.2359470129 |
| 55 | P23229 | Integrin α-6 | 0.80909591913 | 0.58197510242 | 1.4190570116 |
| Table IIIDifferentially expressed glycosylated
proteins in Tn+ compared with Tn− tissues |
Table III
Differentially expressed glycosylated
proteins in Tn+ compared with Tn− tissues
| Pt. no. | Unused | Accession | Name | Peptides (95%) | Differential
expression
|
|---|
|
Tn+:Tn− |
Tn−:normal |
Tn+:normal |
|---|
| 1 | 89.82 | P02768 | Seruma lbumin | 84 | 2.013724089 | 0.194088593 | 0.440554887 |
| 2 | 101.57 | P05787 | Keratin, type II
cytoskeletal 8 | 108 | 0.816582382 | 1.721868992 | 1.445440054 |
| 3 | 45.92 | P05783 | Keratin, type I
cytoskeletal 18 | 42 | 0.474242002 | 4.055085182 | 1.958845019 |
| 4 | 37.56 | Q01082 | Spectrin β chain,
brain1 | 26 | 1.367728949 | 0.691830993 | 0.963828981 |
| 5 | 40.35 | P02452 | Collage α-1(I)
chain | 34 | 0.55462569 | 1.066596031 | 0.586138189 |
| 6 | 23.09 | P02787 |
Serotransferrin | 14 | 1.836537957 | 0.487528503 | 0.862978518 |
| 7 | 8.5 | P98160 | Basement
membrane-specific heparan sulfate proteoglycan core protein | 4 | 1.380383968 | 0.505824685 | 0.704693079 |
| 8 | 10.12 | P08238 | Heat shock protein
HSP90-β | 22 | 1.737800956 | 1.096477985 | 1.923092008 |
| 9 | 24.54 | P01876 | Ig α-1chain C
region | 22 | 1.644371986 | 0.4487454 | 0.724435985 |
| 10 | 6 | P05155 | Plasma protease C1
inhibitor | 3 | 0.636795521 | 1.853531957 | 1.224616051 |
| 11 | 22.08 | P10645 | Chromogranin-A | 14 | 2.679167986 | 0.1599558 | 0.420726597 |
| 12 | 10.04 | Q9BX66 | Sorbin and SH3
domain-containing protein 1 | 7 | 0.474242002 | 0.505824685 | 0.248885706 |
| 13 | 6 | P02750 | Leucine-rich
α-2-glycoprotein | 3 | 0.501187205 | 0.772680581 | 0.390840888 |
| 14 | 21.35 | P62807 | Histone H2B type
1-C/E/F/G/I | 32 | 0.487528503 | 0.90364939 | 0.432513803 |
| 15 | 6 | P16070 | CD44 antigen | 3 | 0.679203629 | 1.923092008 | 1.342764974 |
| 16 | 5.43 | P02790 | Hemopexin | 3 | 1.737800956 | 0.524807513 | 0.990831971 |
| 17 | 14.3 | Q02817 | Mucin-2 | 8 | 5.395105839 | 0.313328594 | 1.614359021 |
| 18 | 37.01 | P02751 | Fibronectin | 21 | 0.816582382 | 0.963828981 | 0.787045777 |
| 19 | 2.99 | P07585 | Decorin | 2 | 0.731139123 | 0.325087309 | 0.260615289 |
Sixty-five proteins were differentially expressed in
CRC Tn− tissue compared with NC, while 74 proteins were
significantly altered in CRC Tn+ compared with NC. Forty
proteins displayed differential expression between CRC
Tn− and CRC Tn+, and 25 of these proteins
were simultaneously significantly differentially expressed in CRC
Tn− and Tn+ tissues compared with NC
(Fig. 1).
Among the significantly differentially expressed
proteins, there were a few glycosylated proteins, especially
O-glycosylated proteins. Fifty-five glycosylated proteins
exhibited differential expression between CRC Tn+ and
CRC Tn−, including 19 O-glycosylated proteins
(Tables II and III). Among the differentially expressed
O-glycosylated proteins, 12 were significantly
differentially regulated in groups, including Keratin 8 (gene:
KRT8), Keratin 18 (gene: KRT18), Decorin (gene: DCN), Sorbin and
SH3 domain-containing protein 1 (SORBS1), and CD44 antigen (gene:
CD44) (Tables II and III).
Differential expression of Decorin and
SORBS1 in CRC tissues or cell lines with different expression
levels of the Tn antigen
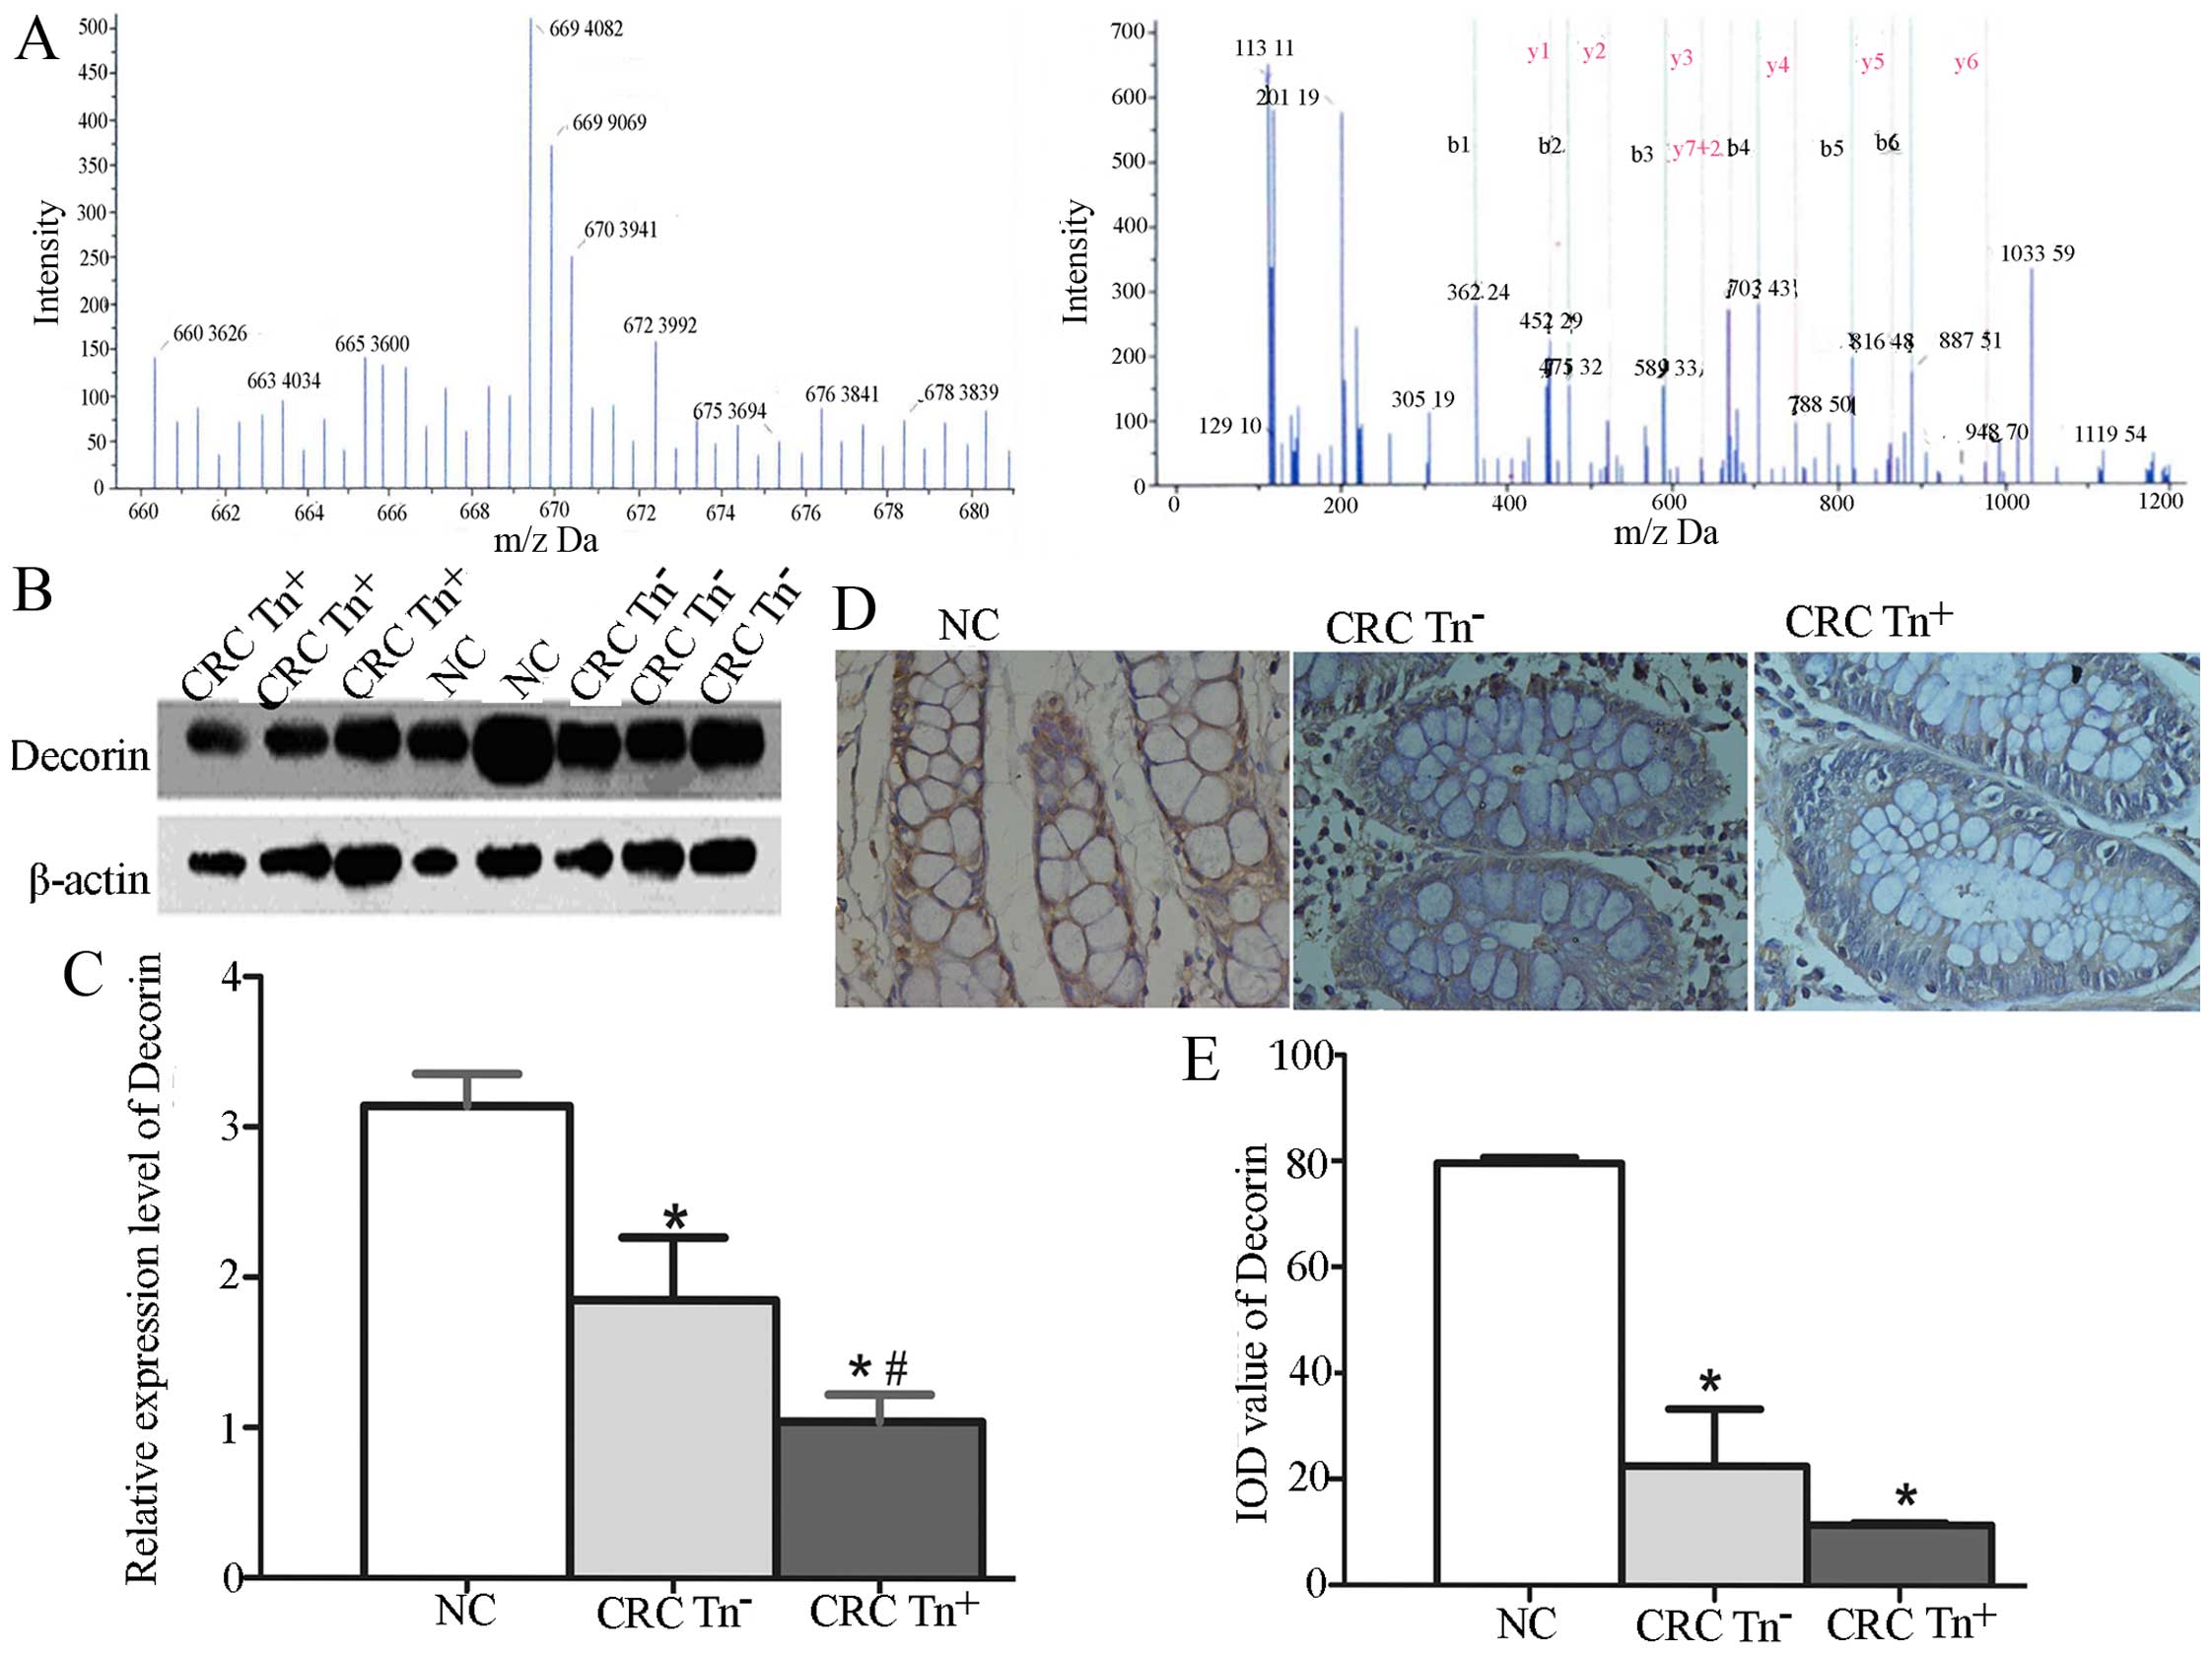
We investigated whether the expression of Decorin
and SORBS1 is related to the Tn antigen expression level in CRC
tissues. The relative quantification of Decorin using iTRAQ showed
that Decorin was more highly expressed in normal tissues than in
CRC tissues, especially Tn+ tissues (Fig. 2A), as in the results for SORBS1
using iTRAQ. To verify the function of Decorin and SORBS1 in
carcinogenesis, we used western blotting and IHC to quantify their
expression in NC, CRC Tn− and CRC Tn+
tissues. As shown in Fig. 2B–E,
Decorin expression was significantly decreased in the CRC
Tn+ tissues compared with the CRC Tn− and NC
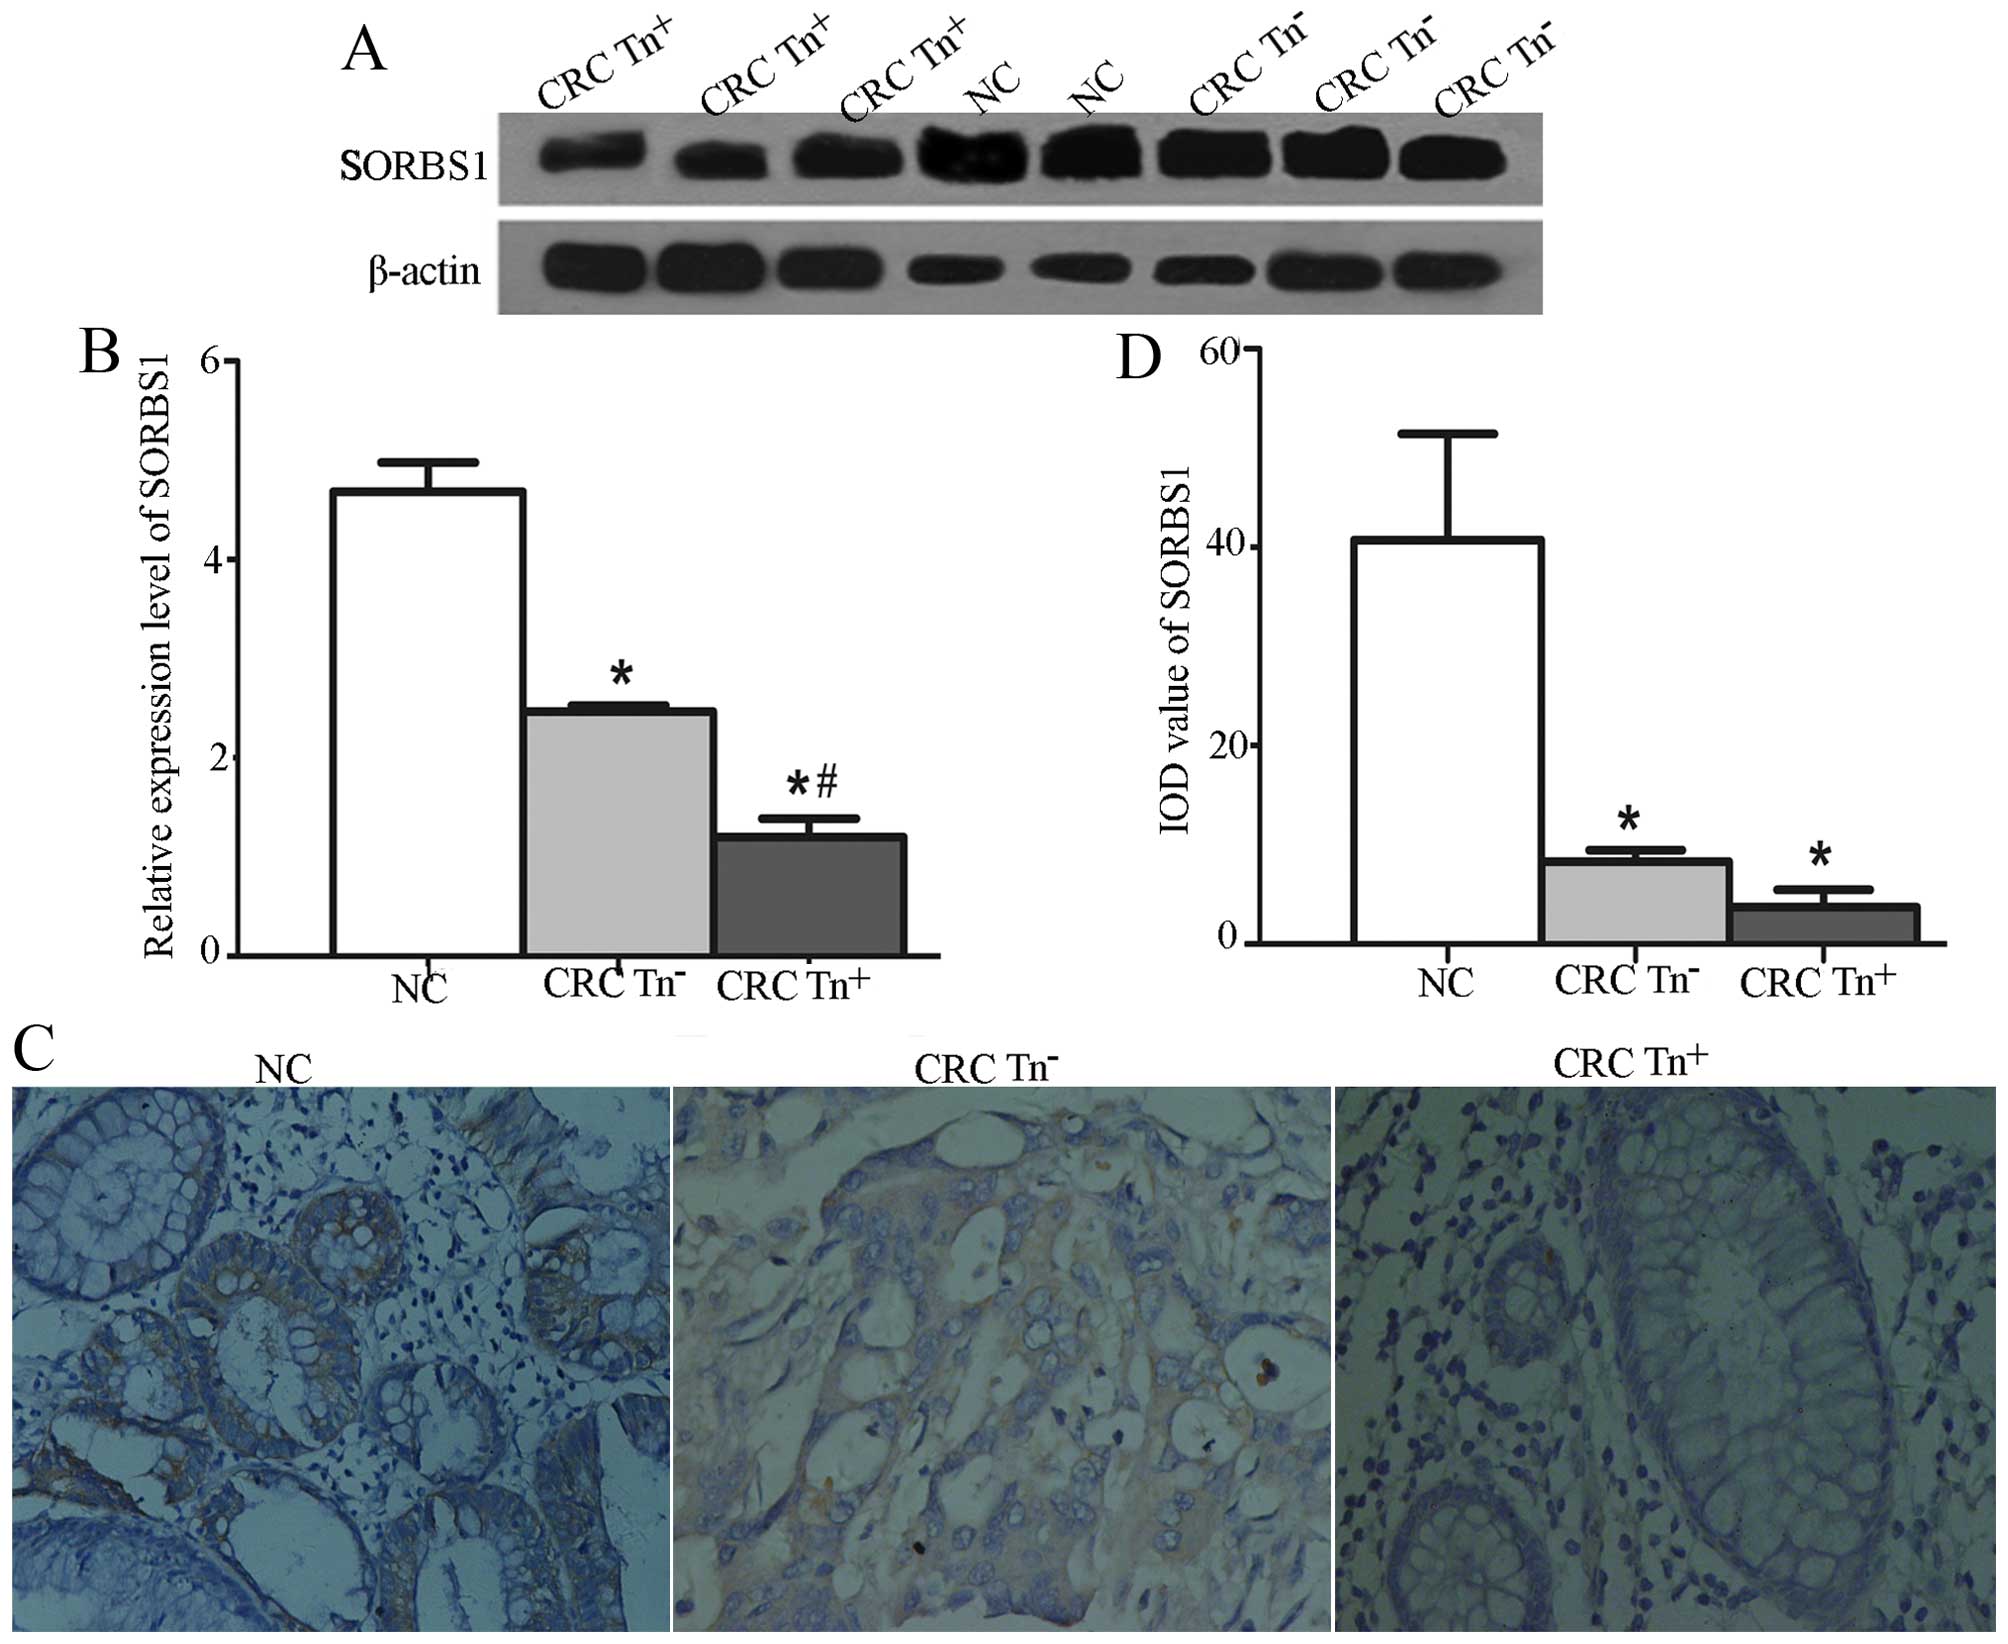
tissues (P<0.05). A significant difference was also found in the
expression of SORBS1 among Tn+, Tn− and NC
tissues, as shown in Fig. 3.
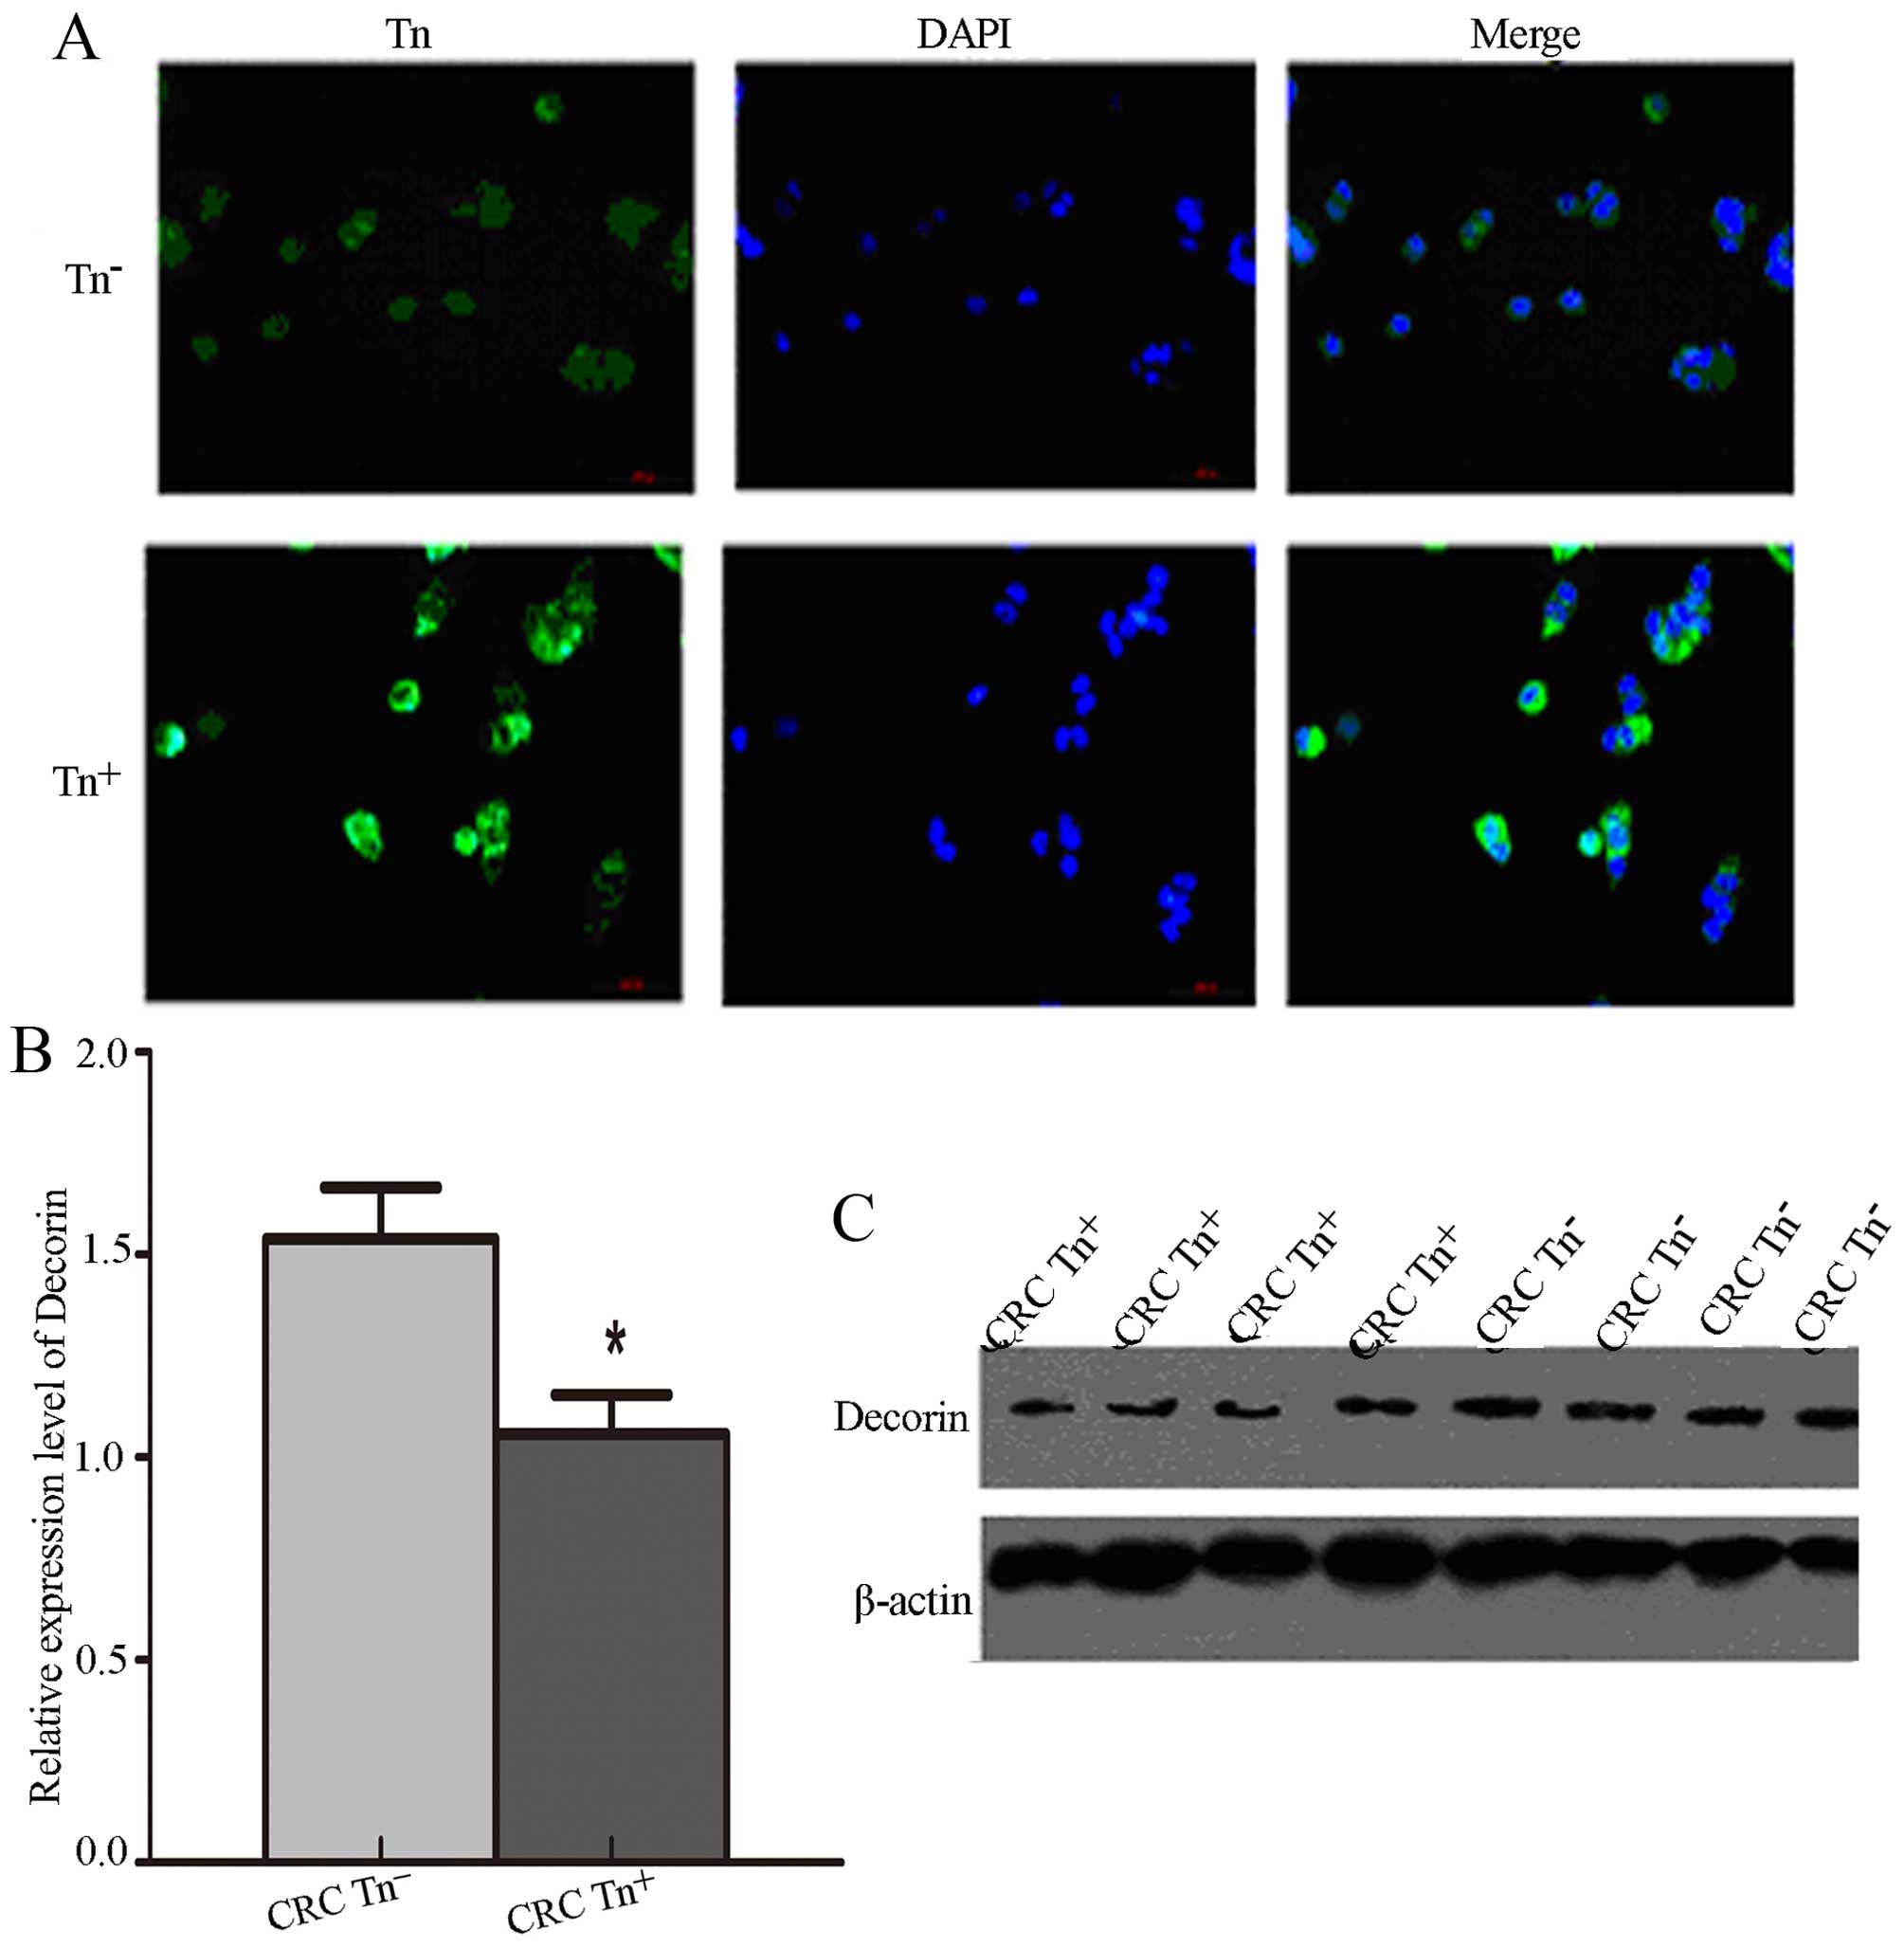
To verify the Tn antigen expression levels in
Tn+ cells, we demonstrated that Tn antigen was
significantly increased in Tn+ cells compared with
Tn− cells via immunofluorescence assay (Fig. 4A). We also detected the expression
levels of Decorin and SORBS1 in the LS174T cells with different Tn
expression levels and found that the expression of Decorin was
significantly decreased in the Tn+ LS174T cells compared
with that noted in the Tn− cells (P<0.05) (Fig. 4B and C). Surprisingly, SORBS1 was
not detected in the LS174T cells.
Functional analysis of 12 differentially
expressed O-glycosylated proteins related to CRC
Functional analysis of the O-glycosylated
proteins showed that the proteins participated in metabolic
processes, in the regulation of biological processes, in the
formation of membrane proteins of cells and organelles, and in the
binding to other proteins (Table
IV). In the present study, we paid particular attention to the
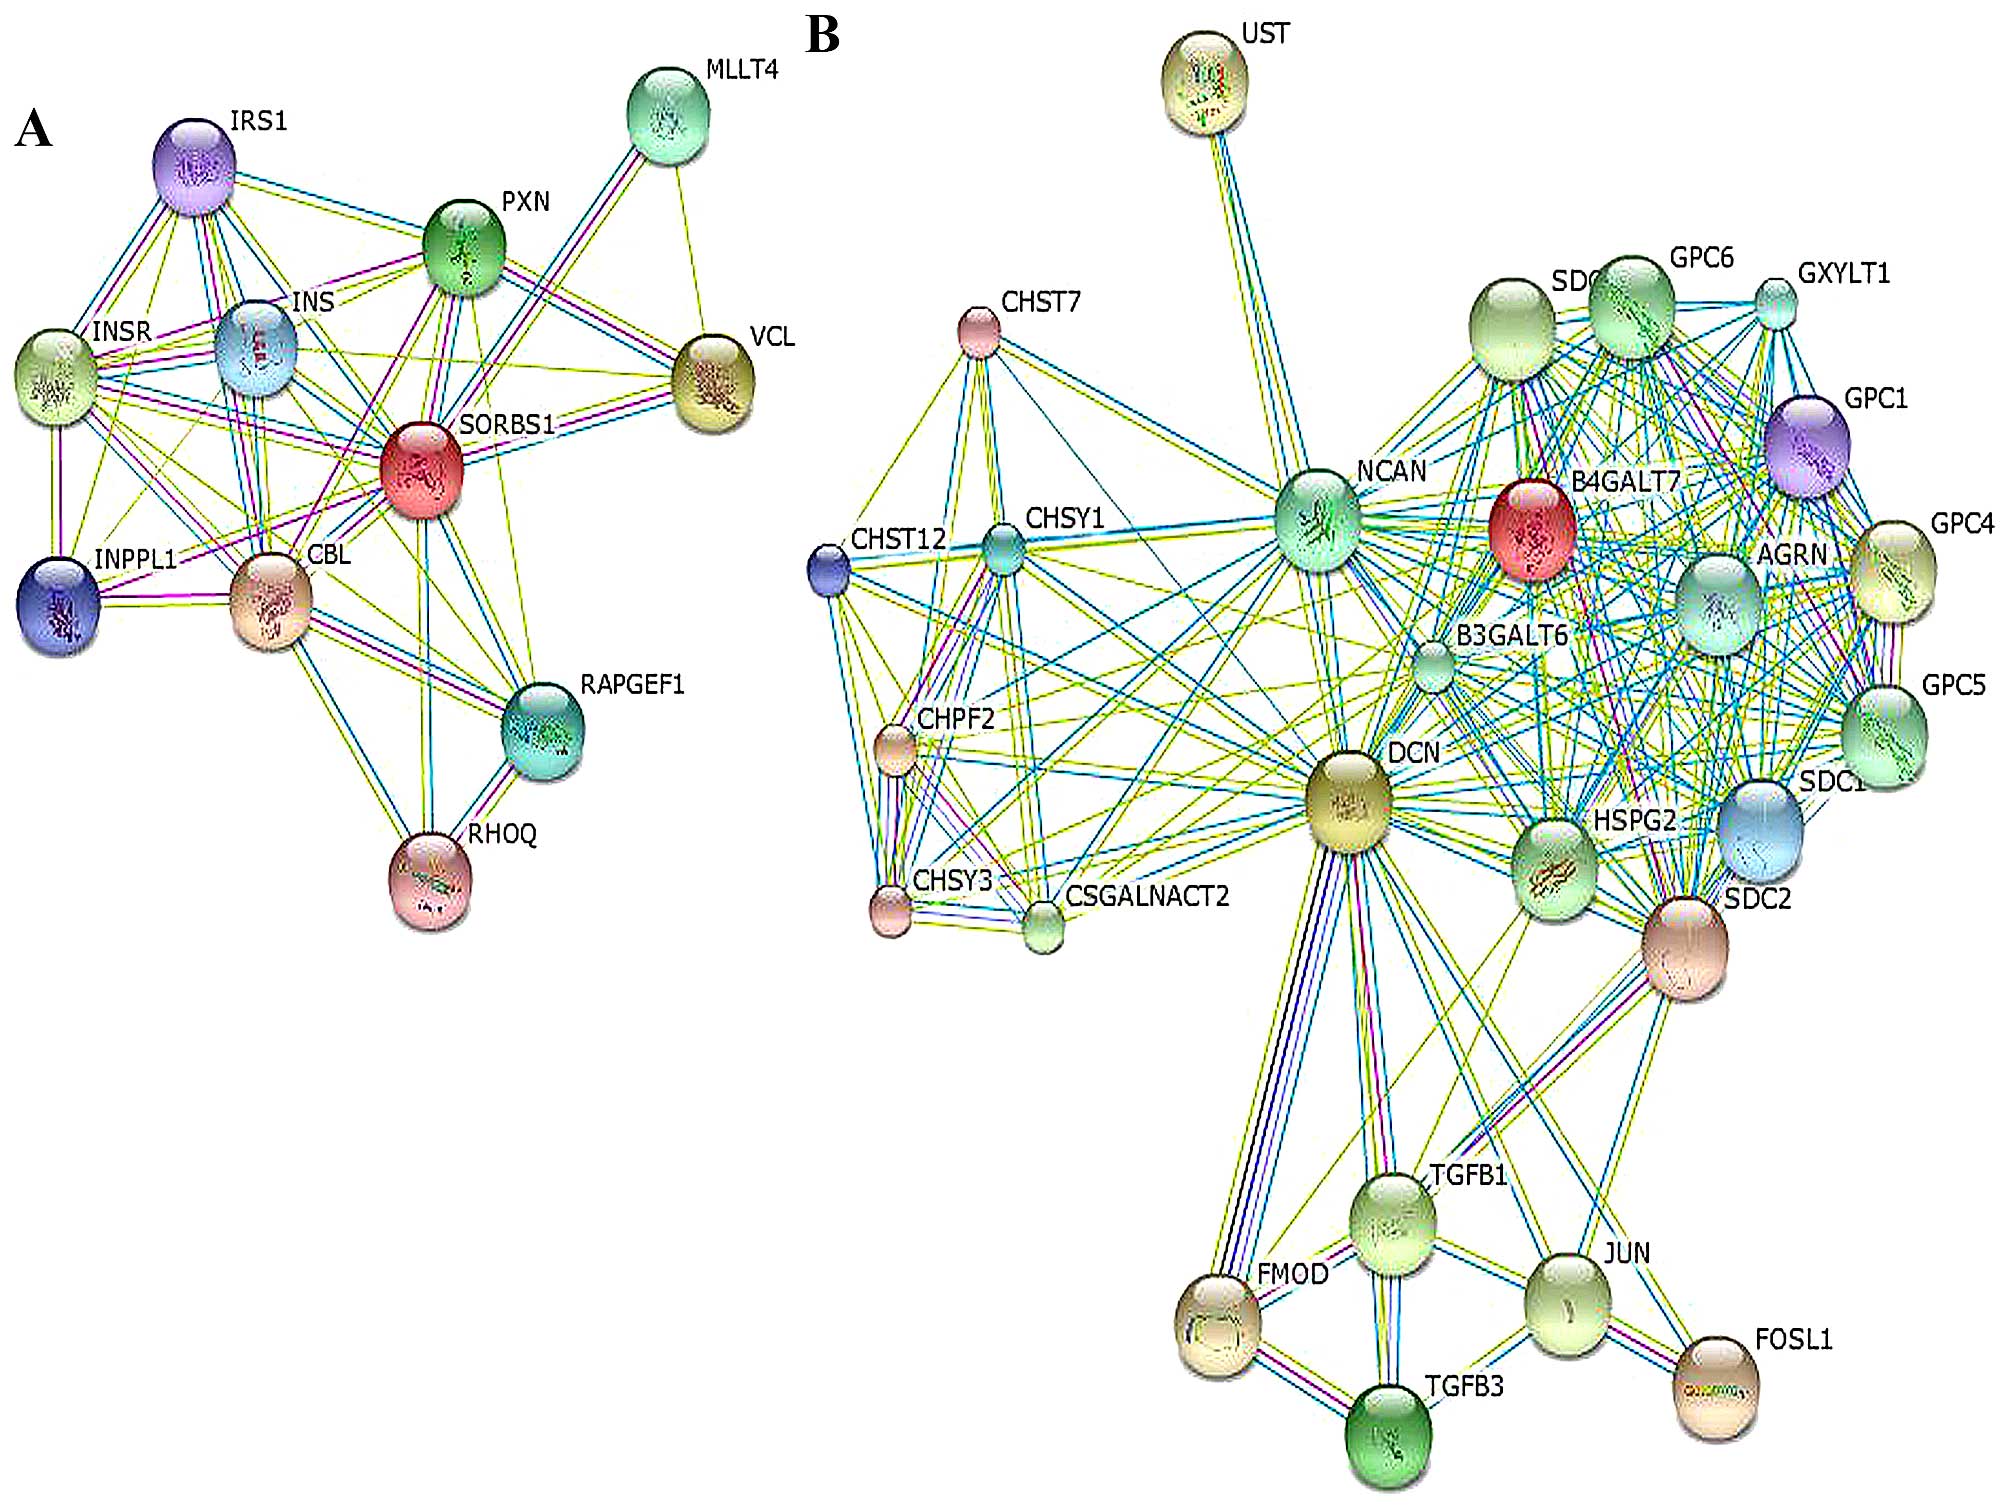
analysis of metabolic processes, especially for SORBS1 and Decorin.
SORBS1 was correlated with cell-cell adhesion via paxillin (PXN),
the PPAR signaling pathway and the insulin signaling pathway via
INS/IRS1. It could also interact with the Cbl proto-oncogene (CBL).
Decorin participated in the TGF-β pathway via TGFB1/3 and connected
with JUN, neurocan (NCAN), syndecan (SDC) and FOS-like protein-1
(FOSL1), as shown in the network in Fig. 5 and Table V.
| Table IVFunctional analysis of differentially
expressed O-glycosylated proteins. |
Table IV
Functional analysis of differentially
expressed O-glycosylated proteins.
| Functions | No. of genes | No. of
proteins | Proteins (%) |
|---|
| Metabolic
processes | 27 | 12 | 63.16 |
| Regulation of
biological processes | 41 | 10 | 52.63 |
| Cell parts | 63 | 11 | 57.89 |
| Organelles | 18 | 10 | 52.63 |
| Organelle
parts | 26 | 14 | 73.68 |
| Binding | 34 | 13 | 68.42 |
| Table VKEGG pathway analysis of
O-glycosylated proteins. |
Table V
KEGG pathway analysis of
O-glycosylated proteins.
| KEGG-controlled
vocabularies | KEGG no. | Gene | Protein |
|---|
| Focal adhesion | Hsa04510 | FN1 | Fibronectin |
| Regulation of actin
cytoskeleton | Hsa04810 | FN1 | Fibronectin |
| ECG-receptor
interaction | Hsa04512 | FN1 | Fibronectin |
| Small cell lung
cancer | Hsa05222 | FN1 | Fibronectin |
| Bacteria invasion
of epithelial cells | Hsa05100 | FN1 | Fibronectin |
| Amoebiasis | Hsa05146 | FN1 | Fibronectin |
| Pathways in
cancer | Hsa05200 | FN1 | Fibronectin |
| | HSP90AB1 | Heat shock protein
HSP90-β |
| Prostate
cancer | Hsa05215 | HSP90AB1 | Heat shock protein
HSP90-β |
| Antigen processing
and presentation | Hsa04612 | HSP90AB1 | Heat shock protein
HSP90-β |
| NOD-like receptor
signaling pathway | Hsa04621 | HSP90AB1 | Heat shock protein
HSP90-β |
| Protein processing
in endoplasmic reticulum | Hsa04141 | HSP90AB1 | Heat shock protein
HSP90-β |
|
Progesterone-mediated oocyte
maturation | Hsa04914 | HSP90AB1 | Heat shock protein
HSP90-β |
| Adherens
junction | Hsa04520 | SORBS1 | SORBS1 |
| Insulin signaling
pathway | Hsa04910 | SORBS1 | SORBS1 |
| PPAR signaling
pathway | Hsa03320 | SORBS1 | SORBS1 |
| TGF-β signaling
pathway | Hsa04350 | DCN | Decorin |
Correlation of Decorin and SORBS1
expression in CRC with clinicopathological factors
To ascertain whether the expression of Decorin and
SORBS1 was related to neoplasm staging, we compared the expression
of Decorin and SORBS1 with TNM stages. Decorin and SORBS1 were not
significantly increased in TNM stage 0-II compared with stage III
(Table VI, P>0.05). However, a
significant correlation was found between the expression of the two
proteins and the tumor differentiation stages. Decorin and SORBS1
were significantly increased in moderately differentiated tissues
compared with poorly differentiated tissues (Table VI, P<0.05).
| Table VIExpression of Decorin/SORBS1 in
different TNM stages and differentiation statuses (mean ± SD). |
Table VI
Expression of Decorin/SORBS1 in
different TNM stages and differentiation statuses (mean ± SD).
| Tumor features | Samples | Decorin | SORBS1 |
|---|
| TNM 0-IIa | 5 | 1.58±0.05 | 2.02±0.77 |
| TNM III | 4 | 1.05±0.45 | 1.38±0.53 |
| Moderately
differentiatedb | 6 | 1.69±0.29 | 2.23±0.41 |
| Poorly
differentiated | 3 | 0.87±0.20 | 1.07±0.09 |
Discussion
Since the Tn antigen participates in the development
of CRC (24,28,29),
we investigated specific Tn antigen-related biomarkers as novel
indicators for diagnostic or therapeutic targets. We analyzed the
differentially expressed proteins between CRC Tn+ and
CRC Tn− tissues with the iTRAQ-based proteome technique.
In the present study, 25 proteins were significantly expressed only
in the CRC groups compared with the NC tissues, indicating that
these proteins may participate in the development of CRC. The
expression of 10 proteins was differently regulated in CRC
Tn− tissues compared with CRC Tn+ tissues but
not in NC tissues. Considering that the Tn antigen was expressed
mainly in moderately differentiated and not poorly differentiated
tumors, we investigated the potential effects of these 10 proteins
on the evaluation of the prognosis of carcinoma. Thirteen proteins
were significantly differentially regulated among three groups,
demonstrating the potential role of these 13 proteins in the
initiation and progression of CRC.
Given that the Tn antigen is related to the
disarrangement of O-glycosylation, we chose 12
differentially expressed O-glycosylated proteins for further
study. Among these O-glycoproteins, Keratin 8, Keratin 18,
Decorin, Sorbin, SORBS1 and CD44 antigen were reported to correlate
with the initiation and progression of CRC. As yet, few studies
have investigated the relationship between SORBS1, Decorin, the Tn
antigen and the development of CRC (30,31).
SORBS1 belongs to a growing family of proteins
containing a Sorbin homology (SoHo) domain and three SH3 domains in
the C-terminal region. It plays an important role in adhesion
between cells and the matrix via the SH3 domain (32,33). A
study showed that c-Abl kinase, the product of the c-abl
proto-oncogene, mediated the effects of cell adhesion on cell cycle
progression or gene expression (34). Another study found that c-Abl could
bind the SH3 domain of SORBS1 (30). Considering the abnormal adhesion
between cancer cells, we hypothesized that SORBS1 may play a role
in preventing CRC metastasis. Furthermore, SORBS1 together with
vinculin was found to inhibit cell migration (35). p53 promoted the expression of SORBS1
in EB-1 cells (36,37). As SORBS1 is dependent on p53,
mutations which correlate with cancer metastasis via the
downregulation of adhesion proteins, we deduced that SORBS1
reduction may participate in the development and progression of
carcinoma. In the present study, we found that SORBS1 expression
was significantly downregulated in the CRC Tn+ tissues
compared with levels in the CRC Tn− and the healthy
tissues, especially in poorly differentiated tissues. From the GO
network, it was observed that SORBS1 also is connected with the
proto-oncogene Cbl (38). According
to the functional analysis, SORBS1 participates in the PPAR-γ
pathway, which has been identified as a 'driver gene' in CRC
initiation and progression (39).
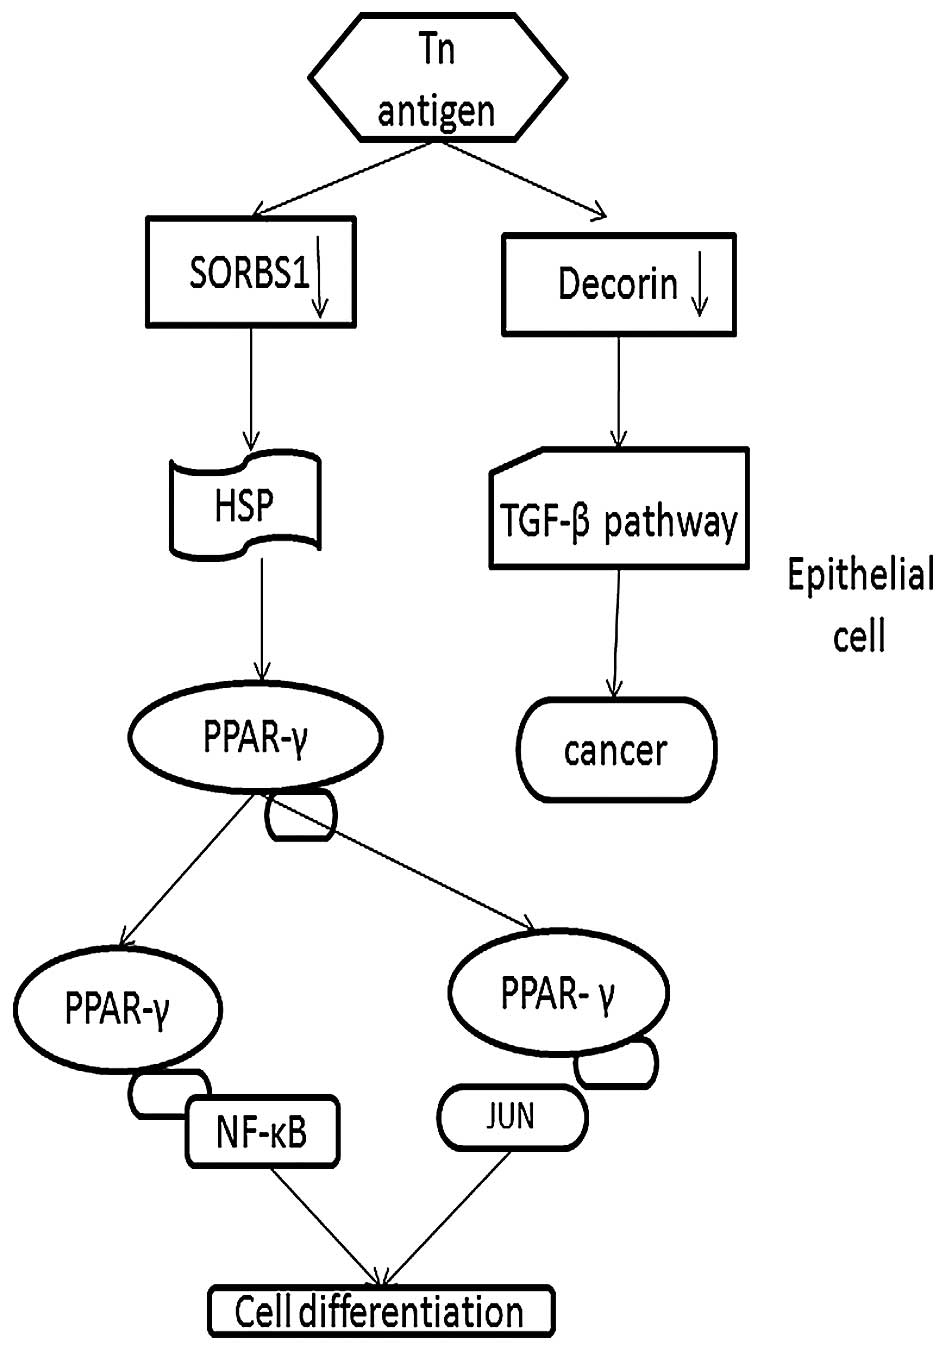
Thus, we demonstrated that downregulation of SORBS1 plays a
potential role in the development of CRC via the PPAR-γ pathway
(Fig. 6).
Moreover, Decorin controls the expression of p21,
affects the activation of EGFR, promotes the apoptosis of cancer
cells, and plays a key role in the immune response (40). Downregulation of Decorin is related
to poor prognosis in breast cancer, and a similar role was found in
lung cancer and lymphoma (27,41–43).
However, highly-expressed Decorin suppressed the development and
metastasis of breast cancer (43).
Few studies on the relationship between Decorin and CRC have been
established. Bi et al found that the Decorin expression
level was significantly reduced which may lead to tumorigenesis in
mice (40). Our results showed that
Decorin was decreased in the CRC Tn+ tissue compared
with this level in the CRC Tn− and the control tissues,
supporting the aforementioned conclusion. Furthermore, functional
analysis revealed that Decorin is involved in the TGF-β pathway,
which has been found to be associated with the onset and
progression of intestinal cancer (44–46).
In addition, Decorin is linked with JUN, NCAN, SDC1 and FOSL1. NCAN
is involved in the modulation of cell adhesion and migration
(47), and SDC1 functions as an
integral membrane protein and participates in cell proliferation,
cell migration and cell-matrix interactions via its receptor for
extracellular matrix proteins. Altered SDC1 expression has been
detected in several different tumor types (48–50).
The FOS gene family consists of four members: FOS, FOSB, FOSL1, and
FOSL2. These genes encode leucine zipper proteins that can dimerize
with proteins of the JUN family, thereby forming the transcription
factor complex AP-1 (51). As such,
the FOS proteins have been implicated as regulators of cell
proliferation, differentiation, and transformation (52,53).
Therefore, we conclude that downregulated Decorin could lead to the
development of cancer via the TGF-β pathway as our results
confirmed (Fig. 6).
To verify our hypothesis that abnormal
O-glycosylation may control the development of carcinoma via
influencing the expression of SORBS1 and Decorin, we also tested
their expression in vitro. The expression of Decorin was in
accordance with the results obtained from western blotting.
Notably, SORBS1 was not detected in the Tn+ colorectal
cells. As it is not a secretory protein, it is not possible that it
was excreted outside the cell. We speculated that the SORBS1
protein level might be too low to be detected in vitro.
Further studies with a larger number of samples are needed to
clarify the relationship between Decorin, SORBS1 and neoplasm
staging.
Abbreviations:
|
CRC
|
colorectal cancer
|
|
SORBS1
|
SH3 domain protein 1
|
|
iTRAQ
|
isobaric tags for relative and
absolute quantitation
|
Acknowledgments
We would like to thank Elsevier for their language
editing service. This study was supported by the National Natural
Science Foundation of China (nos. 81172299 and 81570504).
References
|
1
|
Kim EH and Misek DE: Glycoproteomics-based
identification of cancer biomarkers. Int J Proteomics.
2011:6019372011. View Article : Google Scholar : PubMed/NCBI
|
|
2
|
Chen W, Liu Q, Tan SY and Jiang YH:
Association between carcinoembryonic antigen, carbohydrate antigen
19–9 and body mass index in colorectal cancer patients. Mol Clin
Oncol. 1:879–886. 2013.
|
|
3
|
Yoon YS, Keum N, Zhang X, Cho E and
Giovannucci EL: Circulating levels of IGF-1, IGFBP-3, and
IGF-1/IGFBP-3 molar ratio and colorectal adenomas: A meta-analysis.
Cancer Epidemiol. 39:1026–1035. 2015. View Article : Google Scholar : PubMed/NCBI
|
|
4
|
Woo HD, Kim K and Kim J: Association
between preoperative C-reactive protein level and colorectal cancer
survival: A meta-analysis. Cancer Causes Control. 26:1661–1670.
2015. View Article : Google Scholar : PubMed/NCBI
|
|
5
|
Taniguchi N and Kizuka Y: Glycans and
cancer: Role of N-glycans in cancer biomarker, progression and
metastasis, and therapeutics. Adv Cancer Res. 126:11–51. 2015.
View Article : Google Scholar : PubMed/NCBI
|
|
6
|
Meany DL and Chan DW: Aberrant
glycosylation associated with enzymes as cancer biomarkers. Clin
Proteomics. 8:72011. View Article : Google Scholar : PubMed/NCBI
|
|
7
|
Brooks SA: The involvement of Helix
pomatia lectin (HPA) binding N-acetylgalactosamine glycans in
cancer progression. Histol Histopathol. 15:143–158. 2000.PubMed/NCBI
|
|
8
|
Hollingsworth MA and Swanson BJ: Mucins in
cancer: Protection and control of the cell surface. Nat Rev Cancer.
4:45–60. 2004. View
Article : Google Scholar
|
|
9
|
Haugstad KE, Gerken TA, Stokke BT, Dam TK,
Brewer CF and Sletmoen M: Enhanced self-association of mucins
possessing the T and Tn carbohydrate cancer antigens at the
single-molecule level. Biomacromolecules. 13:1400–1409. 2012.
View Article : Google Scholar : PubMed/NCBI
|
|
10
|
Conze T, Carvalho AS, Landegren U, Almeida
R, Reis CA, David L and Söderberg O: MUC2 mucin is a major carrier
of the cancer-associated sialyl-Tn antigen in intestinal metaplasia
and gastric carcinomas. Glycobiology. 20:199–206. 2010. View Article : Google Scholar
|
|
11
|
Haugstad KE, Stokke BT, Brewer CF, Gerken
TA and Sletmoen M: Single molecule study of heterotypic
interactions between mucins possessing the Tn cancer antigen.
Glycobiology. 25:524–534. 2015. View Article : Google Scholar :
|
|
12
|
Julien S, Videira PA and Delannoy P:
Sialyl-tn in cancer: (how) did we miss the target? Biomolecules.
2:435–466. 2012. View Article : Google Scholar : PubMed/NCBI
|
|
13
|
Sousa BL, Silva Filho JC, Kumar P, Pereira
RI, Łyskowski A, Rocha BA, Delatorre P, Bezerra GA, Nagano CS,
Gruber K, et al: High-resolution structure of a new Tn
antigen-binding lectin from Vatairea macrocarpa and a comparative
analysis of Tn-binding legume lectins. Int J Biochem Cell Biol.
59:103–110. 2015. View Article : Google Scholar
|
|
14
|
Mazal D, Lo-Man R, Bay S, Pritsch O,
Dériaud E, Ganneau C, Medeiros A, Ubillos L, Obal G, Berois N, et
al: Monoclonal antibodies toward different Tn-amino acid backbones
display distinct recognition patterns on human cancer cells.
Implications for effective immuno-targeting of cancer. Cancer
Immunol Immunother. 62:1107–1122. 2013. View Article : Google Scholar : PubMed/NCBI
|
|
15
|
Barrow H, Tam B, Duckworth CA, Rhodes JM
and Yu LG: Suppression of core 1 Gal-transferase is associated with
reduction of TF and reciprocal increase of Tn, sialyl-Tn and Core 3
glycans in human colon cancer cells. PLoS One. 8:e597922013.
View Article : Google Scholar : PubMed/NCBI
|
|
16
|
Holmberg LA, Oparin DV, Gooley T, Lilleby
K, Bensinger W, Reddish MA, MacLean GD, Longenecker BM and
Sandmaier BM: Clinical outcome of breast and ovarian cancer
patients treated with high-dose chemotherapy, autologous stem cell
rescue and THERATOPE STn-KLH cancer vaccine. Bone Marrow
Transplant. 25:1233–1241. 2000. View Article : Google Scholar : PubMed/NCBI
|
|
17
|
Matsumoto Y, Zhang Q, Akita K, Nakada H,
Hamamura K, Tsuchida A, Okajima T and Furukawa K, Urano T and
Furukawa K: Trimeric Tn antigen on syndecan 1 produced by
ppGalNAc-T13 enhances cancer metastasis via a complex formation
with integrin α5β1 and matrix metalloproteinase 9. J Biol Chem.
288:24264–24276. 2013. View Article : Google Scholar : PubMed/NCBI
|
|
18
|
Song K, Herzog BH, Fu J, Sheng M,
Bergstrom K, McDaniel JM, Kondo Y, McGee S, Cai X, Li P, et al:
Loss of core 1-derived O-glycans decreases breast cancer
development in mice. J Biol Chem. 290:20159–20166. 2015. View Article : Google Scholar : PubMed/NCBI
|
|
19
|
Hofmann BT, Schlüter L, Lange P,
Mercanoglu B, Ewald F, Fölster A, Picksak AS, Harder S, El Gammal
AT, Grupp K, et al: COSMC knockdown mediated aberrant
O-glycosylation promotes oncogenic properties in pancreatic cancer.
Mol Cancer. 14:1092015. View Article : Google Scholar : PubMed/NCBI
|
|
20
|
Loureiro LR, Carrascal MA, Barbas A,
Ramalho JS, Novo C, Delannoy P and Videira PA: Challenges in
antibody development against Tn and sialyl-Tn antigens.
Biomolecules. 5:1783–1809. 2015. View Article : Google Scholar : PubMed/NCBI
|
|
21
|
Tavares C, de Oliveira JT, Lopes C,
Carvalheira J, Matos AJ, Rutteman G, Reis CA and Gärtner F: Mucin 6
and Tn antigen expression in canine mammary tumours: Correlation
with pathological features. J Comp Pathol. 147:410–418. 2012.
View Article : Google Scholar : PubMed/NCBI
|
|
22
|
Lescar J, Sanchez JF, Audfray A, Coll JL,
Breton C, Mitchell EP and Imberty A: Structural basis for
recognition of breast and colon cancer epitopes Tn antigen and
Forssman disaccharide by Helix pomatia lectin. Glycobiology.
17:1077–1083. 2007. View Article : Google Scholar : PubMed/NCBI
|
|
23
|
Zamri N, Masuda N, Oura F, Yajima Y,
Nakada H and Fujita-Yamaguchi Y: Effects of two monoclonal
antibodies, MLS128 against Tn-antigen and 1H7 against insulin-like
growth factor-I receptor, on the growth of colon cancer cells.
Biosci Trends. 6:303–312. 2012.
|
|
24
|
Ju T, Aryal RP, Kudelka MR, Wang Y and
Cummings RD: The Cosmc connection to the Tn antigen in cancer.
Cancer biomarkers: Section. Dis Markers. 14:63–81. 2014.
|
|
25
|
Takamiya R, Ohtsubo K, Takamatsu S,
Taniguchi N and Angata T: The interaction between Siglec-15 and
tumor-associated sialyl-Tn antigen enhances TGF-β secretion from
monocytes/macrophages through the DAP12-Syk pathway. Glycobiology.
23:178–187. 2013. View Article : Google Scholar
|
|
26
|
Berriel E, Hill M, Barcia JJ, Ubillos L,
Gonzalez M, Detjen G, Rondan M, Navarrete H and Osinaga E: Simple
mucin-type cancer associated antigens are pre-cancerous biomarkers
during 1,2-dimethylhydrazine-induced rat colon carcinogenesis.
Oncol Rep. 14:219–227. 2005.PubMed/NCBI
|
|
27
|
Troup S, Njue C, Kliewer EV, Parisien M,
Roskelley C, Chakravarti S, Roughley PJ, Murphy LC and Watson PH:
Reduced expression of the small leucine-rich proteoglycans,
lumican, and decorin is associated with poor outcome in
node-negative invasive breast cancer. Clin Cancer Res. 9:207–214.
2003.PubMed/NCBI
|
|
28
|
Oura F, Yajima Y, Nakata M, Taniue K,
Akiyama T, Nakada H, Yamamoto K and Fujita-Yamaguchi Y:
Susceptibility to proteases of anti-Tn-antigen MLS128 binding
glycoproteins expressed in human colon cancer cells. Biosci Trends.
9:49–55. 2015. View Article : Google Scholar : PubMed/NCBI
|
|
29
|
Yu X, Du Z, Sun X, Shi C, Zhang H and Hu
T: Aberrant Cosmc genes result in Tn antigen expression in human
colorectal carcinoma cell line HT-29. Int J Clin Exp Pathol.
8:2590–2602. 2015.PubMed/NCBI
|
|
30
|
Lin WH, Huang CJ, Liu MW, Chang HM, Chen
YJ, Tai TY and Chuang LM: Cloning, mapping, and characterization of
the human sorbin and SH3 domain containing 1 (SORBS1) gene: A
protein associated with c-Abl during insulin signaling in the
hepatoma cell line Hep3B. Genomics. 74:12–20. 2001. View Article : Google Scholar : PubMed/NCBI
|
|
31
|
Farace C, Oliver JA, Melguizo C, Alvarez
P, Bandiera P, Rama AR, Malaguarnera G, Ortiz R, Madeddu R and
Prados J: Microenvironmental modulation of Decorin and Lumican in
temozolomide-resistant glioblastoma and neuroblastoma cancer
stem-like cells. PLoS One. 10:e01341112015. View Article : Google Scholar : PubMed/NCBI
|
|
32
|
Kioka N, Ueda K and Amachi T: Vinexin,
CAP/ponsin, ArgBP2: A novel adaptor protein family regulating
cytoskeletal organization and signal transduction. Cell Struct
Funct. 27:1–7. 2002. View Article : Google Scholar : PubMed/NCBI
|
|
33
|
Zhang M, Kimura A and Saltiel AR: Cloning
and characterization of Cbl-associated protein splicing isoforms.
Mol Med. 9:18–25. 2003.PubMed/NCBI
|
|
34
|
Lewis JM, Baskaran R, Taagepera S,
Schwartz MA and Wang JY: Integrin regulation of c-Abl tyrosine
kinase activity and cytoplasmic-nuclear transport. Proc Natl Acad
Sci USA. 93:15174–15179. 1996. View Article : Google Scholar : PubMed/NCBI
|
|
35
|
Zhang M, Liu J, Cheng A, Deyoung SM, Chen
X, Dold LH and Saltiel AR: CAP interacts with cytoskeletal proteins
and regulates adhesion-mediated ERK activation and motility. EMBO
J. 25:5284–5293. 2006. View Article : Google Scholar : PubMed/NCBI
|
|
36
|
Kostic C and Shaw PH: Isolation and
characterization of sixteen novel p53 response genes. Oncogene.
19:3978–3987. 2000. View Article : Google Scholar : PubMed/NCBI
|
|
37
|
Mandai K, Nakanishi H, Satoh A, Takahashi
K, Satoh K, Nishioka H, Mizoguchi A and Takai Y: Ponsin/SH3P12: An
l-afadin- and vinculin-binding protein localized at cell-cell and
cell-matrix adherens junctions. J Cell Biol. 144:1001–1017. 1999.
View Article : Google Scholar : PubMed/NCBI
|
|
38
|
Hyakuna N, Muramatsu H, Higa T, Chinen Y,
Wang X and Kojima S: Germline mutation of CBL is associated with
moyamoya disease in a child with juvenile myelomonocytic leukemia
and Noonan syndrome-like disorder. Pediatr Blood Cancer.
62:542–544. 2015. View Article : Google Scholar
|
|
39
|
Michalik L, Desvergne B and Wahli W:
Peroxisome-proliferator-activated receptors and cancers: Complex
stories. Nat Rev Cancer. 4:61–70. 2004. View Article : Google Scholar : PubMed/NCBI
|
|
40
|
Bi X, Pohl NM, Qian Z, Yang GR, Gou Y,
Guzman G, Kajdacsy-Balla A, Iozzo RV and Yang W: Decorin-mediated
inhibition of colorectal cancer growth and migration is associated
with E-cadherin in vitro and in mice. Carcinogenesis. 33:326–330.
2012. View Article : Google Scholar :
|
|
41
|
Campioni M, Ambrogi V, Pompeo E, Citro G,
Castelli M, Spugnini EP, Gatti A, Cardelli P, Lorenzon L, Baldi A,
et al: Identification of genes down-regulated during lung cancer
progression: A cDNA array study. J Exp Clin Cancer Res. 27:382008.
View Article : Google Scholar : PubMed/NCBI
|
|
42
|
Goldoni S, Seidler DG, Heath J, Fassan M,
Baffa R, Thakur ML, Owens RT, McQuillan DJ and Iozzo RV: An
antimetastatic role for decorin in breast cancer. Am J Pathol.
173:844–855. 2008. View Article : Google Scholar : PubMed/NCBI
|
|
43
|
Reed CC, Waterhouse A, Kirby S, Kay P,
Owens RT, McQuillan DJ and Iozzo RV: Decorin prevents metastatic
spreading of breast cancer. Oncogene. 24:1104–1110. 2005.
View Article : Google Scholar : PubMed/NCBI
|
|
44
|
Li J, Liang H, Bai M, Ning T, Wang C, Fan
Q, Wang Y, Fu Z, Wang N, Liu R, et al: miR-135b promotes cancer
progression by targeting transforming growth factor beta receptor
II (TGFBR2) in colorectal cancer. PLoS One. 10:e01301942015.
View Article : Google Scholar : PubMed/NCBI
|
|
45
|
Biswas S, Guix M, Rinehart C, Dugger TC,
Chytil A, Moses HL, Freeman ML and Arteaga CL: Inhibition of
TGF-beta with neutralizing antibodies prevents radiation-induced
acceleration of metastatic cancer progression. J Clin Invest.
117:1305–1313. 2007. View Article : Google Scholar : PubMed/NCBI
|
|
46
|
de Miranda NF, van Dinther M, van den
Akker BE, van Wezel T, ten Dijke P and Morreau H: Transforming
growth factor β signaling in colorectal cancer cells with
microsatellite instability despite biallelic mutations in TGFBR2.
Gastroenterology. 148:1427–1437. 2015. View Article : Google Scholar
|
|
47
|
Nischalke HD, Lutz P, Krämer B, Söhne J,
Müller T, Rosendahl J, Fischer J, Berg T, Hittatiya K, Fischer HP,
et al: A common polymorphism in the NCAN gene is associated with
hepatocellular carcinoma in alcoholic liver disease. J Hepatol.
61:1073–1079. 2014. View Article : Google Scholar : PubMed/NCBI
|
|
48
|
Kim SY, Choi EJ, Yun JA, Jung ES, Oh ST,
Kim JG, Kang WK and Lee SH: Syndecan-1 expression is associated
with tumor size and EGFR expression in colorectal carcinoma: A
clinicopathological study of 230 cases. Int J Med Sci. 12:92–99.
2015. View Article : Google Scholar : PubMed/NCBI
|
|
49
|
Zaragosi LE, Dadone B, Michiels JF, Marty
M, Pedeutour F, Dani C and Bianchini L: Syndecan-1 regulates
adipogenesis: New insights in dedifferentiated liposarcoma
tumorigenesis. Carcinogenesis. 36:32–40. 2015. View Article : Google Scholar
|
|
50
|
Mundt F, Heidari-Hamedani G, Nilsonne G,
Metintas M, Hjerpe A and Dobra K: Diagnostic and prognostic value
of soluble syndecan-1 in pleural malignancies. BioMed Res Int.
2014:4198532014. View Article : Google Scholar : PubMed/NCBI
|
|
51
|
Galvagni F, Orlandini M and Oliviero S:
Role of the AP-1 transcription factor FOSL1 in endothelial cells
adhesion and migration. Cell Adhes Migr. 7:408–411. 2013.
View Article : Google Scholar
|
|
52
|
Zhu W, Li J, Su J, Li J, Li J, Deng B, Shi
Q, Zhou Y and Chen X: FOS-like antigen 1 is highly expressed in
human psoriasis tissues and promotes the growth of HaCaT cells in
vitro. Mol Med Rep. 10:2489–2494. 2014.PubMed/NCBI
|
|
53
|
Liang X, Liu Y, Zeng L, Yu C, Hu Z, Zhou Q
and Yang Z: miR-101 inhibits the G1-to-S phase transition of
cervical cancer cells by targeting Fos. Int J Gynecol Cancer.
24:1165–1172. 2014. View Article : Google Scholar : PubMed/NCBI
|