Introduction
Chronic myeloid leukemia (CML) is a
myeloproliferative disorder characterized by the presence of the
Philadelphia (Ph) chromosome (1),
encoding a chimeric protein Bcr-Abl with constitutive tyrosine
kinase activity (2). Bcr-Abl kinase
activates multiple downstream signaling pathways essential for
survival and proliferation of CML cells (3,4).
Imatinib is the first tyrosine kinase inhibitor (TKI) drug approved
for CML therapy which blocks the ATP-binding site of Bcr-Abl and
inhibits its activity (5).
Unfortunately, not all patients with CML benefit from imatinib
treatment in CML therapy. Primary refractoriness to imatinib is
present in 13% of patients (6).
Secondary (acquired) resistance, where the TKI treatment during
therapy effectively selects drug-resistant clones, is a major
complication that leads to disease progression in 30–40% of
imatinib-treated patients (7). The
most frequent causes of acquired resistance to CML therapy are
point mutations in the kinase domain of Bcr-Abl, which prevent TKI
drugs from effectively binding to Bcr-Abl (8). Other Bcr-Abl dependent mechanisms of
resistance occur via amplification of the BCR-ABL gene and
overexpression of the protein (9,10).
Additional adaptive changes contributing to TKI resistance such as
substitutive activation of the Src family of kinases (11), or activation of alternate cell
signaling pathways such as PI3K/AKT/mTOR (12) have been documented.
Each causal change within a leukemic cell leading to
TKI resistance is consequently accompanied by other adaptive
molecular alterations resulting in a new drug-resistant cell
phenotype. Proteomic characterization of such molecular alterations
in resistant cancer cells enables identification of new molecular
targets with therapeutic potential (13,14)
and can be used for optimization of anticancer therapy (15). In order to identify the molecular
alterations contributing to and associated with imatinib resistance
in a model of CML, we performed proteomic analysis comparing
imatinib-sensitive CML cells (CML-T1) with derived
imatinib-resistant cells (CML-T1/IR). Among the most evident
changes in the CML-T1/IR cells was upregulation of a
multifunctional scaffolding protein Na+/H+
exchange regulatory factor 1 (NHERF1). Based on known NHERF1
functions, we evaluated the possible consequences of NHERF1
upregulation on the survival of the CML-T1/IR cells. We observed
disrupted calcium homeostasis and demonstrated selective toxic
effects of calcium transport and calcium signaling inhibitors in
the imatinib-resistant CML cells. The pronounced toxicity of
calcium homeostasis modulators emphasizes their therapeutic
potential in CML therapy.
Materials and methods
Establishment of imatinib-resistant
cells
CML-T1 cells (purchased from Leibniz Institut DSMZ,
German Collection of Microorganisms and Cell Culture GmbH,
Braunschweig, Germany) were grown in RPMI media in the presence of
10% fetal calf serum in a 37°C humidified atmosphere with 5%
CO2. Resistant CML-T1 subclones, CML-T1/IR, were derived
by prolonged cultivation in increasing concentrations of
imatinib.
Mutation analysis in the kinase domain of
BCR-ABL
Sanger sequencing was applied as previously
described (16). Briefly, RNA was
extracted from the CML-T1 and CML-T1/IR cells with TRIzol (Thermo
Fisher Scientific, Inc., Waltham, MA, USA) and the complementary
DNA was synthesized by M-MLV reverse transcriptase (Promega,
Madison, WI, USA) using random hexamer primers (Jena Bioscience
GmbH, Jena, Germany). The cDNA region encoding the kinase domain of
the fused BCR-ABL was amplified using nested PCR. The resulting
914-bp amplicon was sequenced from both strands. Based on the
conclusive observation of mutated BCR-ABL transcripts, we explored
the analysis using next-generation deep sequencing (NGS) with
IRON-II BCR-ABL plates (IRON, International Robustness of
Next-Generation sequencing) on a 454 GS Junior system (Roche
Applied Science, Penzberg, Germany) to reveal the presence of
mutations below the detection limit of Sanger sequencing. The
protocol and algorithm previously established for NGS data
evaluation (17) were followed.
Sample preparation for 2-DE
CML-T1 and CML-T1/IR cells (1×10⁸) were
harvested by centrifugation, washed twice with PBS and homogenized
in a lysis buffer [7 M urea, 2 M thiourea, 4% CHAPS, 60 mM DTT and
1% ampholytes (IPG buffer pH 4.0–7.0; GE Healthcare Life Sciences,
Little Chalfont, UK)] containing a protease inhibitor cocktail
(Roche Diagnostics, Basel, Switzerland) for 20 min at room
temperature. The lysates were cleared by centrifugation at 15,000 ×
g for 20 min at room temperature. Next, the supernatants were
collected and the protein concentration was determined using the
Bradford method (Bio-Rad, Inc., Hercules, CA, USA). The protein
concentrations in all the samples were equalized to 7.3 mg/ml by
dilution with the lysis buffer.
2-DE
Isoelectric focusing was performed with a Bio-Rad
Protean IEF cell using 24 cm IPG strips (pH 4.0–7.0; GE Healthcare
Life Sciences). Six technical replicates were run for each
biological sample (6x CML-T1 and 6x CML-T1/IR). The strips were
rehydrated overnight, each in 450 μl of sample, representing
3.3 mg of protein. Isoelectric focusing was performed for 60 kVh,
with the maximum voltage not exceeding 5 kV, the current limited to
50 mA/strip and the temperature set to 18°C. The focused strips
were equilibrated and reduced in equilibration buffer A (6 M urea,
50 mM Tris pH 8.8, 30% glycerol, 2% SDS and 450 mg DTT/50 ml of the
buffer) for 15 min and then alkylated in equilibration buffer B (6
M urea, 50 mM Tris pH 8.8, 30% glycerol, 2% SDS and 1.125 mg
iodacetamide/50 ml). The equilibrated strips were then placed on
the top of 10% PAGE gel and secured in place by molten agarose.
Electrophoresis was performed in a Tris-glycine-SDS system using a
Protean Plus Dodeca Cell apparatus (Bio-Rad, Inc.) with buffer
circulation and external cooling (20°C). The twelve gels were run
at a constant voltage of 200 V for 6 h. Following electrophoresis,
the gels were washed three times for 15 min in deionized water to
remove the SDS. The washed gels were stained in CCB (SimplyBlue
SafeStain, Invitrogen Life Technologies, Carlsbad, CA, USA)
overnight, and then destained in deionized water.
Gel image analysis
The gels were scanned with a GS 800 calibrated
densitometer (Bio-Rad, Inc.). Image analysis was performed with
Phoretix 2D software (Nonlinear Dynamics, Newcastle upon Tyne, UK)
in semi-manual mode with six gel replicates for one biological
sample. Normalization of gel images was based on total spot
density, and integrated spot density values (spot volumes) were
then calculated after background subtraction. Average spot volume
values (averages from all the six gels in the group) for each spot
were compared between the groups. Protein spots were considered
differentially expressed if they met both of the following
criteria: i) the average difference of normalized spot volume was
<1.5-fold and ii) the statistical significance of the change
determined by the t-test was P<0.05.
MALDI MS, protein identification
The spots containing differentially expressed
proteins were excised from the gels, cut into small pieces and
washed three times with 25 mM ammonium bicarbonate in 50%
acetonitrile (ACN). The gels were then dried in a SpeedVac
Concentrator (Eppendorf, Hamburg, Germany). Sequencing grade
modified trypsin (6 ng/μl) (Promega) in 25 mM ammonium
bicarbonate in 5% ACN was added. Following overnight incubation at
37°C, the resulting peptides were extracted with 50% ACN. Peptide
samples were spotted on a steel target plate (Bruker Daltonics,
Bremen, Germany) and allowed to dry at room temperature. Matrix
solution (3 mg α-cyano-4-hydroxycinnamic acid in 1 ml of 50% ACN
containing 0.1% trifluoroacetic acid) was then added. MS was
performed on an Autoflex II MALDI-TOF/TOF mass spectrometer (Bruker
Daltonics) using a solid nitrogen laser (337 nm) and FlexControl
software in reflectron mode with positive ion mass spectra
detection. The mass spectrometer was externally calibrated with
Peptide Calibration Standard II (Bruker Daltonics). Spectra were
acquired in the mass range of 800–3,000 Da. The peak lists were
generated using FlexAnalysis and searched against Swiss-Prot (2014
version) using the Mascot software. The peptide mass tolerance was
set to 100 ppm, taxonomy Homo sapiens was selected, missed
cleavage was set to 1, fixed modification for cysteine
carbamidomethylation, and variable modifications for methionine
oxidation and protein N-terminal acetylation were further settings
selected. Proteins with a Mascot score over the threshold of 56 for
P<0.05 calculated using the aforementioned settings were
considered as identified.
Multidrug resistance (MDR) assay
The Vybrant™ Multidrug Resistance Assay
kit (Thermo Fisher Scientific, Inc.) was used to measure drug
efflux from the CML-T1 and the CML-T1/IR cells. The cells
(5×10⁴ cells/well) were grown in a 96-well plate for 24
h. Cells were then divided into two groups: the untreated group and
the group treated with MDR drug efflux inhibitors cyclosporine A
(CsA) and/or verapamil (at a final concentration ranging from 0.4
to 120 μg/ml). After 1 h, calcein AM was added to 100
μl of each examined cell suspension. After another 30 min,
the cells in the plate were washed twice with 200 μl of cold
RPMI-1640 culture medium, and the fluorescence of the retained
calcein in both groups of cells was measured at a wavelength of
λex = 485 nm and λem = 538 nm by FluoroMax-3
spectrofluorometer equipped with DataMax software (Jobin Yvon
Horriba, Kyoto, Japan).
Cytosolic pH measurement
The assay was conducted as described previously by
Kiedrowski (18). Cells were loaded
with 1 μM BCECF-AM for 20 min at room temperature. To
monitor the BCECF fluorescence, the cells were exposed every 5 sec
to 488 and 440 nm excitation and the images of fluorescence emitted
at >520 nm (F488 and F440) were measured by a FluoroMax-3
spectrofluorometer equipped with DataMax software (Jobin Yvon
Horriba) and saved for offline analysis. In selected experiments,
F488/F440 ratios were converted to cytosolic pH values based on
in situ calibration performed at the end of the experiments
as described in Kiedrowski (18).
Measurement of cytosolic
Ca2+
Measurements of calcium concentration in the cytosol
were performed as previously described (19). Briefly, the cells were washed in a
modified HBSS buffer (140 mM NaCl, 5 mM KCl, 2 mM CaCl2,
3 mM MgCl2, 10 mM HEPES, 50 mM glucose pH 7.4) and
loaded with 3 μM Fura-2 acetoxymethyl ester (Fura-2/AM) for
30 min at 25°C in the dark, rinsed, and allowed to rest for 30 min
prior to fluorescence measurements using a FluoroMax-3
spectrofluorometer equipped with DataMax software (Jobin Yvon
Horriba, France). The fluorescence intensity of Fura-2 (excitation
at 340 and 380 nm, and emission at 510 nm) was recorded every 15
sec, with an integration time of 3 sec. The concentration of free
intracellular Ca2+ was determined as proportional to the
ratio of fluorescence at 340/380 nm. The actual Ca2+
concentration was calculated with the Grynkiewicz equation
(20). The Kd for
Ca2+ binding to Fura-2 was measured to be 240 nM at the
experimental temperature.
Wnt target gene microarray
Total RNA was isolated and purified from the CML-T1
and the CML-T1/IR cells with TRIzol reagent (Thermo Fisher
Scientific, Inc.) and an RNeasy Mini kit (Qiagen, Hilden, Germany)
according to the manufacturer's instructions. The RNA quality and
quantity were determined at a 260/280 nm ratio on a Nanodrop
ND-1000 (Thermo Fisher Scientific, Inc.). cDNA was synthesized by
M-MLV reverse transcriptase (Promega) using random hexamer primers
(Jena Bioscience GmbH).
The expression levels of the 92 genes involved in
the Wnt signaling pathway within four control genes was analyzed on
a TaqMan® array human Wnt Pathway Fast 96-well plate
(Invitrogen Life Technologies) using a StepOnePlus™ Real-Time PCR
system (Applied Biosystems, Foster City, CA, USA). Analyses were
performed three times for both the CMLT1 and the CMLT1/IR cells.
The genes (n=27); genes for which the amplification signals were
not observed in one or more replicates simultaneously for the CMLT1
control and the CMLT1/IR, were excluded from the analysis. Relative
expression changes of target genes (n=65) were normalized to the
expression of the housekeeping gene GUSB that is validated
for routine molecular monitoring in CML cells (21). Relative expression levels of the
genes were evaluated using the 2−ΔΔCq formula according
to Livak et al (22) showing
differential gene expression in the CMLT1/IR cells. For data
control checking we re-analyzed differential relative expression
using the GAPDH control gene, providing highly similar
results as with GUSB.
BCR-ABL quantification was performed according to
the method standardized in the EUTOS for CML project of ELN
(www.eutos.org) and data were reported in the
International Scale (IS). Primers and probes for BCR-ABL and GUSB
were applied according to the European Partnership for Action
Against Cancer recommendations and commercial plasmid standards
were used to perform calibration curves (Ipsogen, Marseille,
France).
Preparation of nuclear and cytoplasmic
extracts
Cytoplasmic and nuclear extracts were prepared using
a Nuclear and Cytoplasmic Extraction kit (NE-PER; Thermo Fisher
Scientific, Inc.) according to the manufacturer's instructions with
an additional modification in the final step of the nuclear protein
extraction procedure, where the resulting pellets of the nuclear
proteins were washed three times in ice cold PBS supplied with a
protease inhibitor cocktail (Roche Diagnostics) and re-centrifuged
at 16,000 × g to remove cytoplasmic protein contaminations.
Western blotting
Cell pellets were solubilized in lysis buffer (50 mM
Tris pH 7.4; 1% Triton X-100, a protease inhibitor cocktail, 1
tablet/10 ml; Roche Diagnostics) on ice for 20 min. The cleared
cell lysates (15,000 × g, 20 min) were collected and the protein
concentration was determined by the Bradford method (Bio-Rad,
Inc.). The samples containing 60 μg of protein were combined
with an SDS loading buffer containing DTT, boiled for 5 min and
resolved with SDS-PAGE using Novex precast 4–20% gradient gels
(Thermo Fisher Scientific, Inc.). The separated proteins were
transferred to PVDF membranes using the iBlot system according to
manufacturer's instructions (Thermo Fisher Scientific, Inc.). The
membranes were then blocked overnight in SuperBlock (PBS) blocking
buffer (Thermo Fisher Scientific, Inc.). Then, the membranes were
incubated with primary antibodies diluted to 1:1,000 in PBS
containing 5% SuperBlock and 0.1% Tween-20. β-actin or Histone H2A
(#4970 and #12349) were used as the loading controls; anti-NFAT1
rabbit mAb (#5862), anti-NHERF1 (#8601) and anti-MRP2/ABCC2 rabbit
mAb (#12559; all from Cell Signaling Technology, Danvers, MA, USA)
diluted 1:1,000 were used to detect the expression of NHERF1, MRP2
and NFAT. After thorough washing in PBS containing 0.1% Tween-20, a
secondary anti-rabbit IgG, HRP-linked antibody (#7074; Cell
Signaling Technology) was added (1:10,000). The signal was detected
using enhanced chemiluminescence (ECL; GE Healthcare Life Sciences)
assay, on X-ray film (Kodak, Rochester, NY, USA), developed,
scanned and quantified by the Quantity One documentation system
(Bio-Rad, Inc.).
Cell viability assays
Cells (1×10⁴) were grown in a 24-well
plate in 1 ml RPMI-1640 media (Thermo Fisher Scientific, Inc.) with
increasing concentrations of the tested drugs for 3 days (72 h) at
37°C and a 5% CO2 humidified atmosphere. The toxicity of
imatinib, amyloride, DCB, thapsigargin, ionomycin, verapamil,
carboxyamidotriazole (CAI), FK-506 and CsA was measured using a
Vybrant® MTT Cell Proliferation Assay kit (Thermo Fisher
Scientific, Inc.) according to the manufacturer's protocol.
Absorbance was detected at 570 nm using a microplate reader
(Chameleon; Hidex, Turku, Finland).
Results
Development of imatinib-resistant
CML-T1/IR subclones
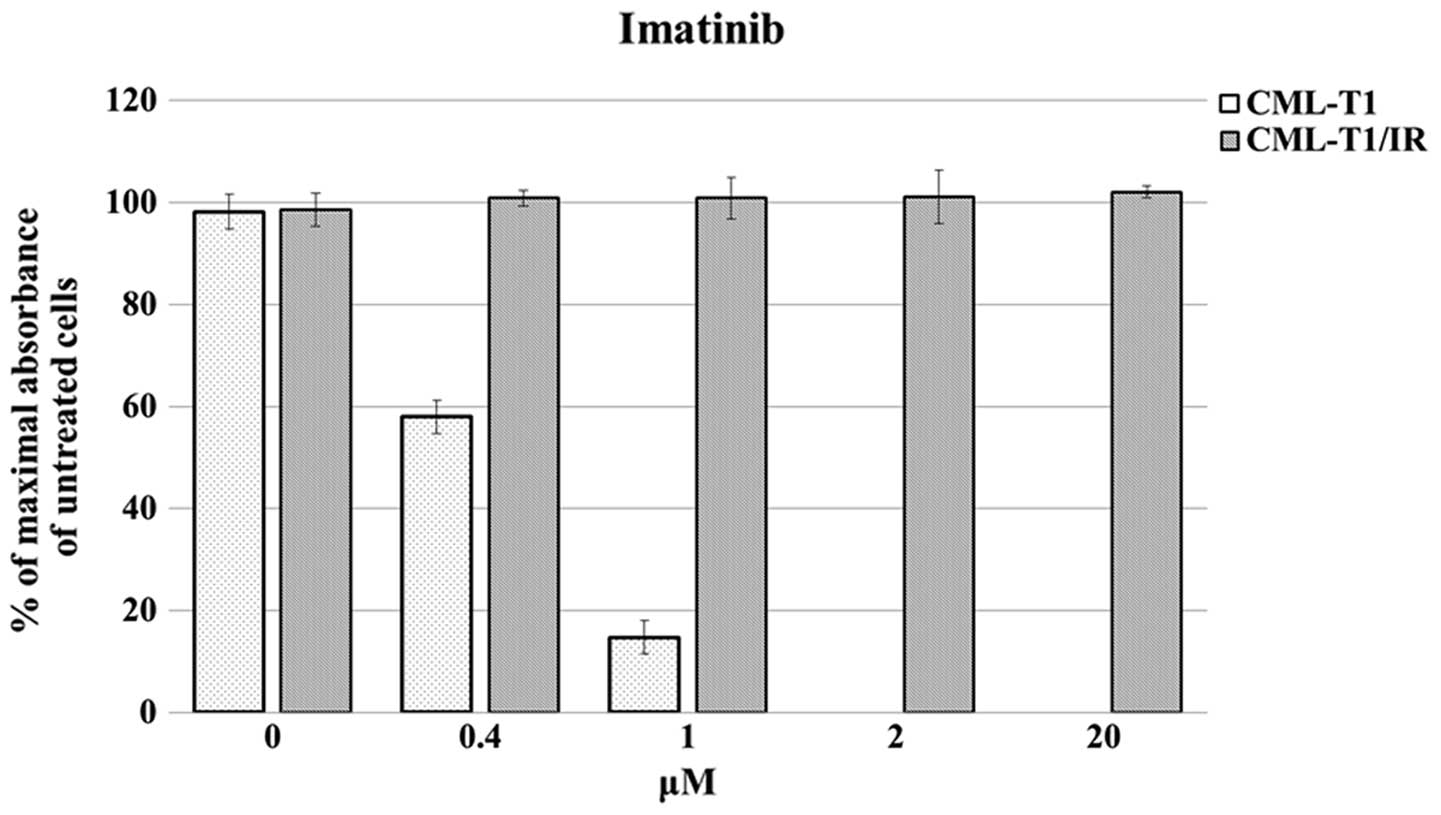
We derived imatinib-resistant cells from an
established model of the CML cell line CML-T1 (23). The CML-T1 cells express T-cell
surface markers and carry the landmark BCR-ABL1 breakpoint cluster
region translocation resulting in production of the p210 Bcr-Abl
fusion protein (24). CML-T1 cells
are sensitive to imatinib (IC50 0.45±0.015 μM,
Fig. 1). The imatinib-resistant
CML-T1/IR cells were derived by prolonged cultivation of CML-T1 in
increasing concentrations of imatinib. The CML-T1/IR cells
tolerated at least a 50-fold higher concentration of imatinib
(Fig. 1).
Mutation analysis reveals an
imatinib-resistant Y253H mutation in the CML-T1/IR cells
The typical cause of resistance of CML cells to
imatinib and other TKI inhibitors is a point mutation in the Abl
kinase domain of the BCR-ABL fusion protein (25). We therefore performed mutational
analysis of BCR-ABL in the CML-T1 and CML-T1/IR cells. We detected
a Y253H mutation in the CML-T1/IR cells (69% of BCR-ABL
transcripts), which is known to be a frequent causal mutation
responsible for resistance to imatinib in human patients (26).
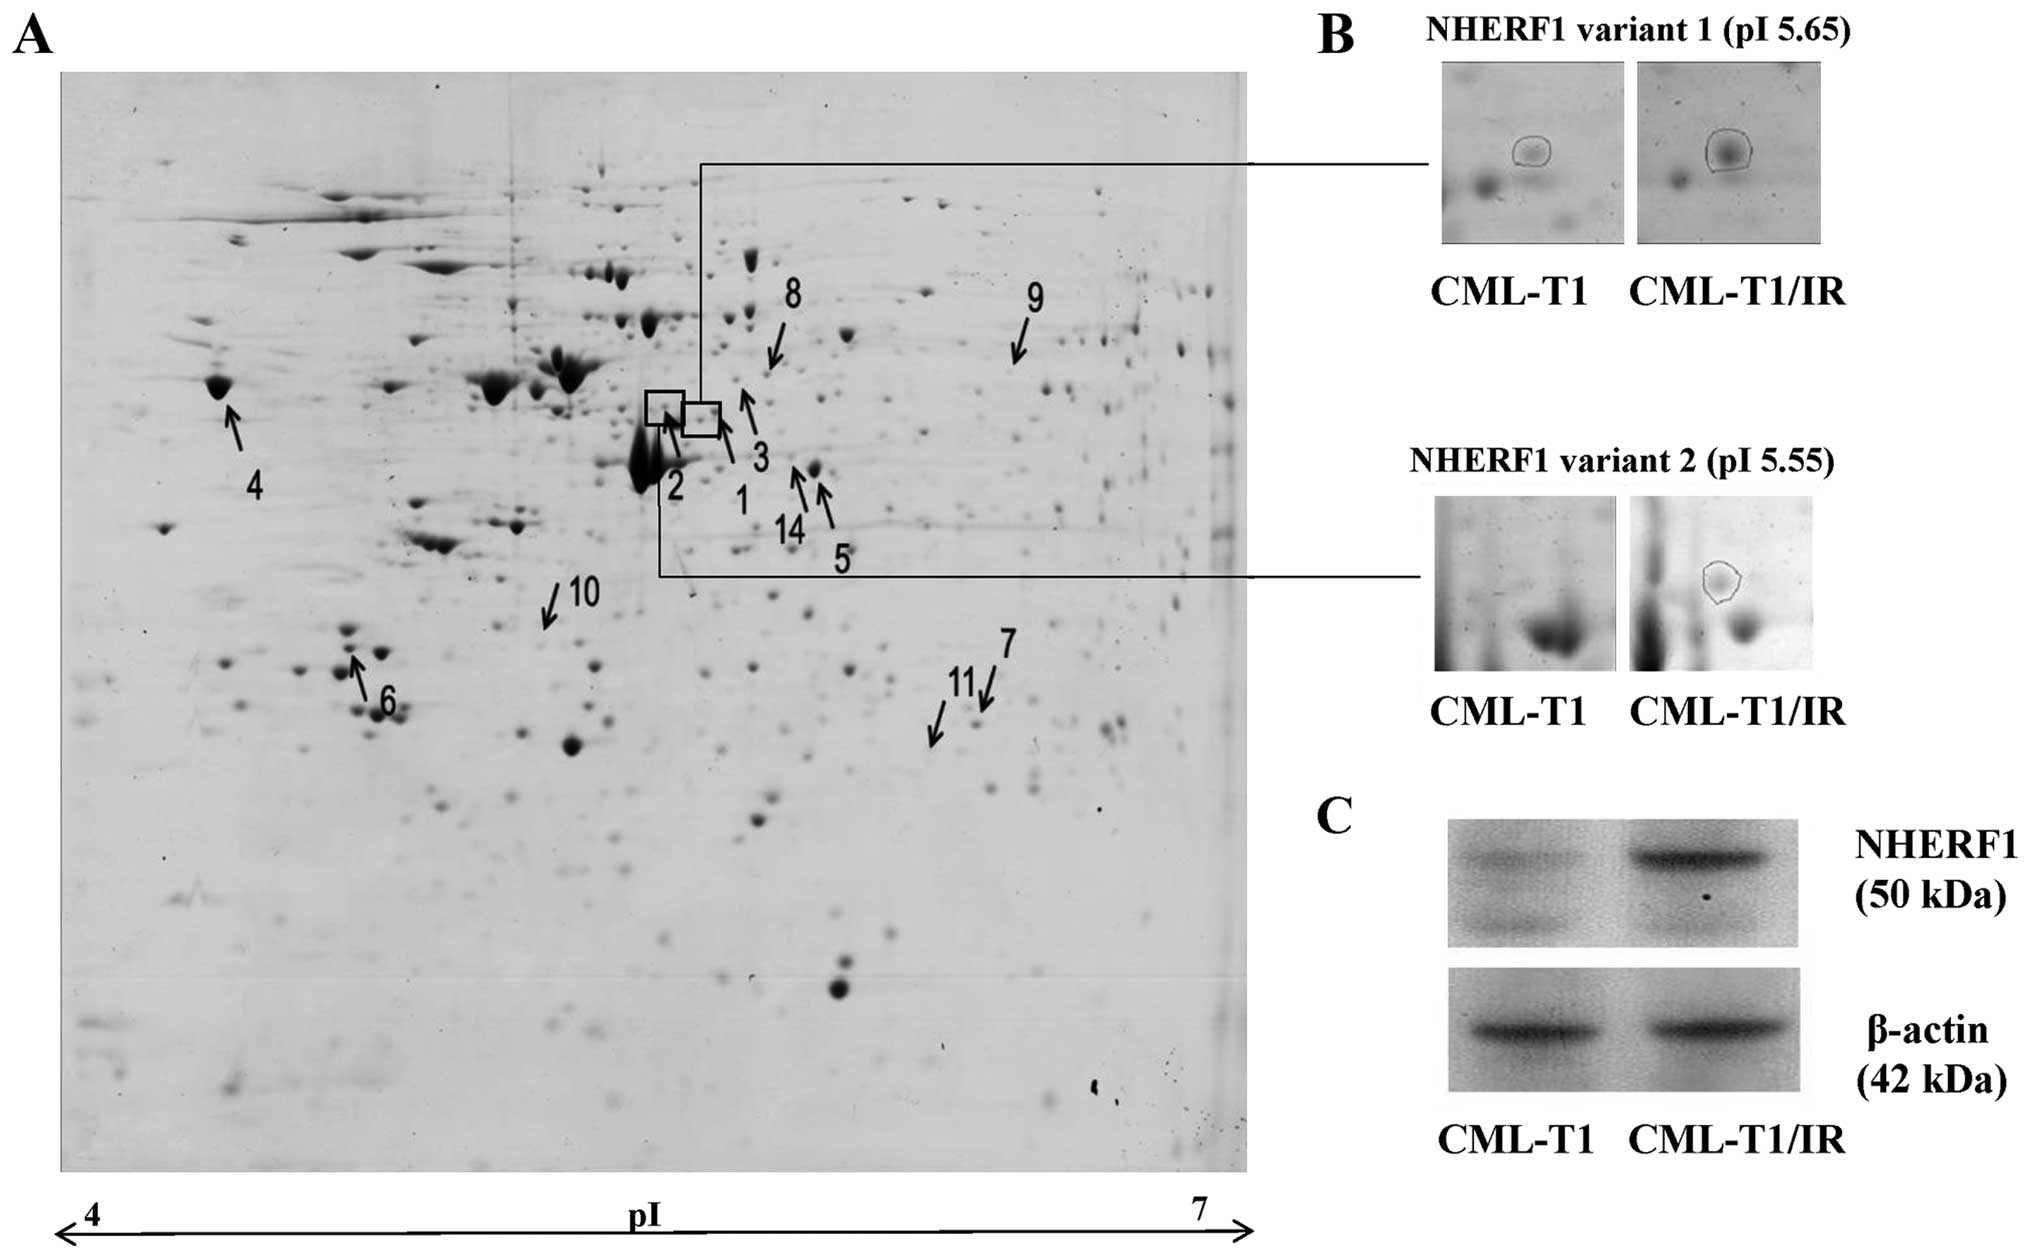
Proteomic analysis reveals upregulation
of two NHERF1 variants in the CML-T1/IR cells
We hypothesized that besides the causal mutation in
the BCR-ABL kinase domain there are additional, adaptive molecular
changes in the CML-T1/IR cells, contributing to or associated with
their survival in the presence of imatinib (27,28).
These specific features may be exploitable as potential molecular
targets for selective growth inhibition of imatinib-resistant cells
for future therapies. To identify such alterations, we performed
2-DE proteomic analysis of the CML-T1 and CML-T1/IR cells (Fig. 2A). We identified eight
differentially expressed proteins (Fig.
2A and Table I). The most
marked change was the increased expression of the
Na+/H+ exchange regulatory factor 1 (NHERF1
also known as SLC9A3R1). This protein was identified in two
markedly upregulated variants of comparable molecular weight but of
different isoelectric points (Table
I, Fig. 2B). We further
confirmed the upregulation of NHERF1 in the CML-T1/IR cells by
western blot analysis (Fig. 2C). In
addition to NHERF1, we detected upregulation of the endoplasmic
reticulum (ER) calcium binding protein calreticulin, microtubule
associated proteins and protein chaperones in the CML-T1/IR cells
(Table I).
 | Table IDifferentially expressed proteins in
the CML-T1/IR cells. |
Table I
Differentially expressed proteins in
the CML-T1/IR cells.
| Spot no. | Uniprot | Protein name | Fold change | P-value | Sequence coverage
(%) | Mascot score | MW (Da) | pI |
|---|
| Upregulated |
| 1 | O14745 |
Na+/H+ exchange
regulatory cofactor NHERF1 | 2.84 | <0.009 | 21 | 57 | 39,130 | 5.55 |
| 2 | O14745 |
Na+/H+ exchange
regulatory cofactor NHERF1 | >10 | <0.001 | 32 | 84 | 39,130 | 5.55 |
| 3 | Q9Y230 | RuvB-like 2 | 6.8 | <0.015 | 29 | 81 | 51,296 | 5.49 |
| 4 | P27797 | Calreticulin | 1.8 | <0.023 | 24 | 71 | 48,283 | 4.29 |
| 5 | P00813 | Adenosine
deaminase | 2.9 | <0.009 | 36 | 87 | 41,024 | 5.63 |
| 6 | P67936 | Tropomyosin α-4
chain | 1.56 | <0.036 | 63 | 198 | 28,619 | 4.67 |
| 7 | P04792 | Heat shock protein
β-1 | >10 | <0.001 | 35 | 136 | 22,826 | 5.98 |
| Downregulated |
| 8 | Q9Y230 | RuvB-like 2 | −2.17 | <0.02 | 38 | 149 | 51,296 | 5.49 |
| 9 | Q99536 | Synaptic vesicle
membrane protein VAT-1 homolog | −3.7 | <0.039 | 34 | 60 | 42,122 | 5.88 |
| 10 | Q15691 |
Microtubule-associated protein RP/EB
family member 1 | −1.86 | <0.005 | 53 | 89 | 30,151 | 5.02 |
| 11 | P04792 | Heat shock protein
β-1 | −2.2 | <0.001 | 44 | 75 | 22,826 | 5.98 |
NHERF1: functional analysis
NHERF1 is a multifunctional scaffolding protein
containing two PDZ domains (29).
Via these domains NHERF1 interacts with various cellular proteins,
mostly membrane receptors and transporters, modulating their
expression, stability and activity (30). NHERF1 has been implicated in MDR in
liver cancer by controlling the expression of MDR exporter MRP2
(31). NHERF1 negatively regulates
the activity of sodium hydrogen ion exchanger SLC9A3 (NHE3), thus
modulating the pH inside the cell (32). NHERF1 has also been demonstrated to
influence cytosolic calcium concentration via transient receptor
potential channel 5 protein (TRPC5) (33,34).
Recently it was revealed that NHERF1 negatively regulates the
canonical Wnt signaling pathway via direct interaction with a
subset of Frizzled (Fzd) receptors (35).
Based on the functions aforementioned, we examined
the possible effect of NHERF1 upregulation in the CML-T1/IR cells
in order to identify a specific feature of the imatinib-resistant
cells which may exhibit a 'molecular weakness' representing a
potential therapeutic target. We first evaluated the potential
connection of NHERF1 with MDR in the CML-T1/IR cells. Next we
tested whether NHERF1 upregulation modulates H+ and
Ca2+ concentrations in the cytosol of the CML-T1/IR
cells and investigated whether NHERF1 upregulation and changes in
ion homeostasis affect the activity of the Wnt signaling
pathway.
NHERF1 upregulation does not contribute
to MDR in the CML-T1/IR cells
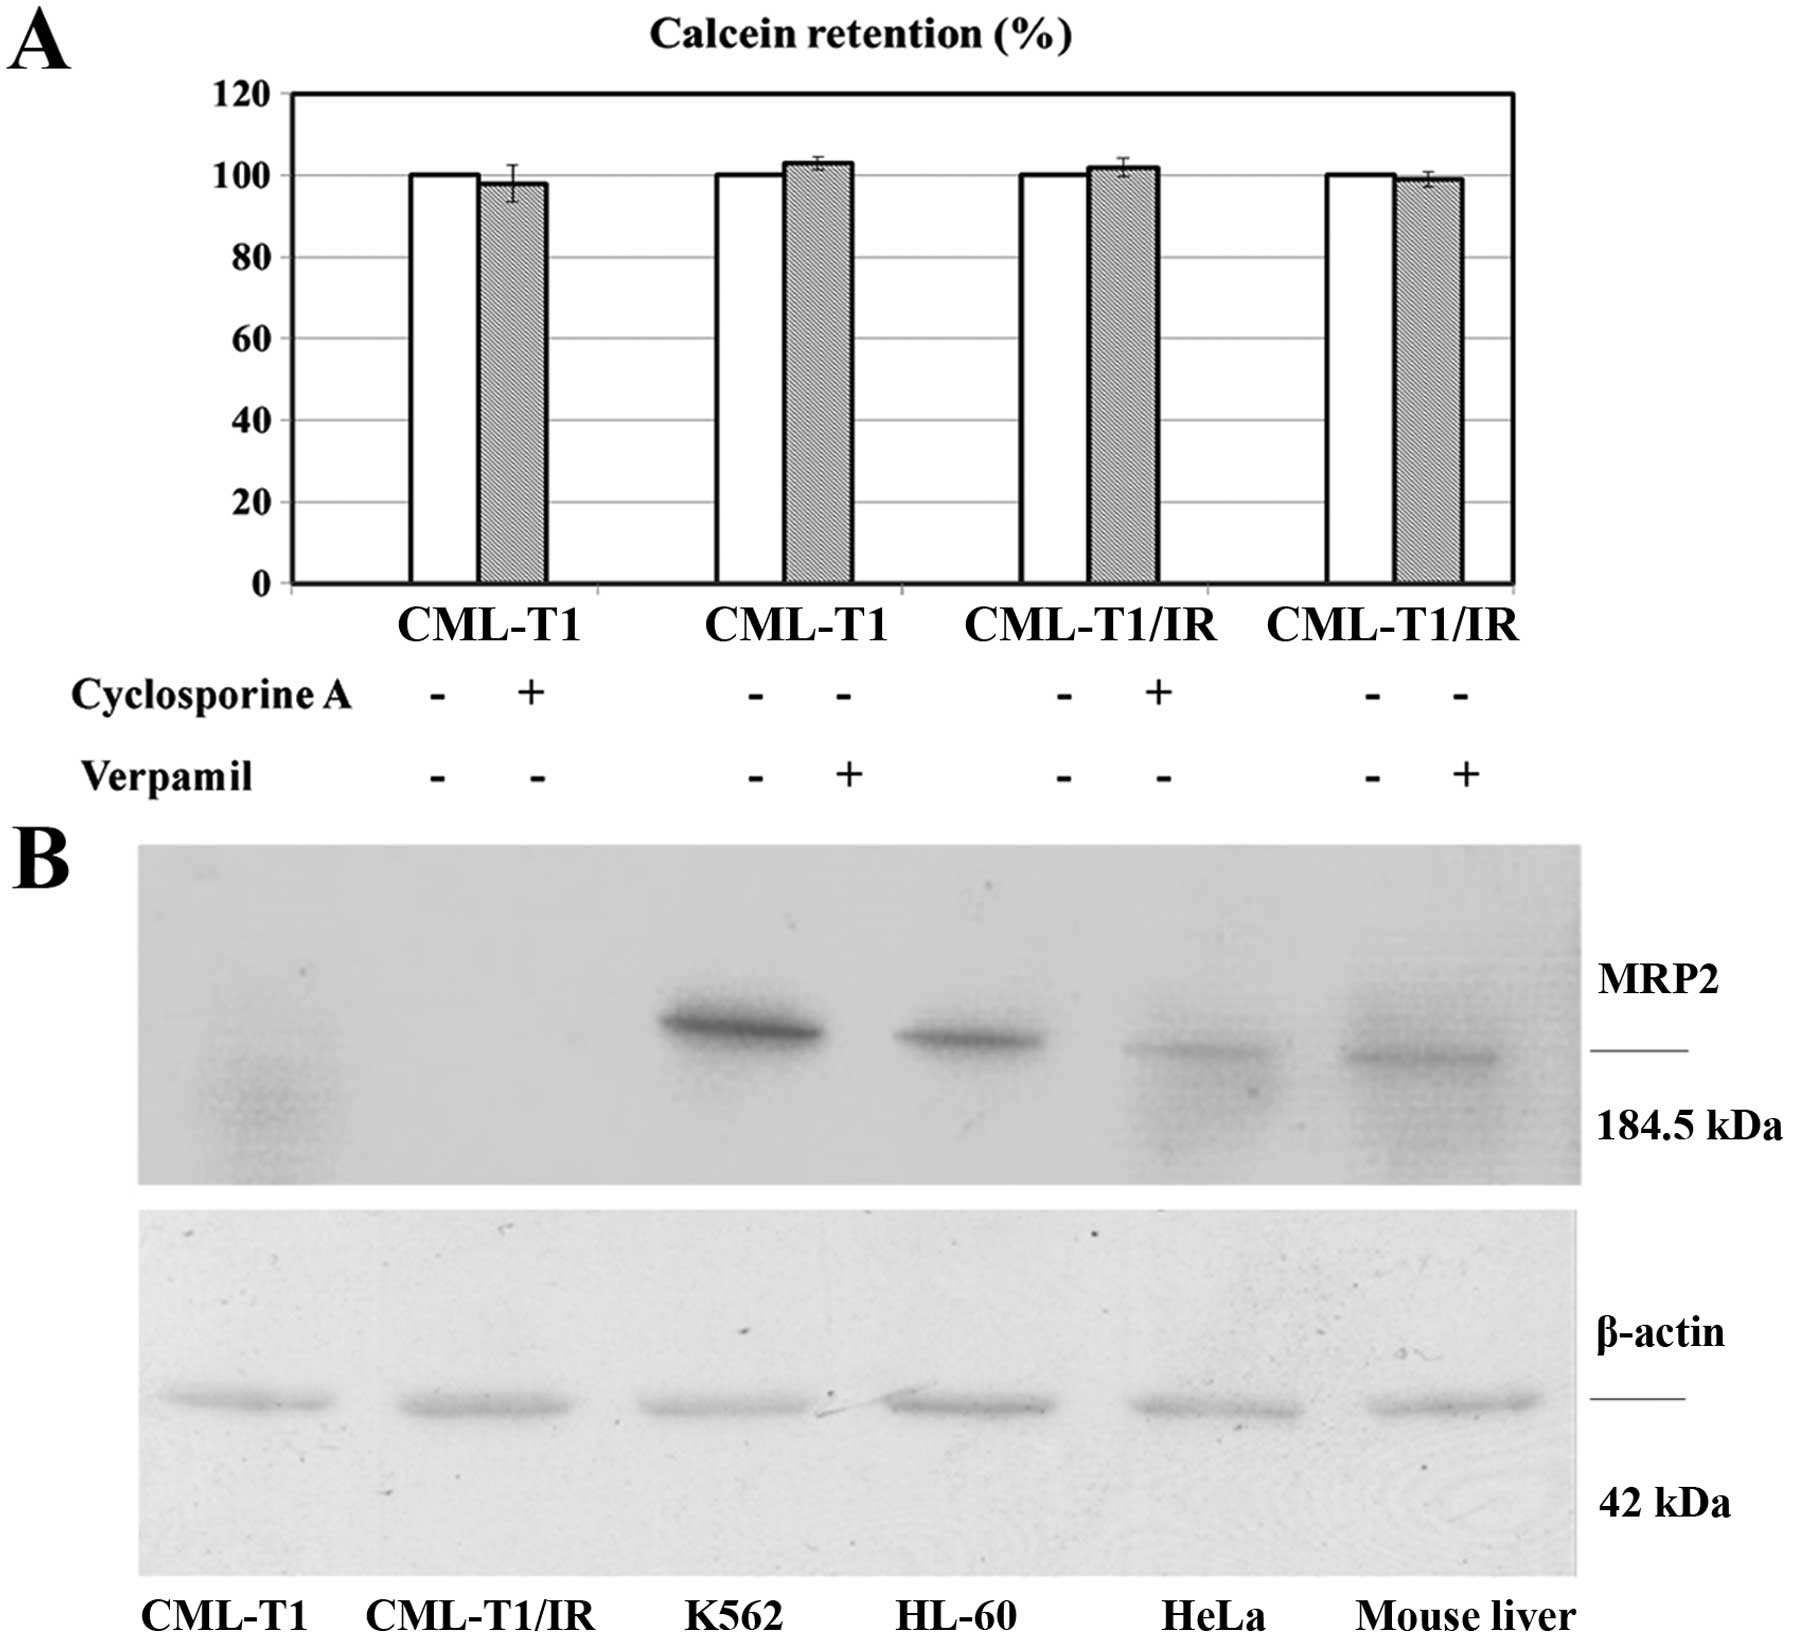
We evaluated whether the upregulation of NHERF1 in
the CML-T1/IR cells contributes to cell survival in high
concentrations of imatinib by increasing the activity of the MDR
protein pumps MRP2 as described in liver cancer (36). We performed an in vitro MDR
assay based on the cellular efflux of the fluorescent probe
calcein. This process was shown to be performed by the multidrug
exporters MDR1 and MRP2 (37,38).
Both the CML-T1 and the CML-T1/IR cells retained 100% of the
incorporated calcein (no calcein efflux was detected). The addition
of multidrug export inhibitors CsA and verapamil therefore had no
effect on efflux. This suggests that these drug exporters are not
present/active in CML-T1 and CML-T1/IR cells (Fig. 3A). Furthermore, while we were able
to detect MRP2 by western blot in the lysates of several cell types
including CML-derived K562 cells, expression of MRP2 in both the
CML-T1 and CML-T1/IR cells was under our detection limit (Fig. 3B). We concluded that the activity of
multidrug exporters in the CML-T1 and CML-T1/IR cells is negligible
and that the increased NHERF1 expression does not affect the
activity of MDR1 and MRP2 in the CML-T1/IR cells.
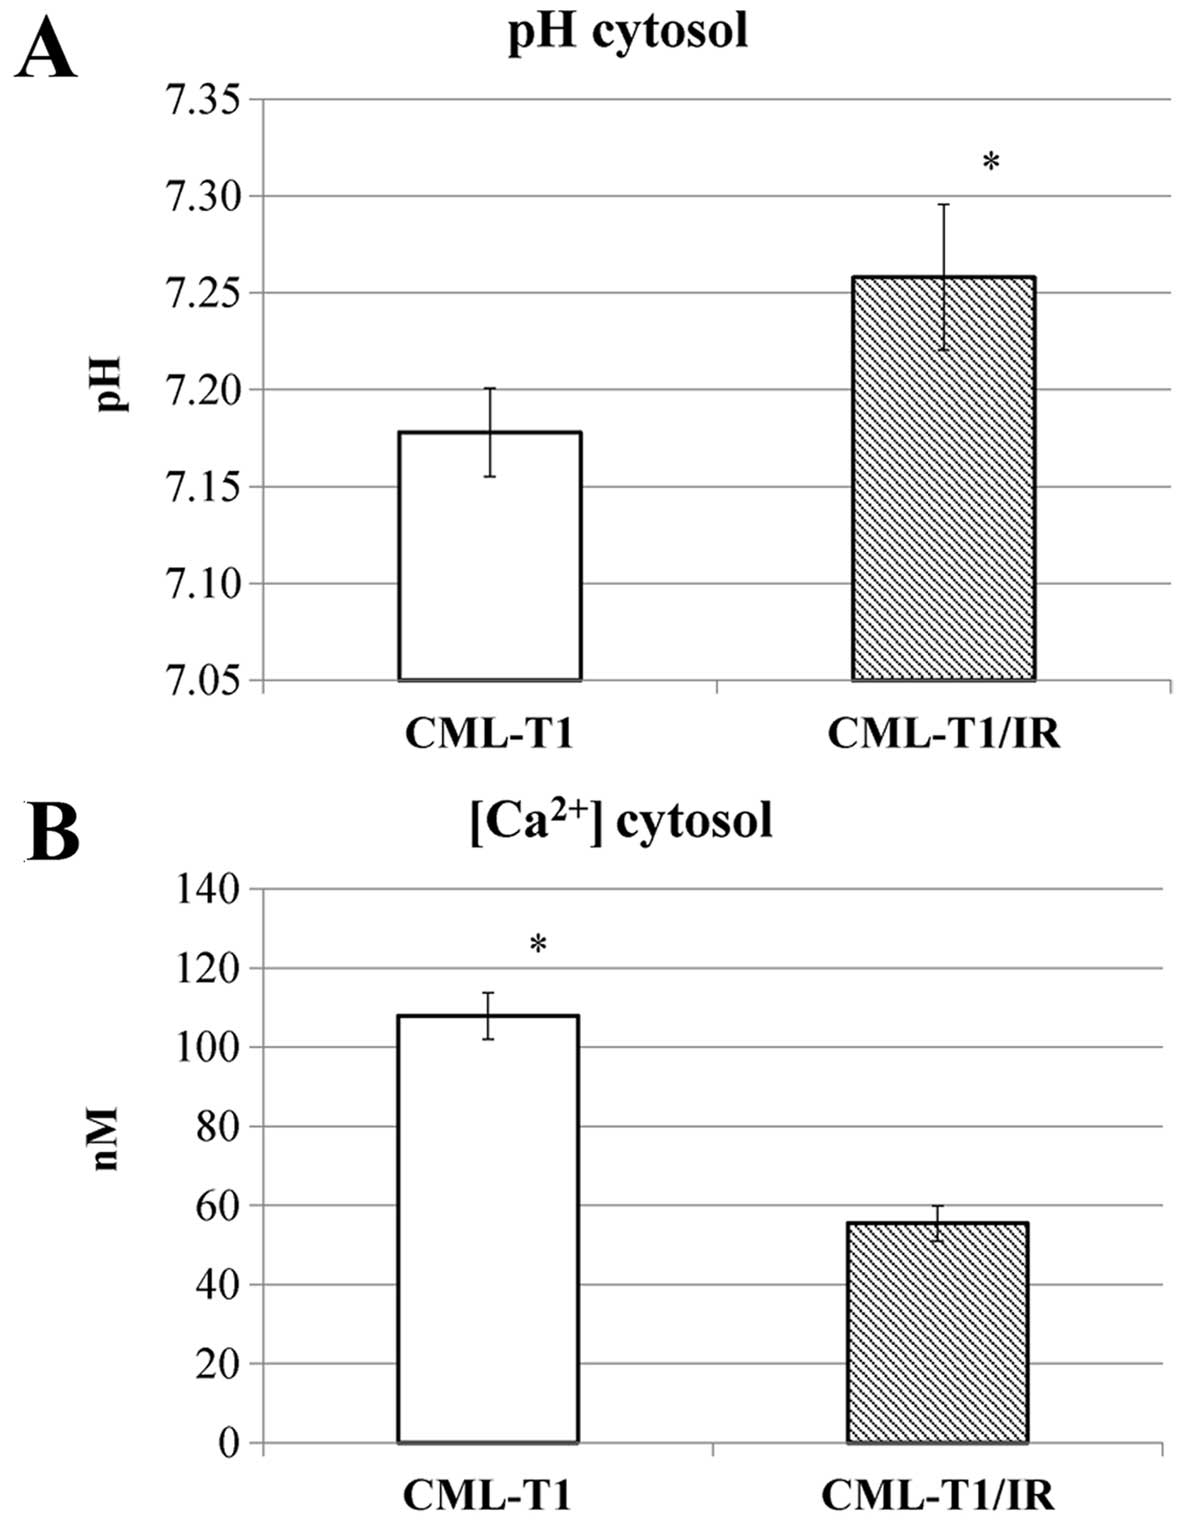
Intracellular concentrations of
H+ and Ca2+ ions differ in the CML-T1 and the
CML-T1/IR cells
Based on the known interplay between NHERF1 and the
Na+/H+ exchanger NHE3 with a consequent
effect on cellular pH (39) we
examined whether the NHERF1 upregulation in the CML-T1/IR cells
affects the intracellular pH. We measured the intracellular pH and
observed increased cytosolic pH in the CML-T1/IR cells (pH 7.25)
compared to the control CML-T1 cells (pH 7.18), as shown in
Fig. 4A.
Since NHERF1 was shown to regulate the activity of
nonselective calcium permeable cation channels, namely TRPC4 and
TRPC5 (34) we examined whether the
presence of upregulated NHERF1 (or the increased cytosolic pH) in
the CML-T1/IR cells also affects the cytosolic concentration of
Ca2+ (40). Our
measurements revealed a 50% decrease in cytosolic Ca2+
concentration in the CML-T1/IR cells (Fig. 4B).
In summary, ion homeostasis in the CML-T1/IR cytosol
was altered, with an increased pH and a decreased cytosolic
Ca2+ concentration compared to the original CMLT1
cells.
Calcium channel blockers and inhibitors
of calcium signaling selectively inhibit the viability of CML-T1/IR
cells
We hypothesized that the increased pH due to
differential Na+/H+ exchange (41) and decreased Ca2+
concentration in the cytosol (42)
contribute to CML-T1/IR survival in the presence of imatinib. To
address whether the inhibition of Na+/H+
exchange selectively affects the growth of the CML-T1/IR cells, we
targeted Na+/H+ exchange by amiloride. Since
it is well established that a Na+/Ca2+
exchanger (NCX) may also contribute to pH and calcium concentration
changes in the cells (43), we
further inhibited Na+/Ca2+ exchange by
3′,4′-dichlorobenzamil hydrochloride (DCB) (44). We observed that none of the
inhibitors had a selective effect on the viability of the CML-T1/IR
cells. Both the CML-T1 and the CML-T1/IR cells tolerated comparable
concentrations of inhibitors within IC50 values of 15
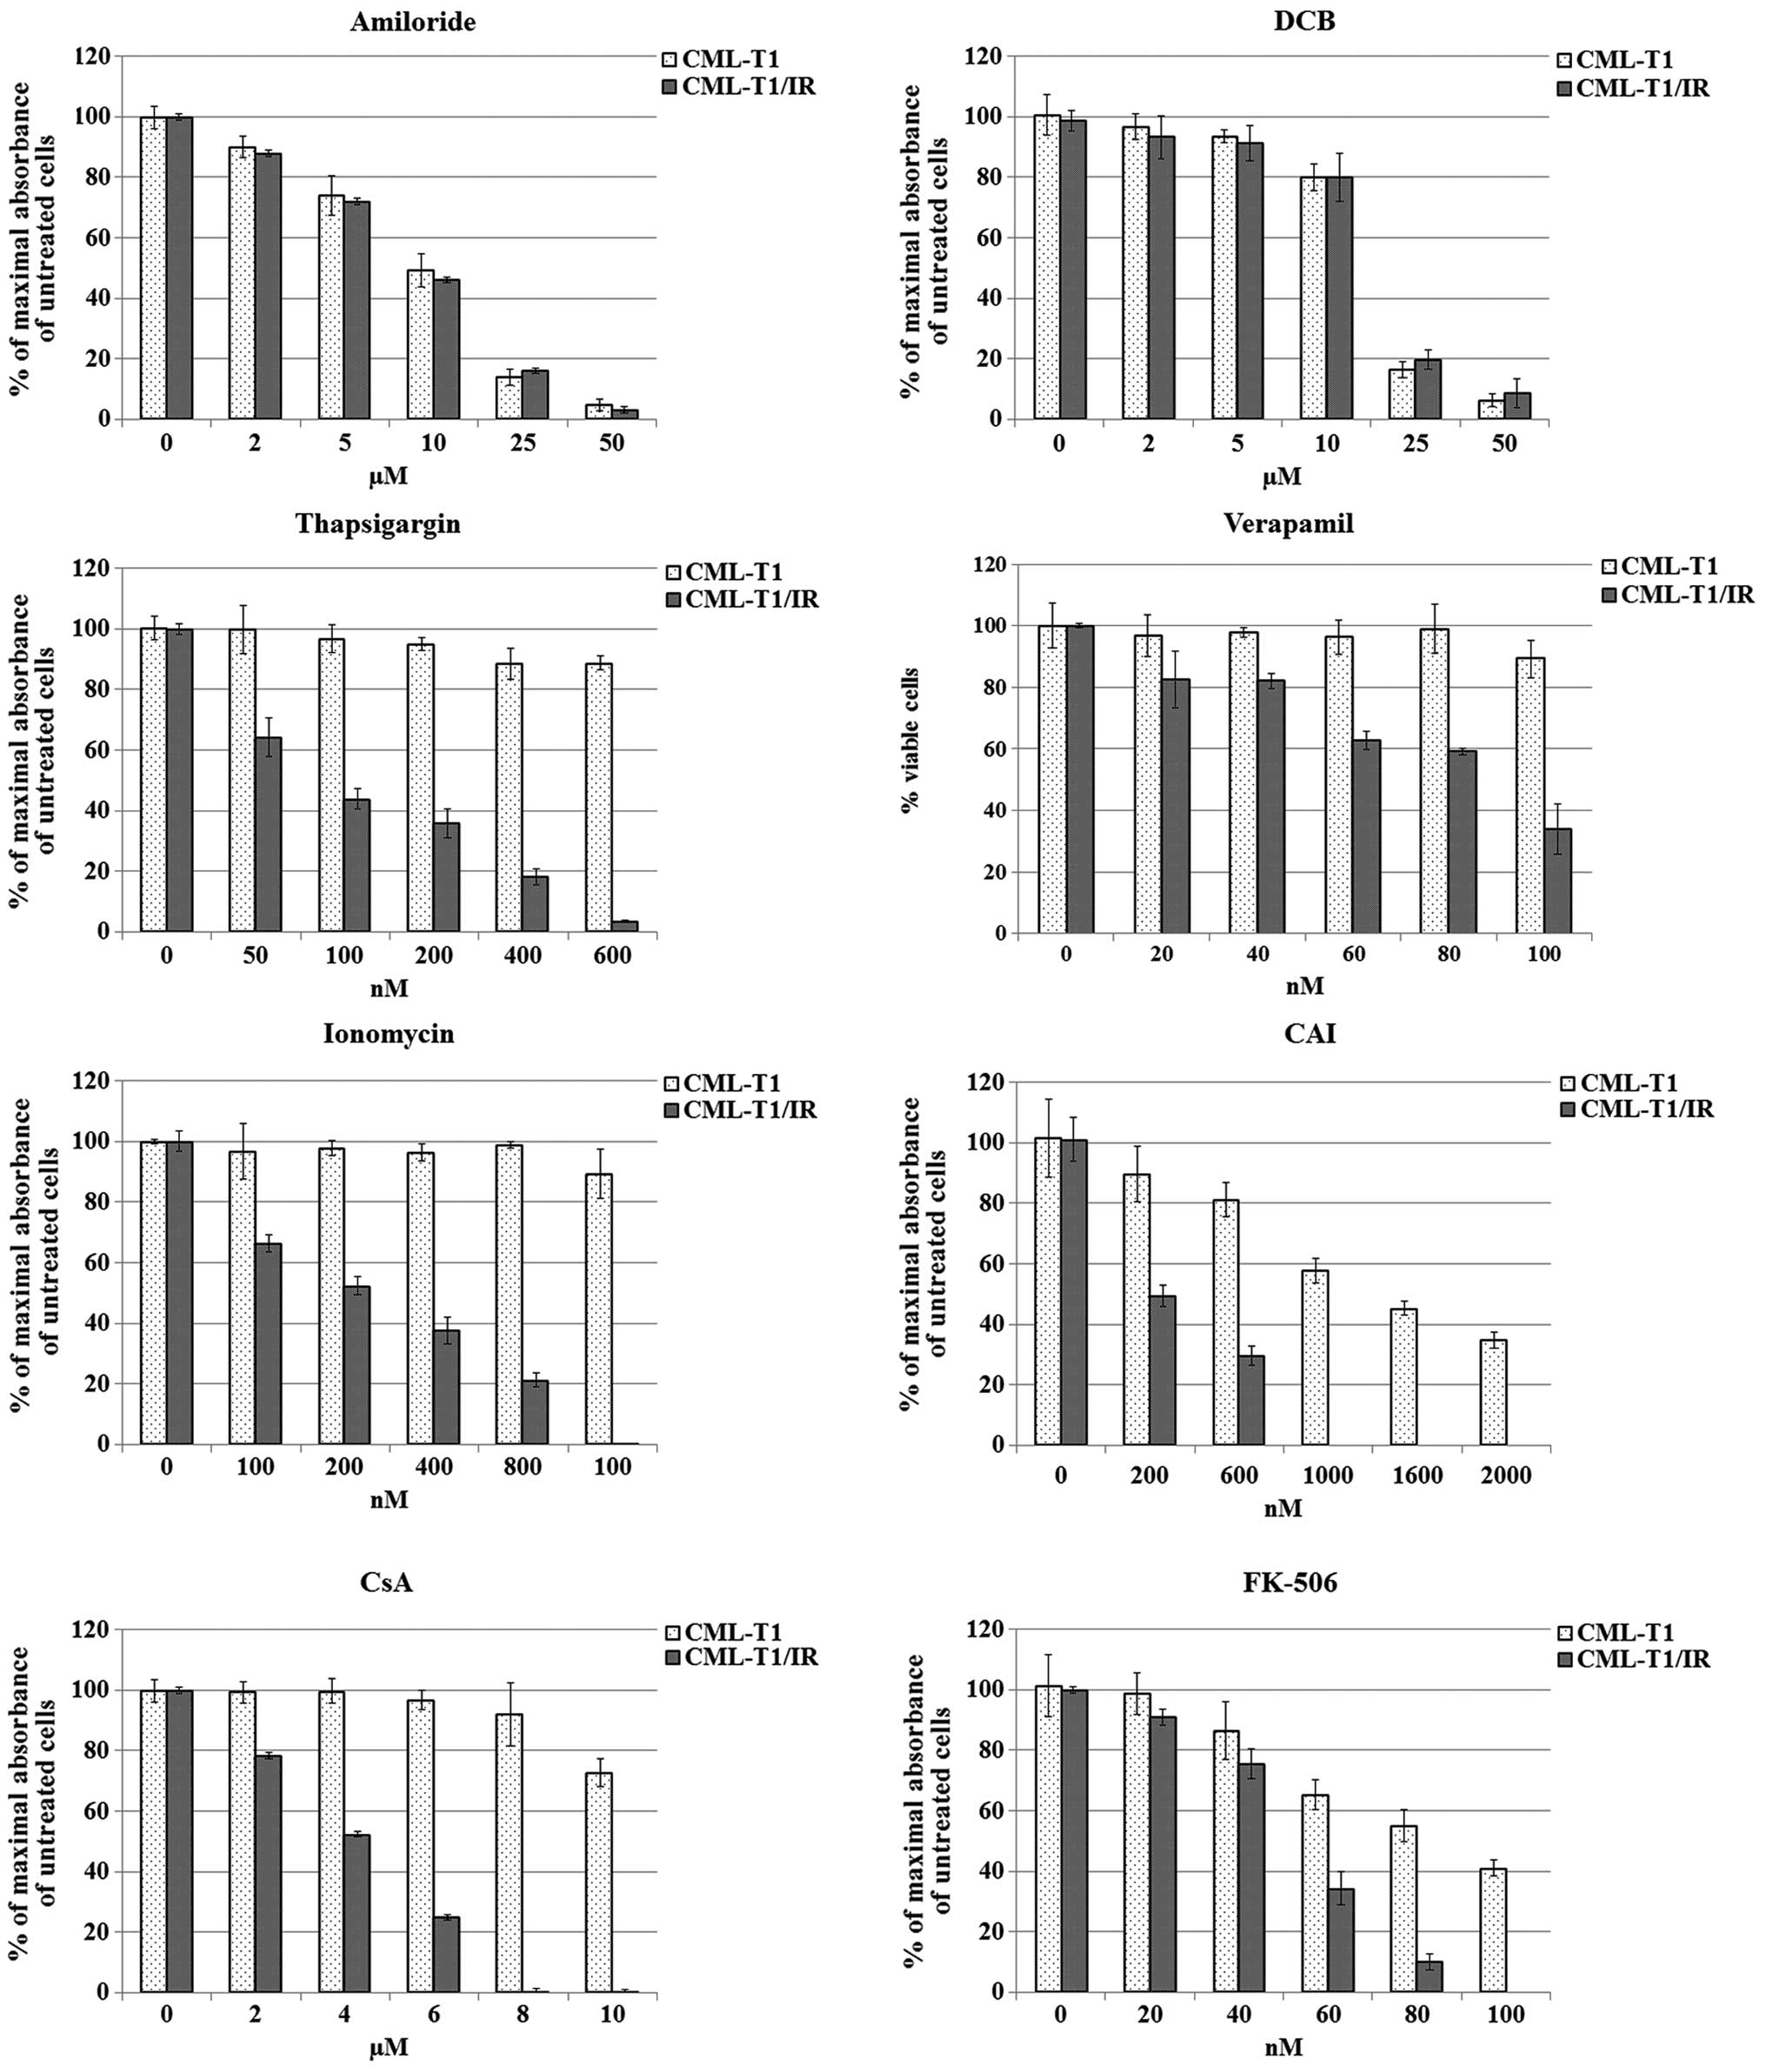
μM for amiloride and 7 μM for DCB (Fig. 5).
To address whether shifted Ca2+
homeostasis is crucial for survival of the CML-T1/IR cells, we
exposed the CML-T1 and CML-T1/IR cells to increasing concentrations
of inhibitors of Ca2+ transport and Ca2+
signaling, namely thapsigargin, ionomycin, verapamil, and CAI.
Thapsigargin inhibits the activity of sarco/ER Ca2+
ATPase (SERCA), preventing the uptake of cytosolic Ca2+
into the ER, thus increasing the cytosolic Ca2+
(45,46). Ionomycin increases intracellular
Ca2+ by means of its increased entry across the plasma
membrane and/or by depletion of intracellular Ca2+
stores such as ER (47). The
clinically approved drug verapamil blocks voltage-dependent
(L-type) Ca2+ channels (48). CAI inhibits non-voltage operated
calcium channels and blocks both Ca2+ influx into the
cells and Ca2+ release from the intracellular stores
(49). Notably, CAI has been
previously demonstrated to inhibit the growth of imatinib-resistant
CML cell lines in vitro (50) and several studies have demonstrated
a potential anticancer effect of CAI in vitro (51,52).
In a battery of in vitro cell viability
assays we tested the aforementioned compounds for their toxicity to
the CML-T1 and CML-T1/IR cells. All the tested agents were more
toxic to the imatinib-resistant CML-T1/IR cells (Fig. 5). Among them, thapsigargin was the
most potent in growth inhibition of CML-T1/IR cells, which were at
least 16-fold more sensitive to this agent compared to the CML-T1
cells. The IC50 for the CML-T/IR cells was 75 nM while
the IC50 in the CML-T1 cells was not reached at a 1.2
μM concentration of thapsigargin in the media. The CMLT1-IR
cells were also 5-fold more sensitive to ionomycin
(IC50values 200 nM for the CML-T1/IR cells and >1.6
μM for the CML-T1 cells). Verapamil was ~3-fold more toxic
to the CML-T1/IR cells (IC50 30 nM for the CML-T1/IR
cells and 90 nM for the CML-T1 cells) and CAI was 2.5-fold more
toxic to the CML-T1/IR cells (IC50 200 nM for the
CML-T1/IR cells and 1.6 μM for the CML-T1 cells).
Altered calcium homeostasis influences numerous
intracellular processes including Wnt signaling. CsA and tacrolimus
(FK-506) were shown to modulate calcium homeostasis (53,54)
and inhibit Wnt-regulated pro-survival processes in
imatinib-resistant cells (56). We,
therefore, evaluated the effect of CsA and FK-506 on the
proliferation of the CML-T1 and CML-T1/IR cells. In our assays both
CsA and FK506 inhibited proliferation of the CML-T1/IR cells at
significantly lower concentrations (3- and 1.8-fold, respectively)
compared to the CML-T1 cells. The IC50 of CsA was 4
μM for the CML-T1/IR cells and 12 μM for the CML-T1
cells; the IC50 of FK-506 was 50 nM for the CML-T1/IR
cells and 90 nM for the CML-T1 cells (Fig. 5).
In summary, we observed that a disruption of calcium
homeostasis (and to a lesser extent also inhibition of Wnt
signaling), but not the inhibition of Na+/H+
or Na+/Ca2+ exchange was selectively toxic to
CML-T1/IR cells. The most effective growth inhibition of CML-T1/IR
was achieved by using the agents causing depletion of the
intracellular Ca2+ stores with an increase in the
Ca2+ concentration in the cytosol (ionomycin,
thapsigargin), but also calcium channel blockers (verapamil) and
calcium signaling antagonist CAI. Low molecular weight antagonists
of calcium homeostasis, calcium transport blockers and calcium
signaling inhibitors may be used to selectively impair the growth
of imatinib-resistant CML-T1/IR cells, thus suggesting their
clinical potential in TKI-resistant CML.
The Wnt pathway is dysregulated in the
CML-T1/IR cells
NHERF1 has been proven to negatively regulate Wnt
signaling via its direct interaction with Fzd receptors (35). The potential of Wnt signaling
serving as a therapeutic target is recently a subject of intensive
studies in the field of cancer therapy and novel drug discovery
(55). We therefore examined
whether NHERF1 upregulation (accompanied with altered cytosolic ion
concentration) in the CML-T1/IR cells is associated with altered
Wnt signaling. We analyzed the activity of the Wnt pathway using
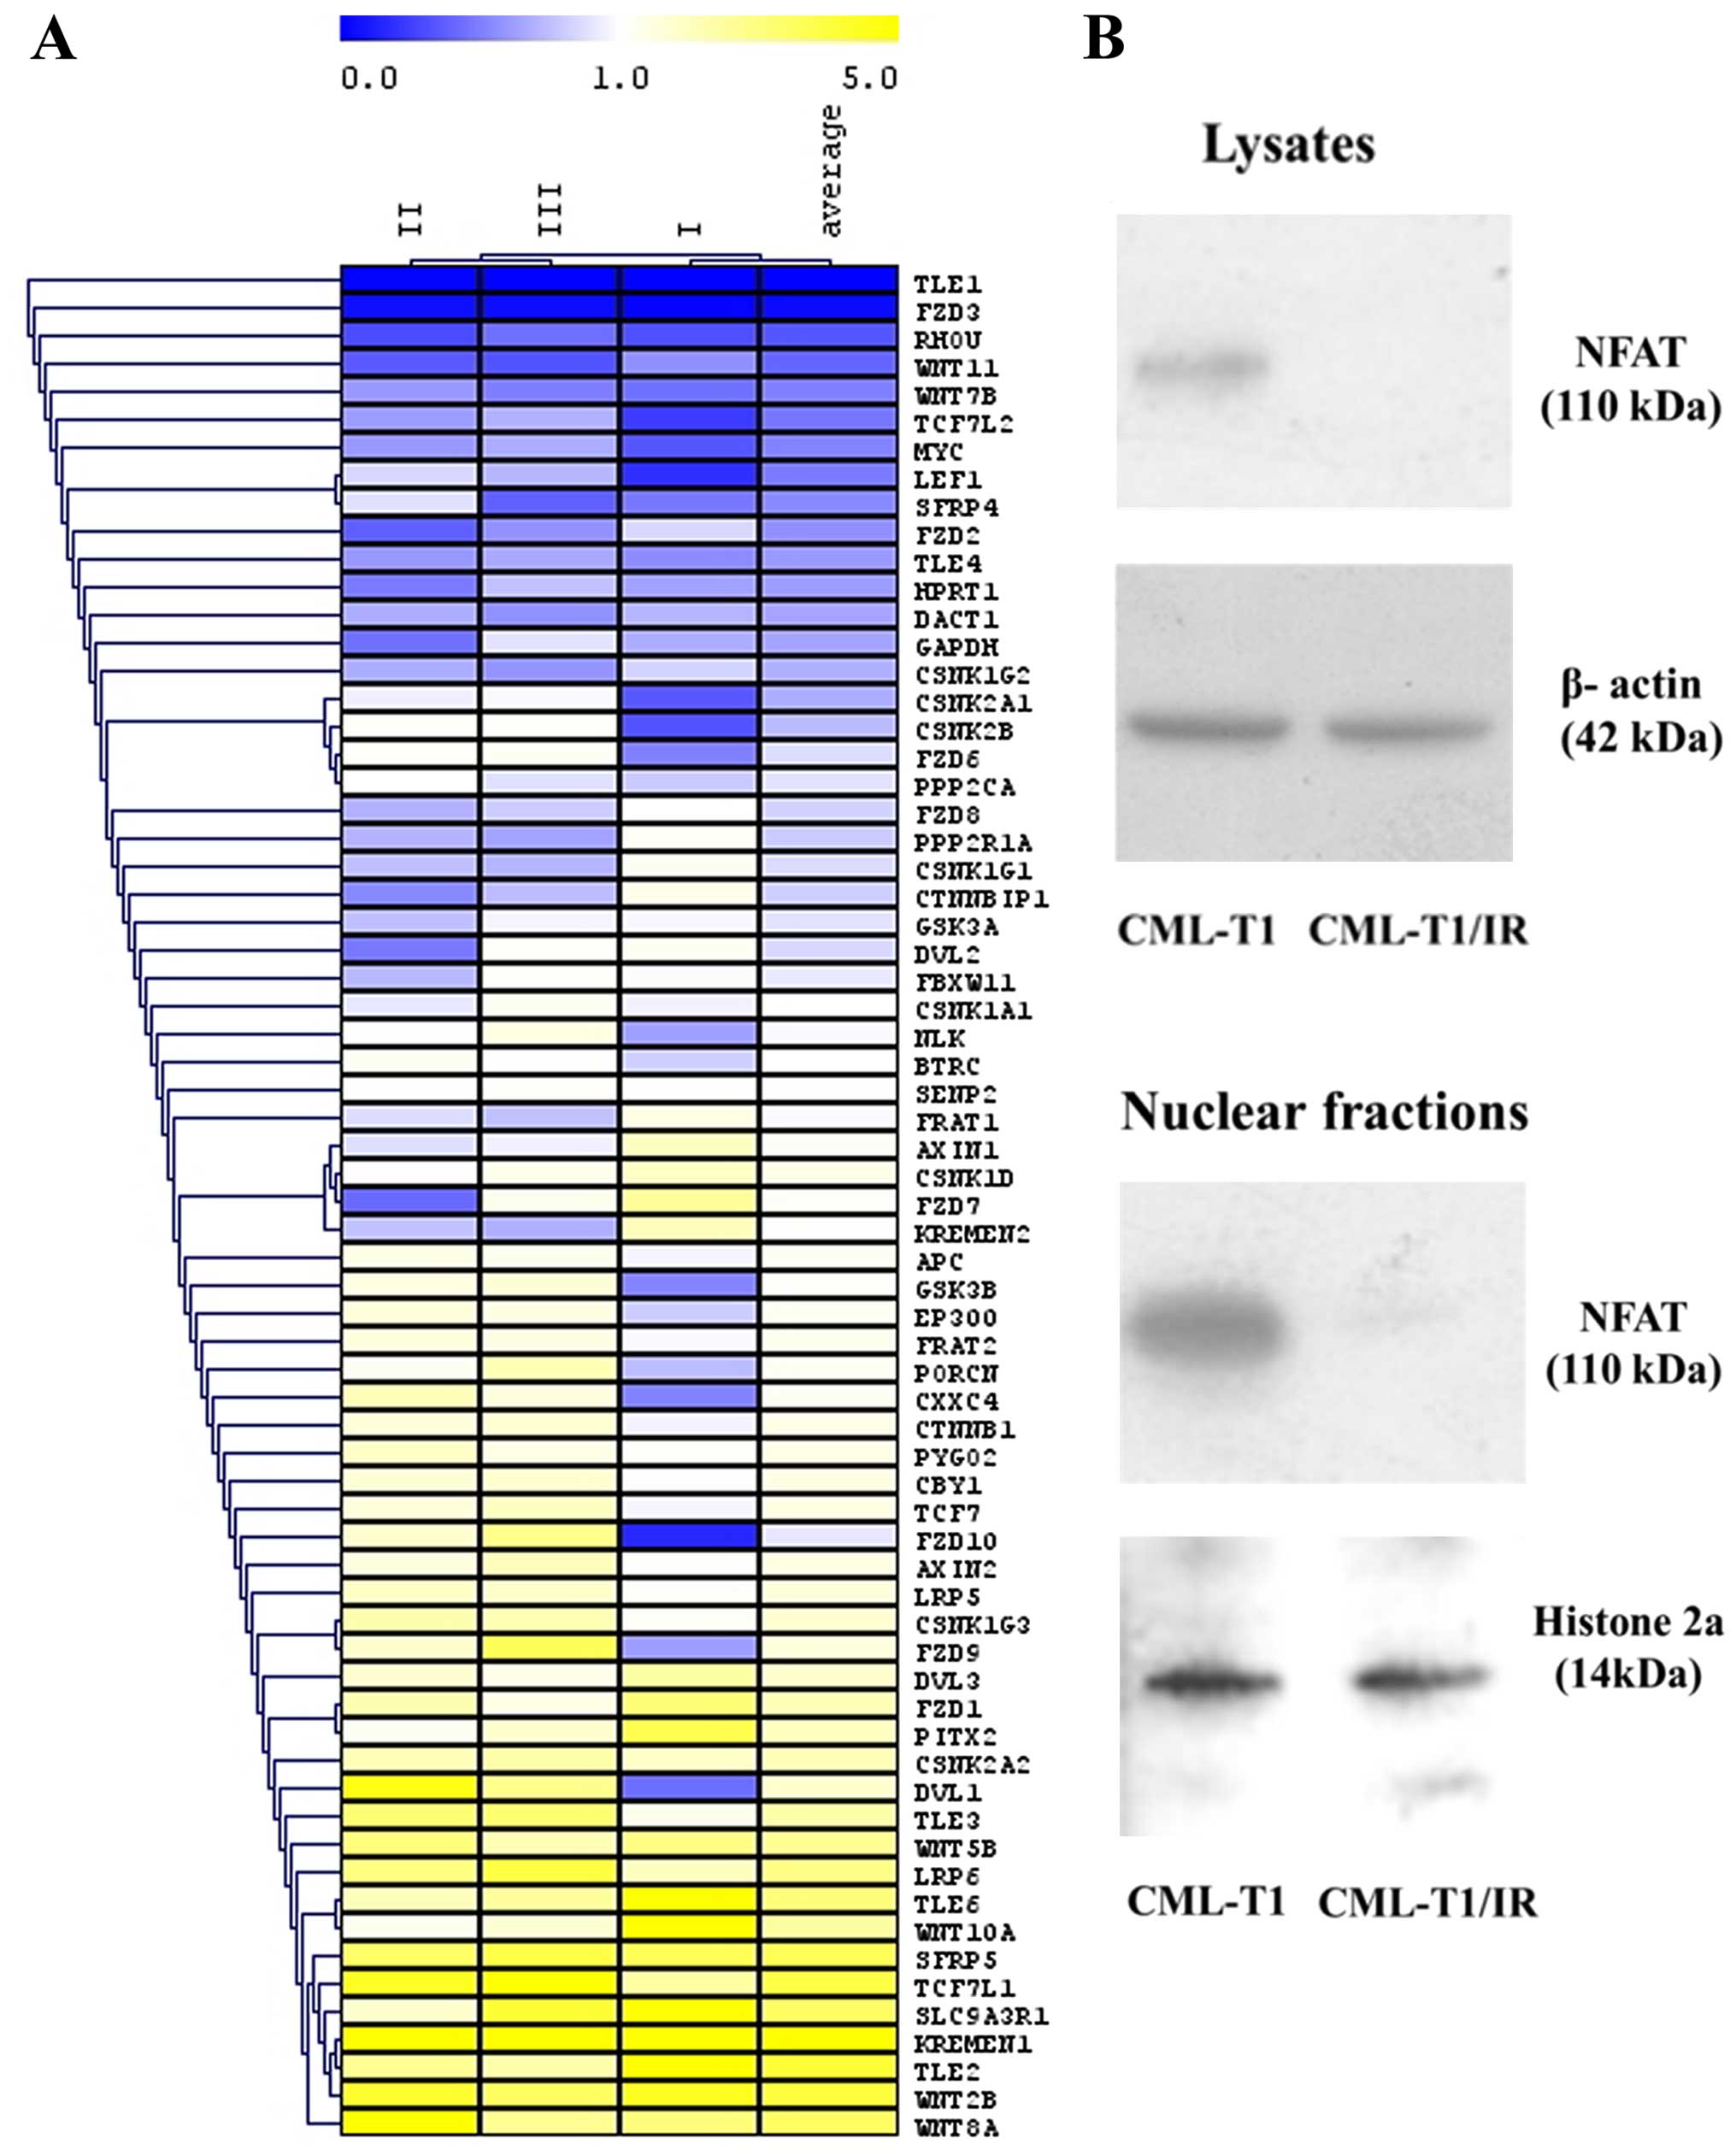
RT-PCR Wnt microarray to determine the relative expression of Wnt
target genes and regulatory molecules (Fig. 6A). In the CML-T1/IR cells, we
observed a decreased expression of genes of the canonical
β-catenin-dependent Wnt pathway, namely TLE1, TLE4, TCF7L2, LEF1,
MYC and RHOU. Conversely, the expression of negative regulators of
this pathway, KREMEN1 and SFRP5 was increased in the CML-T1/IR
cells, indicating that the canonical β-catenin-dependent Wnt
signaling was decreased in the CML-T1/IR cells.
We also evaluated the expression of genes critical
for the non-canonical CaMKII/Ca2+/NFAT Wnt pathway where
the expression of mRNA encoding FZD8 receptor, essential for this
pathway was decreased in the CML-T1/IR cells. This is contradictory
to the results of Gregory et al (56), which showed that Wnt signaling
contributed (via FZD8) to the pro-surviving effect of the
CaMKII/Ca2+/NFAT Wnt pathway in imatinib-resistant
cells. To obtain more information on the status of
CaMKII/Ca2+/NFAT Wnt signaling in our cells, we
determined the presence of transcription factor NFAT, the final
effector of this pathway in the cytoplasm and the nuclei of the
CML-T1 and CML-T1/IR cells. NFAT was not detected in the CML-T1/IR
cells (Fig. 6B), while it was
clearly detectable in the CML-T1 cells. The diminished expression
of NFAT protein in the CML-T1/IR cells suggests that
CaMKII/Ca2+/NFAT Wnt signaling is decreased in these
cells and does not contribute to the survival against imatinib in
our cell model.
All in all, our data suggest that imatinib
resistance is accompanied by significant downregulation of both
canonical and noncanonical CaMKII/Ca2+/NFAT Wnt
signaling pathways in CML-T1/IR cells.
Discussion
The imatinib-resistant CML-T1/IR cells carry the
causal mutation of Y253H in the kinase domain of the BCR-ABL gene.
This mutation is undoubtedly the main driving force of resistance
to imatinib. However, any resistant phenotype is a result of
multiple molecular events including causative, contributing and
adaptive cellular processes, enabling survival of the resistant
cells. Detailed molecular analysis of therapy-resistant cells
potentially opens the path to personalized therapies of
drug-resistant malignancies. Using 2-DE analysis we revealed a
strong upregulation of a multifunctional protein NHERF1. We
demonstrated altered cytosolic pH and decreased calcium levels in
the CML-T1/IR cells. While inhibition of
Na+/H+ and Na+/Ca+
exchangers has no specific toxic effect in the resistant CML-T1/IR
cells, modulators of cytosolic calcium concentration, calcium
channels blockers and calcium signaling inhibitors were
significantly more toxic to the CML-T1/IR cells compared to the
CML-T1/IR cells. The most prominent toxic effect we observed using
ionomycin and thapsigargin was presumably caused by toxic elevation
of cytosolic Ca2+ and/or by the depletion of
Ca2+ from ER, leading to ER stress, unfolded protein
response and finally to apoptosis (57).
Altered Ca2+ concentration in the cytosol
may affect the expression of many proteins and modulate signaling
pathways such as CaMKII/Ca2+/NFAT Wnt. This was of
particular interest to us since this calcium-dependent pathway was
previously demonstrated to be critical for the survival of
imatinib-resistant CML cells; NFAT inhibitor CsA effectively
inhibited proliferation of the imatinib-resistant cells (56). Correspondingly, when we applied NFAT
inhibitors, such as CsA or FK-506, in our experiments, we also
observed their selective toxicity to CML-T1/IR. However, this
growth inhibitory effect appeared to be NFAT-independent in our
CML-T1/IR cells, because NFAT was markedly downregulated (if not
absent) in the nuclei of the CML-T1/IR cells.
We, therefore, proposed that the selective toxicity
of CsA and FK-506 in CML-T1/IR cells is due to their direct effect
on calcium homeostasis. The established mechanism of ionomycin and
thapsigargin toxicity (the inhibitors with the most pronounced
toxic effect to the CML-T1/IR cells) is elevation of cytosolic
Ca2+ and depletion of Ca2+ from the ER
(47,45). This suggests that calcium levels in
both the cytoplasm and the ER should be considered as critical for
the survival of CML-T1/IR cells. Our hypothesis of altered calcium
homeostasis was further supported by the results of our 2-DE
analysis, where calreticulin was detected as upregulated in the
CML-T1/IR cells (Table I).
Calreticulin is an ER resident protein, which contributes to proper
folding of nascent proteins and serves as a calcium binding buffer
in the ER. If CML-T1/IR cells require increased expression of
calreticulin to maintain ER Ca2+ homeostasis, blocking
Ca2+ entry to the ER by thapsigargin or depleting
Ca2+ from the ER by ionomycin can substantially reduce
their viability. There is evidence that CsA and FK-506, in addition
to their effect on Wnt signaling, may affect calcium homeostasis
directly. CsA inhibits the activity of SERCA, an ER ATPase pump
responsible for Ca2+ influx into the ER from the cytosol
(58). FK-506 stimulates the
activity of the ryanodine receptor (Ryr) which acts in opposition
to SERCA and releases Ca2+ from the ER to the cytosol
(59). Such a direct toxic effect
of these clinically used immunosuppressants on calcium homeostasis
may explain their selective cytotoxic effect on the CMLT1/IR cells
in the absence of NFAT.
In addition to the selective toxicity of the
experimental inhibitors, thapsigargin and ionomycin, three drugs
already clinically established, CsA, tacrolimus (FK-506) and
verapamil displayed similar selective toxicity to the
imatinib-resistant CML-T1/IR cells. Verapamil and tacrolimus are
known to inhibit multi-drug export in cancer cells (60,61).
However, since there was no detectable multidrug-export activity in
the CML-T1/IR cells, we propose that the observed cytotoxic effect
of verapamil and tacrolimus was based on direct disruption of
calcium homeostasis.
Our proteomic and functional analysis of imatinib
resistance in CML cells provides a proof-of-concept and a vision
for a future model of personalized TKI-resistant CML therapy, where
the isolation of TKI-resistant cells can be combined with proteomic
and functional analysis in order to identify potential therapeutic
targets, which may be exploited for selective elimination of the
drug-resistant population of cells.
Acknowledgments
This study was supported by the Czech Ministry of
Health via the Project for Conceptual Development of Research
Organizations grant no. 00023736, and via the 15-32961A grant, by
the European Regional Development Fund via grants
CZ.1.05/1.1.00/02.0109-BIOCEV, ERDF OPPK CZ.2.16/3.1.00/24001 and
ERDF OPPK CZ.2.16/3.1.00/28007, by the Czech Science Foundation
(www.gacr.cz) grant 15-14200S, and by the
Ministry of Education, Youth and Sports of the Czech Republic
(www.msmt.cz) via grants PRVOUK P24/LF1/3 and SVV
260 265/2016.
Abbreviations:
|
CML
|
chronic myeloid leukemia
|
|
TKIs
|
tyrosine kinase inhibitors
|
|
NHERF-1
|
Na+H+ exchanger
regulatory factor 1
|
|
MDR
|
multidrug resistance
|
|
CaMKII
|
Ca2+/calmodulin-dependent
protein kinase II
|
|
PDZ
|
post synaptic density protein
(PSD95)
|
|
Dlg1
|
Discs, large (Drosophila)
homolog 1
|
|
Zo-1
|
zonula occludens-1 protein
|
|
ABC
|
ATP-binding cassette transporters
|
|
NFAT
|
nuclear factor of activated T
cells
|
|
DCB
|
3′,4′-dichlorobenzamil hydrochloride,
TRPC, transient receptor potential calcium channel
|
|
SERCA
|
sarco/endoplasmic reticulum
Ca2+ ATPase
|
|
CsA
|
cyclosporine A
|
|
RyR
|
ryanodine receptor
|
References
|
1
|
Nowell PC and Hungerford DA: Chromosome
studies on normal and leukemic human leukocytes. J Natl Cancer
Inst. 25:85–109. 1960.PubMed/NCBI
|
|
2
|
Lugo TG, Pendergast AM, Muller AJ and
Witte ON: Tyrosine kinase activity and transformation potency of
bcr-abl oncogene products. Science. 247:1079–1082. 1990. View Article : Google Scholar : PubMed/NCBI
|
|
3
|
Deininger MW, Vieira S, Mendiola R,
Schultheis B, Goldman JM and Melo JV: BCR-ABL tyrosine kinase
activity regulates the expression of multiple genes implicated in
the pathogenesis of chronic myeloid leukemia. Cancer Res.
60:2049–2055. 2000.PubMed/NCBI
|
|
4
|
Hazlehurst LA, Bewry NN, Nair RR and
Pinilla-Ibarz J: Signaling networks associated with
BCR-ABL-dependent transformation. Cancer Control. 16:100–107.
2009.PubMed/NCBI
|
|
5
|
Waller CF: Imatinib mesylate. Recent
Results Cancer Res. 201:1–25. 2014. View Article : Google Scholar : PubMed/NCBI
|
|
6
|
Roche-Lestienne C, Soenen-Cornu V,
Grardel-Duflos N, Laï JL, Philippe N, Facon T, Fenaux P and
Preudhomme C: Several types of mutations of the Abl gene can be
found in chronic myeloid leukemia patients resistant to STI571, and
they can pre-exist to the onset of treatment. Blood. 100:1014–1018.
2002. View Article : Google Scholar : PubMed/NCBI
|
|
7
|
Kantarjian HM, Talpaz M, O'Brien S, Giles
F, Garcia-Manero G, Faderl S, Thomas D, Shan J, Rios MB and Cortes
J: Dose escalation of imatinib mesylate can overcome resistance to
standard-dose therapy in patients with chronic myelogenous
leukemia. Blood. 101:473–475. 2003. View Article : Google Scholar
|
|
8
|
Ursan ID, Jiang R, Pickard EM, Lee TA, Ng
D and Pickard AS: Emergence of BCR-ABL kinase domain mutations
associated with newly diagnosed chronic myeloid leukemia: A
meta-analysis of clinical trials of tyrosine kinase inhibitors. J
Manag Care Spec Pharm. 21:114–122. 2015. View Article : Google Scholar : PubMed/NCBI
|
|
9
|
Campbell LJ, Patsouris C, Rayeroux KC,
Somana K, Januszewicz EH and Szer J: BCR/ABL amplification in
chronic myelocytic leukemia blast crisis following imatinib
mesylate administration. Cancer Genet Cytogenet. 139:30–33. 2002.
View Article : Google Scholar
|
|
10
|
Phan CL, Megat Baharuddin PJNB, Chin LP,
Zakaria Z, Yegappan S, Sathar J, Tan S-M, Purushothaman V and Chang
KM: Amplification of BCR-ABL and t(3;21) in a patient with blast
crisis of chronic myelogenous leukemia. Cancer Genet Cytogenet.
180:60–64. 2008. View Article : Google Scholar
|
|
11
|
Roginskaya V, Zuo S, Caudell E, Nambudiri
G, Kraker AJ and Corey SJ: Therapeutic targeting of Src-kinase Lyn
in myeloid leukemic cell growth. Leukemia. 13:855–861. 1999.
View Article : Google Scholar : PubMed/NCBI
|
|
12
|
Quentmeier H, Eberth S, Romani J, Zaborski
M and Drexler HG: BCR-ABL1-independent PI3Kinase activation causing
imatinib-resistance. J Hematol Oncol. 4:62011. View Article : Google Scholar : PubMed/NCBI
|
|
13
|
Petrak J, Toman O, Simonova T, Halada P,
Cmejla R, Klener P and Zivny J: Identification of molecular targets
for selective elimination of TRAIL-resistant leukemia cells. From
spots to in vitro assays using TOP15 charts. Proteomics.
9:5006–5015. 2009. View Article : Google Scholar : PubMed/NCBI
|
|
14
|
Lorkova L, Scigelova M, Arrey TN, Vit O,
Pospisilova J, Doktorova E, Klanova M, Alam M, Vockova P, Maswabi
B, et al: Detailed functional and proteomic characterization of
fludarabine resistance in mantle cell lymphoma cells. PLoS One.
10:e01353142015. View Article : Google Scholar : PubMed/NCBI
|
|
15
|
Klanova M, Soukup T, Jaksa R, Molinsky J,
Lateckova L, Maswabi BCL, Prukova D, Brezinova J, Michalova K,
Vockova P, et al: Mouse models of mantle cell lymphoma, complex
changes in gene expression and phenotype of engrafted MCL cells:
Implications for preclinical research. Lab Invest. 94:806–817.
2014. View Article : Google Scholar : PubMed/NCBI
|
|
16
|
Poláková KM, Polívková V, Rulcová J,
Klamová H, Jurcek T, Dvoráková D, Zácková D, Pospísil Z, Mayer J
and Moravcová J: Constant BCR-ABL transcript level ≥0.1% (IS) in
patients with CML responding to imatinib with complete cytogenetic
remission may indicate mutation analysis. Exp Hematol. 38:20–26.
2010. View Article : Google Scholar
|
|
17
|
Machova Polakova K, Kulvait V, Benesova A,
Linhartova J, Klamova H, Jaruskova M, de Benedittis C, Haferlach T,
Baccarani M, Martinelli G, et al: Next-generation deep sequencing
improves detection of BCR-ABL1 kinase domain mutations emerging
under tyrosine kinase inhibitor treatment of chronic myeloid
leukemia patients in chronic phase. J Cancer Res Clin Oncol.
141:887–899. 2015. View Article : Google Scholar
|
|
18
|
Kiedrowski L: Cytosolic zinc release and
clearance in hippocampal neurons exposed to glutamate - the role of
pH and sodium. J Neurochem. 117:231–243. 2011. View Article : Google Scholar : PubMed/NCBI
|
|
19
|
Kinsella BT, O'Mahony DJ and Fitzgerald
GA: The human thromboxane A2 receptor α isoform
(TPα) functionally couples to the G proteins
Gq and G11 in vivo and is activated by the
isoprostane 8-epi prostaglandin F2α. J Pharmacol Exp Ther.
281:957–964. 1997.PubMed/NCBI
|
|
20
|
Grynkiewicz G, Poenie M and Tsien RY: A
new generation of Ca2+ indicators with greatly improved
fluorescence properties. J Biol Chem. 260:3440–3450.
1985.PubMed/NCBI
|
|
21
|
White H, Deprez L, Corbisier P, Hall V,
Lin F, Mazoua S, Trapmann S, Aggerholm A, Andrikovics H, Akiki S,
et al: A certified plasmid reference material for the
standardisation of BCR-ABL1 mRNA quantification by real-time
quantitative PCR. Leukemia. 29:369–376. 2015. View Article : Google Scholar
|
|
22
|
Livak KJ and Schmittgen TD: Analysis of
relative gene expression data using real-time quantitative PCR and
the 2−ΔΔCt method. Methods. 25:402–408. 2001. View Article : Google Scholar
|
|
23
|
Kuriyama K, Gale RP, Tomonaga M, Ikeda S,
Yao E, Klisak I, Whelan K, Yakir H, Ichimaru M, Sparkes RS, et al:
CML-T1: A cell line derived from T-lymphocyte acute phase of
chronic myelogenous leukemia. Blood. 74:1381–1387. 1989.PubMed/NCBI
|
|
24
|
Drexler HG: Leukemia cell lines: In vitro
models for the study of chronic myeloid leukemia. Leuk Res.
18:919–927. 1994. View Article : Google Scholar : PubMed/NCBI
|
|
25
|
Hochhaus A, Kreil S, Corbin AS, La Rosée
P, Müller MC, Lahaye T, Hanfstein B, Schoch C, Cross NCP, Berger U,
et al: Molecular and chromosomal mechanisms of resistance to
imatinib (STI571) therapy. Leukemia. 16:2190–2196. 2002. View Article : Google Scholar : PubMed/NCBI
|
|
26
|
Branford S, Rudzki Z, Walsh S, Grigg A,
Arthur C, Taylor K, Herrmann R, Lynch KP and Hughes TP: High
frequency of point mutations clustered within the adenosine
triphosphate-binding region of BCR/ABL in patients with chronic
myeloid leukemia or Ph-positive acute lymphoblastic leukemia who
develop imatinib (STI571) resistance. Blood. 99:3472–3475. 2002.
View Article : Google Scholar : PubMed/NCBI
|
|
27
|
Kominsky DJ, Klawitter J, Brown JL, Boros
LG, Melo JV, Eckhardt SG and Serkova NJ: Abnormalities in glucose
uptake and metabolism in imatinib-resistant human BCR-ABL-positive
cells. Clin Cancer Res. 15:3442–3450. 2009. View Article : Google Scholar : PubMed/NCBI
|
|
28
|
Adamia S, Pilarski PM, Bar-Natan M, Stone
RM and Griffin JD: Alternative splicing in chronic myeloid leukemia
(CML): A novel therapeutic target? Curr Cancer Drug Targets.
13:735–748. 2013. View Article : Google Scholar : PubMed/NCBI
|
|
29
|
Reczek D, Berryman M and Bretscher A:
Identification of EBP50: A PDZ-containing phosphoprotein that
associates with members of the ezrin-radixin-moesin family. J Cell
Biol. 139:169–179. 1997. View Article : Google Scholar : PubMed/NCBI
|
|
30
|
Ardura JA and Friedman PA: Regulation of G
protein-coupled receptor function by Na+/H+
exchange regulatory factors. Pharmacol Rev. 63:882–900. 2011.
View Article : Google Scholar : PubMed/NCBI
|
|
31
|
Li M, Wang W, Soroka CJ, Mennone A, Harry
K, Weinman EJ and Boyer JL: NHERF-1 binds to Mrp2 and regulates
hepatic Mrp2 expression and function. J Biol Chem. 285:19299–19307.
2010. View Article : Google Scholar : PubMed/NCBI
|
|
32
|
He P and Yun CC: Mechanisms of the
regulation of the intestinal Na+/H+ exchanger
NHE3. J Biomed Biotechnol. 2010:2380802010.
|
|
33
|
Obukhov AG and Nowycky MC: TRPC5
activation kinetics are modulated by the scaffolding protein
ezrin/radixin/moesin-binding phosphoprotein-50 (EBP50). J Cell
Physiol. 201:227–235. 2004. View Article : Google Scholar : PubMed/NCBI
|
|
34
|
Tang Y, Tang J, Chen Z, Trost C, Flockerzi
V, Li M, Ramesh V and Zhu MX: Association of mammalian Trp4 and
phospholipase C isozymes with a PDZ domain-containing protein,
NHERF. J Biol Chem. 275:37559–37564. 2000. View Article : Google Scholar : PubMed/NCBI
|
|
35
|
Wheeler DS, Barrick SR, Grubisha MJ,
Brufsky AM, Friedman PA and Romero G: Direct interaction between
NHERF1 and Frizzled regulates β-catenin signaling. Oncogene.
30:32–42. 2011. View Article : Google Scholar
|
|
36
|
Karvar S, Suda J, Zhu L and Rockey DC:
Distribution dynamics and functional importance of NHERF1 in
regulation of Mrp-2 trafficking in hepatocytes. Am J Physiol Cell
Physiol. 307:C727–C737. 2014. View Article : Google Scholar : PubMed/NCBI
|
|
37
|
Bosch I and Croop J: P-glycoprotein
multidrug resistance and cancer. Biochim Biophys Acta.
1288:F37–F54. 1996.PubMed/NCBI
|
|
38
|
Canitrot Y, Lahmy S, Buquen JJ, Canitrot D
and Lautier D: Functional study of multidrug resistance with
fluorescent dyes. Limits of the assay for low levels of resistance
and application in clinical samples. Cancer Lett. 106:59–68. 1996.
View Article : Google Scholar : PubMed/NCBI
|
|
39
|
Donowitz M, Cha B, Zachos NC, Brett CL,
Sharma A, Tse CM and Li X: NHERF family and NHE3 regulation. J
Physiol. 567:3–11. 2005. View Article : Google Scholar : PubMed/NCBI
|
|
40
|
Garciarena CD, Youm JB, Swietach P and
Vaughan-Jones RD: H+-activated Na+ influx in
the ventricular myocyte couples
Ca2+-signalling to intracellular pH. J Mol
Cell Cardiol. 61:51–59. 2013. View Article : Google Scholar : PubMed/NCBI
|
|
41
|
Rich IN, Worthington-White D, Garden OA
and Musk P: Apoptosis of leukemic cells accompanies reduction in
intracellular pH after targeted inhibition of the
Na+/H+ exchanger. Blood. 95:1427–1434.
2000.PubMed/NCBI
|
|
42
|
Pinton P, Ferrari D, Magalhães P,
Schulze-Osthoff K, Di Virgilio F, Pozzan T and Rizzuto R: Reduced
loading of intracellular Ca2+ stores and downregulation
of capacitative Ca2+ influx in Bcl-2-overexpressing
cells. J Cell Biol. 148:857–862. 2000. View Article : Google Scholar : PubMed/NCBI
|
|
43
|
Condrescu M, Opuni K, Hantash BM and
Reeves JP: Cellular regulation of sodium-calcium exchange. Ann NY
Acad Sci. 976:214–223. 2002. View Article : Google Scholar : PubMed/NCBI
|
|
44
|
Iwamoto T, Watanabe Y, Kita S and
Blaustein MP: Na+/Ca2+ exchange inhibitors: A
new class of calcium regulators. Cardiovasc Hematol Disord Drug
Targets. 7:188–198. 2007. View Article : Google Scholar : PubMed/NCBI
|
|
45
|
Thastrup O, Cullen PJ, Drøbak BK, Hanley
MR and Dawson AP: Thapsigargin, a tumor promoter, discharges
intracellular Ca2+ stores by specific inhibition of the
endoplasmic reticulum Ca2+-ATPase. Proc Natl Acad Sci
USA. 87:2466–2470. 1990. View Article : Google Scholar
|
|
46
|
Inesi G, Hua S, Xu C, Ma H, Seth M, Prasad
AM and Sumbilla C: Studies of Ca2+ ATPase (SERCA)
inhibition. J Bioenerg Biomembr. 37:365–368. 2005. View Article : Google Scholar
|
|
47
|
Beeler TJ, Jona I and Martonosi A: The
effect of ionomycin on calcium fluxes in sarcoplasmic reticulum
vesicles and liposomes. J Biol Chem. 254:6229–6231. 1979.PubMed/NCBI
|
|
48
|
Triggle DJ: L-type calcium channels. Curr
Pharm Des. 12:443–457. 2006. View Article : Google Scholar : PubMed/NCBI
|
|
49
|
Hupe DJ, Boltz R, Cohen CJ, Felix J, Ham
E, Miller D, Soderman D and Van Skiver D: The inhibition of
receptor-mediated and voltage-dependent calcium entry by the
antiproliferative L-651,582. J Biol Chem. 266:10136–10142.
1991.PubMed/NCBI
|
|
50
|
Alessandro R, Fontana S, Giordano M,
Corrado C, Colomba P, Flugy AM, Santoro A, Kohn EC and De Leo G:
Effects of carboxyamidotriazole on in vitro models of
imatinib-resistant chronic myeloid leukemia. J Cell Physiol.
215:111–121. 2008. View Article : Google Scholar
|
|
51
|
Perabo FG, Wirger A, Kamp S, Lindner H,
Schmidt DH, Müller SC and Kohn EC: Carboxyamido-triazole (CAI), a
signal transduction inhibitor induces growth inhibition and
apoptosis in bladder cancer cells by modulation of Bcl-2.
Anticancer Res. 24:2869–2877. 2004.PubMed/NCBI
|
|
52
|
Guo L, Ye C, Chen W, Ye H, Zheng R, Li J,
Yang H, Yu X and Zhang D: Anti-inflammatory and analgesic potency
of carboxy-amidotriazole, a tumorostatic agent. J Pharmacol Exp
Ther. 325:10–16. 2008. View Article : Google Scholar : PubMed/NCBI
|
|
53
|
Rovira P, Mascarell L and Truffa-Bachi P:
The impact of immunosuppressive drugs on the analysis of T cell
activation. Curr Med Chem. 7:673–692. 2000. View Article : Google Scholar : PubMed/NCBI
|
|
54
|
Maguire O, Tornatore KM, O'Loughlin KL,
Venuto RC and Minderman H: Nuclear translocation of nuclear factor
of activated T cells (NFAT) as a quantitative pharmacodynamic
parameter for tacrolimus. Cytometry A. 83:1096–1104. 2013.
View Article : Google Scholar : PubMed/NCBI
|
|
55
|
An SM, Ding QP and Li LS: Stem cell
signaling as a target for novel drug discovery: Recent progress in
the WNT and Hedgehog pathways. Acta Pharmacol Sin. 34:777–783.
2013. View Article : Google Scholar : PubMed/NCBI
|
|
56
|
Gregory MA, Phang TL, Neviani P,
Alvarez-Calderon F, Eide CA, O'Hare T, Zaberezhnyy V, Williams RT,
Druker BJ, Perrotti D, et al: Wnt/Ca2+/NFAT signaling
maintains survival of Ph+ leukemia cells upon inhibition
of Bcr-Abl. Cancer Cell. 18:74–87. 2010. View Article : Google Scholar : PubMed/NCBI
|
|
57
|
Krebs J, Agellon LB and Michalak M:
Ca2+ homeostasis and endoplasmic reticulum (ER) stress:
An integrated view of calcium signaling. Biochem Biophys Res
Commun. 460:114–121. 2015. View Article : Google Scholar : PubMed/NCBI
|
|
58
|
Bilmen JG, Wootton LL and Michelangeli F:
The inhibition of the sarcoplasmic/endoplasmic reticulum
Ca2+-ATPase by macrocyclic lactones and cyclosporin A.
Biochem J. 366:255–263. 2002. View Article : Google Scholar : PubMed/NCBI
|
|
59
|
Chelu MG, Danila CI, Gilman CP and
Hamilton SL: Regulation of ryanodine receptors by FK506 binding
proteins. Trends Cardiovasc Med. 14:227–234. 2004. View Article : Google Scholar : PubMed/NCBI
|
|
60
|
Mahon FX, Belloc F, Lagarde V, Chollet C,
Moreau-Gaudry F, Reiffers J, Goldman JM and Melo JV: MDR1 gene
overexpression confers resistance to imatinib mesylate in leukemia
cell line models. Blood. 101:2368–2373. 2003. View Article : Google Scholar : PubMed/NCBI
|
|
61
|
Nobili S, Landini I, Giglioni B and Mini
E: Pharmacological strategies for overcoming multidrug resistance.
Curr Drug Targets. 7:861–879. 2006. View Article : Google Scholar : PubMed/NCBI
|