Introduction
The International Agency for Research on Cancer
(IARC) reported that colorectal cancer (CRC) is the third most
commonly diagnosed cancer and the fourth leading cause of
cancer-related death worldwide. Drug combinations and
administration protocols, and the development of molecular targeted
drugs have greatly improved the chemotherapeutic efficiency for
CRC.
Fluoropyrimidines, especially 5-fluorouracil (5-FU),
remain the most important chemotherapeutic agents in the treatment
of CRC. 5-FU is reported to induce cellular toxicity by inhibiting
its target enzyme, thymidylate synthase (TS); it also induces cell
cycle arrest and apoptosis via the incorporation of
fluoronucleotides into RNA and DNA leading to thymidylate depletion
(1). 5-FU is the central component
in the FOLFIRI regimen with the addition of irinotecan, and the
FOLFOX regimen with the addition of oxaliplatin. These combination
chemotherapies have resulted in improved response rates and
significant improvements in progression-free and overall survival
(2,3). However, despite recent advances in CRC
chemotherapy, the occurrence of drug resistance hinders effective
control of the disease. Moreover, most advanced CRC patients cannot
be cured with these refined chemotherapies.
Histone acetylation and deacetylation are biological
processes that regulate the modification of chromatin structures
and are important for gene regulation. Recently, a number of
anticancer drugs such as inhibitors of DNA methyltransferase (DNMT)
and histone deacetylase (HDAC) have been developed. DNMT and HDAC
inhibitors cause DNA demethylation and repressive complex
disintegration. This leads to the reactivation of critical genes
and the reversal of genome-wide epigenetic alterations in cancer
through resetting multiple cellular processes including, lineage
commitment, immunomodulation, major cell signaling pathways, cell
proliferation, and cell death (4,5).
Overexpression or under-expression of pro-apoptotic and
anti-apoptotic molecules, such as p53 and bcl-2, can be modulated
by various HDAC inhibitors (6).
Inhibitors of HDACs are known to exert effects including apoptosis,
retardation of cell cycle progression, and cancer cell
differentiation, which are specific depending on cancer cell type
(7,8). Therefore, a number of HDAC inhibitors
have been investigated clinically. Vorinostat, entinostat,
panobinostat, valproic acid, depsipeptide, and belinostat have been
approved and clinically used. HDAC inhibitors are also used in
combination therapy with DNMT inhibitors and other HDAC inhibitors
(9). A basic study on combinations
of valproic acid and gemcitabine has also been conducted (10).
DNMT inhibitors, such as 5-azacytidine,
5-aza-2′-deoxycytidine, and zebularine have been studied for
various cancers in clinical trials (11). The therapeutic benefits of HDAC
inhibitors have been verified as a monotherapy for cutaneous T-cell
lymphoma (CTCL), and in other malignancies (12). Epigenetic agents are also known to
have the ability to reverse the resistance of anticancer drugs
(13,14). Furthermore, synergistic or additive
effects have been reported when combining epigenetic agents with
existing anticancer drugs (15–17).
Depsipeptide (Dep, also known as FR901228, FK228 and
romidepsin), isolated from Chromobacterium violaceum strain
WB968, is a unique bicyclic peptide with a non-cysteine disulfide
bridge. It is a stable prodrug, which is activated by reduction in
cancer cells, to inhibit HDAC class I enzymes, and has been shown
to convert H-ras-transformed NIH 3T3 cells to normal morphology.
Thus, Dep is a promising anticancer agent, and indeed, has been
approved by the FDA for the treatment for CTCL and peripheral
T-cell lymphoma (18,19). The glutathione-mediated activation
also implicates its clinical usefulness for counteracting
glutathione-mediated drug resistance in chemotherapy (20).
In addition to their use as monotherapy, there are
several studies on the effects and mechanisms of the combination of
5-FU and HDAC inhibitors for CRC treatment. Lee et al
reported that trichostatin A enhanced 5-FU cytotoxicity by
downregulating the expression of both TYMS mRNA and TS protein in
colon cancer cells (21). Tumber
et al reported that belinostat, an HDAC inhibitor,
synergized with 5-FU to inhibit colon cancer cell growth in
vitro and in vivo, and this combination therapy
increased DNA fragmentation and poly(ADP-ribose) polymerase
cleavage and downregulated TYMS in HCT116 cells (22). Di Gennaro et al found that
modulation of TYMS and p53 expression by vorinostat resulted in
synergistic antitumor effects in combination with 5-FU or
raltitrexed (23). Fazzone et
al reported that panobinostat suppressed TYMS gene expression
and synergized with fluoropyrimidines in colon cancer cells
(24). Little is known concerning
the combinatorial effects of 5-FU and Dep for CRC, which prompted
us to investigate the combination of HDAC inhibitors, namely, Dep,
apicidin, and oxamflatin, with 5-FU. We previously found that among
these HDAC inhibitors, Dep potentiated the cytotoxicity of 5-FU
against human colon cancer cells, HCT-116.
Thus, in the present study, we aimed to evaluate the
mode of the combined effect of 5-FU and Dep in HCT-116 cells (i.e.,
additive or synergistic), and to elucidate the genetic mechanism of
the drug-drug interaction in a cell-based model using microarray
analysis.
Materials and methods
Cell culture and reagents
Human colon carcinoma HCT-116 (no. CCL-247), HT29
(no. HTB-38) and SW48 cell lines (no. CCL-231) [all from American
Type Culture Collection (ATCC), Manassas, VA, USA] were cultured in
Dulbecco's modified Eagle's medium (DMEM; 4.5 g/l D-glucose; Gibco,
Grand Island, NY, USA) and supplemented with 10% fetal bovine serum
(HyClone, South Logan, VT, USA) and antibiotics (Gibco) at 37°C in
a CO2 incubator. Dep was purchased from Selleck
Chemicals LLC (Houston, TX, USA). 5-FU was purchased from Sigma
Chemical Co. (St. Louis, MO, USA). All other chemicals used were of
the highest grade available.
Drug exposure
HCT-116 cells were exposed for 7 days to either
vehicle alone, 5-FU alone, Dep alone, or a combination of 5-FU and
Dep for assessment of inhibition of colony formation and gene
expression analysis. The concentrations used for colony formation
analysis were 0.875, 1.25, 1.75 and 2.5 µM for 5-FU; 0.5, 1,
1.5 and 2 nM for Dep; and 0.875 µM 5-FU plus Dep (0.1 or 1
nM), 1.25 µM 5-FU plus Dep (0.1 or 1 nM), and 1.75 µM
5-FU plus Dep (0.1 or 1 nM). Concentrations used for gene
expression analysis and caspase-3 activation assay were 1.75
µM for 5-FU; 1 nM for Dep; and 1.75 µM 5-FU plus Dep
1 nM.
HT29 cells were exposed for 10 days to either
vehicle alone, 5-FU alone, Dep alone, or a combination of 5-FU and
Dep for assessment of inhibition of colony formation. The
concentrations used for colony formation analysis were 0.313,
0.438, 0.625 and 0.875 µM for 5-FU; 0.125, 0.25, 0.375 and
0.5 nM for Dep; and 0.313 µM 5-FU plus Dep (0.375 nM), 0.438
µM 5-FU plus Dep (0.375 nM), and 0.625 µM 5-FU plus
Dep (0.375 nM).
SW48 cells were exposed for 7 days to either
vehicle-only, 5-FU alone, Dep alone, or a combination of 5-FU and
Dep for crystal violet assay. The concentrations used for the
crystal violet assay were, 0.438, 0.625, 0.875 and 1.75 µM
for 5-FU; 0.125, 0.25, 0.375 and 0.5 nM for Dep; and 0.438
µM 5-FU plus Dep (0.2 nM), 0.625 µM 5-FU plus Dep
(0.2 nM), and 0.875 µM 5-FU plus Dep (0.2 nM).
Colony formation assay
HCT-116 cells were trypsinized, counted, and seeded
for the colony formation assay in 60-mm dishes at 20,000
cells/dish. HT29 cells were trypsinized, counted, and seeded for
the colony formation assay in 60-mm dishes at 10,000 cells/dish.
After incubation for 7 to 10 days, the colonies were stained with
crystal violet and the numbers of positive colonies were counted.
Colonies containing more than 50 cells were regarded as positive
and were scored, and each assay was conducted in triplicate and
three separate assays were performed on three different days.
Crystal violet assay
We measured cell viability in SW48 cells by direct
staining of the cells using crystal violet assay (25) as SW48 cells have poor colony-forming
ability. SW48 cells were trypsinized, counted, and seeded for the
crystal violet assay in 6-well plate at 50,000 cells/well. After
incubation for 7 days, the medium was removed and any adherent
cells were fixed to the plate with 10% formaldehyde in PBS. The
cells were then stained with an aqueous solution of 0.5% crystal
violet followed by elution of the dye with 33% aqueous acetic acid.
Absorbance at 550 nm was determined with a micro-plate reader,
Infinite F500 (Tecan Group Ltd., Männedorf, Switzerland). Each
assay was conducted in triplicate and three separate assays were
performed on three different days.
Caspase-3/7 activation assay
Luminescent caspase-3/7 activation assay was
conducted according to the manufacturer's instructions
(Caspase-Glo™ 3/7 assay; Promega, Madison, WI, USA). HCT-116 cells
were inoculated into each well of a white-walled 96-well plate
(4,000 cells/well), treatment reagents were added and incubated was
carried out for 0, 24 and 48 h. After incubation for 1 h with
Caspase-Glo™ reagent, the enzymatic activity of caspase-3/7 was
measured using a microplate reader, Infinite F500 (Tecan Group
Ltd.). The background luminescence associated with the cell culture
and assay reagent (blank reaction) was subtracted from the
experimental values. Mean values of four replicates were used to
represent caspase-3/7 activity. To enable normalization of data to
total cellular protein content, the Lowry assay (26) was conducted for all samples
according to the manufacturer's instructions (Protein Assay Lowry
kit; Nacalai Tesque, Kyoto, Japan). Data are expressed as relative
light units (RLU)/µg of protein.
RNA extraction and quantitative
reverse-transcription polymerase chain reaction (qRT-PCR)
Total RNA was extracted from three independent
HCT-116 cell cultures using the Rneasy Mini kit following the
manufacturer's instructions (Qiagen, Dusseldorf, Germany). Total
RNAs (1 µg) were used for cDNA synthesis using a cDNA
synthesis kit (Roche, Basel, Switzerland). Using first-strand cDNA,
real-time PCR was performed using a 7500 Real-Time PCR system
(Applied Biosystems, Tokyo, Japan). The sequences of amplification
primers are shown in Table I.
 | Table INucleotide sequences of the
oligonucleotide primers used for determining mRNA levels in
quantitative real-time PCR. |
Table I
Nucleotide sequences of the
oligonucleotide primers used for determining mRNA levels in
quantitative real-time PCR.
| Accession no. | Gene symbol | Forward primer
(5′-3′) | Reverse primer
(3′-5′) |
|---|
| NM_001101 | ACTB |
GGCACCACACCTTCTACAATGAG |
GGATAGCACAGCCTGGATAGCA |
| NM_001188 | BAK1 |
TGAAAAATGGCTTCGGGGCAAGGC |
TCATGATTTGAAGAATCTTCGTACCA |
| NM_138763 | BAX |
GGCCCACCAGCTCTGAGCAGA |
GCCACGTGGGCGTCCCAAAGT |
| NM_000633 | BCL2 |
CGACTTCGCCGAGATGTCCAG |
ACTTGTGGCCCAGATAGGCACCCAG |
| NM_000389 | CDKN1A (p21) |
CAAGCTCTACCTTCCCACGG |
GGTAGAAATCTGTCATGCTGGTC |
| NM_000077 | CDKN2A (p16) |
ATGGAGCCTTCGGCTGACT |
ATCATCATGACCTGGATCGGC |
| NM_004964 | HDAC1 |
GCTCCATCCGTCCAGATAAC |
TGCCACAGAACCACCAGTAG |
| NM_002116 | HLA-A |
CAGCTTGTAAAGTGTGAGACAGC |
GGAAAGATGATTGGGGAGGGAG |
| NM_005514 | HLA-B |
GTAGGAGGAAGAGTTCAGGTGG |
ACATTATGCTAACAGGGACGCA |
| NM_002117 | HLA-C |
CTGGTTGTCCTAGCTGTCCTTG |
AGCTGTCTCAGGCTTTACAAGTG |
| NM_002121 | HLA-DPB1 |
TCCACCAACCTGATCCGTAATG |
AGAATCAGACTGTGCCTTCCAC |
| NM_002123 | HLA-DQB1 |
CAAAGGAGTCAGAAAGGGCTTC |
GGGGATGAAAGGAGATGACCTG |
| NM_019111 | HLA-DRA |
CCGATCACCAATGTACCTCCAG |
CAGGAAGGGGAGATAGTGGAAC |
| NM_002124 | HLA-DRB1 |
CTCACAGTGGAATGGAGAGCAC |
GAATAACTGCCAAGCAGGAAAGC |
| NM_000546 | TP53 |
GCTCAGATAGCGATGGTCTGG |
GATGGTGGTACAGTCAGAGCC |
| NM_001071 | TYMS |
GTTGCTGTGGTTTATCAAGGGAT |
TTGGTCAACTCCCTGTCCTG |
Microarray analysis
For DNA microarray analysis, total RNA (50 ng) was
labeled with cyanine-3 using a Low Input Quick Amp Labeling kit
(Agilent Technologies, Inc., Santa Clara, CA, USA). The labeled
targets were hybridized to SurePrint G3 Human 8×60K oligo DNA
microarrays and hybridized micro-arrays were scanned using an
Agilent Microarray Scanner (both from Agilent Technologies, Inc.).
Image analysis and raw array data generation were processed using
Feature Extraction software (Agilent Technologies, Inc.).
Normalization of the raw array data was performed using GeneSpring
software.
Gene ontology analysis
Following quantile normalization of the raw data,
data sets were further reduced by filtering noise of the signal,
including gIsSaturated, gIsFeatNonUnifOL, gIsFeatPopnOLg, and
gIsWellAboveBG.
Finally, we identified gene lists that showed at
least 1.5-fold upregulation or downregulation.
The PANTHER classification system (www.pantherdb.org/tools/genexAnalysis.jsp) was
used for functional classification of genes.
Mi et al discussed the procedure for
classification of proteins using PANTHER, a web tool for analyzing
protein family trees and functions (27). The overall process of PANTHER
Protein Library data generation consisted of three major steps:
family clustering, phylogenetic tree building, and annotation of
tree nodes. The requirements for being family clusters in PANTHER
are as follows:
The family must contain at least five members among
which at least one gene must be listed as a Gene Ontology (GO)
reference genome.
In order to support phylogenetic inference, the
family should be aligned with high quality sequence data.
A certain length of aligned sequences stored in at
least 30 sites should be aligned across 75% or more of the family
members for creation of proper family clusters.
A statistical enrichment test was performed for each
molecular function, biological process, or cellular component. The
genes associated with a particular ontology term were evaluated
according to the likelihood of the numerical values of genes that
were drawn randomly from the overall distribution of values. The
Mann-Whitney U test was used to determine the P-value. A number of
genes, which were induced in large extent by our microarray
analysis, were classified according to a number of statistical
tests that were performed by the PANTHER classification system. As
a result, PANTHER classification concluded that induction of a
considerable number of major histocompatibility complex (MHC) class
II genes was a characteristic change in global gene expression
caused by the present drug combination of 5-FU and Dep (discussed
in Results). The details of using this tool are described in the
PANTHER user manual for PANTHER 9.0.
Statistical analysis
Data are represented as the mean ± standard error of
mean (SEM) and analyzed for statistical significance using one-way
analysis of variance (ANOVA) followed by the Tukey-Kramer test as a
post hoc test. A P-value of <0.05 was considered to indicate a
statistically significant result.
Results
Cellular sensitivity of the HCT-116 cells
to 5-FU
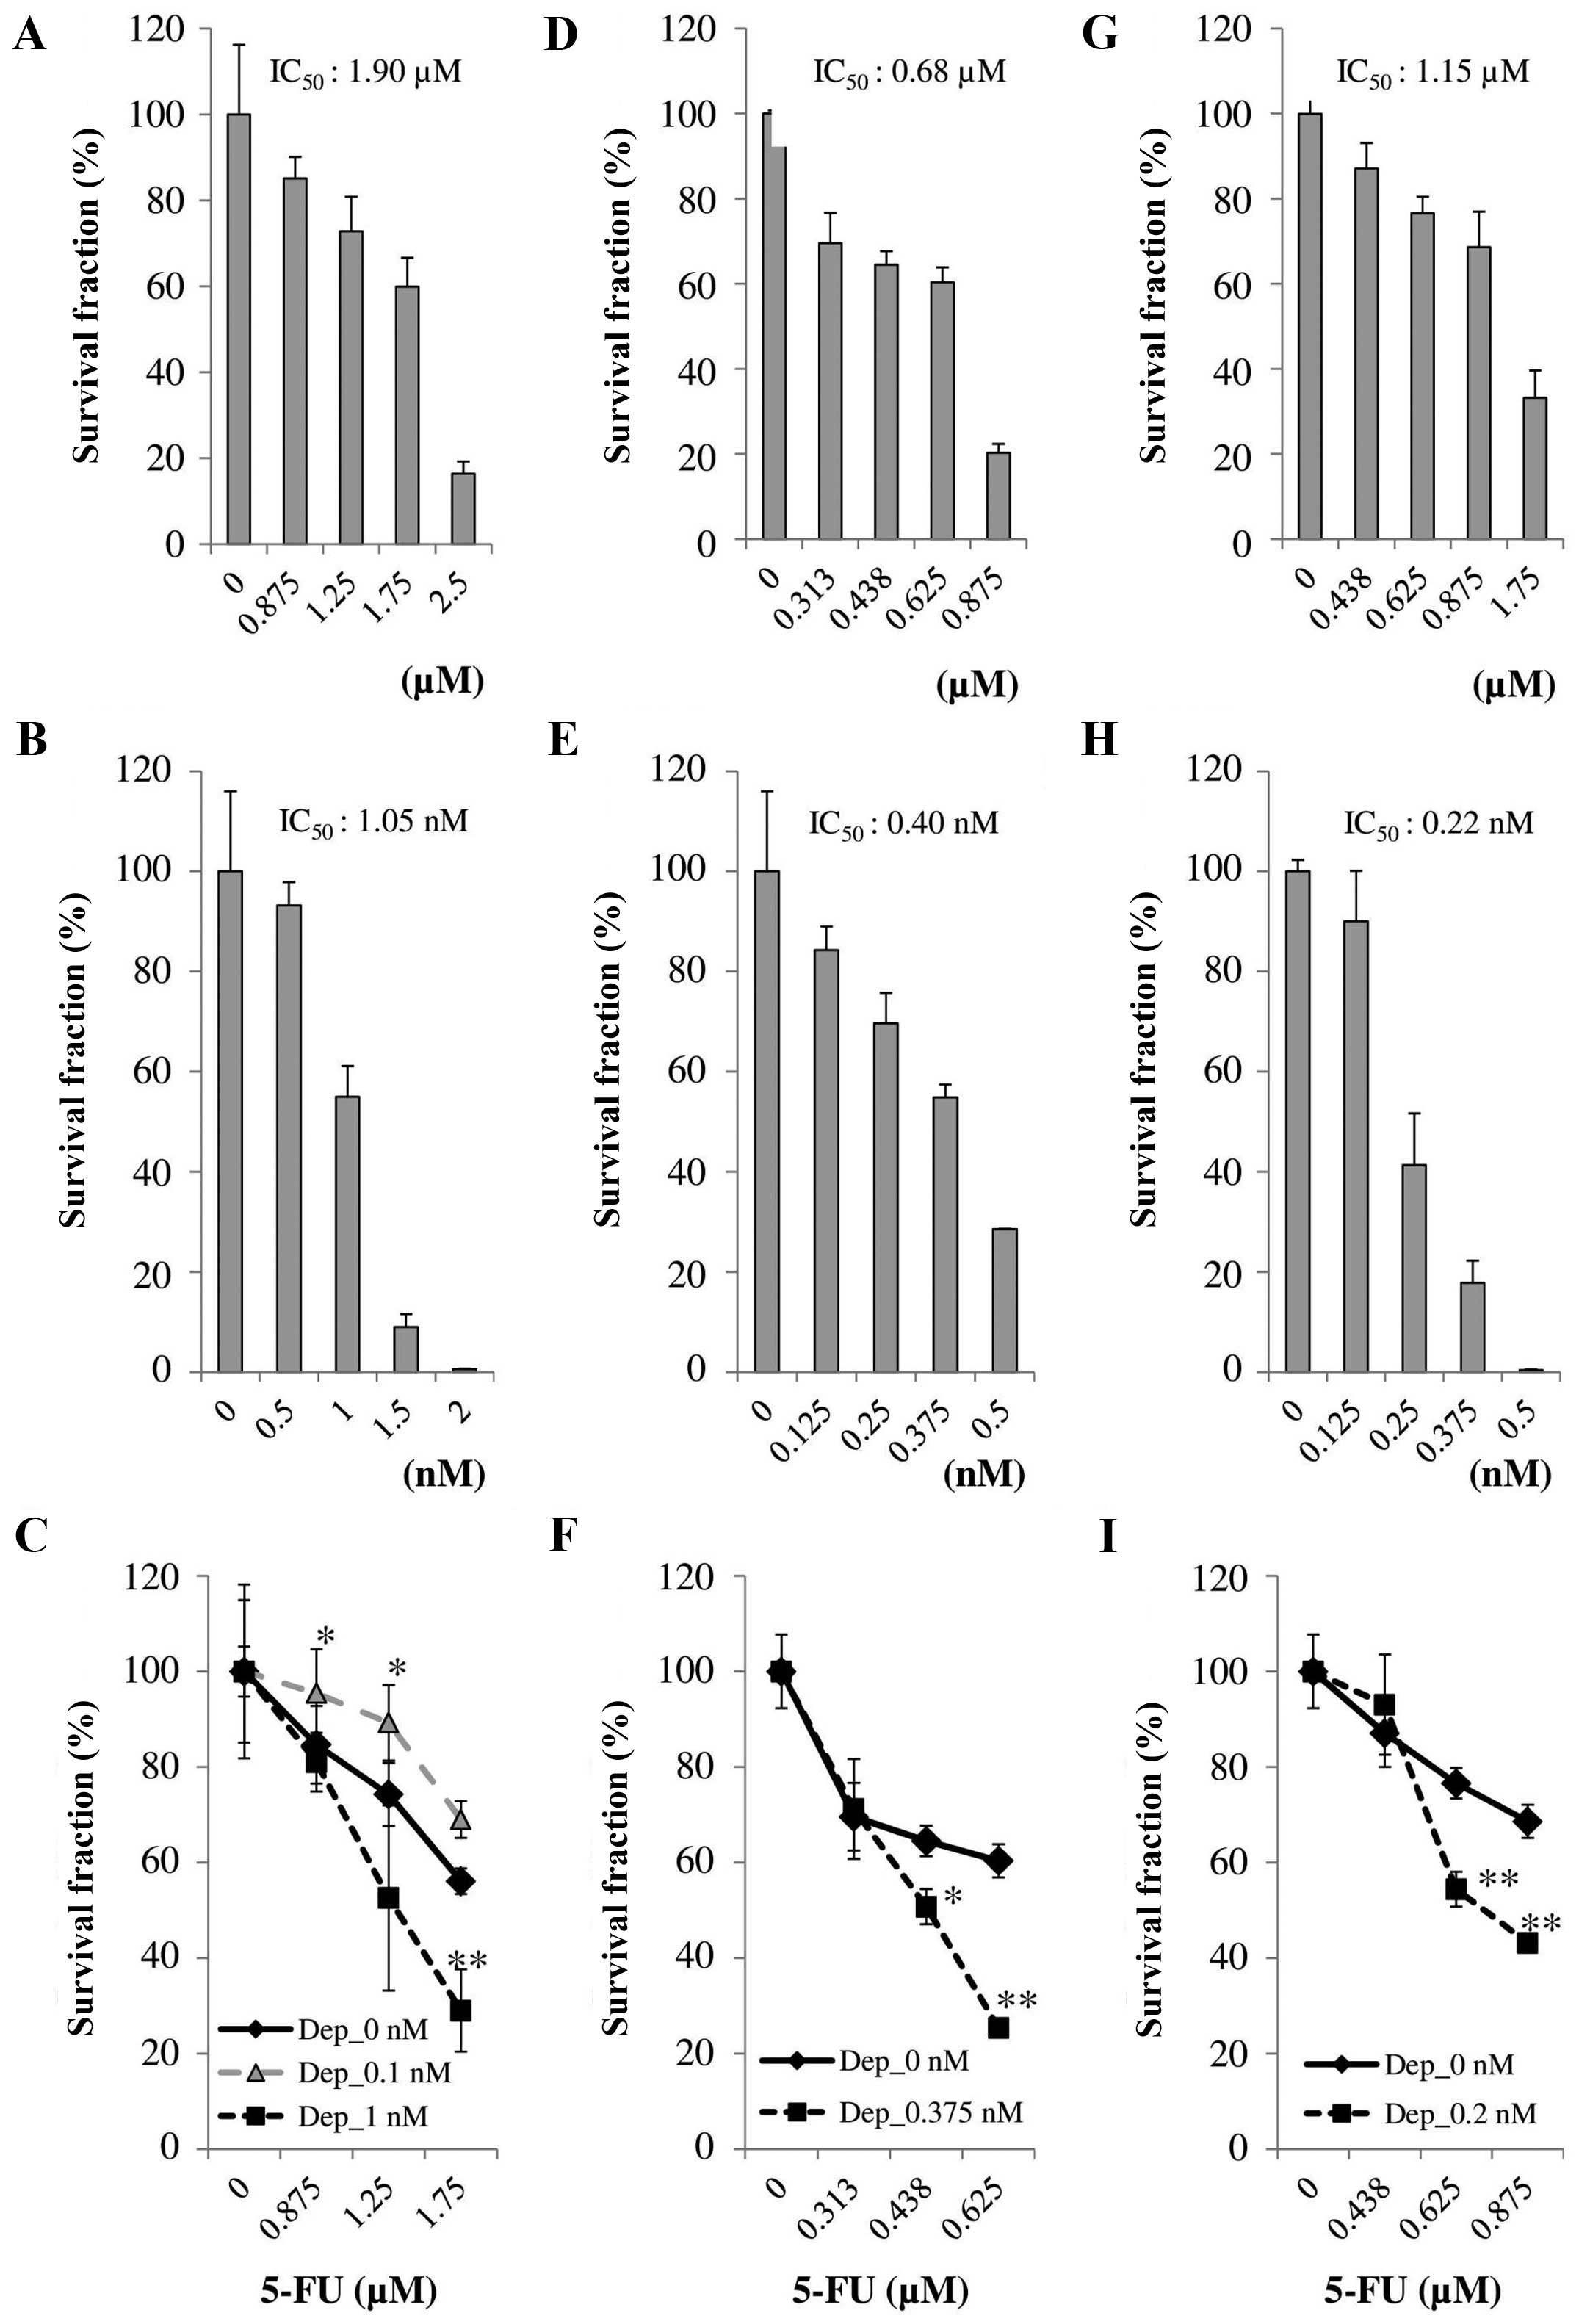
The approximate IC50 value of the HCT-116
cells to 5-FU was 1.90 µM. However, Dep was almost
2,000-fold active in terms of molar concentration to inhibit colony
formation ability of HCT-116 compared with 5-FU. Fig. 1A and B shows the dose-response
curves of 5-FU and Dep, respectively. Fig. 1C shows the reduction of survival
fraction for the combination of 5-FU and Dep, 5-FU alone, and Dep
alone. The combination of 1.75 µM 5-FU and 1 nM Dep
suppressed colony formation to 30% compared with vehicle-only. This
combination suppressed colony formation ability with statistical
significance compared with 5-FU only (P<0.01). HCT-116 cells
became less sensitive to 5-FU in combination with 0.1 nM Dep
compared with 5-FU only, which was not marked.
Cellular sensitivity of the HT29 cells to
5-FU
The approximate IC50 value of HT29 to
5-FU was 0.68 µM. However, Dep was almost 2,000-fold active
in terms of molar concentration to inhibit colony formation ability
of HT29 cells compared with 5-FU. Fig.
1D and E shows the dose-response curves of 5-FU and Dep,
respectively. Fig. 1F illustrates
the reduction in survival fraction for the combination of 5-FU and
Dep, 5-FU alone, and Dep alone. The combination of 0.625 µM
5-FU and 0.375 nM Dep suppressed colony formation to 35% compared
with vehicle-only. This combination suppressed colony formation
ability with statistical significance compared with 5-FU-only
(P<0.01).
Cellular sensitivity of the SW48 cells to
5-FU
The approximate IC50 value of SW48 to
5-FU was 1.15 µM. However, Dep was almost 5,000-fold active
in terms of molar concentration to inhibit cellular viability of
the SW48 cells compared with 5-FU. Fig.
1G and H shows the dose-response curves of 5-FU and Dep,
respectively. Fig. 1I illustrates
the reduction in survival fraction for the combination of 5-FU and
Dep, 5-FU alone, and Dep alone. The combination of 0.875 µM
5-FU and 0.2 nM Dep suppressed cellular viability to 25% compared
with vehicle alone. This combination suppressed cellular viability
with statistical significance compared with 5-FU alone
(P<0.01).
Caspase-3/7 activation in HCT-116 cells
following treatment with 5-FU (1.75 µM) alone, Dep (1 nM) alone,
and a combination of 5-FU and Dep
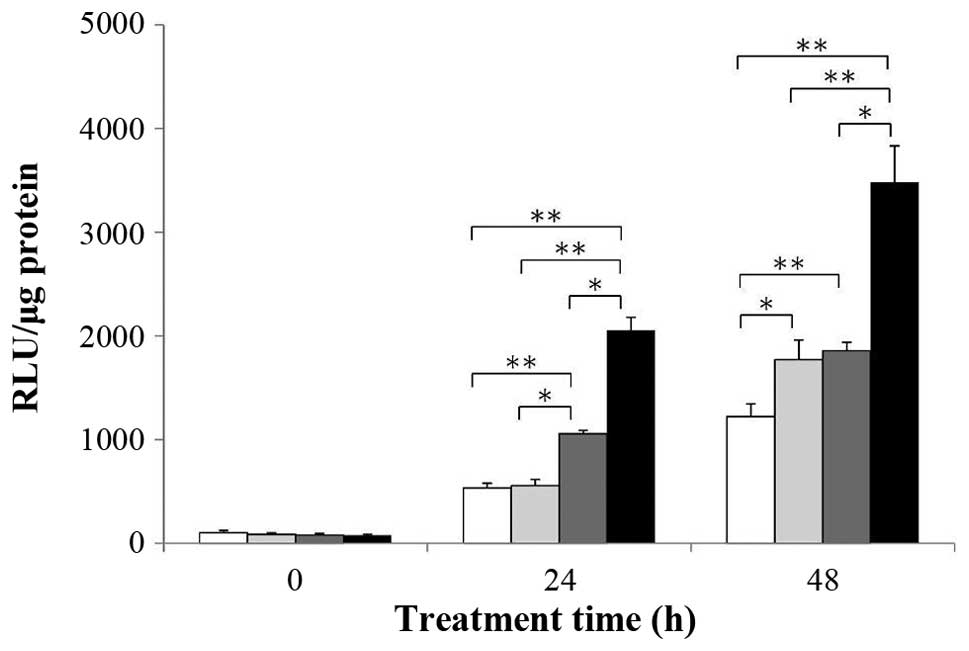
As shown in Fig. 2,
the time course of caspase-3/7 activation was examined in the
HCT-116 cells following treatment with 5-FU (1.75 µM) alone,
Dep (1 nM) alone, and the combination of 5-FU and Dep.
At 24 h, the combination of 5-FU and Dep markedly
enhanced caspase-3/7 activation compared to the vehicle control
(3.8-fold-change, P<0.01). Dep alone also showed a 2.0-fold
increase (P<0.01) compared to the vehicle control.
At 48 h, the combination of 5-FU and Dep increased
caspase-3/7 activation compared to the vehicle control
(2.8-fold-change, P<0.01). 5-FU alone and Dep alone slightly
increased caspase-3/7 activation compared to the vehicle control
(1.4-fold, P<0.05; and 1.5-fold, P<0.01, respectively).
Comparison of the gene expression profile
and gene ontology of the cells treated with the control and 5-FU
(1.75 µM) + Dep (1 nM) combination
To examine the gene expression profile after drug
exposure, we conducted a microarray analysis of the cells treated
for 7 days with the vehicle control, 5-FU alone, Dep alone, and the
combination of 5-FU with Dep as described in Materials and methods.
Results of the gene expression profile were analyzed by gene
ontology in order to clarify what mRNAs were upregulated (Table II) or down-regulated (Table III) after treatment with each drug
alone or with combination of 5-FU and Dep. To indicate the
biological significance of cellular processes affected by the
combination treatment, we listed the fold enrichment in descending
order in Tables II and III.
| Table IIGO analysis for comparison between
control and 5-FU (1.75 µM) + Dep (1 nM) combination. Top
1,000 genes with upregulation of over 1.5-fold-change. |
Table II
GO analysis for comparison between
control and 5-FU (1.75 µM) + Dep (1 nM) combination. Top
1,000 genes with upregulation of over 1.5-fold-change.
| Ontology terms
(class ID) | F1.75D1
| F1.75D0
| F0D1
|
|---|
| Fold
enrichment | P-value | Fold
enrichment | P-value | Fold
enrichment | P-value |
|---|
| PANTHER GO-Slim
Biological Process |
| Antigen processing
and presentation of peptide or polysaccharide antigen via MHC class
(GO:0002504) | 4.98 | 2.42E−02 | 0.56 | 1.00E+00 | >5.00 | 3.78E−03 |
| Phospholipid
metabolic process (GO:0006644) | 2.78 | 2.58E−03 | 1.77 | 1.00E+00 | 2.11 | 6.54E−01 |
| Cellular component
morphogenesis (GO:0032989) | 1.98 | 4.08E−03 | 1.66 | 5.20E−01 | 1.21 | 1.00E+00 |
| Anatomical
structure morphogenesis (GO:0009653) | 1.91 | 1.78E−03 | 1.66 | 1.75E−01 | 1.29 | 1.00E+00 |
| Death
(GO:0016265) | 1.86 | 7.23E−03 | 1.21 | 1.00E+00 | 1.32 | 1.00E+00 |
| Cell death
(GO:0008219) | 1.83 | 1.19E−02 | 1.18 | 1.00E+00 | 1.33 | 1.00E+00 |
| Apoptotic process
(GO:0006915) | 1.77 | 4.59E−02 | 1.21 | 1.00E+00 | 1.32 | 1.00E+00 |
| Cellular component
organization (GO:0016043) | 1.61 | 1.71E−03 | 1.44 | 1.71E−01 | 1.49 | 5.37E−02 |
|
Phosphate-containing compound metabolic
process (GO:0006796) | 1.57 | 4.78E−02 | 1.32 | 1.00E+00 | 1.88 | 2.19E−05 |
| Cellular component
organization or biogenesis (GO:0071840) | 1.52 | 9.82E−03 | 1.52 | 1.25E−02 | 1.43 | 1.37E−01 |
| Developmental
process (GO:0032502) | 1.41 | 1.22E−03 | 1.25 | 7.35E−01 | 1.25 | 6.68E−01 |
| Cell communication
(GO:0007154) | 1.39 | 1.64E−04 | 1.13 | 1.00E+00 | 1.13 | 1.00E+00 |
| Cellular process
(GO:0009987) | 1.22 | 2.39E−04 | 1.19 | 5.49E−03 | 1.23 | 1.72E−04 |
| PANTHER GO-Slim
Cellular Component |
| MHC protein
complex (GO:0042611) | >5.00 | 2.23E−05 | 1.13 | 1.00E+00 | >5.00 | 1.98E−05 |
| Intermediate
filament cytoskeleton (GO:0045111) | 3.70 | 3.58E−03 | 4.06 | 7.06E−04 | 1.15 | 1.00E+00 |
| Cytoskeleton
(GO:0005856) | 2.18 | 4.74E−08 | 1.68 | 8.97E−03 | 1.79 | 9.17E−04 |
| Actin cytoskeleton
(GO:0015629) | 2.14 | 1.70E−03 | 1.62 | 6.18E−01 | 1.36 | 1.00E+00 |
| Organelle
(GO:0043226) | 1.40 | 4.23E−03 | 1.44 | 1.18E−03 | 1.41 | 3.42E−03 |
| Intracellular
(GO:0005622) | 1.28 | 3.67E−02 | 1.32 | 7.91E−03 | 1.22 | 2.77E−01 |
| Cell part
(GO:0044464) | 1.25 | 4.49E−02 | 1.35 | 2.80E−04 | 1.17 | 8.30E−01 |
| PANTHER GO-Slim
Molecular Function |
| Hydrogen ion
transmembrane transporter activity (GO:0015078) | 4.62 | 3.24E−02 | 2.09 | 1.00E+00 | 1.56 | 1.00E+00 |
| Actin binding
(GO:0003779) | 2.63 | 9.73E−03 | 2.07 | 7.69E−01 | 1.70 | 1.00E+00 |
| Cytoskeletal
protein binding (GO:0008092) | 2.60 | 4.21E−04 | 1.88 | 7.31E−01 | 1.79 | 1.00E+00 |
| Structural
constituent of cytoskeleton (GO:0005200) | 2.06 | 1.11E−05 | 1.59 | 2.26E−01 | 1.42 | 1.00E+00 |
| Protein binding
(GO:0005515) | 1.37 | 1.30E−03 | 1.22 | 8.41E−01 | 1.14 | 1.00E+00 |
| Hydrolase activity
(GO:0016787) | 1.37 | 1.10E−02 | 1.29 | 2.30E−01 | 1.27 | 5.10E−01 |
| Table IIIGO analysis for comparison between
control and 5FU (1.75 µM) + Dep (1 nM) combination. Top
1,000 genes with downregulation over 1.5-fold-change. |
Table III
GO analysis for comparison between
control and 5FU (1.75 µM) + Dep (1 nM) combination. Top
1,000 genes with downregulation over 1.5-fold-change.
| Ontology terms
(class ID) | F1.75D1
| F1.75D0
| F0D1
|
|---|
| Fold
enrichment | P-value | Fold
enrichment | P-value | Fold
enrichment | P-value |
|---|
| PANTHER GO-Slim
biological Process |
| Chromatin
organization (GO:0006325) | 3.17 | 4.23E−07 | 1.02 | 1.00E+00 | 1.52 | 1.00E+00 |
| Organelle
organization (GO:0006996) | 1.99 | 6.67E−04 | 1.11 | 1.00E+00 | 1.19 | 1.00E+00 |
| Cell cycle
(GO:0007049) | 1.65 | 1.56E−03 | 1.03 | 1.00E+00 | 1.11 | 1.00E+00 |
| Cellular component
organization (GO:0016043) | 1.55 | 1.13E−02 | 1.16 | 1.00E+00 | 1.23 | 1.00E+00 |
| Cellular component
organization or biogenesis (GO:0071840) | 1.48 | 3.27E−02 | 1.16 | 1.00E+00 | 1.14 | 1.00E+00 |
| Transcription from
RNA polymerase II promoter (GO:0006366) | 1.43 | 1.80E−02 | 1.20 | 1.00E+00 | 1.61 | 1.41E−05 |
|
Nucleobase-containing compound metabolic
process (GO:0006139) | 1.41 | 6.86E−06 | 1.07 | 1.00E+00 | 1.27 | 3.06E−02 |
| RNA metabolic
process (GO:0016070) | 1.38 | 6.85E−03 | 1.09 | 1.00E+00 | 1.44 | 3.19E−04 |
| Transcription,
DNA-dependent (GO:0006351) | 1.38 | 3.81E−02 | 1.20 | 1.00E+00 | 1.64 | 4.53E−07 |
| Biological
regulation (GO:0065007) | 1.27 | 1.13E−02 | 1.24 | 4.79E−02 | 1.34 | 9.88E−05 |
| Primary metabolic
process (GO:0044238) | 1.25 | 1.70E−05 | 1.11 | 1.00E+00 | 1.10 | 1.00E+00 |
| Metabolic process
(GO:0008152) | 1.22 | 3.98E−06 | 1.13 | 1.80E−01 | 1.11 | 8.58E−01 |
| Cellular process
(GO:0009987) | 1.19 | 1.06E−02 | 1.19 | 9.44E−03 | 1.06 | 1.00E+00 |
| PANTHER GO-Slim
Molecular Function |
| Chromatin binding
(GO:0003682) | 2.87 | 4.26E−03 | 1.48 | 1.00E+00 | 1.75 | 1.00E+00 |
| Nucleic acid
binding (GO:0003676) | 1.41 | 8.32E−05 | 0.97 | 1.00E+00 | 1.33 | 6.16E−03 |
| DNA binding
(GO:0003677) | 1.40 | 1.67E−02 | 1.09 | 1.00E+00 | 1.54 | 5.30E−05 |
| Binding
(GO:0005488) | 1.34 | 2.77E−08 | 1.10 | 1.00E+00 | 1.26 | 6.70E−05 |
| Catalytic activity
(GO:0003824) | 1.22 | 1.17E−02 | 1.19 | 8.98E−02 | 1.03 | 1.00E+00 |
| PANTHER GO-Slim
Molecular Function |
| Not extracted | | | | | | |
Analysis of PANTHER GO-Slim biological Process and
Cellular Component revealed a marked increase in mRNA levels of MHC
class-related gene ontologies (GO:000254 and GO:0042611,
respectively).
The mechanism of action, cell cycle- and
apoptosis-related gene expression in HCT-116 cells following
treatment with 5-FU (1.75 µM) alone, Dep (1 nM) alone, and
combination of 5-FU and Dep
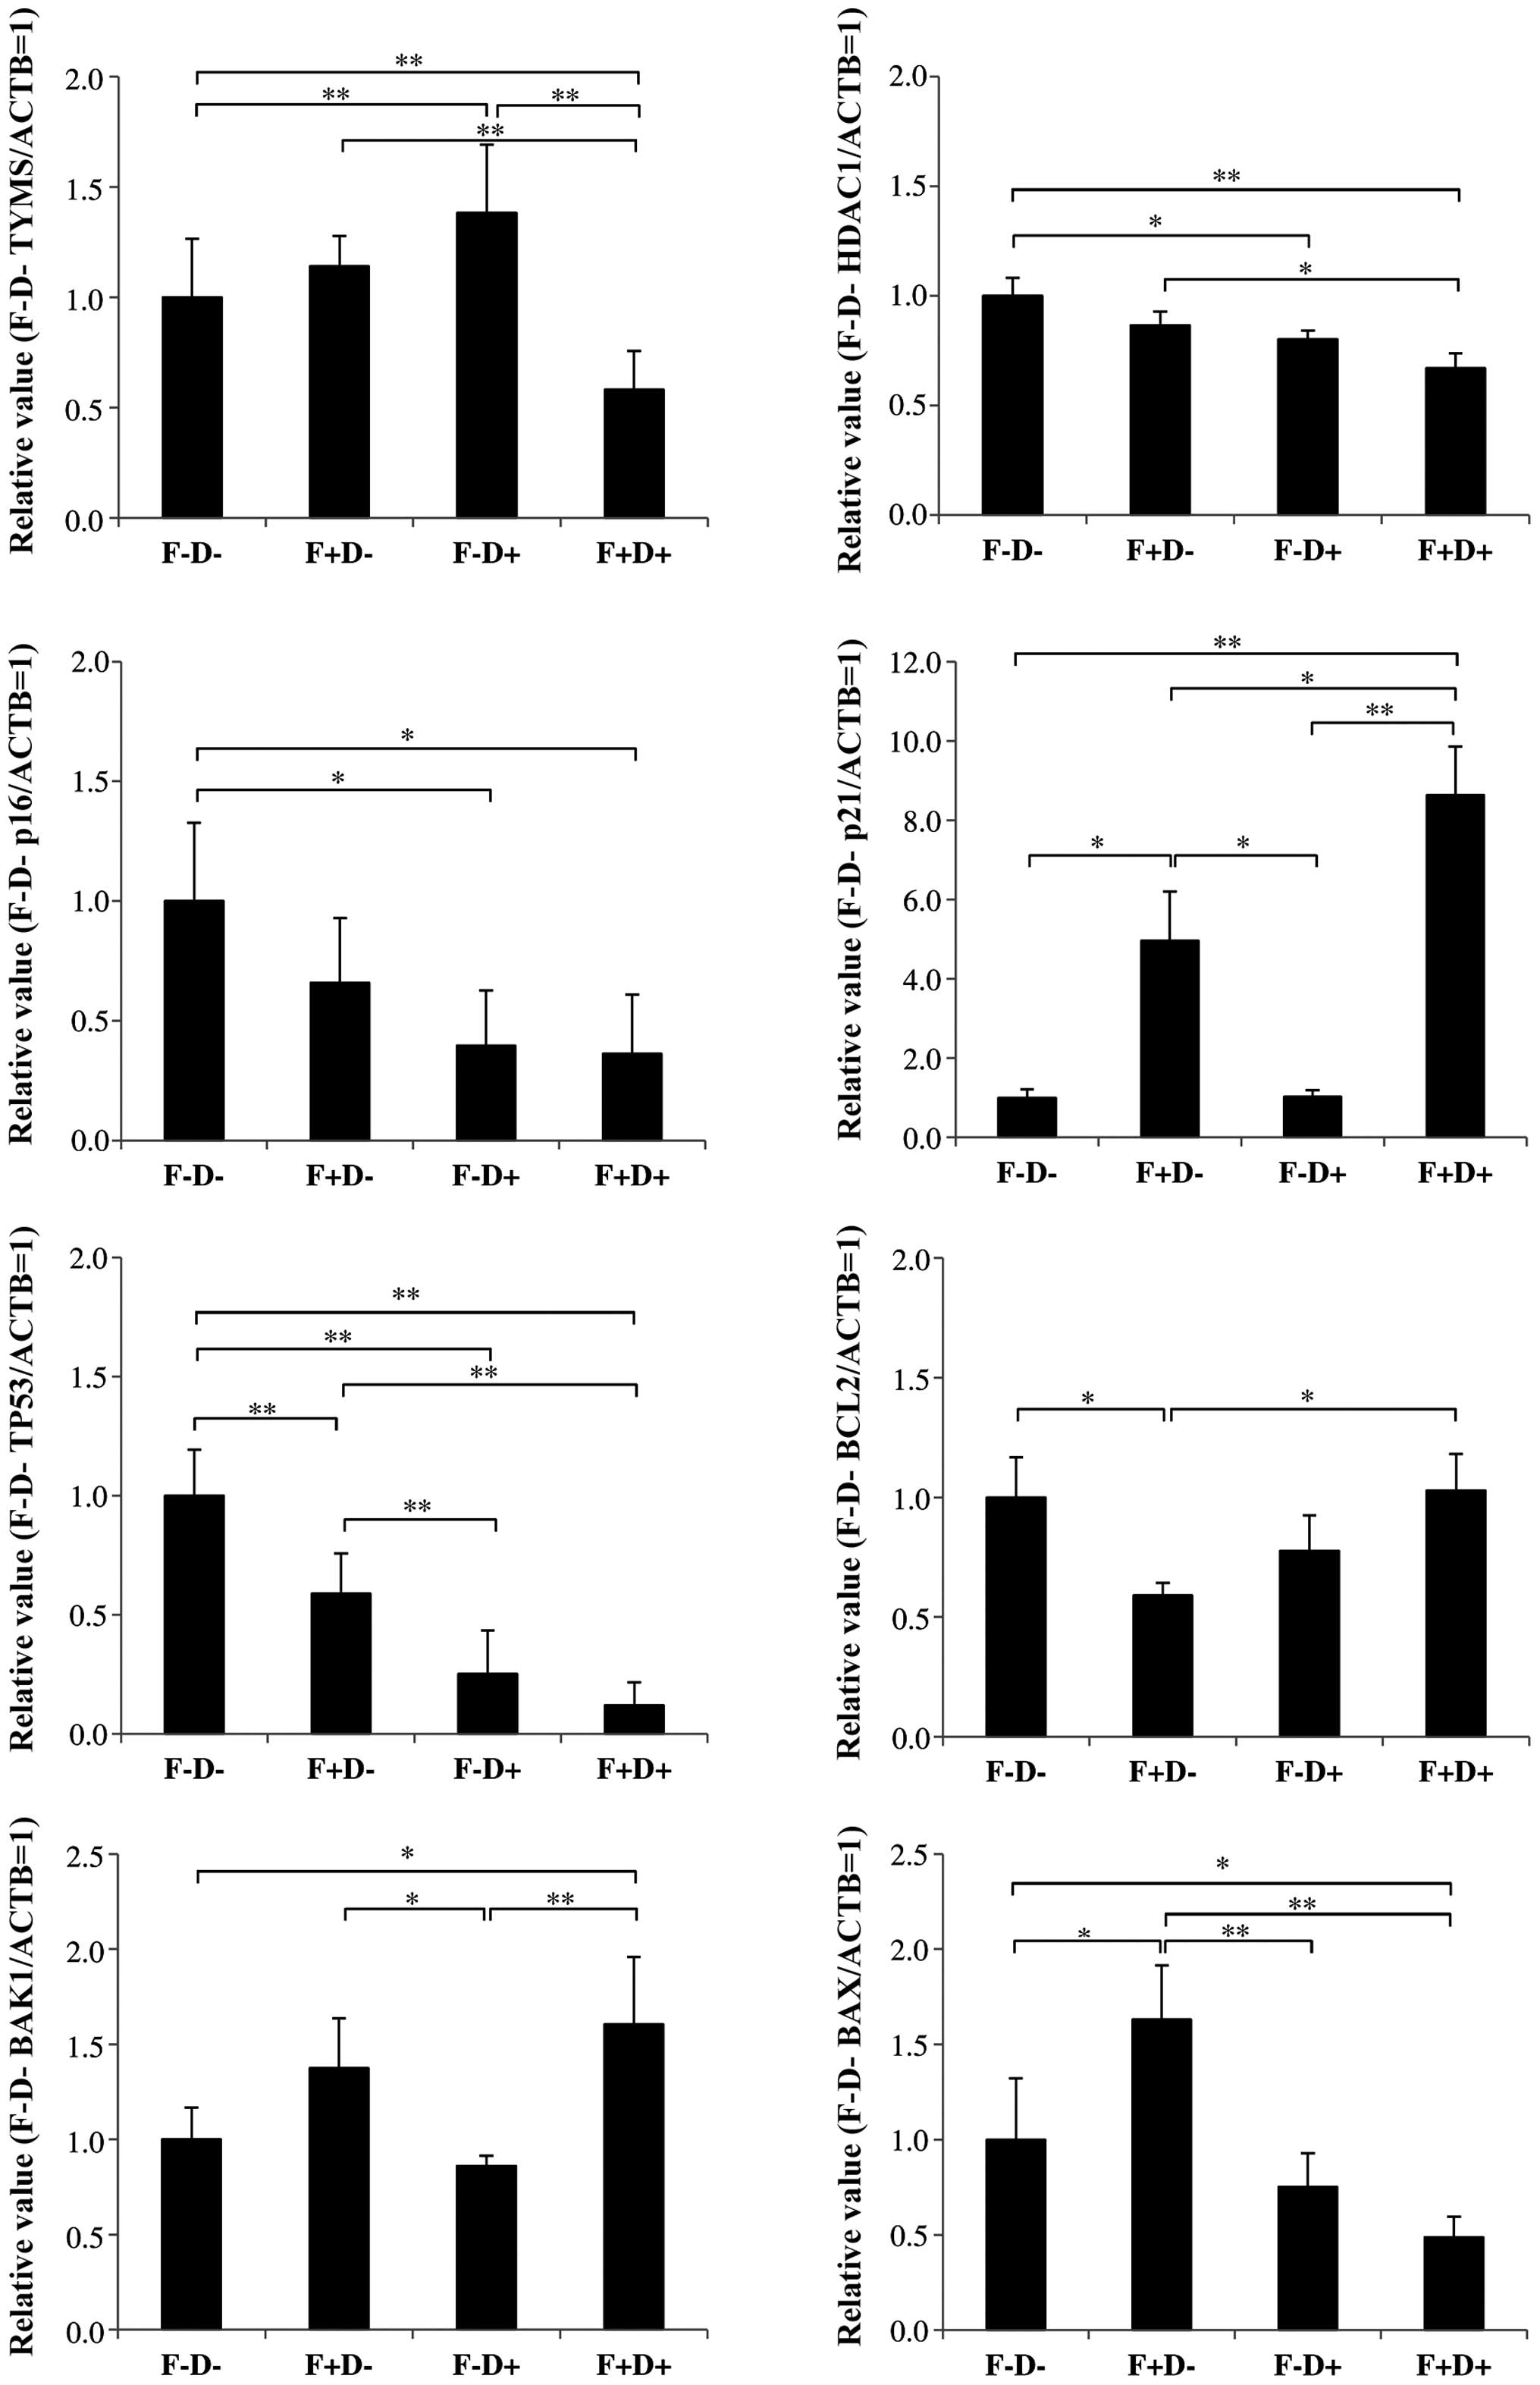
We examined levels of mRNAs encoded by various genes
in the cells treated with 5-FU or Dep alone, and the combination of
5-FU and Dep by qRT-PCR method (Fig.
3).
The levels of TS mRNA encoded by the TYMS
gene were decreased by 42% in the cells treated with the
combination of 5-FU and Dep with statistical significance
(P<0.01).
Slight, but statistically significant downregulation
was observed for HDAC1 mRNA in the cells treated with the 5-FU and
Dep combination.
Dep alone and the combination of 5-FU and Dep
decreased cellular p16 mRNA levels by 60 and 64%, respectively.
Regardless of the presence of Dep, 5-FU induced p21
levels; marked changes in p21 levels by 396% were observed without
Dep, and by 764% with combination of 5-FU and Dep with statistical
significance (P<0.01).
Dep reduced TP53 levels by 75%. 5-FU alone also
slightly decreased TP53 levels by 42%.
5-FU considerably decreased the bCL2 mRNA level to
59%, which was apparently restored in the presence of Dep (to 103%
in the combination with 5-FU).
An unremarkable change was observed in bAK1 mRNA in
the cells following treatment with either 5-FU alone or Dep alone
(138 and 86%, respectively). The combination of these drugs
slightly increased the bAK1 mRNA level to 160%, which was
statistically significant compared with the vehicle control
(P<0.05), and with Dep only (P<0.01). Regarding BAX, 5-FU
increased the BAX mRNA level to 163%. The combination of Dep with
5-FU decreased bAX mRNA to 49% of the vehicle control, which was
statistically significant compared with 5-FU only (P<0.01), and
with the vehicle control (P<0.05).
MHC class II and I mRNA levels in the
HCT-116 cells following treatment with 5-FU (1.75 µM) alone, Dep (1
nM) alone, and a combination of 5-FU and Dep
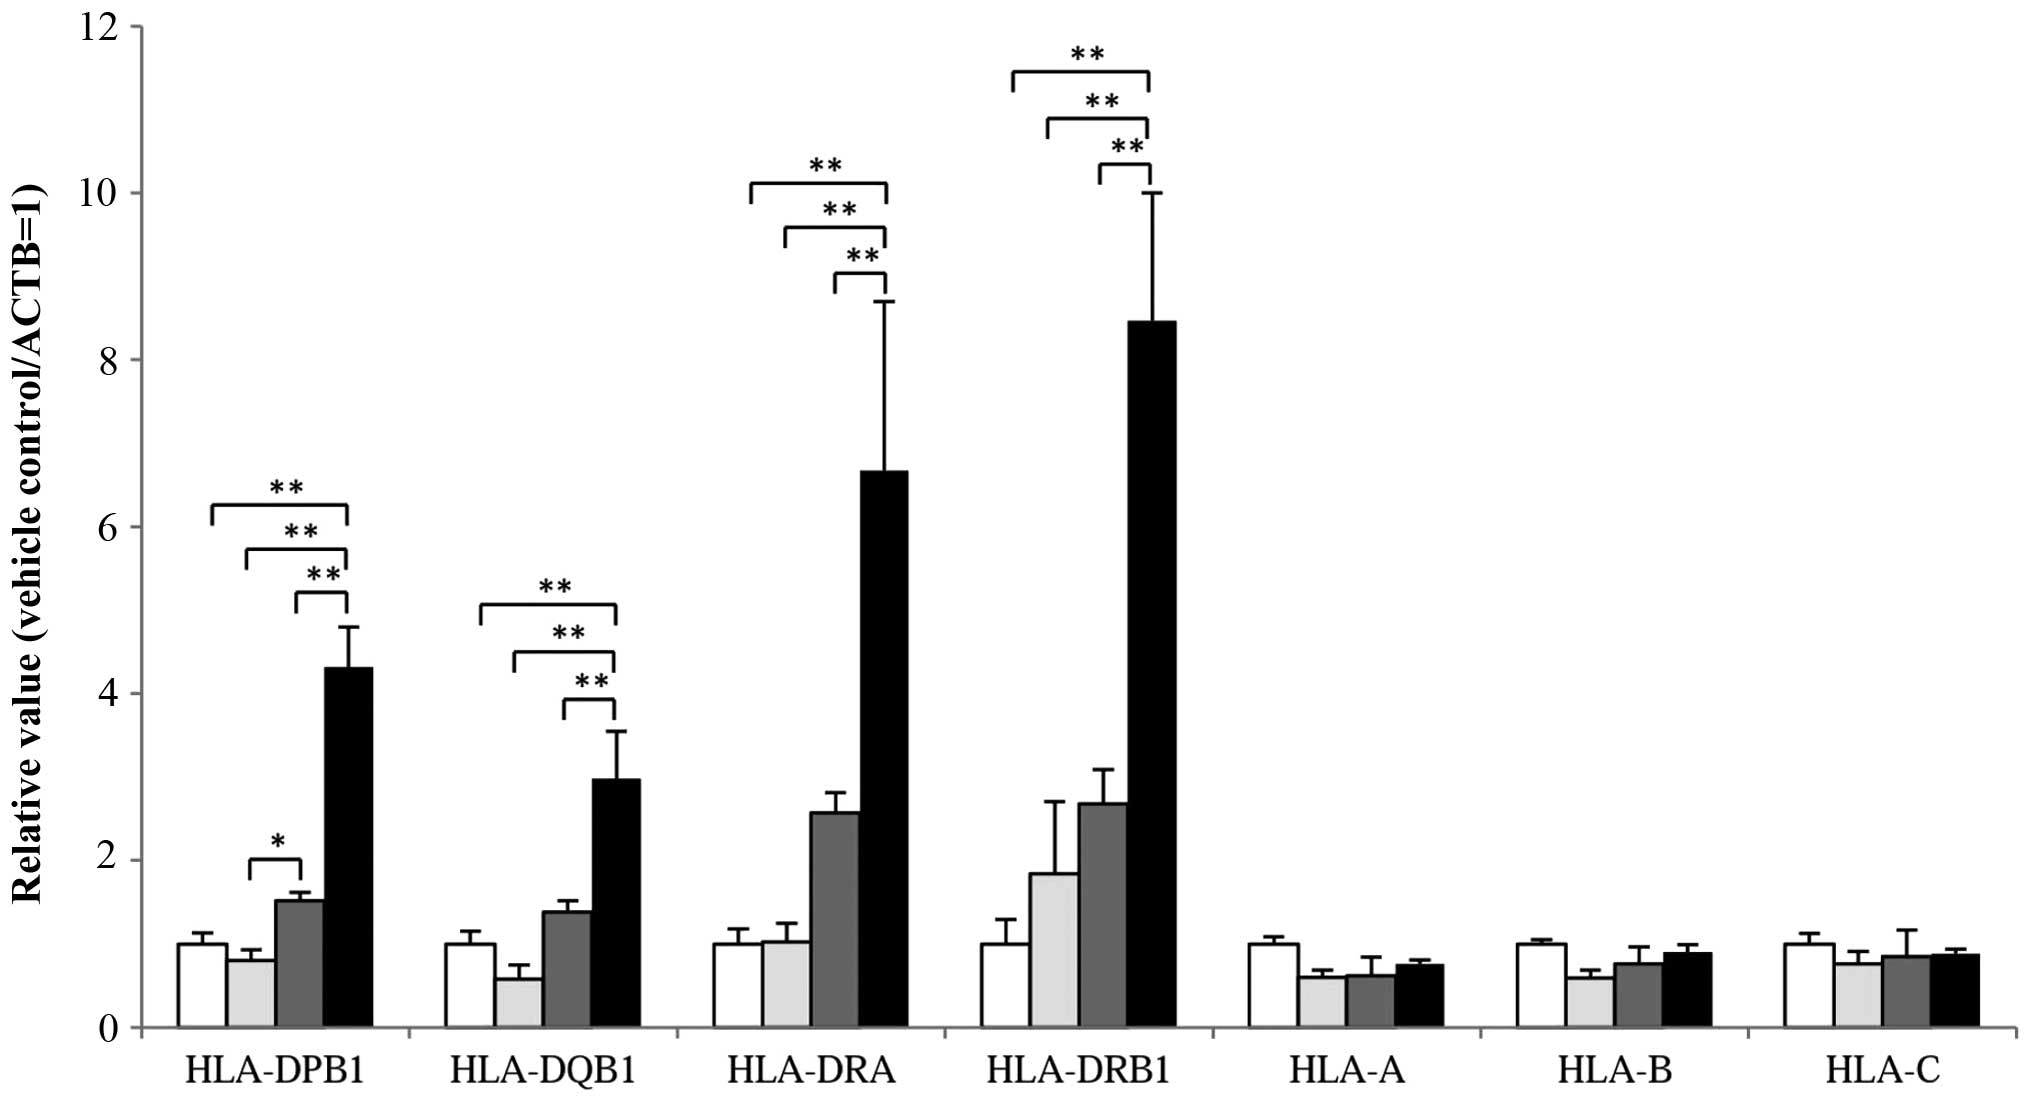
We examined levels of MHC class II and I mRNA by
qRT-PCR in the cells treated with 5-FU or Dep alone, and a
combination of 5-FU and Dep (Fig
4).
MHC class II genes, including HLA-DPB1,
HLA-DQB1, HLA-DRA, and HLA-DRB1 were markedly
upregulated in combination with 5-FU and Dep (P<0.01) to 432,
298, 667 and 847%, respectively, compared to the vehicle
controls.
Dep alone slightly increased levels of MHC class II
genes, including HLA-DPB1, HLA-DQB1, HLA-DRA,
and HLA-DRB1 by 52, 38, 157 and 168%, respectively. Compared
with Dep alone, the combination with 5-FU greatly elevated mRNA
levels of these MHC class II genes, namely, HLA-DPB1,
HLA-DQB1, HLA-DRA, and HLA-DRB1 with
statistical significance (P<0.01). In the HT29 and SW48 cells,
increased expression level of HLA-DRA (MHC class II gene) was
observed with statistical significance in combination of 5-FU and
Dep by real-time PCR (data not shown).
No change in the levels of MHC class I genes
including HLA-A, HLA-B-HLA-C were observed following
treatment with 5-FU, Dep, or 5-FU plus Dep.
Summary of changes in expression of
molecular regulation of MHC class II genes by microarray analysis
in the HCT-116 cells
We further analyzed the results of our global
analysis of gene expression, which were focused on genes involved
in the molecular regulation of MHC class II genes. As described in
Table IV, we found the highest
degree of increased expression levels of PCAF, CREB3, CREB5, and
CIITA after the combination of 5-FU and Dep. PCAF, a histone
acetyltransferase, is related to apoptotic cell processes, and
CREB3, CREB5 and CIITA are related to MHC class II gene expression.
On the contrary, ATF4, a member of the CREB family, was slightly
downregulated following treatment with 5-FU or Dep alone, and
markedly downregulated by the combination of 5-FU and dep.
| Table IVSummary of changes in gene expression
for molecular regulation of MHC class II genes by microarray
analysis in the HCT-116 cells. |
Table IV
Summary of changes in gene expression
for molecular regulation of MHC class II genes by microarray
analysis in the HCT-116 cells.
| Gene name
(synonym) | Accession no. | Description | Fold-change
|
|---|
| F1.75D1 | F1.75D0 | F0D1 |
|---|
| CIITA | NM_000246 | Class II, major
histocompatibility complex, transactivator | 2.80 | 0.80 | 0.91 |
| CREB1 | NM_13444 | cAMP responsive
element binding protein 1 | 0.91 | 0.91 | 1.17 |
| CREB2 (ATF4) | NM_001675 | Activating
transcription factor 4 | 0.22 | 0.66 | 0.55 |
| CREB3 | NM_006368 | cAMP responsive
element binding protein 3 | 2.13 | 1.05 | 1.09 |
| CREB5 | NM_182898 | cAMP responsive
element binding protein 5 | 6.51 | 0.75 | 0.64 |
| EP300 (KAT3B) | NM_001429 | E1A binding protein
p300 | 0.59 | 0.69 | 0.80 |
| KAT2B (PCAF) | NM_003884 | K(lysine)
acetyltransferase 2b | 3.15 | 1.37 | 1.47 |
| NFYA | NM_002505 | Nuclear
transcription factor Y, α | 1.27 | 1.02 | 1.15 |
| NFYB | NM_006166 | Nuclear
transcription factor Y, β | 0.88 | 1.14 | 0.97 |
| NFYC | NM_014223 | Nuclear
transcription factor Y, γ | 0.56 | 1.08 | 0.87 |
| PCBP4 (CBP) | NM_033010 | poly(rC) binding
protein 4 | 1.43 | 1.05 | 1.10 |
| RFXANK | NM_003721 | Regulatory factor
X-associated ankyrin-containing protein | 0.37 | 0.63 | 0.68 |
| RFXAP | NM_000538 | Regulatory factor
X-associated protein | 1.29 | 0.82 | 0.79 |
| RX5 | NM_000449 | Regulatory factor
X, 5 (influences HLA class II expression) | 0.95 | 1.51 | 0.97 |
Discussion
In the present study, we found the HDAC inhibitor,
Dep, potentiated 5-FU cytotoxicity via inhibition of colony
formation ability in human colon cancer HCT-116 cells (Fig. 1). The primary findings of our study
were that Dep augments the effects of 5-FU in HCT-116 cells, and
that activation of caspase-3/7 is the underlying mechanism.
Moreover, the importance of MHC class II and p21 (CDKN1A)
upregulation (Figs. 4 and 3, respectively) in the effect of the
combination of 5-FU and Dep was revealed. Dep was previously
reported to induce caspase-dependent apoptosis in small cell lung
cancer cells via the mitochondrial pathway by suppressing the
expression of BCL2 family members (28). In contrast, the present study did
not show a marked reduction in HCT-116 cells. These results
indicated that the sensitization of HCT-116 cells to the
combination of 5-FU and Dep was not likely to be mediated by
changes in expression of BCL2 family members (28).
Exposure of cancer cells to 5-FU elevated the
expression of p21 (CDKN1A), and the combination of Dep with
5-FU further enhanced this mRNA expression of p21 (CDKN1A)
(Fig. 3). Induction of p21 using a
tetracycline-inducible vector system showed that p21 plays an
important role in the induction of growth arrest in tumor cells
(29). A critical role of p21 has
been described as a critical mediator of cytotoxicity of 5-FU
(30). These results are consistent
with our present results that the 5-FU-induced and Dep-enhanced p21
(CDKN1A) expression are both associated with cell cycle
arrest.
Our present microarray and the successive gene
ontology analyses revealed that combination of 5-FU and Dep
markedly increased the mRNA levels of MHC class II genes, namely,
HLA-DPB1, HLA-DQB1, HLA-DRA, and
HLA-DRB1 (Fig. 4). This
marked activation of MHC class II gene expression, however, was not
noted following treatment with 1.75 µM 5-FU alone, or 1 nM
depsipeptide alone. The HCT-116 cells treated with the combination
underwent caspase 3/7-associated apoptosis. Therefore, activation
of MHC class II expression may have some relationship with the cell
apoptotic process. Ting and Trowsdale described positively
regulated control of MHC class II expression, which was mediated by
DNA binding factors including NF-Y, CREB, and RFX, and the
coactivator, CIITA, general transcription factors, and histone
acetyltransferases including P300/CBP-associated factor (PCAF)
(31). Among them, PCAF was
reported to accelerate cancer cell apoptosis by counteracting the
anti-apoptotic cellular process (32). In addition, an HDAC inhibitor was
reported to enhance MHC class II expression in both CIITA-dependent
and -independent manners (33). Our
present results of augmentation of MHC class II gene expression
after the treatment with 5-FU combined with an HDAC inhibitor,
depsipeptide, may be collateral antitumor events for the induction
of cellular apoptosis by 5-FU. Our global analysis of gene
expression indicated marked induction of MHC class II members
together with PCAF (also called KAT2B), CREB3, CREB5, and CIITA
(Table IV), which may be
correlated with a number of apoptotic cell processes, by the
combination of 5-FU and depsipeptide. In fact, higher 5-FU
concentrations revealed dose-dependent MHC class II induction
(unpublished data). Collectively, our present results may indicate
a closer relationship between the elevation of MHC class II
expression and cellular apoptosis induced by antitumor agent, 5-FU.
Furthermore, we are investigating whether induction of MHC class II
proteins after 5-FU-based chemotherapy is a prognostic marker.
On the other hand, previous reports have documented
the importance of histone acetylation as a positive regulator of
MHC class II transcription and that HDAC inhibitors augment the
expression of tumor cell MHC class II (34–36).
Dep may affect the differentiation of colon cancer cells because of
the close correlation already shown between the expression of
HLA-DR antigen and the differentiation of tumor cells using
gastric carcinoma models (37,38).
West et al recently proposed that HDAC
inhibitors require the immune system to exert their anticancer
effects (39). Downregulation of
immune-system-related genes including MHC class II genes was shown
to associate cooperatively with the metastatic potential of early
stage colorectal carcinoma (40).
Our present results are in agreement with concepts
raised very recently that immune systems where MHC class II genes
are involved have a considerable relationship with successful
cancer chemotherapy and/or less cancer cell malignancies.
Therefore, our present results imply that 5-FU
combined with Dep synergistically enhances the expression of tumor
cell surface immunological proteins (i.e., marked inductions of MHC
class II genes). This is consistent with what is known concerning
the concerted mechanisms of therapeutic drugs and immune systems in
cancer chemotherapy.
In conclusion, the combination of 5-FU and Dep
sensitized human colon cancer HCT-116, HT29, and SW48 cells. The
sensitization in the HCT-116 cells likely occurred through
apoptosis induction shown by caspase-3/7 activation, induction of
cell cycle arrest shown by p21 (CDKN1A) upregulation, and
induction of MHC class II gene expression. MHC class II gene
induction may render cancer chemotherapy more effective through a
possible cooperation of the immune system with cancer chemotherapy.
Epigenetic modulation of existing anticancer drugs may be
considered for development of novel cancer chemotherapy.
Abbreviations:
|
IARC
|
International Agency for Research on
Cancer
|
|
CRC
|
colorectal cancer
|
|
5-FU
|
5-fluorouracil
|
|
TS
|
thymidylate synthase
|
|
DNMT
|
DNA methyltransferase
|
|
HDAC
|
histone deacetylase
|
|
Dep
|
depsipeptide
|
|
CTCL
|
cutaneous T-cell lymphoma
|
|
RLU
|
relative light unit
|
|
TYMS
|
thymidylate synthase gene
|
|
qRT-PCR
|
quantitative reverse-transcription
polymerase chain reaction
|
|
SEM
|
standard error of mean
|
|
ANOVA
|
analysis of variance
|
|
MHC
|
major histocompatibility complex
|
|
ACTB
|
β-actin
|
Acknowledgments
We wish to thank Editage (www.editage.jp) for English language editing.
References
|
1
|
Longley DB, Harkin DP and Johnston PG:
5-fluorouracil: Mechanisms of action and clinical strategies. Nat
Rev Cancer. 3:330–338. 2003. View
Article : Google Scholar : PubMed/NCBI
|
|
2
|
Gustavsson B, Carlsson G, Machover D,
Petrelli N, Roth A, Schmoll HJ, Tveit KM and Gibson F: A review of
the evolution of systemic chemotherapy in the management of
colorectal cancer. Clin Colorectal Cancer. 14:1–10. 2015.
View Article : Google Scholar : PubMed/NCBI
|
|
3
|
Meyerhardt JA and Mayer RJ: Systemic
therapy for colorectal cancer. N Engl J Med. 352:476–487. 2005.
View Article : Google Scholar : PubMed/NCBI
|
|
4
|
Tsai HC and Baylin SB: Cancer epigenetics:
Linking basic biology to clinical medicine. Cell Res. 21:502–517.
2011. View Article : Google Scholar : PubMed/NCBI
|
|
5
|
Dokmanovic M, Clarke C and Marks PA:
Histone deacetylase inhibitors: Overview and perspectives. Mol
Cancer Res. 5:981–989. 2007. View Article : Google Scholar : PubMed/NCBI
|
|
6
|
Prince HM, Bishton MJ and Harrison SJ:
Clinical studies of histone deacetylase inhibitors. Clin Cancer
Res. 15:3958–3969. 2009. View Article : Google Scholar : PubMed/NCBI
|
|
7
|
Minucci S and Pelicci PG: Histone
deacetylase inhibitors and the promise of epigenetic (and more)
treatments for cancer. Nat Rev Cancer. 6:38–51. 2006. View Article : Google Scholar : PubMed/NCBI
|
|
8
|
Liu S, Cheng H, Kwan W, Lubieniecka JM and
Nielsen TO: Histone deacetylase inhibitors induce growth arrest,
apoptosis, and differentiation in clear cell sarcoma models. Mol
Cancer Ther. 7:1751–1761. 2008. View Article : Google Scholar : PubMed/NCBI
|
|
9
|
Bots M and Johnstone RW: Rational
combinations using HDAC inhibitors. Clin Cancer Res. 15:3970–3977.
2009. View Article : Google Scholar : PubMed/NCBI
|
|
10
|
Iwahashi S, Shimada M, Utsunomiya T,
Morine Y, Imura S, Ikemoto T, Mori H, Hanaoka J and Saito Y:
Histone deacetylase inhibitor enhances the anti-tumor effect of
gemcitabine: A special reference to gene-expression microarray
analysis. Oncol Rep. 26:1057–1062. 2011.PubMed/NCBI
|
|
11
|
Subramaniam D, Thombre R, Dhar A and Anant
S: DNA methyltransferases: A novel target for prevention and
therapy. Front Oncol. 4:802014. View Article : Google Scholar : PubMed/NCBI
|
|
12
|
Glaser KB: HDAC inhibitors: Clinical
update and mechanism-based potential. Biochem Pharmacol.
74:659–671. 2007. View Article : Google Scholar : PubMed/NCBI
|
|
13
|
Humeniuk R, Mishra PJ, Bertino JR and
Banerjee D: Epigenetic reversal of acquired resistance to
5-fluorouracil treatment. Mol Cancer Ther. 8:1045–1054. 2009.
View Article : Google Scholar : PubMed/NCBI
|
|
14
|
Keshelava N, Davicioni E, Wan Z, Ji L,
Sposto R, Triche TJ and Reynolds CP: Histone deacetylase 1 gene
expression and sensitization of multidrug-resistant neuroblastoma
cell lines to cytotoxic agents by depsipeptide. J Natl Cancer Inst.
99:1107–1119. 2007. View Article : Google Scholar : PubMed/NCBI
|
|
15
|
Thurn KT, Thomas S, Moore A and Munster
PN: Rational therapeutic combinations with histone deacetylase
inhibitors for the treatment of cancer. Future Oncol. 7:263–283.
2011. View Article : Google Scholar : PubMed/NCBI
|
|
16
|
Stiborová M, Eckschlager T, Poljaková J,
Hraběta J, Adam V, Kizek R and Frei E: The synergistic effects of
DNA-targeted chemotherapeutics and histone deacetylase inhibitors
as therapeutic strategies for cancer treatment. Curr Med Chem.
19:4218–4238. 2012. View Article : Google Scholar : PubMed/NCBI
|
|
17
|
Ikehata M, Ogawa M, Yamada Y, Tanaka S,
Ueda K and Iwakawa S: Different effects of epigenetic modifiers on
the cytotoxicity induced by 5-fluorouracil, irinotecan or
oxaliplatin in colon cancer cells. Biol Pharm Bull. 37:67–73. 2014.
View Article : Google Scholar
|
|
18
|
Ueda H, Nakajima H, Hori Y, Fujita T,
Nishimura M, Goto T and Okuhara M: FR901228, a novel antitumor
bicyclic depsipeptide produced by Chromobacterium violaceum no. 968
I. Taxonomy, fermentation, isolation, physico-chemical and
biological properties, and antitumor activity. J Antibiot (Tokyo).
47:301–310. 1994. View Article : Google Scholar
|
|
19
|
Ueda H, Nakajima H, Hori Y, Goto T and
Okuhara M: Action of FR901228, a novel antitumor bicyclic
depsipeptide produced by Chromobacterium violaceum no. 968 on
Ha-ras transformed NIH3T3 cells. Biosci Biotechnol Biochem.
58:1579–1583. 1994. View Article : Google Scholar : PubMed/NCBI
|
|
20
|
Furumai R, Matsuyama A, Kobashi N, Lee KH,
Nishiyama M, Nakajima H, Tanaka A, Komatsu Y, Nishino N, Yoshida M,
et al: FK228 (depsipeptide) as a natural prodrug that inhibits
class I histone deacetylases. Cancer Res. 62:4916–4921.
2002.PubMed/NCBI
|
|
21
|
Lee JH, Park JH, Jung Y, Kim JH, Jong HS,
Kim TY and Bang YJ: Histone deacetylase inhibitor enhances
5-fluorouracil cytotoxicity by down-regulating thymidylate synthase
in human cancer cells. Mol Cancer Ther. 5:3085–3095. 2006.
View Article : Google Scholar : PubMed/NCBI
|
|
22
|
Tumber A, Collins LS, Petersen KD,
Thougaard A, Christiansen SJ, Dejligbjerg M, Jensen PB, Sehested M
and Ritchie JW: The histone deacetylase inhibitor PXD101 synergises
with 5-fluorouracil to inhibit colon cancer cell growth in vitro
and in vivo. Cancer Chemother Pharmacol. 60:275–283. 2007.
View Article : Google Scholar
|
|
23
|
Di Gennaro E, Bruzzese F, Pepe S, Leone A,
Delrio P, Subbarayan PR, Avallone A and Budillon A: Modulation of
thymidilate synthase and p53 expression by HDAC inhibitor
vorinostat resulted in synergistic antitumor effect in combination
with 5FU or raltitrexed. Cancer Biol Ther. 8:782–791. 2009.
View Article : Google Scholar : PubMed/NCBI
|
|
24
|
Fazzone W, Wilson PM, Labonte MJ, Lenz HJ
and Ladner RD: Histone deacetylase inhibitors suppress thymidylate
synthase gene expression and synergize with the fluoropyrimidines
in colon cancer cells. Int J Cancer. 125:463–473. 2009. View Article : Google Scholar : PubMed/NCBI
|
|
25
|
Wolter F, Akoglu B, Clausnitzer A and
Stein J: Downregulation of the cyclin D1/Cdk4 complex occurs during
resveratrol-induced cell cycle arrest in colon cancer cell lines. J
Nutr. 131:2197–2203. 2001.PubMed/NCBI
|
|
26
|
Lowry OH, Rosebrough NJ, Farr AL and
Randall RJ: Protein measurement with the Folin phenol reagent. J
Biol Chem. 193:265–275. 1951.PubMed/NCBI
|
|
27
|
Mi H, Muruganujan A and Thomas PD: PANTHER
in 2013: Modeling the evolution of gene function, and other gene
attributes, in the context of phylogenetic trees. Nucleic Acids
Res. 41:D377–D386. 2013. View Article : Google Scholar :
|
|
28
|
Doi S, Soda H, Oka M, Tsurutani J,
Kitazaki T, Nakamura Y, Fukuda M, Yamada Y, Kamihira S and Kohno S:
The histone deacetylase inhibitor FR901228 induces
caspase-dependent apoptosis via the mitochondrial pathway in small
cell lung cancer cells. Mol Cancer Ther. 3:1397–1402.
2004.PubMed/NCBI
|
|
29
|
Fang L, Igarashi M, Leung J, Sugrue MM,
Lee SW and Aaronson SA: p21Waf1/Cip1/Sdi1 induces permanent growth
arrest with markers of replicative senescence in human tumor cells
lacking functional p53. Oncogene. 18:2789–2797. 1999. View Article : Google Scholar : PubMed/NCBI
|
|
30
|
Geller JI, Szekely-Szucs K, Petak I, Doyle
B and Houghton JA: P21Cip1 is a critical mediator of the cytotoxic
action of thymidylate synthase inhibitors in colorectal carcinoma
cells. Cancer Res. 64:6296–6303. 2004. View Article : Google Scholar : PubMed/NCBI
|
|
31
|
Ting JP and Trowsdale J: Genetic control
of MHC class II expression. Cell. 109(Suppl): S21–S33. 2002.
View Article : Google Scholar : PubMed/NCBI
|
|
32
|
Gai X, Tu K, Li C, Lu Z, Roberts LR and
Zheng X: Histone acetyltransferase PCAF accelerates apoptosis by
repressing a GLI1/BCL2/BAX axis in hepatocellular carcinoma. Cell
Death Dis. 6:e17122015. View Article : Google Scholar : PubMed/NCBI
|
|
33
|
Magner WJ, Kazim AL, Stewart C, Romano MA,
Catalano G, Grande C, Keiser N, Santaniello F and Tomasi TB:
Activation of MHC class I, II, and CD40 gene expression by histone
deacetylase inhibitors. J Immunol. 165:7017–7024. 2000. View Article : Google Scholar : PubMed/NCBI
|
|
34
|
Beresford GW and Boss JM: CIITA
coordinates multiple histone acetylation modifications at the
HLA-DRA promoter. Nat Immunol. 2:652–657. 2001. View Article : Google Scholar : PubMed/NCBI
|
|
35
|
Masternak K and Reith W: Promoter-specific
functions of CIITA and the MHC class II enhanceosome in
transcriptional activation. EMBO J. 21:1379–1388. 2002. View Article : Google Scholar : PubMed/NCBI
|
|
36
|
Niesen MI and Blanck G: Rescue of major
histocompatibility - DR surface expression in
retinoblastoma-defective, non-small cell lung carcinoma cells by
the MS-275 histone deacetylase inhibitor. Biol Pharm Bull.
32:480–482. 2009. View Article : Google Scholar : PubMed/NCBI
|
|
37
|
Ma XC, Hattori T, Kushima R, Terata N and
Kodama M: Expression of HLA-class II antigen in gastric carcinomas.
Its relationship to histopathological grade, lymphocyte
infiltration and five-year survival rate. Acta Oncol. 33:187–190.
1994. View Article : Google Scholar : PubMed/NCBI
|
|
38
|
Ishigami S, Aikou T, Natsugoe S, Hokita S,
Iwashige H, Tokushige M and Sonoda S: Prognostic value of HLA-DR
expression and dendritic cell infiltration in gastric cancer.
Oncology. 55:65–69. 1998. View Article : Google Scholar : PubMed/NCBI
|
|
39
|
West AC, Smyth MJ and Johnstone RW: The
anticancer effects of HDAC inhibitors require the immune system.
OncoImmunology. 3:e274142014. View Article : Google Scholar : PubMed/NCBI
|
|
40
|
Fehlker M, Huska MR, Jöns T,
Andrade-Navarro MA and Kemmner W: Concerted down-regulation of
immune-system related genes predicts metastasis in colorectal
carcinoma. BMC Cancer. 14:64–75. 2014. View Article : Google Scholar : PubMed/NCBI
|