Introduction
Renal cell carcinoma (RCC) is the most common
neoplasm in the adult kidney, accounting for 2–3% of all malignant
diseases in adults (1), and
incidence rates are gradually increasing in most countries
(2). Unfortunately, due to its
asymptomatic development, ~20–30% of the patients diagnosed
incidentally with RCC during abdominal imaging already have
advanced or metastatic disease and untreated patients with
metastatic RCC have a 5-year survival rate of <20% (3). The principal treatment for RCC is the
surgical tumor mass removal, either partial or radical nephrectomy.
However, surgery usually increases the duration of patient's life
only for early stage tumors (4) and
prognosis of patients with advanced stage or metastatic disease is
poor (5).
WHO describes four main pathological subtypes of
RCC: clear cell renal cell carcinoma (ccRCC), papillary carcinoma
type 1 and 2, the chromophobic carcinoma and collecting duct
carcinoma (3). The clear cell tumor
subtype is the most common, accounting for 80–90% of all RCCs
(2). The prognosis associated with
ccRCC can vary widely and novel molecular prognostic markers are
needed to assess prognosis at an earlier stage. A more in-depth
understanding of the molecular basis and identifying new ccRCC
biomarkers will be beneficial for cancer management.
Studying at protein level is desirable as mRNA
levels do not always correlate well with the protein abundance.
Proteomic-based approaches allow analyses not only at translational
levels, but also at complex post-translational levels, which are
not detected by gene analysis. Mass spectrometry (MS)-based
proteomic approaches are well-suited for unveiling the complex
molecular events of tumorigenesis and identification of cancer
biomarkers. Among them, label-free methods make use of no isotope
labels and therefore are simpler in sample preparation and lower in
cost (6,7). The past decade has witnessed a rapid
increase in the use of label-free methods which show its potential
for identification and quantification of differentially expressed
proteins in normal and disease samples.
In this study, we aimed to identify potential tumor
biomarkers through proteomic analysis. We performed quantitative
analysis using label-free sample preparation and liquid
chromatography-tandem mass spectrometry (LC-MS/MS) to identify
proteins that are dysregulated in ccRCC. Then, we verified the
dysregulated expression of several interesting proteins and
assessed their clinical diagnostic significance of ccRCC.
Materials and methods
Ethics statement
The study was examined and approved by the Ethics
Committee of the First Affiliated Hospital of Nanchang University.
Each participant provided a written informed consent to participate
in this study.
Patients and tissue samples
Samples of paired ccRCC and adjacent normal tissue
were obtained surgically from four patients treated in the First
Affiliated Hospital of Nanchang University after obtaining an
informed consent. Relevant clinical information of the patients is
summarized in Table I. None of the
participants received chemo-, radio-, or immunotherapy before
surgical resection. All specimens were histologically confirmed by
two pathologists, and then in homogeneous areas were selected of
the ccRCC samples to avoid grossly necrotic or fibrotic parts.
 | Table I.Clinicopathological characteristics of
four ccRCC patients. |
Table I.
Clinicopathological characteristics of
four ccRCC patients.
| Patient ID | Patient_W | Patient_H | Patient_L | Patient_P |
|---|
| Gender | Female | Male | Female | Male |
| Age (years) | 11 | 57 | 73 | 62 |
| Histopathological
type | ccRCC | ccRCC | ccRCC | ccRCC |
| Surgery | Nephrectomy | Nephrectomy | Nephrectomy | Nephrectomy |
| Tumor size (mm) | 6×5 | 7×7 | 1.5×1.5 | 4.5×4.5 |
| No. of foci | Single | Single | Single | Single |
| Differentiation | Medium | Medium | Good | Medium |
| TNM stage | T1N0M0 | T1N0M0 | T1N0M0 | T1N0M0 |
| Tumor
infiltration | No | No | Yes | No |
| Smoking | No | Yes | No | Yes |
Sample separation by nano-LC and
analysis by tandem mass spectrometry (MS/MS)
After nephrectomy, fresh ccRCC and adjacent normal
tissues were cut on ice to homogenize in 20% SDS and 1 M DTT
solution, following fluorescence assay (7) for total protein concentration.
Approximately 100 µg total protein from tissue was proteolysed on
10 kDa filter (Pall Life Sciences, Shanghai, China) using a
filter-aided sample preparation (FASP) protocol as described in
detail elsewhere (8). Tryptic
digests for each sample were quantitated by fluorescence assay.
Peptide solution was then transferred to Empore Solid Phase
Extraction Cartridge (7 mm/3 ml) for desalting and clean-up of
sample. Peptide samples were resuspended in water with 0.1% formic
acid (v/v) and analyzed by nano-LC-MS/MS.
For label-free, relative quantitative analysis, 5 µg
of the digest sample were analyzed by nano-LC-MS/MS, each sample
was analyzed twice. LC separations were conducted on the EASY
nano-LC system (Thermo Fisher Scientific GmbH, Bremen, Germany).
Chromatography solvents were water (A) and acetonitrile (B), both
with 0.1% formic acid. Peptide samples were concentrated and washed
on a C18 Reversed-Phase Trap Column (75 µm × 2 cm; 5 µm; 100 Å;
Thermo Fisher Scientific GmbH) with 0.1% formic acid, then they
were eluted from the C18 analytic column (75 µm × 15 cm; 3 µm; 100
Å; Thermo Fisher Scientific GmbH) with the following gradient 5–40%
B (130 min). At 140 min, the gradient increased to 90% B and was
held there for 10 min. At 160 min, the gradient returned to 5% to
re-equilibrate the column for the next injection. Eluting peptides
were directly analyzed via MS/MS on an LTQ Orbitrap Velos Pro mass
spectrometer (Thermo Fisher Scientific GmbH) equipped with a
nano-electrospray ion source. A spray voltage of 1.8 kV and an ion
transfer tube temperature of 250°C were applied. The instrument was
calibrated using standard compounds and operated in the
data-dependent mode. The MS spectra were acquired in a
data-dependent manner in the m/z range of 350–1,800 and survey
scans were acquired in Orbitrap mass analyzer at a mass resolution
of 60,000 at 400 m/z. The MS/MS data were acquired in the linear
ion trap by targeting the top 10 most abundant ions for
fragmentation using low-energy collision-induced dissociation
experiments, a normalized collision energy of 35%, an activation q
of 0.25, and an activation time of 30 msec. MS scans were recorded
in profile mode, while the MS/MS was recorded in centroid mode, to
reduce data file size. Dynamic exclusion was set to a repeat count
of one with a 30-sec duration.
Data processing and analysis
All raw XCalibur files acquired from MS runs were
analyzed using the default settings of MaxQuant software (version
1.3.0.5) with minor modifications. Enzyme specification during the
search was trypsin/P. Carbamidomethylation of cysteine was selected
as a fixed modification, while oxidation of methionine and
N-terminal acetylation were selected as variable modifications.
Mass tolerances for precursor and fragment ions were set at 20 ppm
and 0.5 Da, respectively, in initial scan and set at 6 ppm for the
main search. Tandem MS search was done using the Andromeda search
engine integrated into MaxQuant and was run against target
databases against the Swiss-Prot human database (10/2015; 20,216
entries). Minimum cut-off for peptide length was set at seven amino
acids, and maximum permissible missed cleavage was set at two.
Maximal FDR for peptide spectral match, proteins and site was set
to 0.01. A minimum of two sequence-unique peptides was required for
identification. Feature matching between runs was done with a
retention time window of 2 min and the label-free quantification
(LFQ) function was enabled. The MaxQuant peptide and protein
quantification results from the ‘peptides.txt’ and
‘proteinGroups.txt’ files were imported into Perseus software
(version 1.5.1.6) for further analysis. Statistical significance
between the groups was assessed using one-way analysis of variance
(ANOVA). Proteins were defined as differentially expressed if the
ratios were ≥2 or ≤0.5 in RCC compared with adjacent normal tissue
with a significant change (p<0.01).
Hierarchical clustering, Gene Ontology
(GO) analysis, Kyoto Encyclopedia of Genes and Genomes (KEGG)
pathway and protein interaction network analysis
Hierarchical clustering was performed using MEV
software (v4.6, TIGR). The differentially expressed proteins
(p<0.01) were analyzed by hierarchical clustering to find
potential markers which can classify all samples.
Then, 210 dysregulated proteins were subjected to GO
and KEGG pathway analyses by DAVID (http://david.ncifcrf.gov). Predicted protein-protein
interaction networks for these 210 differentially expressed
proteins were performed by STRING (http://string-db.org/).
Western blot validation
Two most significantly dysregulated proteins (PCK1
and SNRPF) were chosen to be confirmed by western blotting.
Briefly, 20 µg of total protein were separated on a 10% SDS-PAGE
gel. Proteins were then transferred to a PVDF membrane and probed
with the following polyclonal antibodies: anti-PCK1 and anti-SNRPF
(ab28455 and ab156587, 1:500; Abcam). GAPDH (sc-48166, 1:1,000;
Santa Cruz Biotechnology, Inc.) was used as a loading control.
Protein expression was visualized after incubation with secondary
anti-rabbit antibodies conjugated with horseradish peroxidase and
enhanced chemiluminescence reagent.
The intensity of protein staining was determined
using Gel-Pro Analyzer 4.0. Log2 fold change (FC) in
expression of the two proteins between four ccRCC tumor tissues and
matched normal kidney tissues is presented as a graph.
Set-up of differentially expressed
genes for survival analysis
The expression levels of mRNAs were investigated in
47 paired ccRCC and normal tissue samples in the GEO dataset
(GSE3-GPL10) from the NCBI platform (http://www.ncbi.nlm.nih.gov/). Five dysregulated genes
(RPN1, CYP4F2, RPL27A, GSTM3, and DARS) showed the same trends with
our proteomic data and were chosen to be investigated in renal
cancer tissue samples in the TCGA database through the Oncomine
database (http://www.oncomine.org). Univariate
survival analysis of OS in RCC from the GEO database (GSE3-GPL10)
as determined by Kaplan-Meier plot estimates based on five
dysregulated expression genes.
Results
Identification of differentially
expressed proteins in four paired ccRCC and tumor-adjacent kidney
tissues
A total of four paired samples of ccRCC and
tumor-adjacent kidney tissues was analyzed in the initial discovery
phase. The same amounts of protein from each tissue were digested
with trypsin, then the peptides were analyzed by nano-LC-MS/MS on a
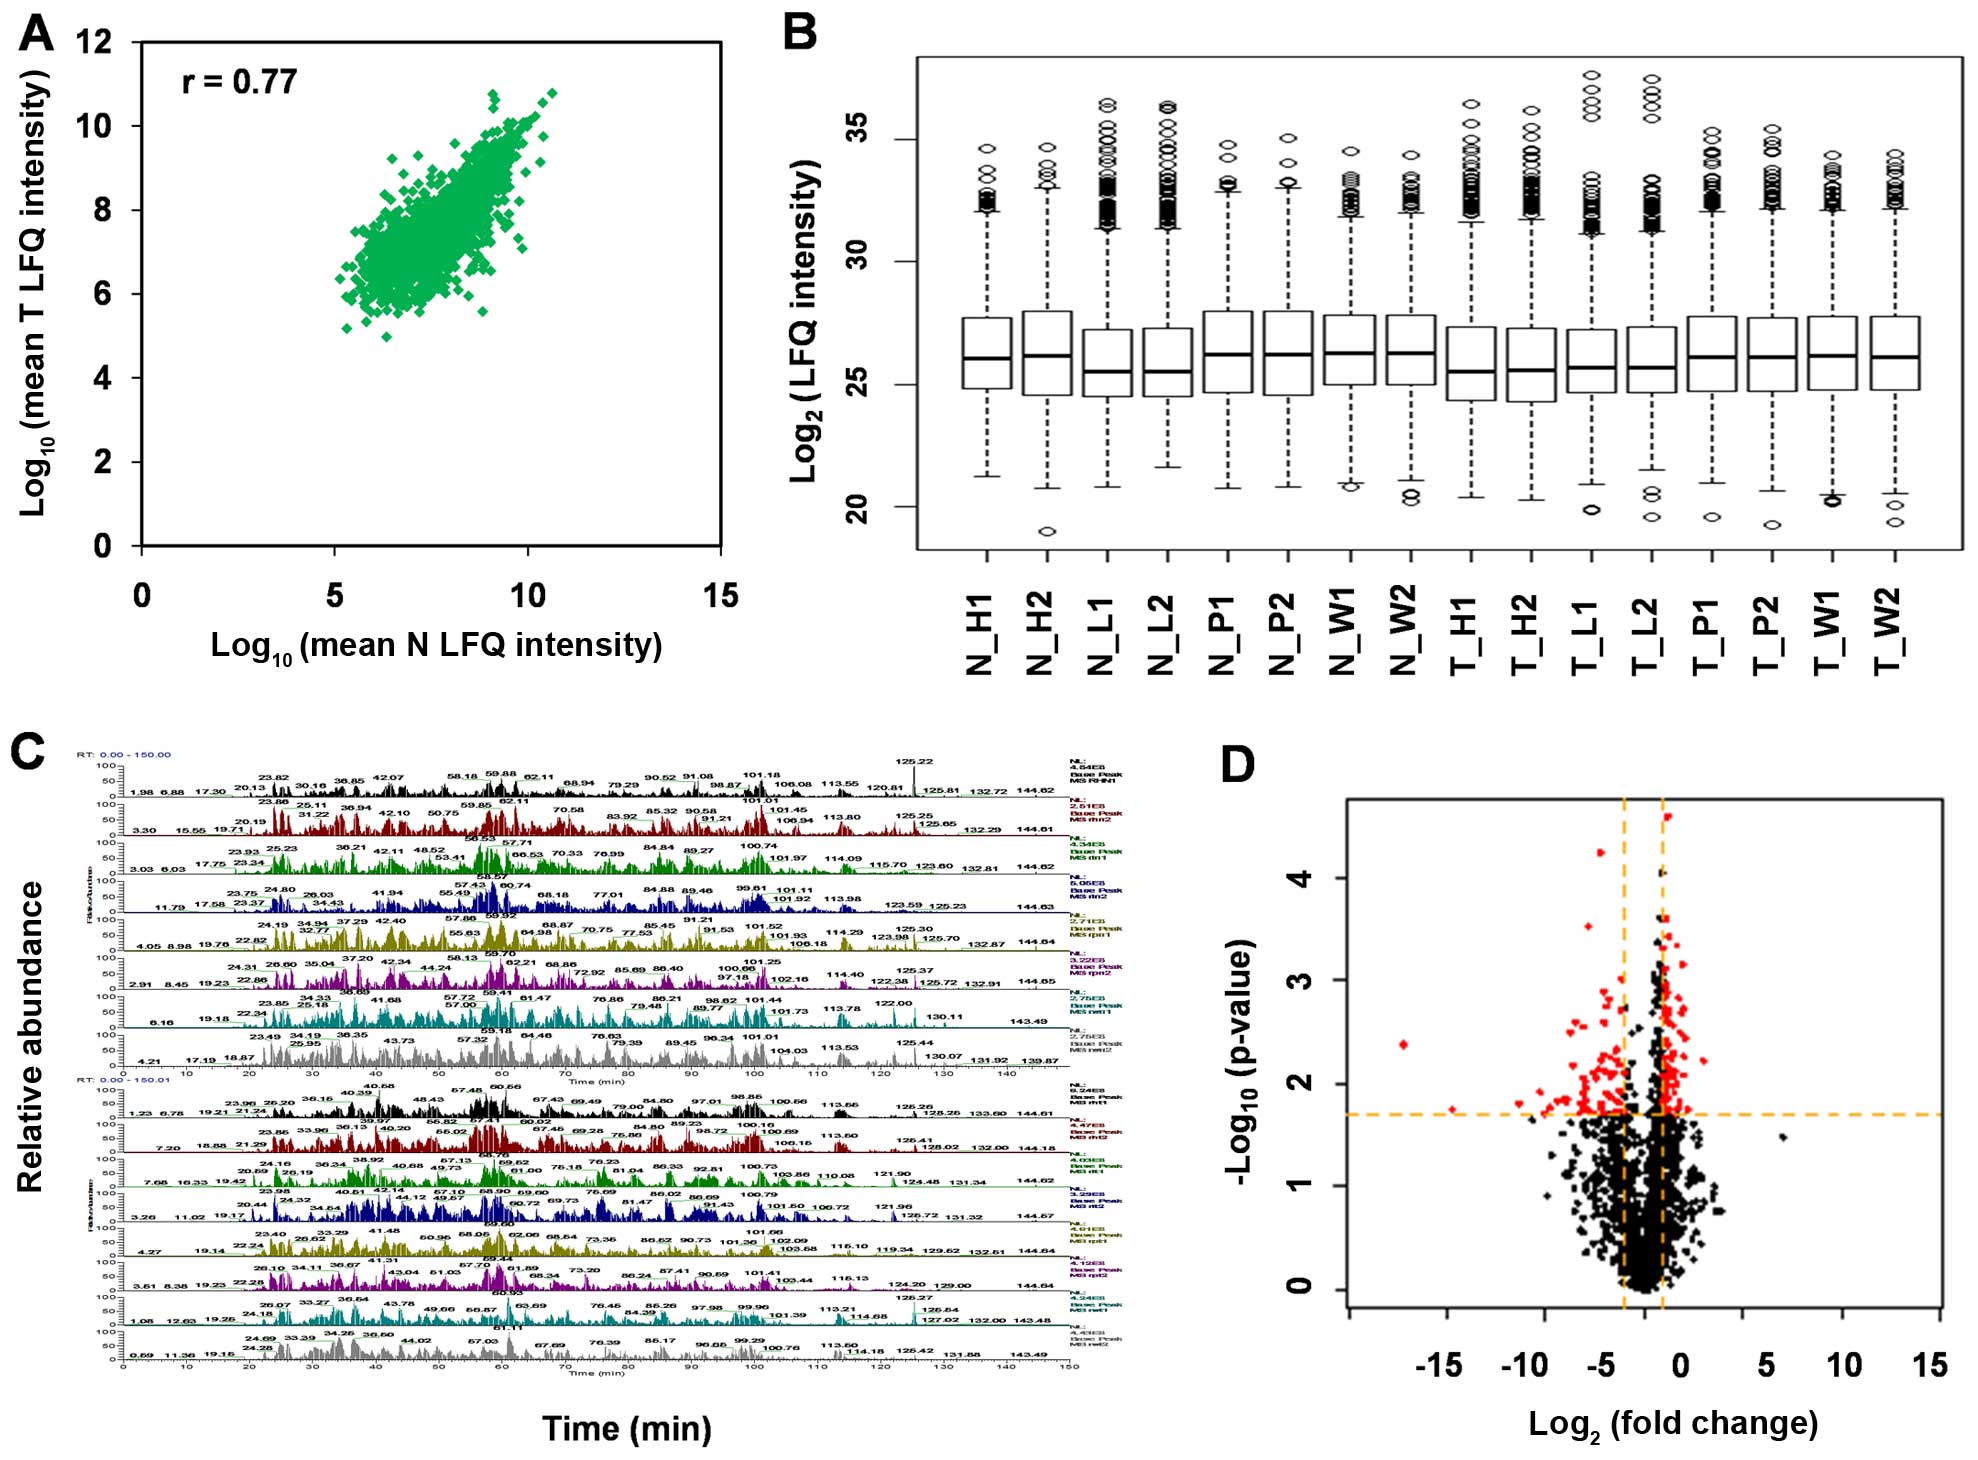
Orbitrap Velos Pro instrument. Scatter plot and box plot of protein
abundance (LFQ intensity) between RCC tissue and normal kidney
tissues show that protein expression variation between T and N is
close (r=0.77) (Fig. 1A and B). The
base peak mass chromatograms show the good method repeatability of
nano-LC-MS/MS (Fig. 1C).
Using MaxQuant, we identified a total of 3,061
non-redundant proteins with local FDR <1% and at least two
unique peptides per protein. To visualize the distribution of LFQ
intensity ratios for the tissue proteins, a volcano plot of the
log2 ratio of T/N vs. -log p-value was generated
(Fig. 1D). The majority of proteins
were showed to be at similar levels in the two tissues.
For the 3,061 proteins with LFQ intensity ratios
calculated, significant expression differences in protein levels
between the two tissues were determined by a Student's t-test
(p<0.01) and by having a difference of ≥2 or ≤0.5 FC between
tissues (log2 LFQ intensity ratio ≥2 or ≤0.5). Among the
210 proteins exhibiting significant differences (>2-fold
difference, p<0.01), there were 83 proteins with significantly
decreased levels in ccRCC tissue vs. normal kidney tissues and 127
proteins with significantly increased levels in ccRCC tissue.
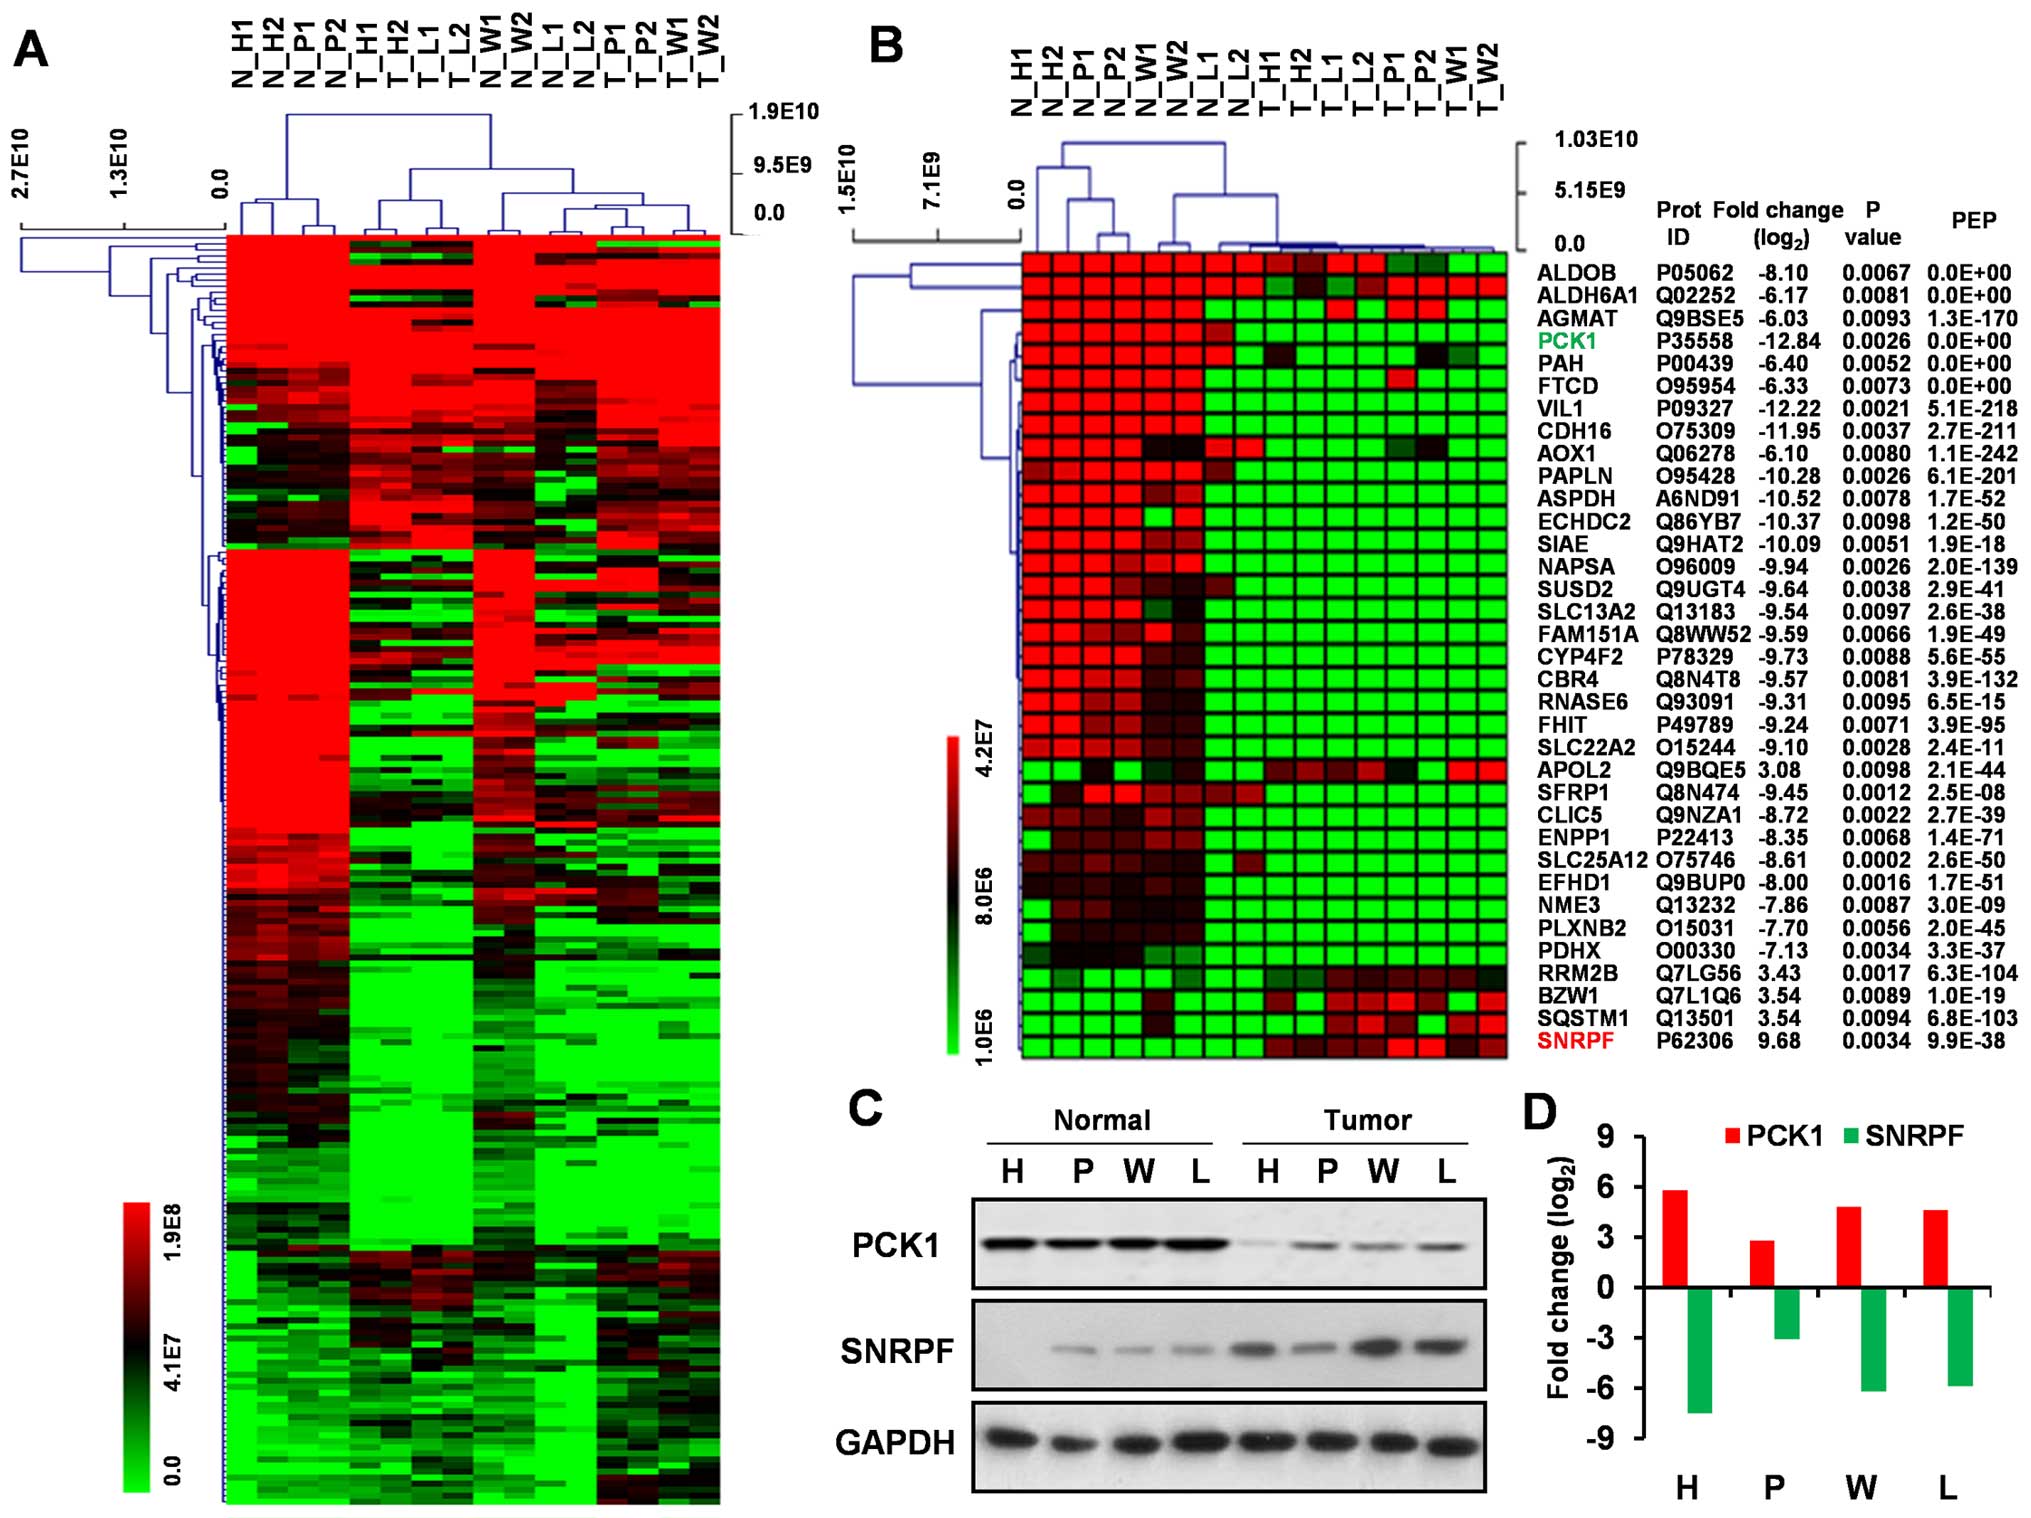
Hierarchical clustering for
significantly dysregulated proteins
A unsupervised hierarchical cluster analysis was
conducted on the significantly dysregulated proteins in ccRCC and
the heatmap obtained from the analysis showed similar protein
profile across four cases of RCC when compared with tumor-adjacent
kidney tissues (Fig. 2A and B). Of
all the proteins represented therein, 35 proteins displayed at
least a 3-fold increase or 6-fold decrease in expression (Fig. 2B).
Validation of dysregulated protein
expression
We analyzed two most dysregulated proteins (PCK1 and
SNRPF) using western blotting to validate our MS analysis using
samples from the same RCC patient group. The expression of SNRPF
was found to be upregulated and PCK1 downregulated in ccRCC
relative to normal kidney tissue when analyzed via western
blotting, which coincide with MS data (Fig. 2C and D).
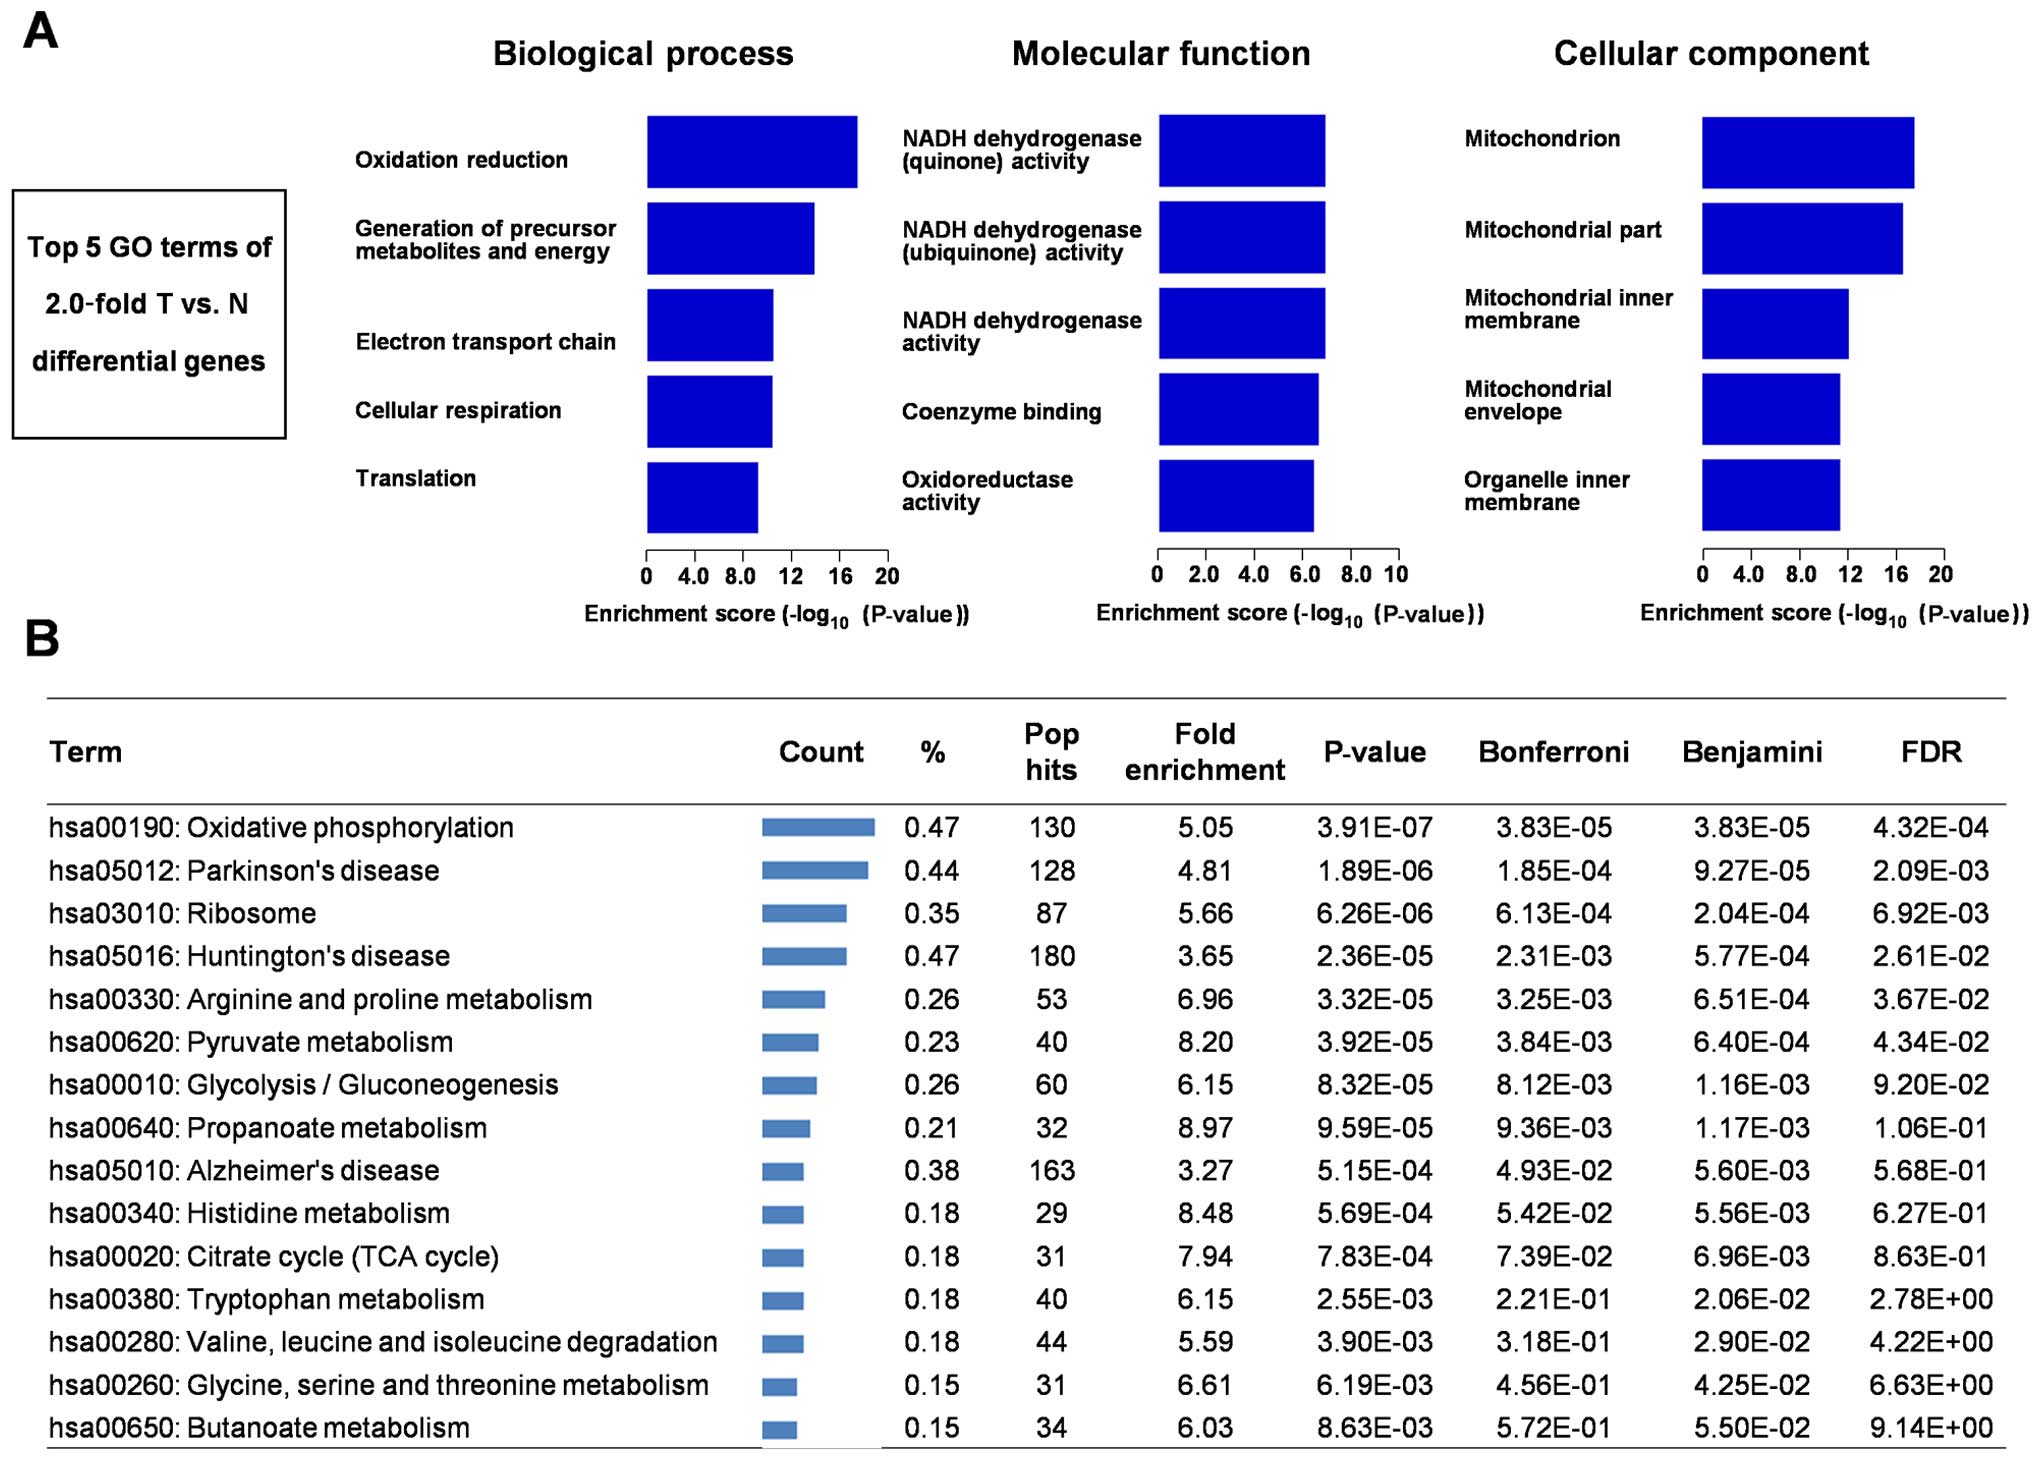
GO analysis
We next used GO to analyze 210 differentially
expressed proteins (Fig. 3A). In
biological process, the top five GO terms of 2.0-fold T vs. N
differential genes is oxidation reduction, generation of precursor
metabolites and energy, electron transport chain, cellular
respiration, and translation. In molecular function, the top five
GO terms of 2.0-fold T vs. N differential genes is NADH
dehydrogenase (quinone) activity, NADH dehydrogenase (ubiquinone)
activity, NADH dehydrogenase activity, coenzyme binding,
oxidoreductase activity. In cellular component, the top five GO
terms of 2.0-fold T vs. N differential genes is mitochondrion,
mitochondrial part, mitochondrial inner membrane, mitochondrial
envelope, and organelle inner membrane.
KEGG pathway analysis
We used the online tool DAVID for finding enriched
pathways for the 210 differentially expressed proteins. KEGG
pathway analysis of these differentially expressed proteins between
RCC and tumor-adjacent kidney tissues revealed some
metabolism-related pathways including oxidative phosphorylation,
glycolysis/gluconeogenesis and TCA cycle (Fig. 3B).
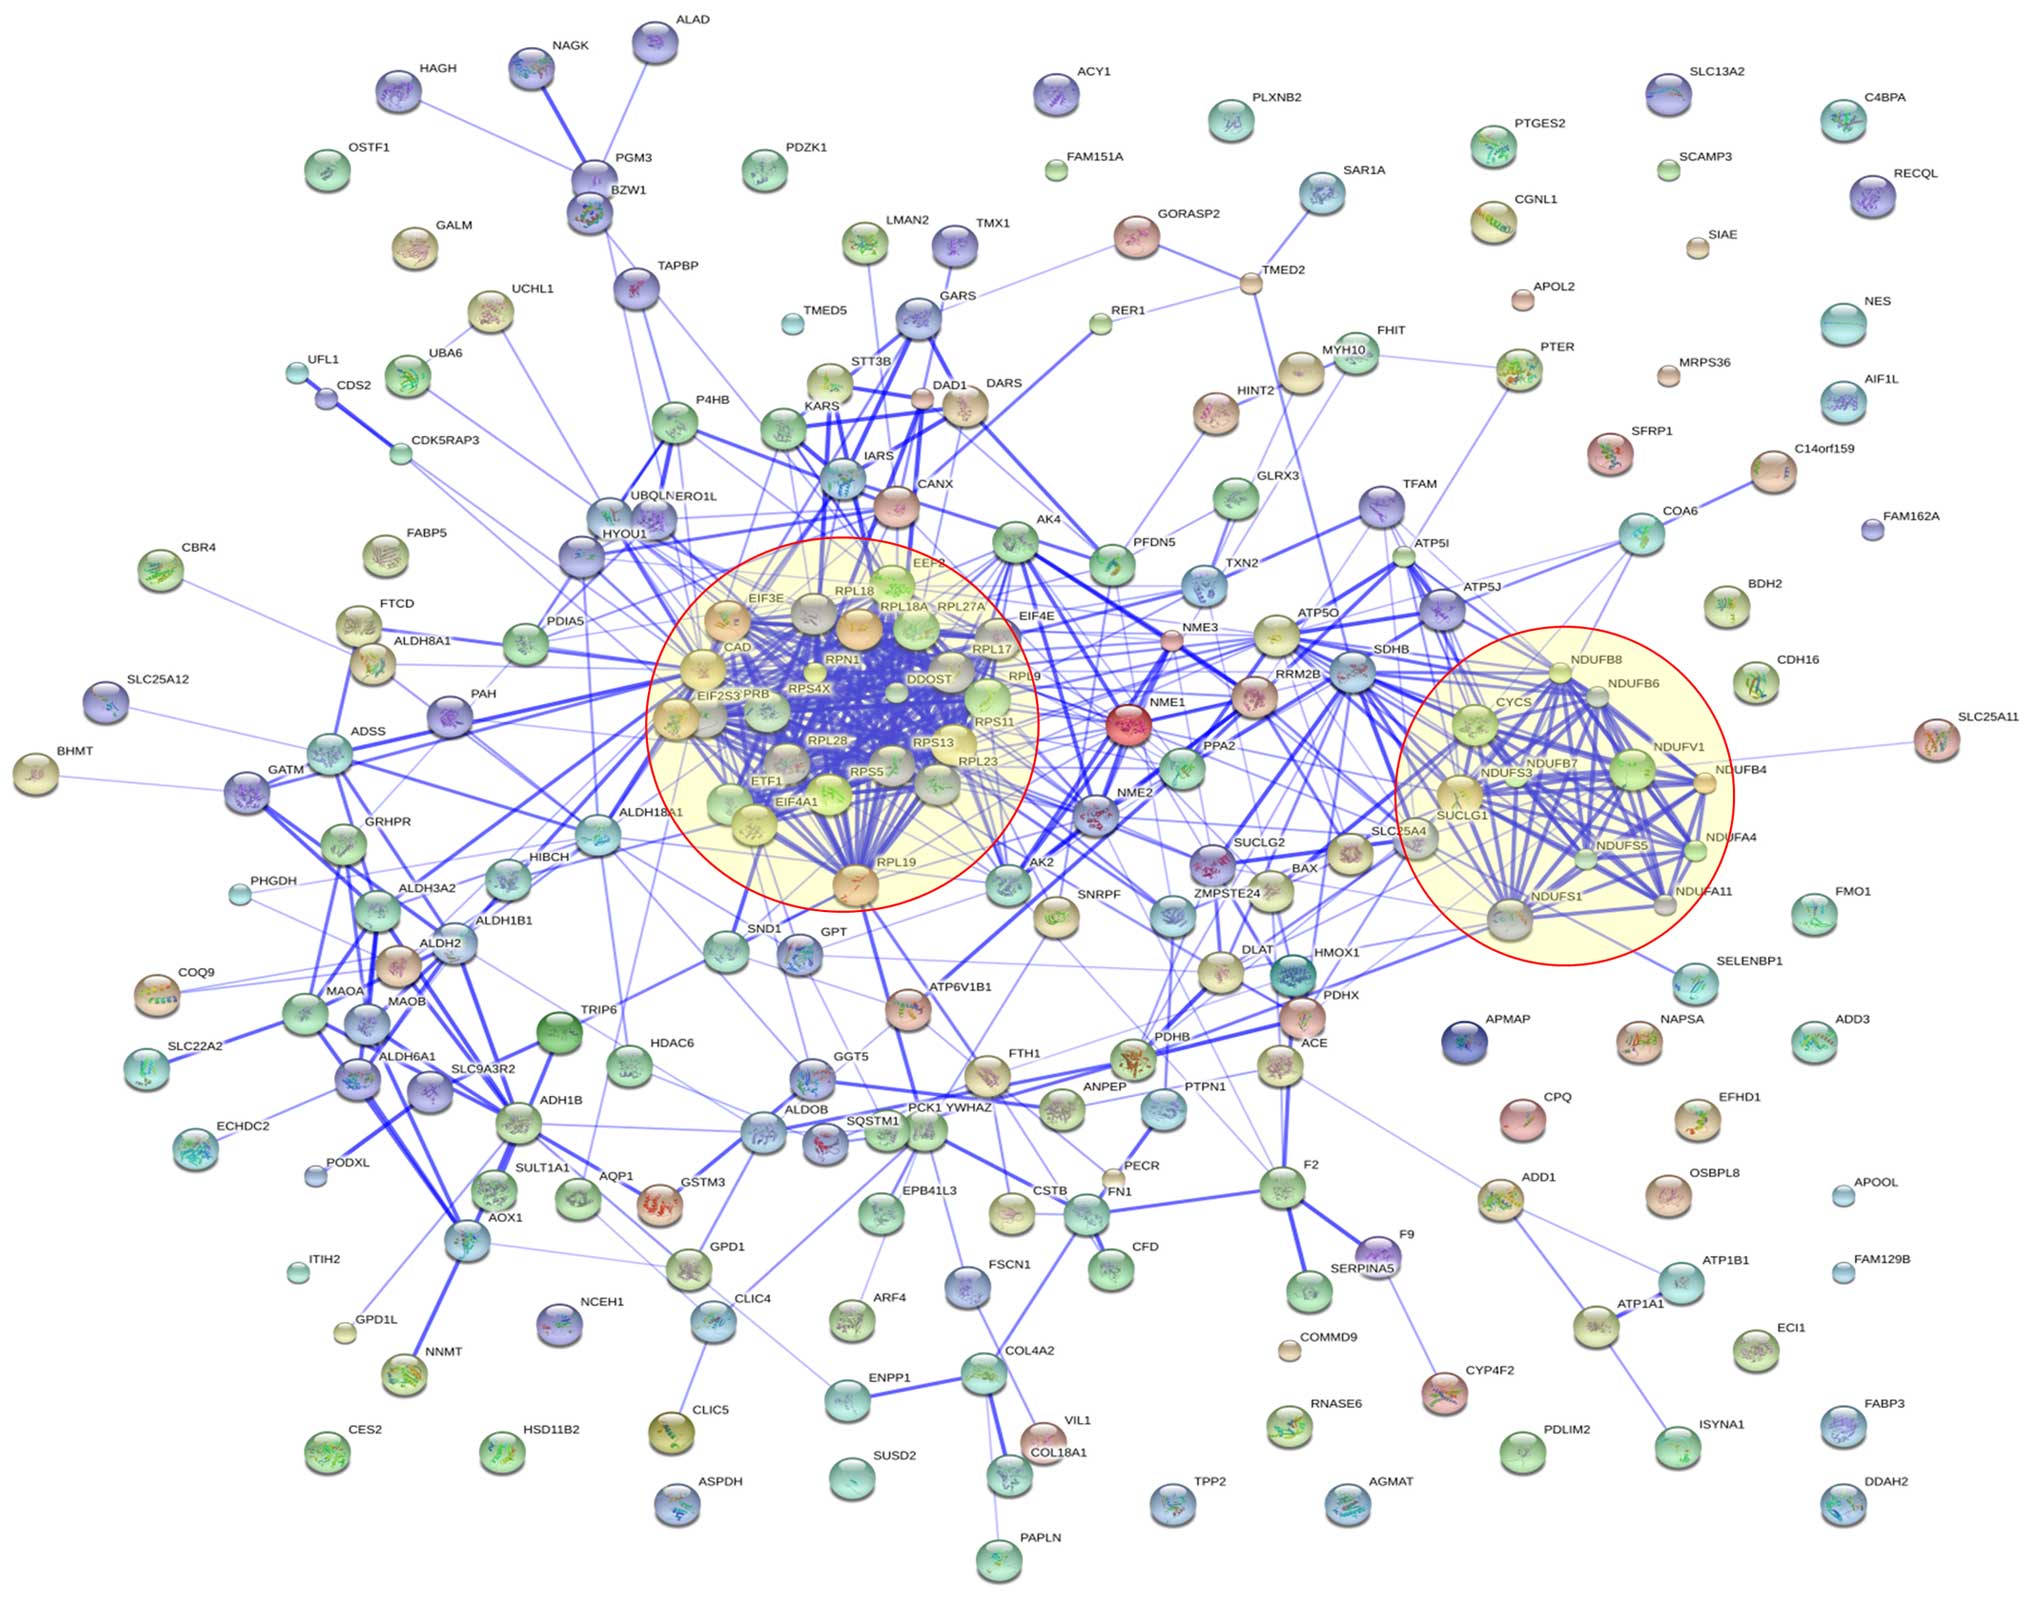
Protein interaction analysis
We also carried out protein-protein interaction
analysis and found significant protein-protein interactions among
these 210 dysregulated proteins. Several interaction groups were
obvious and these interaction groups were labeled with orange
circles. These proteins formed two main clusters: oxidative
phosphorylation and ribosome protein (Fig. 4).
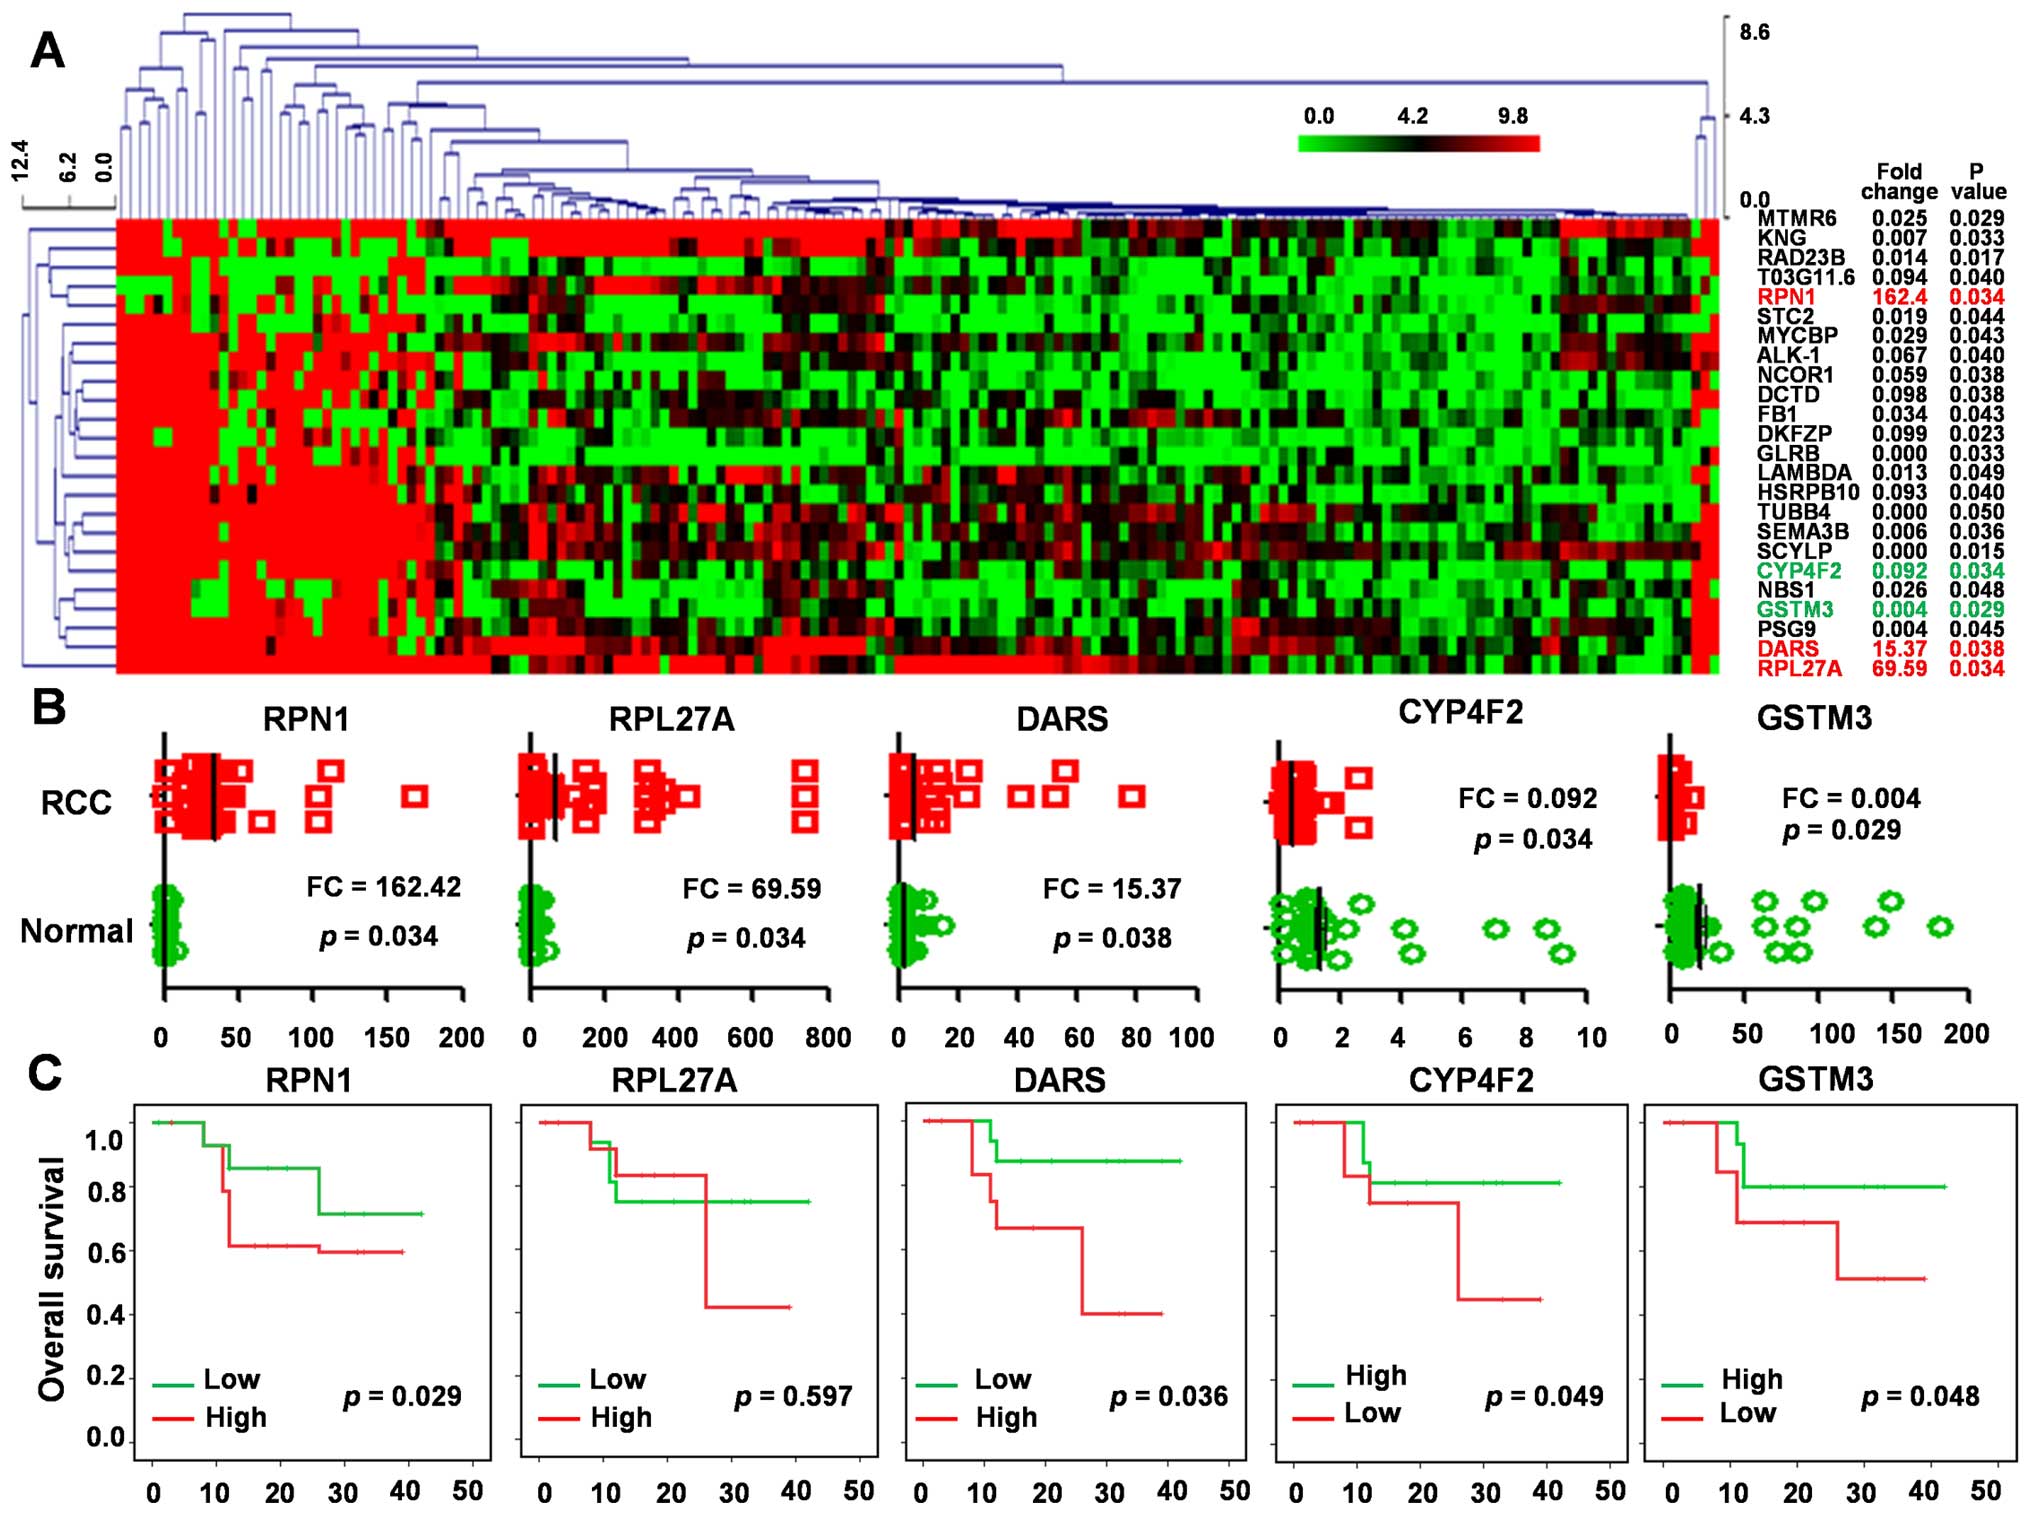
Identification of potential prognostic
factors from dysregulated expression
To investigate the expression of these 210
dysregulated proteins and its potential prognostic significance, we
downloaded a GEO dataset (GSE21362) from the NCBI platform
(http://www.ncbi.nlm.nih.gov/), which
included the mRNA microarry data from 47 paired normal kidney
tissues and ccRCCs with follow-up data. We found a total of 24
dysregulated expression genes with p<0.05 setting FC>10
(Fig. 5A). There are five
significantly dysregulated genes, which are also found in our MS
data. RPN1 (FC=162.42, p=0.034), RPL27A (FC=69.59,
p=0.034) and DARS (FC=15.37, p=0.038) gene in RCC tissue
were significantly higher and CYP4F2 (FC=0.092, p=0.034) and
GSTM3 (FC=0.004, p=0.029) were significantly lower than in
RCC relative to normal tissue (p<0.001, Fig. 5B).
We compared the mRNA expression of these
dysregulated proteins using the Oncomine database. This analysis
revealed that RPN1, RPL27A and DARS were
upexpressed and CYP4F2 and GSTM3 were downregulated
in tumor tissues when compared to normal tissues, which conform
with our MS results.
To determine the prognostic value of these
dysregulated expression genes in ccRCC, we used Kaplan-Meier
survival analysis to analyze the dataset (GSE21362) to link gene
expression with OS. The results showed that high expression of RPN1
(p=0.029) and DARS (p=0.036) correlated with worsened OS, whereas
high CYP4F2 (p=0.049) and GSTM3 (p=0.048) levels were associated
with increased OS (Fig. 5C), which
indicate that our data from comparative proteomic profiling can
identify some potential prognostic factors for human ccRCC.
Discussion
Early detection can significantly improve ccRCC
patient outcome. The clinical diagnosis of asymptomatic ccRCC is
often confirmed by imaging technology, such as CT and abdominal
ultrasonography. However, there is currently no validated biomarker
to enable reliable screening for renal masses, whether benign or
malignant (9). A more in-depth
understanding of the molecular basis and identification of new RCC
biomarkers would be beneficial for cancer management.
Most investigations to identify ccRCC-specific
biomarkers were aimed to analyzing genes (10–12) or
body fluid (e.g., urine, serum, and plasma) (13,14). A
considerable number of ccRCC-associated diagnostic or prognostic
markers have been previously identified based on comparative
analysis of ccRCC and normal kindey tissues, such as galectin-1,
CNDP2, cabindin, gelsolin, heart fatty acid-binding protein and
vimentin (9–14). However, these potential predictive
or prognostic biomarkers require proper validation by appropriately
designed randomized studies.
Proteomic-based approaches allow analyses not only
at translational levels, but also at complex post-translational
levels, particularly protein modifications like phosphorylation and
glycosylation, which are not detected by gene analysis. MS-based
proteomic approaches are well-suited for unveiling the complex
molecular events of tumorigenesis and identification of cancer
biomarkers.
There are several methods for protein separation and
quantitative analysis of protein mixtures: two-dimensional
polyacrylamide gel electrophoresis (2D-PAGE) followed by MS or
MS/MS, stable isotope-labeling preparation coupled with LC-MS/MS,
label-free preparation coupled with LC-MS/MS. However, for 2D-PAGE,
it is difficult to detect proteins that are small (<10 kDa),
large (>150 kDa), very basic (or acidic), hydrophobic, and
remains a labor-intensive approach (15). Some limitations of the labeling
approaches include increased sample preparation time, more complex
methodology and higher costs attributed to labeling reagents, and
only possible in several samples (16).
Label-free methods make use of no isotope labels and
therefore are simpler in sample preparation and lowest in cost. It
can also compare theoretically an unlimited number of treatment
conditions (17). The past decade
has witnessed a rapid increase in the use of label-free methods,
which show its potential for identification and quantification of
differentially expressed proteins in normal and diseased
samples.
In this study, we aim to identify potential tumor
biomarker through proteomic analysis in the tissue from renal
patient cohort. We performed quantitative analysis using label-free
sample preparation and LC-MS/MS to identify proteins that are
dysregulated in ccRCCs compared to tumor-adjacent kidney tissues.
The reliability and practicability of label-free proteomic analysis
was confirmed by using western blotting to validate the two most
dysregulated proteins. Hierarchical clustering analysis showed that
these proteins can distinguish between normal and cancer tissue
with accuracy. Furthermore, using GO and KEGG pathway analyses, we
elucidated the potential involvement of these differentially
expressed proteins in ccRCC pathogenesis. More importantly, our
data provided some potential prognostic factors for human
ccRCC.
Acknowledgements
This study was supported partly by grants from the
National Natural Science Foundation of China (81372175, 81472501,
81472202 and 81302065). The funders had no role in the study
design, data collection and analysis, decision to publish, or
preparation of the manuscript.
References
|
1
|
Rini BI, Campbell SC and Escudier B: Renal
cell carcinoma. Lancet. 373:1119–1132. 2009. View Article : Google Scholar : PubMed/NCBI
|
|
2
|
Znaor A, Lortet-Tieulent J, Laversanne M,
Jemal A and Bray F: International variations and trends in renal
cell carcinoma incidence and mortality. Eur Urol. 67:519–530. 2015.
View Article : Google Scholar : PubMed/NCBI
|
|
3
|
Ljungberg B: The role of metastasectomy in
renal cell carcinoma in the era of targeted therapy. Curr Urol Rep.
14:19–25. 2013. View Article : Google Scholar : PubMed/NCBI
|
|
4
|
Singer EA, Gupta GN, Marchalik D and
Srinivasan R: Evolving therapeutic targets in renal cell carcinoma.
Curr Opin Oncol. 25:273–280. 2013.PubMed/NCBI
|
|
5
|
Nelson EC, Evans CP and Lara PN Jr: Renal
cell carcinoma: Current status and emerging therapies. Cancer Treat
Rev. 33:299–313. 2007. View Article : Google Scholar : PubMed/NCBI
|
|
6
|
Raimondo F, Corbetta S, Chinello C, Pitto
M and Magni F: The urinary proteome and peptidome of renal cell
carcinoma patients: A comparison of different techniques. Expert
Rev Proteomics. 11:503–514. 2014. View Article : Google Scholar : PubMed/NCBI
|
|
7
|
Boersema PJ, Aye TT, van Veen TA, Heck AJ
and Mohammed S: Triplex protein quantification based on stable
isotope labeling by peptide dimethylation applied to cell and
tissue lysates. Proteomics. 8:4624–4632. 2008. View Article : Google Scholar : PubMed/NCBI
|
|
8
|
Neilson KA, Ali NA, Muralidharan S,
Mirzaei M, Mariani M, Assadourian G, Lee A, van Sluyter SC and
Haynes PA: Less label, more free: Approaches in label-free
quantitative mass spectrometry. Proteomics. 11:535–553. 2011.
View Article : Google Scholar : PubMed/NCBI
|
|
9
|
Pantuck AJ, Zisman A and Belldegrun AS:
The changing natural history of renal cell carcinoma. J Urol.
166:1611–1623. 2001. View Article : Google Scholar : PubMed/NCBI
|
|
10
|
Feldstein MS, Rhodes DJ, Parker AS, Orford
RR and Castle EP: The haphazard approach to the early detection of
asymptomatic renal cancer: Results from a contemporary executive
health programme. BJU Int. 104:53–56. 2009. View Article : Google Scholar : PubMed/NCBI
|
|
11
|
Siu KWM, DeSouza LV, Scorilas A, Romaschin
AD, Honey RJ, Stewart R, Pace K, Youssef Y, Chow TF and Yousef GM:
Differential protein expressions in renal cell carcinoma: New
biomarker discovery by mass spectrometry. J Proteome Res.
8:3797–3807. 2009. View Article : Google Scholar : PubMed/NCBI
|
|
12
|
White NM, Masui O, Desouza LV, Krakovska
O, Metias S, Romaschin AD, Honey RJ, Stewart R, Pace K, Lee J, et
al: Quantitative proteomic analysis reveals potential diagnostic
markers and pathways involved in pathogenesis of renal cell
carcinoma. Oncotarget. 5:506–518. 2014. View Article : Google Scholar : PubMed/NCBI
|
|
13
|
Atrih A, Mudaliar MA, Zakikhani P, Lamont
DJ, Huang JT, Bray SE, Barton G, Fleming S and Nabi G: Quantitative
proteomics in resected renal cancer tissue for biomarker discovery
and profiling. Br J Cancer. 110:1622–1633. 2014. View Article : Google Scholar : PubMed/NCBI
|
|
14
|
Raimondo F, Corbetta S, Savoia A, Chinello
C, Cazzaniga M, Rocco F, Bosari S, Grasso M, Bovo G, Magni F, et
al: Comparative membrane proteomics: A technical advancement in the
search of renal cell carcinoma biomarkers. Mol Biosyst.
11:1708–1716. 2015. View Article : Google Scholar : PubMed/NCBI
|
|
15
|
Wang M, You J, Bemis KG, Tegeler TJ and
Brown DP: Label-free mass spectrometry-based protein quantification
technologies in proteomic analysis. Brief Funct Genomics
Proteomics. 7:329–339. 2008. View Article : Google Scholar
|
|
16
|
Aebersold R and Mann M: Mass
spectrometry-based proteomics. Nature. 422:198–207. 2003.
View Article : Google Scholar : PubMed/NCBI
|
|
17
|
Old WM, Meyer-Arendt K, Aveline-Wolf L,
Pierce KG, Mendoza A, Sevinsky JR, Resing KA and Ahn NG: Comparison
of label-free methods for quantifying human proteins by shotgun
proteomics. Mol Cell Proteomics. 4:1487–1502. 2005. View Article : Google Scholar : PubMed/NCBI
|