Introduction
Colon melanosis coli (MC) refers to colonic mucosa
pigmentation lesions, in which macrophages in the colonic lamina
propria contain lipofuscin-like substances that are rare in
non-inflammatory diseases (1–3). At
present, most studies have focused on the risk factors of MC
(4), or the relationship between MC
and proliferative diseases such as colorectal adenoma and colon
cancer.
The relationship between MC and tumors is one issue
that has received increased research attention. In a retrospective
study on 14 study reports, Sonnenberg et al (5) proposed that the administration of
anthraquinone and glycosides was associated with a higher incidence
of colorectal cancer, compared with other laxatives; and the
difference was statistically significant. However, Zhang et
al (6) provided a different
conclusion through a prospective study. Various scholars have found
through the application of gene chip technology that the expression
of protein metallopanstimulin-1 (MPS-1) in colonic MC tissues is
3.9 times higher than that of normal colon tissues, and thioredoxin
expression was increased by 3.4 times; which indicates that MC may
be associated with the occurrence of colon cancer (7,8). A
study conducted by Wang et al (9) on the expression of the Hedgehog (Hh)
signaling pathway suggested that MC may be associated with colon
cancer from one side. Although a variety of clinical studies on the
relationship between MC and colon cancer have been carried out
domestically and internationally, these results remain
inconsistent. In recent years, comparative proteomics has achieved
rapid development, and has been widely used in cancer research.
Thus, a branch of ‘cancer proteomics’, has been formed which
provides more opportunities or concepts for the diagnosis of tumors
(10). The maturation of proteomic
technology and its extensive application in various fields provide
favorable conditions for the use of comparative proteomics in
research concerning the relationship between MC and colon cancer.
In the present study, protein expression in MC tissues and its
biological function were investigated at the proteomic level.
Related protein molecules were identified, which provide favorable
conditions for the development of the biological study of MC.
Materials and methods
General information
A total of 45 subjects who received medical service
at our hospital from January 2013 to June 2014 were enrolled in the
present study. Among these patients, 15 patients were diagnosed
with MC, 15 patients were diagnosed with melanosis coli with colon
cancer (MCCC), and the remaining 15 subjects had normal colon
tissues. Four pieces of tissues from diseased or normal sites were
obtained from each subject. After washing with phosphate-buffered
saline (PBS), the samples were stored in liquid nitrogen.
Differences in age and gender across these three groups were not
statistically significant.
Inclusion criteria included black, brown or dark
gray colonic mucosa under colonoscopy; yellow or pink edges and
early pathological tissues that presented tiger skin or snakeskin
stripes; were penang section- or patch-shaped. Under microscopy,
infiltration of large mononuclear cells containing a great amount
of melanin and melanin pigmentation could be observed in the lamina
propria of colon mucosa, while other layers of the intestinal wall
were normal. From normal subjects, colon tissues without MC, MCCC,
polyps and inflammatory or non-inflammatory bowel diseases were
obtained. Colon tissue samples were confirmed by a pathologist as
MC, MCCC or normal colon tissues. Exclusion criteria included
patients with other bowel diseases, patients who underwent
treatment, patients who could not tolerate an endoscopic
examination and patients with diseases that influence protein
metabolism.
Consent was provided by the subjects for the
acquisition of the experimental samples, and the study protocol was
approved by the Ethics Committee of Henan University of Science and
Technology.
Therapeutic methods
Preparation of colon tissue samples
Approximately 0.1 g of sample was obtained and
placed in a pre-frozen PBS solution at 4°C for processing. After
the separation of other tissues, the sample was dried by filter
paper. After the addition of reagents, the sample was placed in an
ice bath, underwent cell disruption using an ultrasonic cell
crusher, and was quantitatively analyzed.
Quantitation of protein samples
Protein concentrations in the tissue samples were
determined by Bradford protein assay. Protein concentration was
6.03 g/l in the colon cancer tissue, 6.65 g/l in the MC tissue and
2.90 g/l in the normal colon tissue.
Two-dimensional gel electrophoresis
The first dimension included immobilized pH gradient
isoelectric focusing [IPG-IEF (pH3-10NL)] for electrophoresis as
follows. i) The prepared protein samples were preserved in a
refrigerator at −80°C. ii) Re-swelling solution was added to the
groove of the re-swelling tray, in which the surface was covered
with an oily DryStrip cover fluid to prevent moisture from
evaporating and affect the IEF (pH3-10NL). Then, the sample was
maintained overnight (12–16 h at room temperature). iii)
Isoelectric focusing electrophoresis was carried out.
The second dimension consisted of vertical plate
sodium dodecyl sulfate-polyacrylamide gel electrophoresis
(SDS-PAGE) (Table I): i) SDS
polyacrylamide gel with T=13% was prepared. ii) Gel strip
equilibration. iii) Vertical plate SDS-PAGE (Table II).
 | Table I.Parameter settings for the IEF
program. |
Table I.
Parameter settings for the IEF
program.
| Step | Voltage (V) | Time (h/Vh) | Mode |
|---|
| S1 |
500 |
0.1 | Step-on-hold |
| S2 |
40 |
6 | Step-on-hold |
| S3 |
500 |
1 | Step-on-hold |
| S4 |
1,000 |
2 | Gradient |
| S5 |
3,000 |
2 | Gradient |
| S6 |
5,000 |
2 | Gradient |
| S7 | 10,000 |
3 | Gradient |
| S8 | 10,000 | 63,200 | Step-on-hold |
| S9 |
500 |
10 | Step-on-hold |
| Table II.The gel formulation of the vertical
plate SDS-PAGE. |
Table II.
The gel formulation of the vertical
plate SDS-PAGE.
| Agent | Volume |
|---|
| H2O | 47.4
ml |
| Acr/Bis
(30/0.8%) | 69.2
ml |
| Tris (1.5 M pH
8.8) | 40.0
ml |
| 10% SDS | 1,600 µl |
| 10% APS | 1,600 µl |
| TEMED |
64 µl |
| Total volume | 160
ml |
Dyeing and preservation of SDS polyacrylamide
gel
This stage consisted of i) Coomassie brilliant blue
staining and ii) preservation of the SDS polyacrylamide gel. The
gel, which displayed the protein spots after staining, was placed
in 7% glacial acetic acid; and image scanning was immediately
performed. If the protein spots were not intended to be extracted,
the gel would be prepared into a dry strip for long-term
preservation.
Image contrast
For disparate spots acquired by contrast of
two-dimensional gel electrophoresis, the UMAX image scanner III
(setting, optical resolution at 300 dpi, pixel standard at 16 bits
and white light scanning was selected) was used for image
acquisition. Image save mode was set as a 16-bit TIF. Then, images
were analyzed using ImageMaster 7.0. With an ANOVA value of
<0.05 and multiple proportions >1.5, ImageMaster 7.0 was used
for image contrast. The spot parameter ‘smooth’ was set at 3, ‘Min
area’ was set at 65, and ‘salience’ was set at 250. The image
analysis process included the detection, quantification and
matching of protein spots.
Analysis software SPSS 19.0 was used for data
processing. The two groups of gels were compared by t-test, and
P<0.05 was considered statistically significant. Spots with
multiple proportions >1.5 times (that is, the difference in
expression amount was >1.5 times) were selected as protein spots
that were sought for in this experiment, and as candidate protein
spots for the subsequent mass spectrometry identification.
Mass spectrogram acquisition and analysis
Approximately 0.5–1 µl of sample was obtained,
target-dripped and dried. Dripping of the matrix (HCCA; 2.5 mg/ml)
was repeated 2–3 times (0.3–0.4 µl at a time). After drying, these
were used for shooting on the machine. Mass spectrometer was ABI
MALDI TOF 4800 (Applied Biosystems, Inc., Foster City, CA, USA);
mass spectrum scanning mode, reflection; scan range, 900–4,000 Da;
laser energy, MS4200 and MSMS4800. In each first order mass
spectrum, 10 parent ions were selected for the secondary mass
spectrum. Search in the NCBI gene sequence database was performed
using the software, Mascot (P<0.05).
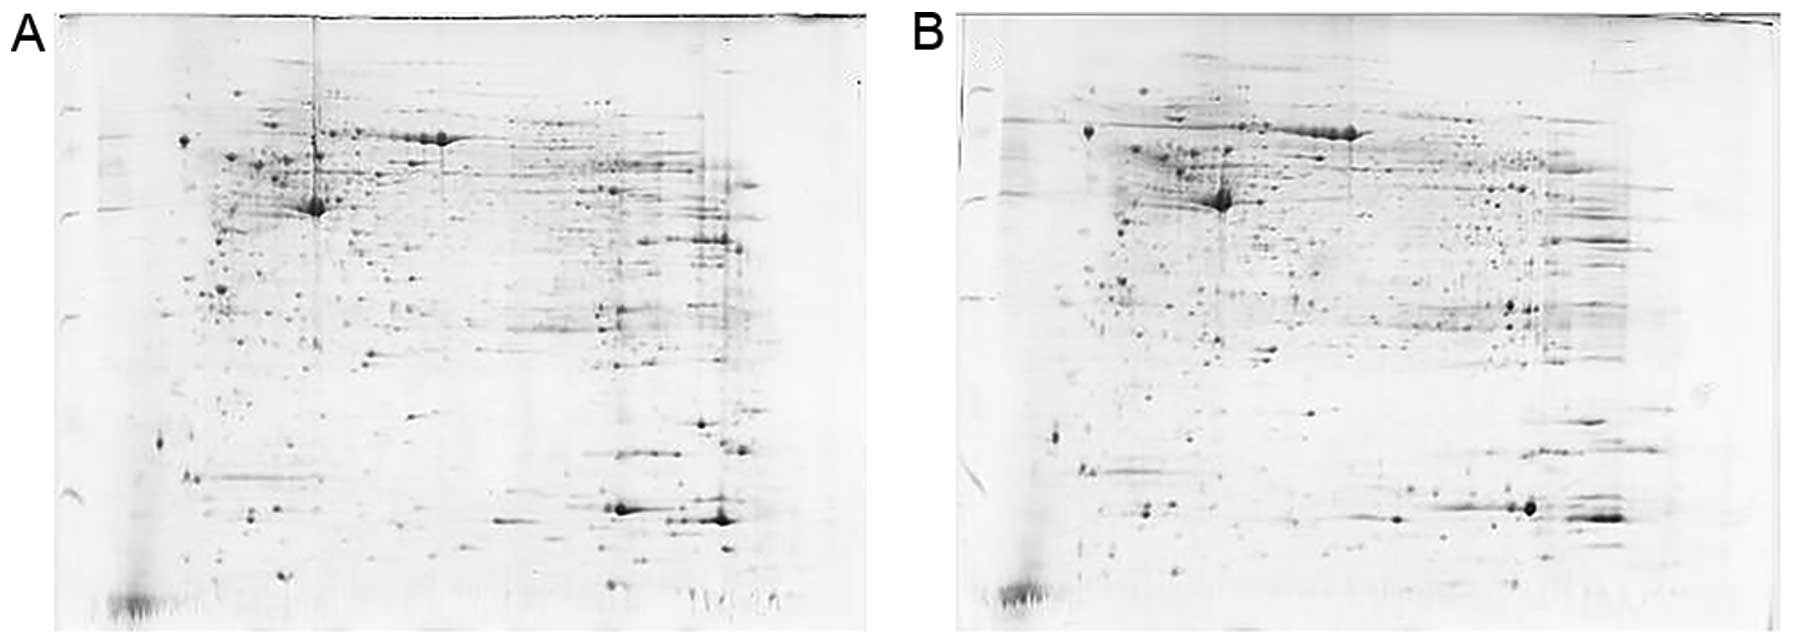
Preliminary experimental results
First, MC and MCCC samples were obtained for the
preliminary experiment, in accordance with the above operations; in
order to test the feasibility of the operation (Fig. 1).
Results
Repeatability analysis of
two-dimensional gel electrophoresis figure
The three images of the two-dimension
electrophoresis gel of the same sample were compared using the gel
image contrast software, ImageMaster 7.0. This was performed to
test the repeatability of the experiment. The three gel images in
each group appeared to be basically similar. Each image had a clear
separation between the spots, and the matching rate was >80%.
These findings indicate that the position of each protein spot on
the gel images had good reproducibility. Therefore, gel image
analysis could give the relative protein content of each protein
band; and the results of the image analyses were also relative
reliable.
Contrast analysis of two-dimensional
gel electrophoresis figure
Image analysis
This process included the detection of protein
spots, quantification of protein spots, removal of the background,
and protein spot matching. Before the automatic detection of
protein spots, parameters were first set; and the largest, weakest
and smallest protein spots were determined. After the automatic
detection of protein spots, each protein spot was assigned to a
specific SSP code. Then, these protein spots were edited, and some
impurities were removed from the protein spots. In comparing
between MC and MCCC, one piece of two-dimensional electrophoresis
gel with a clear image was assigned as a reference; and the image
synthesized from a few pieces of gel was also assigned as a
reference. The same method was used to compare the MC and normal
tissues. In addition, some corresponding matching spots were
set-up, and these matching spots were automatically used to match
other protein spots. Protein spots that could not be matched with
the spots in the reference gel were automatically added to the
reference gel. The sum of the intensity values of all pixels that
constitute a protein spot was defined as the amount of the protein
spot. The amount of each protein spot was expressed in percentage
(% vol); that is, the percentage of one single protein spot
accounting for the sum of the total protein spots in the gel. Two
groups of gel were compared and analyzed using SPSS 19.0 software.
These spots with multiple proportions >1.5 times (that is, the
difference of the expression amount was >1.5 times) were
selected as protein spots that were sought for in this experiment,
and as a candidate protein spot for the subsequent mass
spectrometry identification.
Analysis and comparison of the results
i) The average protein spot number of the sample
gels of MCCC, MC and normal tissues were 2,150±240, 1,970±138 and
2,028±176, respectively. In comparison, among the nine pieces of
gel images, a total of 14 differentially expressed protein spots
with a confidence level of >95% were found.
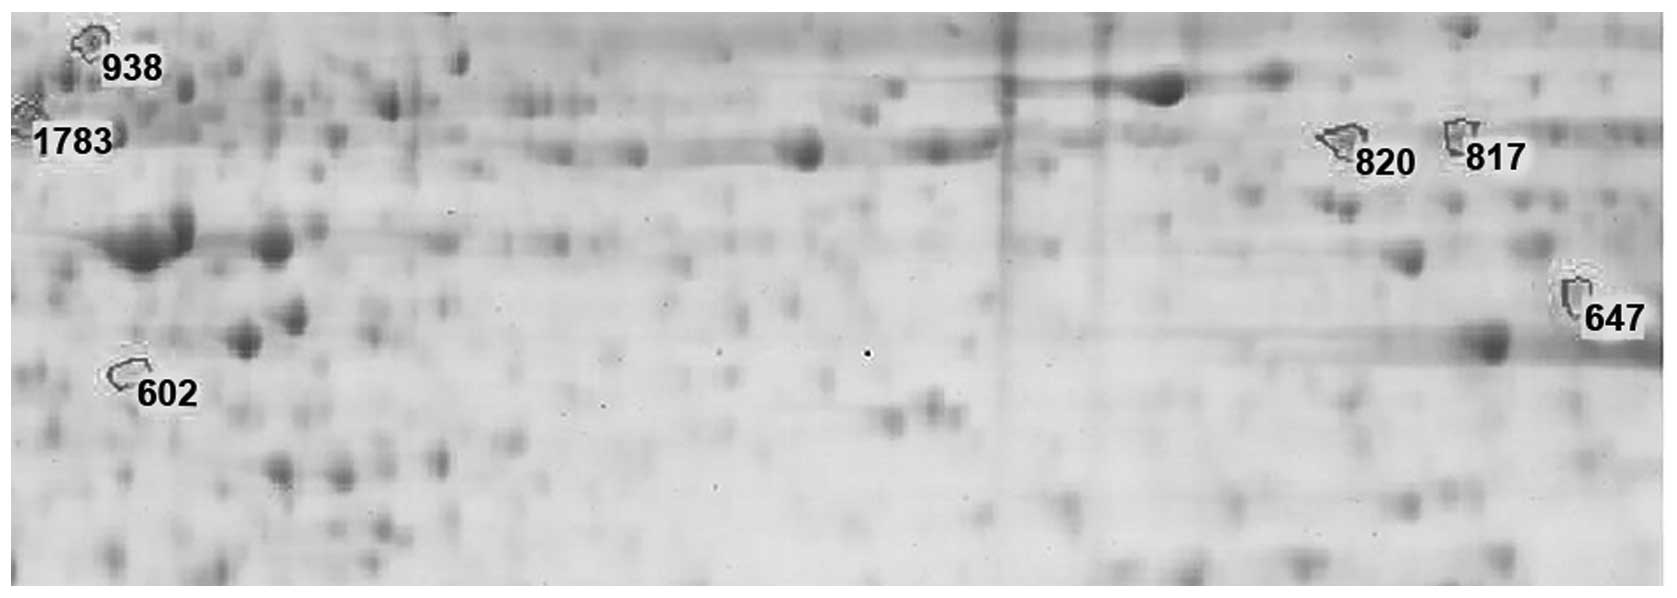
ii) Comparison between the MC and normal tissues was
carried out. a) There were six differently expressed protein spots
(Fig. 2). Among these, five spots
existed in both gel images of the MC and normal tissues; and the
number of spots that were expressed only in MC was one, namely spot
1783 (P<0.05). b) Spot 602, 647, 817 and 820 revealed a
downregulated expression in the MC tissues; and two spots, 938 and
1783, displayed upregulated expression in the MC tissues. Spot 1783
was expressed only in MC (P<0.05), which had an average relative
protein content of 0.078 (Table
III).
| Table III.The protein spots diplaying
differential expression between MC and normal tissues. |
Table III.
The protein spots diplaying
differential expression between MC and normal tissues.
|
| Average relative
protein content (% vol) |
|
|---|
|
|
|
|
|---|
| Protein spot | MC | Normal tissue | P-value |
|---|
| 602 | 0.021774 |
0.047104 | 0.01 |
| 647 | 0.041156 | 0.08436 | 0.02 |
| 817 | 0.051121 | 0.08809 | 0.01 |
| 820 | 0.064543 |
0.184723 | 0.00 |
| 938 | 0.064177 | 0.04425 | 0.00 |
| 1783 | 0.077631 |
| 0.00 |
Fig. 2 shows that
the size and dyeing shades of the corresponding differentially
expressed protein spots in the gel images of the MC and normal
tissues were different. The larger area or deeper staining spot
suggests a large relative content that accounts for the total
protein spots.
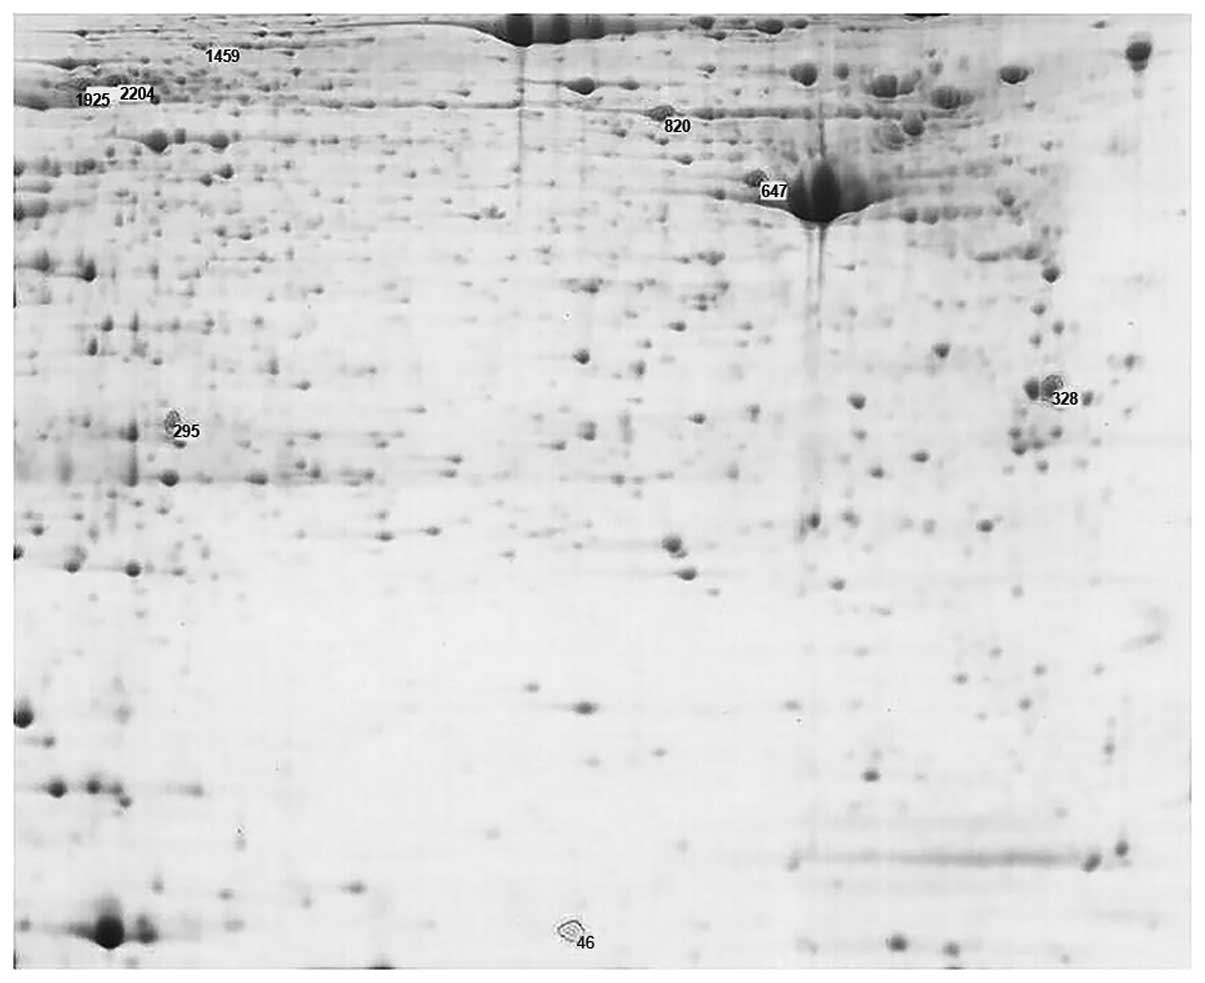
iii) Comparison between MC and MCCC tissues was
carried out (Fig. 3). There were
eight differentially expressed protein spots, in which six spots
existed in the MC and MCCC tissues, and two protein spots were only
expressed in the MCCC tissues; and these were spots 46 and 2204.
Spot 295 displayed an upregulated expression in the MC tissues, and
seven protein spots, namely spots 46, 328, 647, 820, 1457, 1925 and
2204, exhibited upregulated expression in the MCCC tissues. Two
proteins were only expressed in the MCCC tissues, namely spots 46
and 2204 (P<0.05). Among these, average relative protein
contents were 0.0778 and 0.278 (Table
IV).
| Table IV.The protein spots diplaying
differential expression between MC and colon cancer tissues. |
Table IV.
The protein spots diplaying
differential expression between MC and colon cancer tissues.
|
| Average relative
protein content (% vol) |
|
|---|
|
|
|
|
|---|
| Protein spot | MC | MC with colon
cancer | P-value |
|---|
|
46 |
|
0.077844 | 0.00 |
|
295 | 0.639534 |
0.158345 | 0.00 |
|
328 | 0.182761 |
0.329592 | 0.00 |
|
647 | 0.041156 |
0.250868 | 0.00 |
|
820 | 0.064543 |
0.369613 | 0.00 |
| 1457 | 0.016213 | 0.03767 | 0.00 |
| 1925 | 0.010432 |
0.230579 | 0.00 |
| 2204 |
|
0.278172 | 0.00 |
Results of protein identification
Protein identification was performed through
comparison between the peptide mass fingerprint spectrum of the
protein spots and protein data in the NCBI-nr database using the
software, Mascot. A total of 10 protein spots had matching scores
>62 (protein identification results were the same in two groups,
spots 46 and 1925 failed to be identified; Table V).
| Table V.MC organization and melanosis disease
with colon cancer and normal colon tissue between differentially
expressed protein identification results. |
Table V.
MC organization and melanosis disease
with colon cancer and normal colon tissue between differentially
expressed protein identification results.
| Difference point
no. | Accession no. | Protein name | Score | Mr | pI | Sequence coverage
(%) |
|---|
| MC organization and
melanosis disease with colon cancer |
|
295 | IPI00215983 | CA1 carbonic
anhydrase 1 | 253 | 28,909 | 6.59 | 60 |
|
328 | IPI00010779 | TPM4 isoform 1 of
tropomyosin α-4 chain | 149 | 28,619 | 4.67 | 44 |
|
647 | IPI00554788 | KRT18 keratin | 457 | 48,029 | 5.34 | 72 |
| 820
(817) | IPI00554648 | KRT8 keratin | 295 | 53,671 | 5.52 | 52 |
|
938 | IPI00465436 | CAT catalase | 95 | 59,947 | 6.90 | 18 |
| 1457 | IPI00216952 | LMNA isoform C of
prelamin-A/C | 132 | 65,153 | 6.40 | 38 |
| 2204 (1783) | IPI00965713 | FGB fibrinogen β
chain isoform 2 preproprotein | 66 | 50,436 | 8.22 | 21 |
| MC organization and
normal colon tissue |
|
602 | IPI00926977 | PSMC6 26S protease
regulatory subunit 10B | 105 | 46,053 | 7.64 | 34 |
|
647 | IPI00554788 | KRT18 keratin | 457 | 48,029 | 5.34 | 72 |
| 817
(820) | IPI00554648 | KRT8 keratin | 295 | 53,671 | 5.52 | 52 |
|
938 | IPI00465436 | CAT catalase | 95 | 59,947 | 6.90 | 18 |
| 1783 (2204) | IPI00965713 | FGB fibrinogen β
chain isoform 2 preproprotein | 66 | 50,436 | 8.22 | 21 |
Discussion
In order to ensure the accuracy and reliability of
the experiment and reduce system error, three repeats of gel
electrophoresis were performed for each tissue sample; and the
electronic average of the gel image was calculated. Strip length
and pH range are important factors that affect the resolution of
the 2-DE map. In most current studies, pH 3–10 L solid phase
adhesive strips were used for protein isolation (11–13).
Finally, 24-cm long non-linear IPG strips with pH
that ranged from 3–10 were chosen for the present study, since the
protein spots that these could display were clearer and
independent, and the separation area was larger. Gel dyeing is
important. Coomassie brilliant blue staining for proteins is
relatively simple and easy to control, and its repeatability was
higher than that of silver staining. Hence, Coomassie brilliant
blue staining was used in the experiment. However, since it is the
same with silver staining, decoloring is necessary before mass
spectrum identification. In this experiment, a two-dimensional gel
electrophoresis technique platform for the proteomic determination
of MCCC, MC and normal tissues was established. This provides
technical support for subsequent studies on comparative proteomics
of MCCC (14).
Although we took various measures to improve the
repeatability and resolution of the gel image, we realize that the
2-DE experimental process is long and has many steps. Furthermore,
many processes are needed in its manual operation, not to mention
artificial errors and system errors. All these factors result in a
high possibility of the occurrence of ‘false-negative’ or
‘false-positive’ differences in protein expression. For this
experiment, to a certain extent, some differentially expressed
protein spots may have been lost or some non-differentially
expressed protein may have been mis-displayed in the gel images.
These factors have been taken into account in the analysis of these
results.
Through bioinformatic analysis, eight proteins were
finally identified in the present study; which were considered to
be related proteins of MC and MCCC.
The identification of spots of differentially
expressed proteins between MC and MCCC tissues, and between MC and
normal colon tissues, revealed that there were differences in
cytokeratins. The main functions of cytokeratins are maintaining
cell shape, performing cell movement and resisting external
mechanical stress (15,16). In the results of the experiment, it
was found that the skeleton protein expression was downregulated in
MC tissues and upregulated in MCCC tissues, such as KRT8 and KRT18.
It was revealed by recent studies that KRT8 is associated with
lung, breast, esophageal and colon cancer infiltration; and these
are involved in the multi-drug resistance of colon cancer (17–19).
One study revealed that KRT8 may act as a potential receptor of
plasminogen, and can activate plasmin through plasminogen activator
located on the tumor cell surface. In addition, other studies
revealed that the activation of plasminogen promoted tumor cell
infiltration. These studies suggest that KRT8 may be involved in
the progression of MC and MCCC, which may be used as a potential
molecular marker for the diagnosis of MC and MCCC. The specific
biological functions in MC and MCCC require further studies.
The identification of spots of differentially
expressed proteins between MC and MCCC tissues, and between MC and
normal colon tissues, revealed that there were differences in
fibrinogen. A present study revealed that fibrinogen levels are
abnormally increased in patients with gastric, lung and oral
cancer, and many other malignant tumors (20). Another study revealed that
fibrinogen can cause an increase in fibroblast growth factor-2
(FGF-2) in prostate and lung cancer cells (21), while FGF-2 is an important growth
factor in normal tissues and tumor tissue proliferation, which is
closely related to blood vessel hyperplasia in tumor growth. The
formation of new blood vessels plays an important role in malignant
tumor growth and metastasis. Fibrin in the extracellular matrix of
cancer cells forms a stable scaffold, and plasmin promotes the
dissolution of fibrin and causes the degradation of the matrix;
promoting the spread of cancer cells in the process of angiogenesis
(22). This revealed that
fibrinogen exhibits upregulated expression in MC and MCCC tissues.
Therefore, fibrinogen may be associated with the growth of MC and
MCCC, as well as in tumor metastasis.
The identification of spots of differentially
expressed proteins between MC and MCCC tissues, and between MC and
normal colon tissues, revealed that there were differences in
hydrogen peroxidase [also known as catalase (CAT)]. It has been
confirmed that increased levels of oxygen-free radicals and changes
in antioxidant enzymes can lead to tumorigenesis. Furthermore,
cancer patients usually also show oxidation-reduction imbalance in
the body, and an interaction between the tumor and antioxidant
system. Through comparison of the MCCC, MC and normal tissues, it
was found that the CAT was significantly reduced in MCCC tissues.
These findings suggest that the radical scavenging system in tumor
tissues is damaged during tumorigenesis. In recent years, many
scholars have studied the relationship between the CAT levels in
tissues, body fluid, and the diagnosis and treatment of systemic
tumors. It has been recognized that CAT can be used as a tumor
marker for assisting diagnosis, treatment guidance and the
prognosis of malignant tumors.
There were differences in the 26s proteasome between
MC and normal colon tissues. In the cytoplasm and nucleus of the
eukaryote, 26s proteasome is the core protease for protein
degradation. Studies have found that ~80–90% of cell protein
degradation occurs under the action of the proteasome. The results
of the present study showed that 26s proteasome expression was
decreased in the MC tissues, but was not found in the MCCC tissues.
Therefore, studies on 26s proteasome can promote the understanding
of normal or damaged protein degradation, cell cycle regulation,
the expression of tumors and antigens, as well as the activation
and degradation of transcription factors.
A difference was noted in tropomyosin (TPM) in the
MC and MCCC tissues. In recent years, studies have revealed that
TPM may abnormally be expressed in a variety of malignant tumors.
This experimental study also revealed that TMP expression was
significantly higher in MCCC tissues than that noted in the MC and
normal tissues. Therefore, TPM may be involved in tumor metastasis.
However, the specific signaling pathway involved in its biological
function and proteins involved in its interactions require further
in-depth studies.
A recent study found that in most tumors, carbonic
anhydrase (CA) expression exists. Various tumor tissues have
different CA isozyme expression levels (23). The present study revealed that there
was a difference in CA between MC and MCCC tissues. CA is involved
in the occurrence and progression of most cancers; and its
expression is closely related to the invasion and metastatic
ability of cancer cells (24).
These enzymes that regulate pH balance appear to be able to
regulate the behavior of tumor cells. The regulation of the
expression level of CA1 proteins is one of the mechanisms of
vegetable resisting colorectal cancer. High expression levels of
CA1 protein exists in normal colorectal mucosa; but in most
colorectal cancer tissues, no CA1 expression appears. In the
present study, CA1 displayed a high expression in MC; and exhibited
upregulated expression in the MCCC tissues. Therefore, expression
of CA1 in colorectal cancer may suggest a good prognosis and
extended overall survival rate. The expression of related carbonic
anhydrase in cancers may inhibit the metastasis of cancer cells,
and improve the prognosis of patients undergoing cancer surgery.
Further studies regarding the relationship between tumor and
carbonic anhydrase have important theoretical significance and
clinical value in the exploration of tumor pathogenesis, the
development of gene-targeted chemotherapy, and the improvement in
anticancer effects. These may help in further understanding the
mechanism of tumors, and help in achieving breakthroughs for
tumor-targeted therapies.
A difference was observed in lamin A/C in the MC and
MCCC tissues. Lamin A/C has many important physiological functions
such as positioning of the nuclear pore complex, nuclear membrane
protein binding, peripheral heterochromatin anchoring, gene
replication, transcription and DNA damage repair, maintenance of
chromosome structure and genome stability (25). It is only a hypothesis that the
affected site of laminopathies is selective. Furthermore, it has
been hypothesized that lamin mutations can cause the dysfunction of
adult stem cells, leading to abnormal cell differentiation. This
may explain the different effects of lamin mutations in different
tissues (26). A recent study
indicated that the expression of lamin is potentially associated
with various types of cancers.
In the present study, using two proteomic methods
(2-DE technology and mass spectrometry analysis), eight proteins,
which were differentially expressed in MC, MCCC and normal colon
tissues, were identified. Further studies of the functions of these
proteins may provide a new targeted molecular marker for the
diagnosis and treatment of MC and MCCC, in order to achieve the
purpose of early detection and effective treatment; and improve
overall outcome. For the validation of related proteins and their
specific functions, we will conduct further studies as the next
step using PCR and immunohistochemical methods based on the present
study.
References
|
1
|
Liu J, Tian DA, Wang JP, Zhang SZ, Feng J,
Zhao ZZ, Hao YX and Liu P: Expression of aquaporin 8 and its
relationship with melanosis coli. Chin Med J. 124:3061–3065.
2011.PubMed/NCBI
|
|
2
|
Kapila A, Patel P, Khan O, Murthy R and
Young MF: The classic melanosis coli. Indian J Gastroenterol.
33:582–583. 2014. View Article : Google Scholar : PubMed/NCBI
|
|
3
|
Li D, Browne LW and Ladabaum U: Melanosis
coli. Clin Gastroenterol Hepatol. 7:A202009. View Article : Google Scholar : PubMed/NCBI
|
|
4
|
Zhang L and Gao F: New development in
melanosis coli. Chin J Gastroenterol Hepatol. 24:257–259. 2015.
|
|
5
|
Sonnenberg A and Müller AD: Constipation
and cathartics as risk factors of colorectal cancer: A
meta-analysis. Pharmacology. 47:(Suppl 1). S224–S233. 1993.
View Article : Google Scholar
|
|
6
|
Zhang X, Wu K, Cho E, Ma J, Chan AT, Gao
X, Willett WC, Fuchs CS and Giovannucci EL: Prospective cohort
studies of bowel movement frequency and laxative use and colorectal
cancer incidence in US women and men. Cancer Causes Control.
24:1015–1024. 2013. View Article : Google Scholar : PubMed/NCBI
|
|
7
|
Yang ZY, Jiang H, Qu Y, Wei M, Yan M, Zhu
ZG, Liu BY, Chen GQ, Wu YL and Gu QL: Metallopanstimulin-1
regulates invasion and migration of gastric cancer cells partially
through integrin β4. Carcinogenesis. 34:2851–2860. 2013. View Article : Google Scholar : PubMed/NCBI
|
|
8
|
Dai Y, Pierson S, Dudney C, Zeng Y,
Macleod V, Shaughnessy JD and Stack BC Jr: Ribosomal protein
metallopanstimulin-1 impairs multiple myeloma CAG cells growth and
inhibits fibroblast growth factor receptor 3. Clin Lymphoma Myeloma
Leuk. 11:490–497. 2011. View Article : Google Scholar : PubMed/NCBI
|
|
9
|
Wang ZC, Gao J, Zi SM, Yang M, Du P and
Cui L: Aberrant expression of sonic hedgehog pathway in colon
cancer and melanosis coli. J Dig Dis. 14:417–424. 2013. View Article : Google Scholar : PubMed/NCBI
|
|
10
|
Zolg W: The proteomic search for
diagnostic biomarkers: Lost in translation? Mol Cell Proteomics.
5:1720–1726. 2006. View Article : Google Scholar : PubMed/NCBI
|
|
11
|
Li DJ, Deng G, Xiao ZQ, Yao HX, Li C, Peng
F, Li MY, Zhang PF, Chen YH and Chen ZC: Identificating 14-3-3
sigma as a lymph node metastasis-related protein in human lung
squamous carcinoma. Cancer Lett. 279:65–73. 2009. View Article : Google Scholar : PubMed/NCBI
|
|
12
|
Cheng AL, Huang WG, Chen ZC, Peng F, Zhang
PF, Li MY, Li F, Li JL, Li C, Yi H, et al: Identification of novel
nasopharyngeal carcinoma biomarkers by laser capture
microdissection and proteomic analysis. Clin Cancer Res.
14:435–445. 2008. View Article : Google Scholar : PubMed/NCBI
|
|
13
|
Tian T, Hao J, Xu A, Hao J, Luo C, Liu C,
Huang L, Xiao X and He D: Determination of metastasis-associated
proteins in non-small cell lung cancer by comparative proteomic
analysis. Cancer Sci. 98:1265–1274. 2007. View Article : Google Scholar : PubMed/NCBI
|
|
14
|
Azad NS, Rasool N, Annunziata CM, Minasian
L, Whiteley G and Kohn EC: Proteomics in clinical trials and
practice: Present uses and future promise. Mol Cell Proteomics.
5:1819–1829. 2006. View Article : Google Scholar : PubMed/NCBI
|
|
15
|
Magin TM, Vijayaraj P and Leube RE:
Structural and regulatory functions of keratins. Exp Cell Res.
313:2021–2032. 2007. View Article : Google Scholar : PubMed/NCBI
|
|
16
|
Omary MB, Ku NO, Strnad P and Hanada S:
Toward unraveling the complexity of simple epithelial keratins in
human disease. J Clin Invest. 119:1794–1805. 2009. View Article : Google Scholar : PubMed/NCBI
|
|
17
|
Liu F, Chen Z, Wang J, Shao X, Cui Z, Yang
C, Zhu Z and Xiong D: Overexpression of cell surface cytokeratin 8
in multidrug-resistant MCF-7/MX cells enhances cell adhesion to the
extracellular matrix. Neoplasia. 10:1275–1284. 2008. View Article : Google Scholar : PubMed/NCBI
|
|
18
|
Bartkowiak K, Wieczorek M, Buck F, Harder
S, Moldenhauer J, Effenberger KE, Pantel K, Peter-Katalinic J and
Brandt BH: Two-dimensional differential gel electrophoresis of a
cell line derived from a breast cancer micrometastasis revealed a
stem/progenitor cell protein profile. J Proteome Res. 8:2004–2014.
2009. View Article : Google Scholar : PubMed/NCBI
|
|
19
|
Makino T, Yamasaki M, Takeno A, Shirakawa
M, Miyata H, Takiguchi S, Nakajima K, Fujiwara Y, Nishida T,
Matsuura N, et al: Cytokeratins 18 and 8 are poor prognostic
markers in patients with squamous cell carcinoma of the oesophagus.
Br J Cancer. 101:1298–1306. 2009. View Article : Google Scholar : PubMed/NCBI
|
|
20
|
Seebacher V, Polterauer S, Grimm C,
Husslein H, Leipold H, Hefler-Frischmuth K, Tempfer C, Reinthaller
A and Hefler L: The prognostic value of plasma fibrinogen levels in
patients with endometrial cancer: A multi-centre trial. Br J
Cancer. 102:952–956. 2010. View Article : Google Scholar : PubMed/NCBI
|
|
21
|
Sahni A, Simpson-Haidaris PJ, Sahni SK,
Vaday GG and Francis CW: Fibrinogen synthesized by cancer cells
augments the proliferative effect of fibroblast growth factor-2
(FGF-2). J Thromb Haemost. 6:176–183. 2008. View Article : Google Scholar : PubMed/NCBI
|
|
22
|
Wang JF, Guo Z, Tang L, Guo JS, Hu J and
Liu JZ: Prognostic associations of preoperative plasma levels of
fibrinogen and D-dimer after curative resection in patients with
colorectal cancer. Zhonghua Yi Xue Za Zhi. 93:906–909. 2013.(In
Chinese). PubMed/NCBI
|
|
23
|
Li Y, Wang H, Tu C, Shiverick KT,
Silverman DN and Frost SC: Role of hypoxia and EGF on expression,
activity, localization and phosphorylation of carbonic anhydrase IX
in MDA-MB-231 breast cancer cells. Biochim Biophys Acta.
1813:159–167. 2011. View Article : Google Scholar : PubMed/NCBI
|
|
24
|
Dunqwa JV, Hunt LP and Ramanni P:
Overexpression of carbonic anhydrase and HIF-1α in Wilms tumours.
BMC Cancer. 12:3902011. View Article : Google Scholar
|
|
25
|
Ostlund C and Worman HJ: Nuclear envelope
proteins and neuromuscular diseases. Muscle Nerve. 27:393–406.
2003. View Article : Google Scholar : PubMed/NCBI
|
|
26
|
Meshorer E and Gruenbaum Y: Gone with the
Wnt/Notch: Stem cells in laminopathies, progeria, and aging. J Cell
Biol. 181:9–13. 2008. View Article : Google Scholar : PubMed/NCBI
|