Introduction
Hepatocellular carcinoma (HCC) is the fifth most
common cancer worldwide and the third leading cause of
cancer-related mortality (1),
making it urgent to identify early diagnostic markers and
therapeutic targets (2). HCC
primarily develops from cirrhosis caused by chronic infection of
hepatitis B virus (HBV) or hepatitis C virus (HCV), alcoholic
injury, and to a lesser extent from genetically determined
disorders (3). However, the
heterogeneity of HCC presents unique challenges in identifying
biomarkers and exploring the molecular pathogenesis in this disease
(4).
With advances in high-throughput experimental
technologies, they have been applied to explore diagnostic gene
signatures and biological processes of human diseases (5), providing novel insights into the
underlying biological mechanisms of HCC. Identifying differentially
expressed genes that have similar expression profiles with known
disease genes is the main method to evaluate biomarkers (6). Differential expression (DE) analysis
has been widely used to explore genes with different expression
levels across different conditions in many gene expression studies
(7,8), especially in cancer research (9,10).
Meanwhile, differential co-expression (DC) analysis mainly aims to
gain insight into altered regulatory mechanisms between classes, by
studying their difference in gene co-expression patterns (11). Comparing the two types of analysis,
DC analysis is more suitable for identifying disease genes that may
not show significant changes in expressional levels, relative to DE
analysis (12,13).
From a biological perspective, if a relationship
exists between DE and DC analysis, biological explanations such as
cellular functions corresponding to such a dependency should be
sought. The integrated DE and DC information may provide new
opportunities for selecting functional relevant genes and
dissecting complex disease mechanism. Therefore, in this study, we
integrated the DE and DC together, termed the DEDC algorithm, to
investigate the optimal gene and gene set for HCC. These genes and
gene set may be potential biomarkers for early detection and
therapeutic targets of HCC, and provide insight to reveal the
underlying pathological mechanisms for this tumor.
Materials and methods
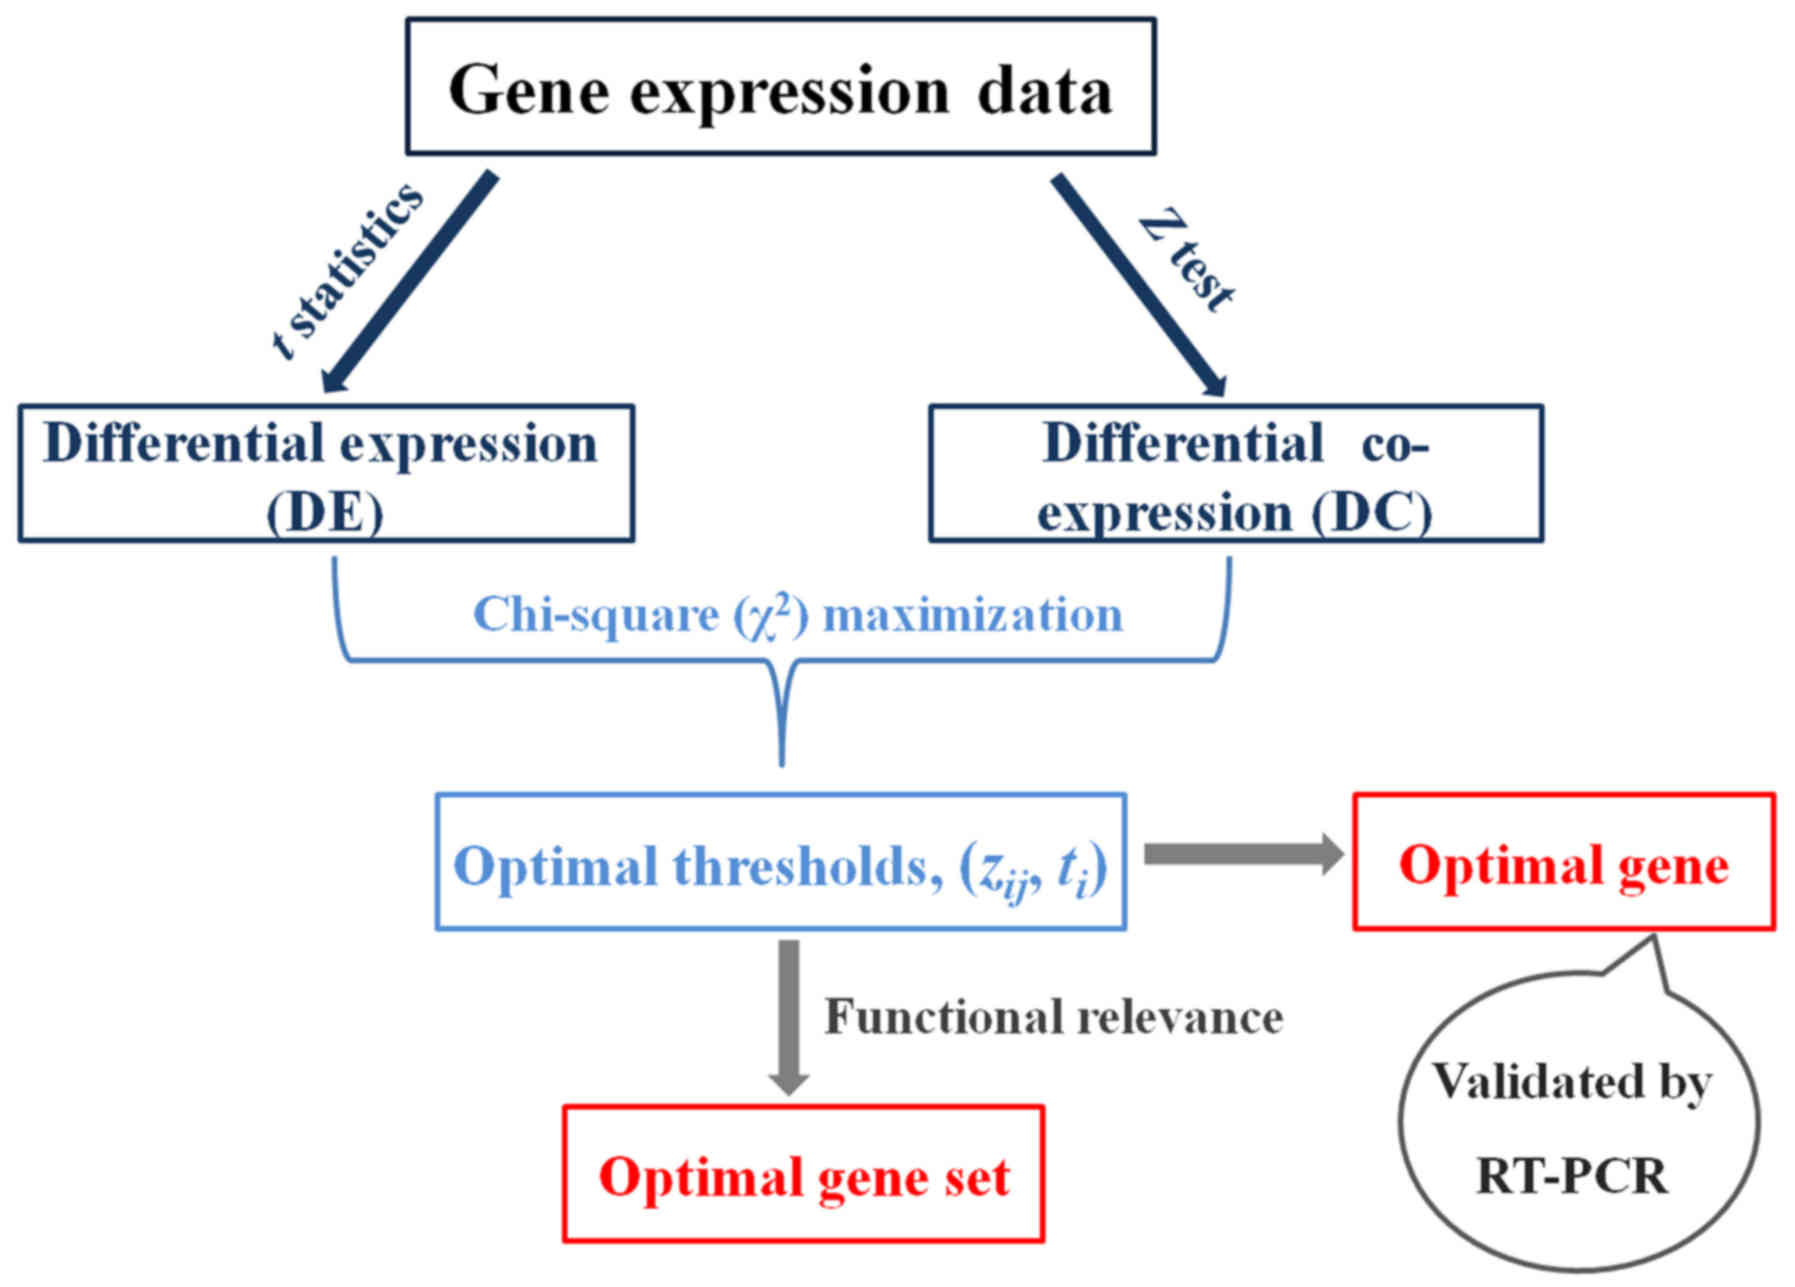
The inference process of the optimal gene and gene
set according to the DEDC algorithm was comprised of four steps:
calculating DE by absolute t-value in t-statistics; computing DC
based on Z-test; determining optimal thresholds dependent on
Chi-squared (χ2) maximization; evaluating functional
relevance of genes categorized into different partitions. In
addition, the optimal gene was validated by conducting reverse
transcription-polymerase chain reaction (RT-PCR) assay, which
further confirmed the feasibility of the DEDC algorithm. The
overview of the analytical framework is illustrated in Fig. 1.
Gene expression data
Two gene expression profiles [E-GEOD-57727 (14) and E-GEOD-57957 (15)] for HCC were recruited from the
ArrayExpress database. The characteristics are displayed in
Table I. A total of 44 normal
samples and 96 tumor samples were collected from the two datasets.
In order to control quality of the datasets, standard
pre-treatments were performed for them, which comprised background
correction based on robust multi-array average (RMA) algorithm
(16); normalization preformed
according to quantile based algorithm (17); probe correction by Microarray
Analysis Suite (MAS) software algorithm (18) and expression summarization through
median polish method (16).
 | Table I.Characteristics of gene expression
profiles. |
Table I.
Characteristics of gene expression
profiles.
| Accession no. | Platform | Samples
(normal/tumor) |
|---|
| E-GEOD-57727 | 62 (5/57) | A-GEOD-14951 -
Illumina HumanHT-12 WG-DASL V4.0 R2 expression beadchip |
| E-GEOD-57957 | 78 (39/39) | A-GEOD-10558 -
Illumina HumanHT-12 V4.0 expression beadchip |
Subsequently, by removing invalid or duplicated
probes and converting preprocessed data on the probe level into
gene symbol through annotate package (19), we gained 13,666 and 13,937 genes in
total in E-GEOD-57727 and E-GEOD-57957, respectively. Additionally,
to remove the batch effects caused by the use of different
experimentation plans and methodologies, we utilized batch
mean-centering (BMC) method in inSilicoMerging package to merge the
two preprocessed gene expression profiles into a single group
(20). Measured gene expression
values (xˆ kij) of gene i in
sample l of the batch k were calculated by
subtracting the mean xi:
x^ilk=xilk–x¯ik
Calculating DE
For the purpose of calculating DE levels between HCC
and a normal condition, we applied absolute t-value in t-statistics
to quantify the degree of DE of each gene (21). Considering the gene expression data
set with m genes from samples of two conditions: one
condition consisted of tumor or HCC samples (T), while the
other was composed of normal controls (N). The absolute
t-value |ti| for a gene i (1 ≤ i ≤
m) was calculated as following:
|ti|=|X¯T−X¯N|VT2AT+VN2AN
Where XT and XN
represent the mean expression levels in the tumor and normal
conditions, AT and AN stand for
the amount of samples in two conditions, and VT
and VN are the standard deviations of expression
levels in the tumor and normal conditions. Note that a higher
absolute t-value indicates a larger DE difference.
Computing DC
Z-test, which quantifies the correlation difference
between expression levels of two genes (12), was implemented to evaluate the DC
relations between any two genes in the tumor and normal samples.
For any two genes i and j, this process mainly
included three steps: calculating the Pearson's correlation
coefficient (PCC) separately over the samples in normal and tumor
state, r Nij and r
Tij (22); transforming the correlations r
Nij and r
Tij into normally distributed forms z
Hij and z
Tij by the Fisher-transforms (23); and computing the measure for DC,
Zij. The calculated formulas are listed as
follows:
rij=iA–1∑l=1A(g(i,l)–g¯(i)σ(i))⋅(g(j,l)–g¯(j)σ(j))
Where A is the number of samples of the gene
expression data; g(i, l) or g(j,
l) is the expression level of gene i or j in
the sample l under a specific condition; g¯(i) or g¯(j) represents the mean expression
level of gene i or j. According to this, we could
obtain r Nij for normal condition and
r Tij for tumor condition. When
rij indicates r Nij,
z Nij is defied as:
ZijN=12ln|1+rijN1–rijN|
zTij was evaluated
similarly:
ZijT=12ln|1+rijT1–rijT|
And thus,
Zij=|ZijN–ZijT|1AN–3+1AT–3
Identifying optimal DE and DC
thresholds
With DE and DC measures defined, we investigated
the relationship between DE and DC for every gene in the expression
data in turn based on Pearson's χ2 test which provided
information not only on the significance of any observed
differences, but also on exact categories accounting for any
differences found (24). Moreover,
to address whether genes with higher DC to gene i tended to
(or tended not to) have higher DE, two thresholds were identified
based on Pearson's χ2 maximization, of which one was
used for defining high or low DE (ti), and the
other was employed to assess high or low DC
(zij).
Selecting optimal threshold
The threshold selection algorithm based on
χ2 maximization is described as follows. A pair of
optimal thresholds for each gene i, z*i
and t*i, were sought from a set of
threshold candidates, {(zij,
ti)} (1 ≤ i, j ≤ m), for the
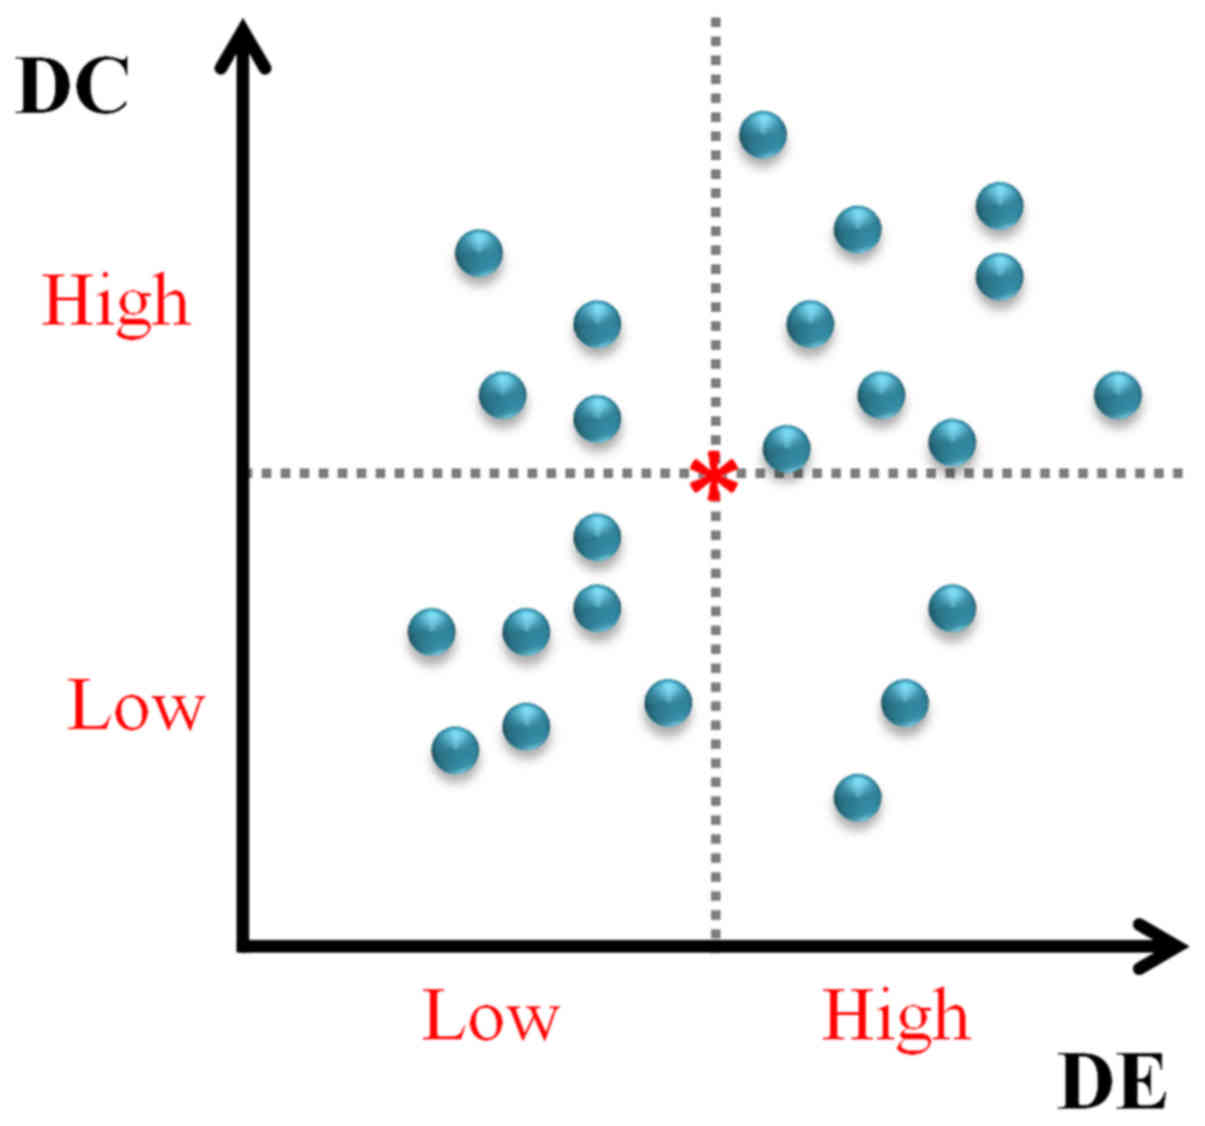
DC and DE variables, respectively. To each pair of threshold
candidates, every gene was categorized into one of following four
partitions as shown in Fig. 2: i)
low DC and low DE (LDC-LDE), termed as SLDC-LDE;
ii) low DC and high DE (LDC-HDE), denoted as
SLDC-HDE; iii) high DC and low DE (HDC-LDE),
denoted as SHDC-LDE; and iv) high DC and high DE
(HDC-HDE), denoted as SHDC-HDE.
From the four partitions, we counted the number of
observed genes in each partition. The observed frequency (O)
was formally defined as: OB_C =
⎸SBC⎸where B = {LDE, HDE}
and C = {LDC, HDC}. Assuming the two DE and DC
variables were independent, the expected frequency was EB_C=OBOCm. Additionally, the χ2
value for gene i was computed as follows:
χi2=∑B={LDE,HDE}∑C={LDC,HDC}(OB_C–EB_CEB_C)2
Note that there were m tests in total, since
the χ2 tests were performed for m possible
threshold candidates. As a consequence, m maximum
χ2 values were produced, and were compared with each
other. We selected the threshold candidate pair with maximized
χ2 value as the pair of optimal thresholds for gene
i, (z*i,
t*i).
Performance of optimal threshold
Some possible relationships may be presented
between HDE and HDC with a certain gene, such as positive, negative
and no significant relationship. To evaluate whether the
association between them was significant ulteriorly, adjusted
residual was employed (25), which
are asymptotically standard normal results obtained from dividing
it by its standard error. A cell-by-cell comparison of observed and
estimated expected frequencies show the nature of the dependence.
Larger values are more relevant when the degree of freedom is
larger and it becomes more likely that at least one is large simply
by chance (26). In this study, we
defined that if the observed number of genes found in HDE and HDC
partition was higher than the expected frequency, the association
between HDE and HDC was regarded as positive. Conversely, if the
observed frequency was less than expected, the association was
considered to be negative.
Evaluating functional relevance
In this study, we utilized pre-defined gene sets
which included Gene Ontology (GO) sets (27,28),
Reactome pathways (29) and Kyoto
Encyclopedia of Genes and Genomes (KEGG) pathways (30) as background data to weigh the
functional relevance of the partition genes which were detected by
the optimal thresholds. Firstly, to determine whether a set of
partition genes was significantly overrepresented in a functional
gene set or not, two-tailed Fisher's exact test based on the
hyper-geometric distribution was conducted in a partition (31), and P for each gene was obtained. The
P was adjusted and corrected utilizing Bonferroni (32) and Benjamini and Hochberg (33). In addition, the most significant
gene set associated with the partition with the lowest P was
defined as the best associated gene set.
Subsequently, functional information (FI) was
proposed to perform comparison of P over different partitions
(34). FI could quantify the
significance of association between a gene's HDE and HDC partition
SHDE-HDC and a functional gene set G. When
the significance of the association was high, P was small and in
turn FI was high.
FISHDE–HDC'G=–log2(P)
The gain of FI by combining the HDE and HDC
criteria over an individual criterion of DE for a given gene set
G is defined as:
ΔG′=FISHDE–HDC′G–FISHDE′G
Of which FISHDE,G is
the FI for the association between a HDE gene partition
SHDE and a functional gene set G.
Similarly, the gain of FI, ΔG, by combining the
HDE and HDC criteria over an individual criterion of DC for a given
gene set G was calculated. Thus, the minimum of individual
FI gains could be computed as:
ΔG*=min(ΔG′,ΔG′′)
The minimal FI gain was high only when both of the
individual gains were high. It was low when any one of the
individual gains was low. A negative gain mean FI on the basis of
the combining criteria was lower than either one or both of the
individual criteria.
Validation of the optimal gene by
RT-PCR
To validate the expression level of the optimal
gene, RT-PCR assay was performed. Total RNA was prepared from HCC
cell line HCC-LM3 which was kindly provided by Cancer Center, Qilu
Hospital of Shandong University (Jinan, China). Cells were
cultivated in Dulbecco's modified Eagle's medium (DMEM)/F-12
containing 10% fetal bovine serum (FBS) (Gibco; Life Technologies,
Carlsbad, CA, USA), and antibiotics of 100 U/ml penicillin G, 100
µg/ml streptomycin and 250 ng/ml fungizone (Carl Roth, Karlsruhe,
Germany) at 37°C in a humidified incubator with 5% CO2
atmosphere (Shanghai Samsung Experimental Instrument Co., Ltd.,
Shanghai, China). When the cultures reached confluence (6 days),
cells were treated with 0.05% trypsin/1 mM EDTA for 5 min at 37°C.
Subsequently, the cell suspension was diluted with DMEM/F-12
supplemented with 10% FBS to a concentration of 2×10⁵
cells/ml, and plated in 12-well culture plates (1 ml/well). Culture
medium was changed after 24 h and then every 3 days. For the cDNA
synthesize, RNA was treated with Oligo (dT)18 primers
(Invitrogen, Carlsbad, CA, USA), 2 µl RNasin (40 U/µl), 8.0 µl 5X
reverse transcriptase buffer, 8.0 µl dNTPs and 2 µl AMV reverse
transcriptase (5 U/µl). The reactions were incubated for 1 h at
42°C, 15 min at 70°C, and adjusted to a final volume of 50 µl. The
data were normalized to β-actin reference. The primer sequences of
forward (5′-AGGCCCATCTCAACACAGAG-3′) and reverse
(5′-CGTTCTCCTGGCAAATCAAT-3′) were employed to produce an amplicon
of 217 bp.
For PCR amplification, the mixture contained 10 µl
of 10X PCR buffer I and 1 µl of Taq DNA polymerase (both
from Invitrogen), 3 µl of each forward and reverse primer, 8 µl of
dNTPs. Conditions were as follows: 30 sec at 95°C for
pre-denaturation, followed by 35 cycles of 45 sec at 94°C, 30 sec
at 55°C and 1.5 min at 72°C, and a final 10 min extension at 72°C.
Three replicates of the assay within or between runs were performed
to assess the reproducibility. Products of PCR experiment were
analyzed by 1.5% agarose gel electrophoresis and Quantity One
software of gel imaging analyzer (Bio-Rad, Hercules, CA, USA). In
addition, each test was carried out in triplicate at least and the
results were anaylzed using statistical process by SPSS, Inc.
(Chicago, IL, USA) (35). The data
are expressed as mean ± standard deviation (SD). Differences
between groups were assessed by unpaired, two-tailed Student's
t-test (36). P<0.05 was
considered to indicate a statistically significant different.
Results
Data
In the present study, a total of 13,666 genes were
obtained in the gene expression data which included tumor (HCC)
(T) and normal samples (N) for further exploitation,
and thus m=13,666. When evaluating the functional relevance
of the selected genes, we collected 7,114 functional gene sets or
pathways in total, of which 5,895 sets were from GO, 999 sets were
from Reactome pathways and 220 pathways were from KEGG pathways. To
make these gene sets more reliable and confident, we took
intersections between gene sets and the 13,666 genes, and selected
gene sets with the number of intersected genes >3 as the
background gene sets. Finally, 7,103 pathways were identified for
background gene sets in total.
Optimal gene
First of all, we calculated the DE and DC variables
for the 13,666 genes in the gene expression data utilizing t-test
and Z-test, respectively. Based on χ2 maximization, the
dependencies between the DE and DC variables for candidate
thresholds were evaluated. We selected the maximal χ2
value as the optimal thresholds, (z*i,
t*i), z*i =1.032 and
t*i =1.911, and the corresponding gene or
optimal gene was microtubule-associated protein RP/EB family member
1 (MAPRE1) with P=2.67E-43. The gene partitions were
identified based on the optimal thresholds, which provide a
flexible framework to study genes with different DE and DC
characteristics (such as HDE, LDE, HDC and LDC). The significance
between the DE and DC variables was calculated and the P was
adjusted for multiple testing as described in the Materials and
methods section. Furthermore, to evaluate whether the association
between HDE and HDC was significant ulteriorly, adjusted residual
was employed. The results showed that 2,053 genes out of all genes
in the HCC data had a significant HDE and HDC association (adjusted
P<0.05).
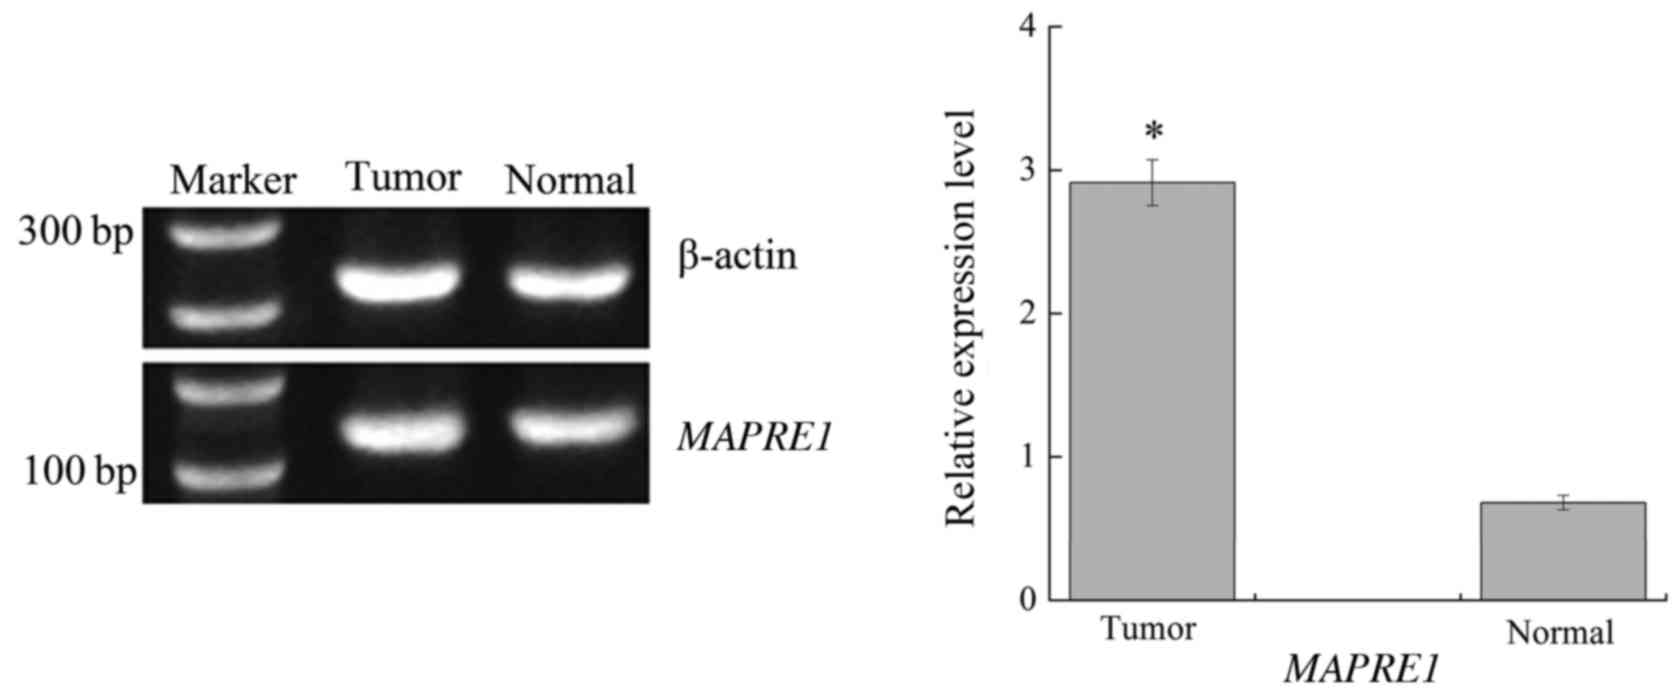
Moreover, for the purpose of determining the
expression level of the optimal gene MAPRE1 in HCC samples
and normal controls, RT-PCR analysis was conducted using the HCC
cell line HCC-LM3. Three replicates were performed to make the
results more reliable than for one replicate, and we took the mean
value as the final outcome. The assay mainly included RNA
extraction, cDNA synthesis and PCR amplification. Then the
significance analysis was conducted on the results using SPSS
software. The RT-PCR results are displayed in Fig. 3. We found that there was a
significant difference for the relative expression level of
MAPRE1 between the HCC and normal group (P<0.01).
Collectively, these results indicate that the gene plays an
important role in the progression of HCC and confirmes the
feasibility of our algorithm to identify the optimal gene.
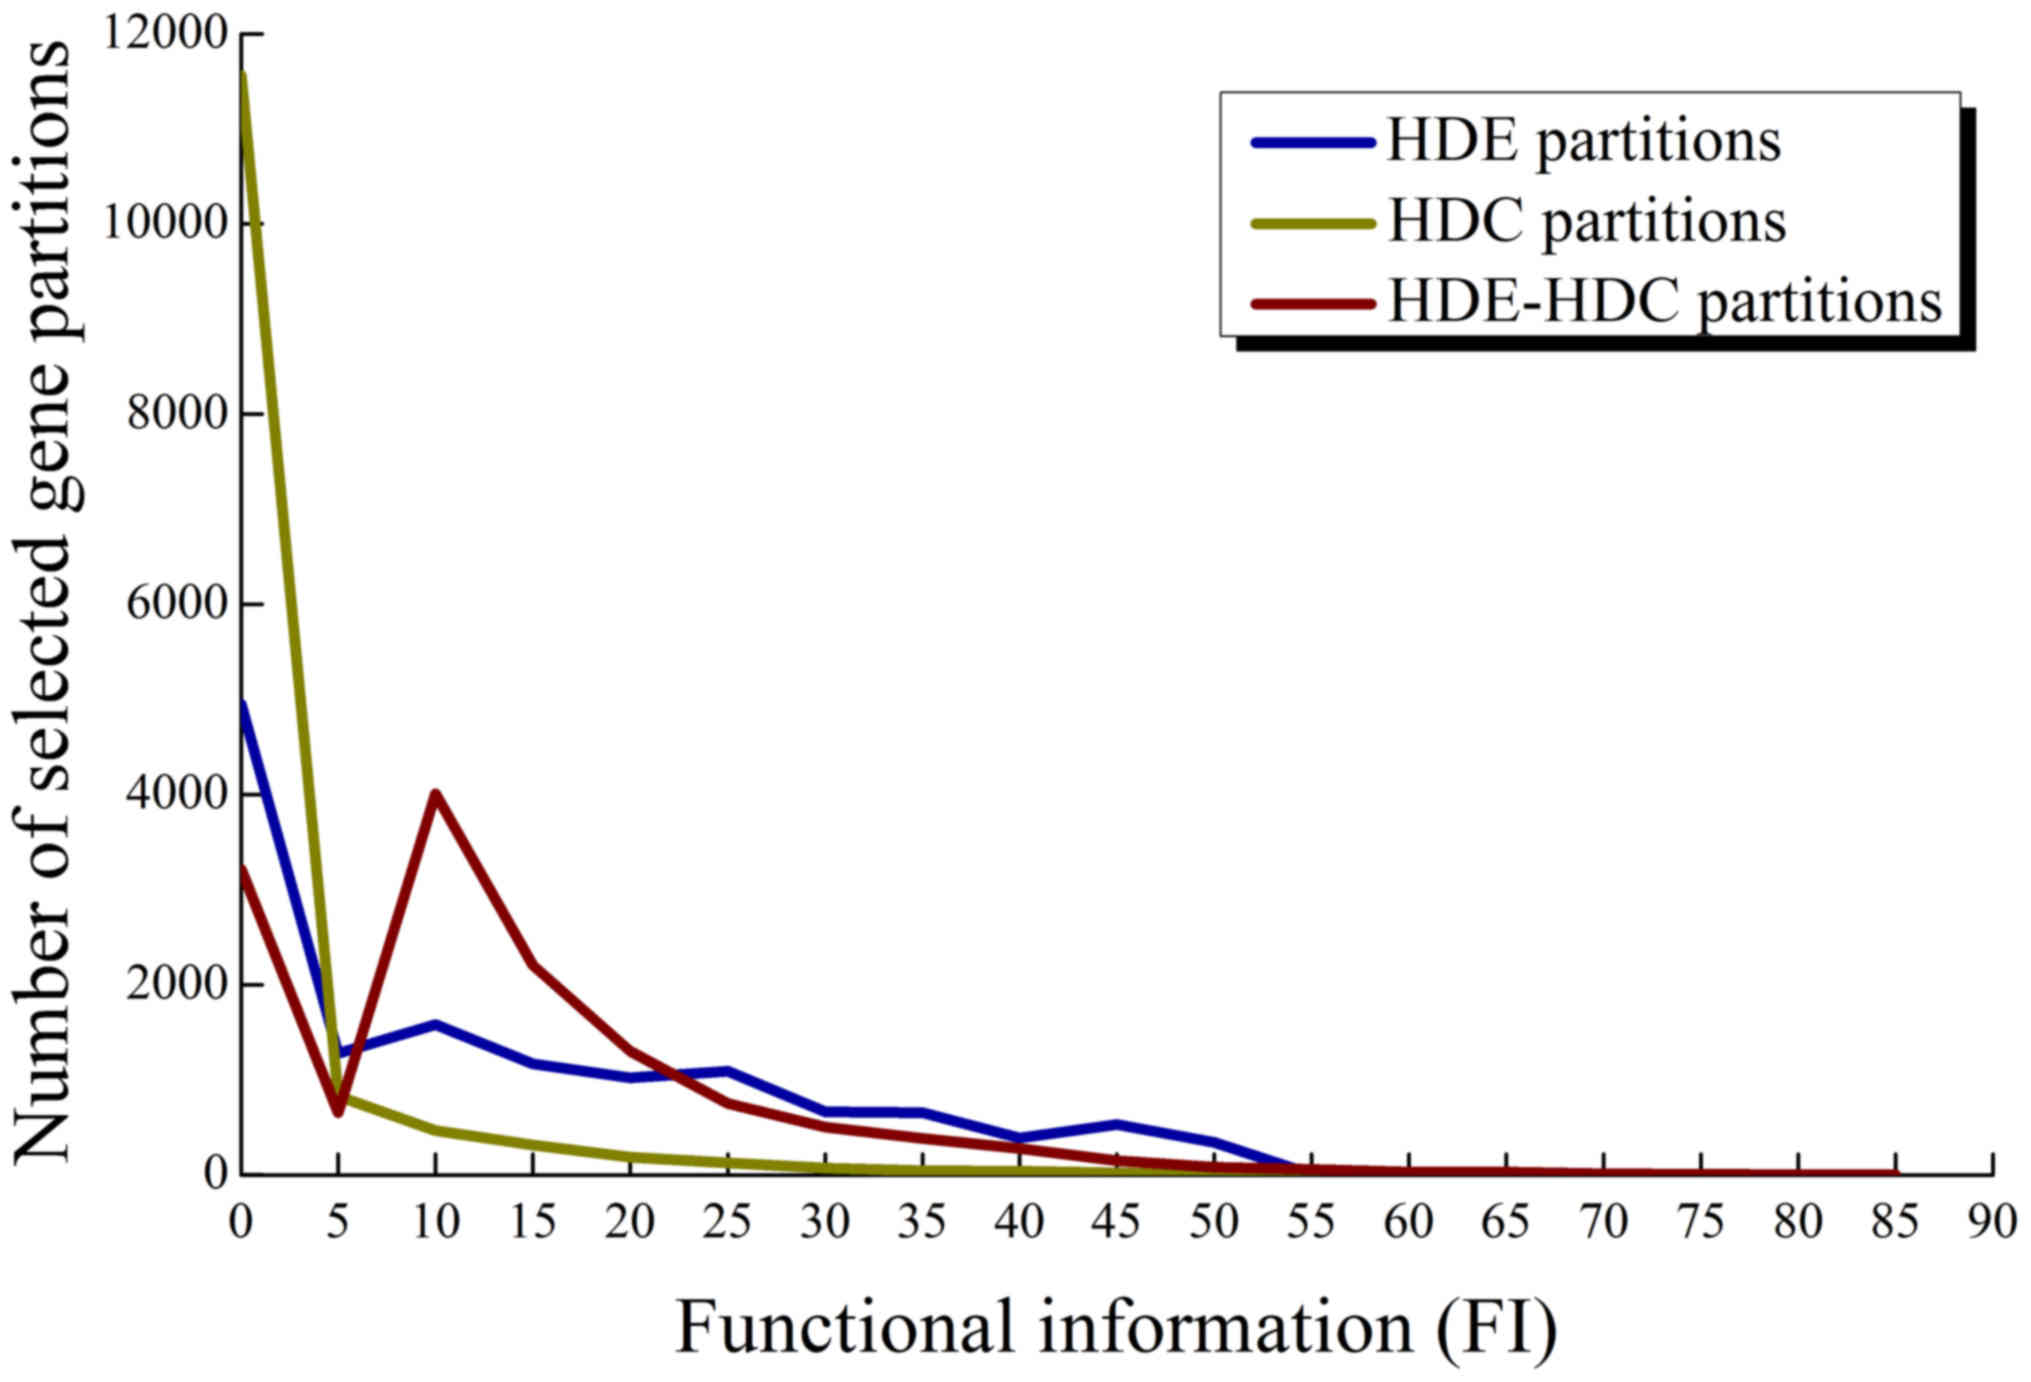
FI of HDE-HDC partitions
Among the HDE-HDC partitions of 2,053 genes
selected from the HCC and normal set, we investigated the
distribution of FI of their best associated gene sets and compared
it to those using individual HDC or HDE criteria based on the
background gene sets and Fisher's exact test. The distributions are
shown in Fig. 4. A significant
observation was that when using the HDE-HDC criteria, a large group
of 4,007 partitions was obtained at an FI between 5 and 10.
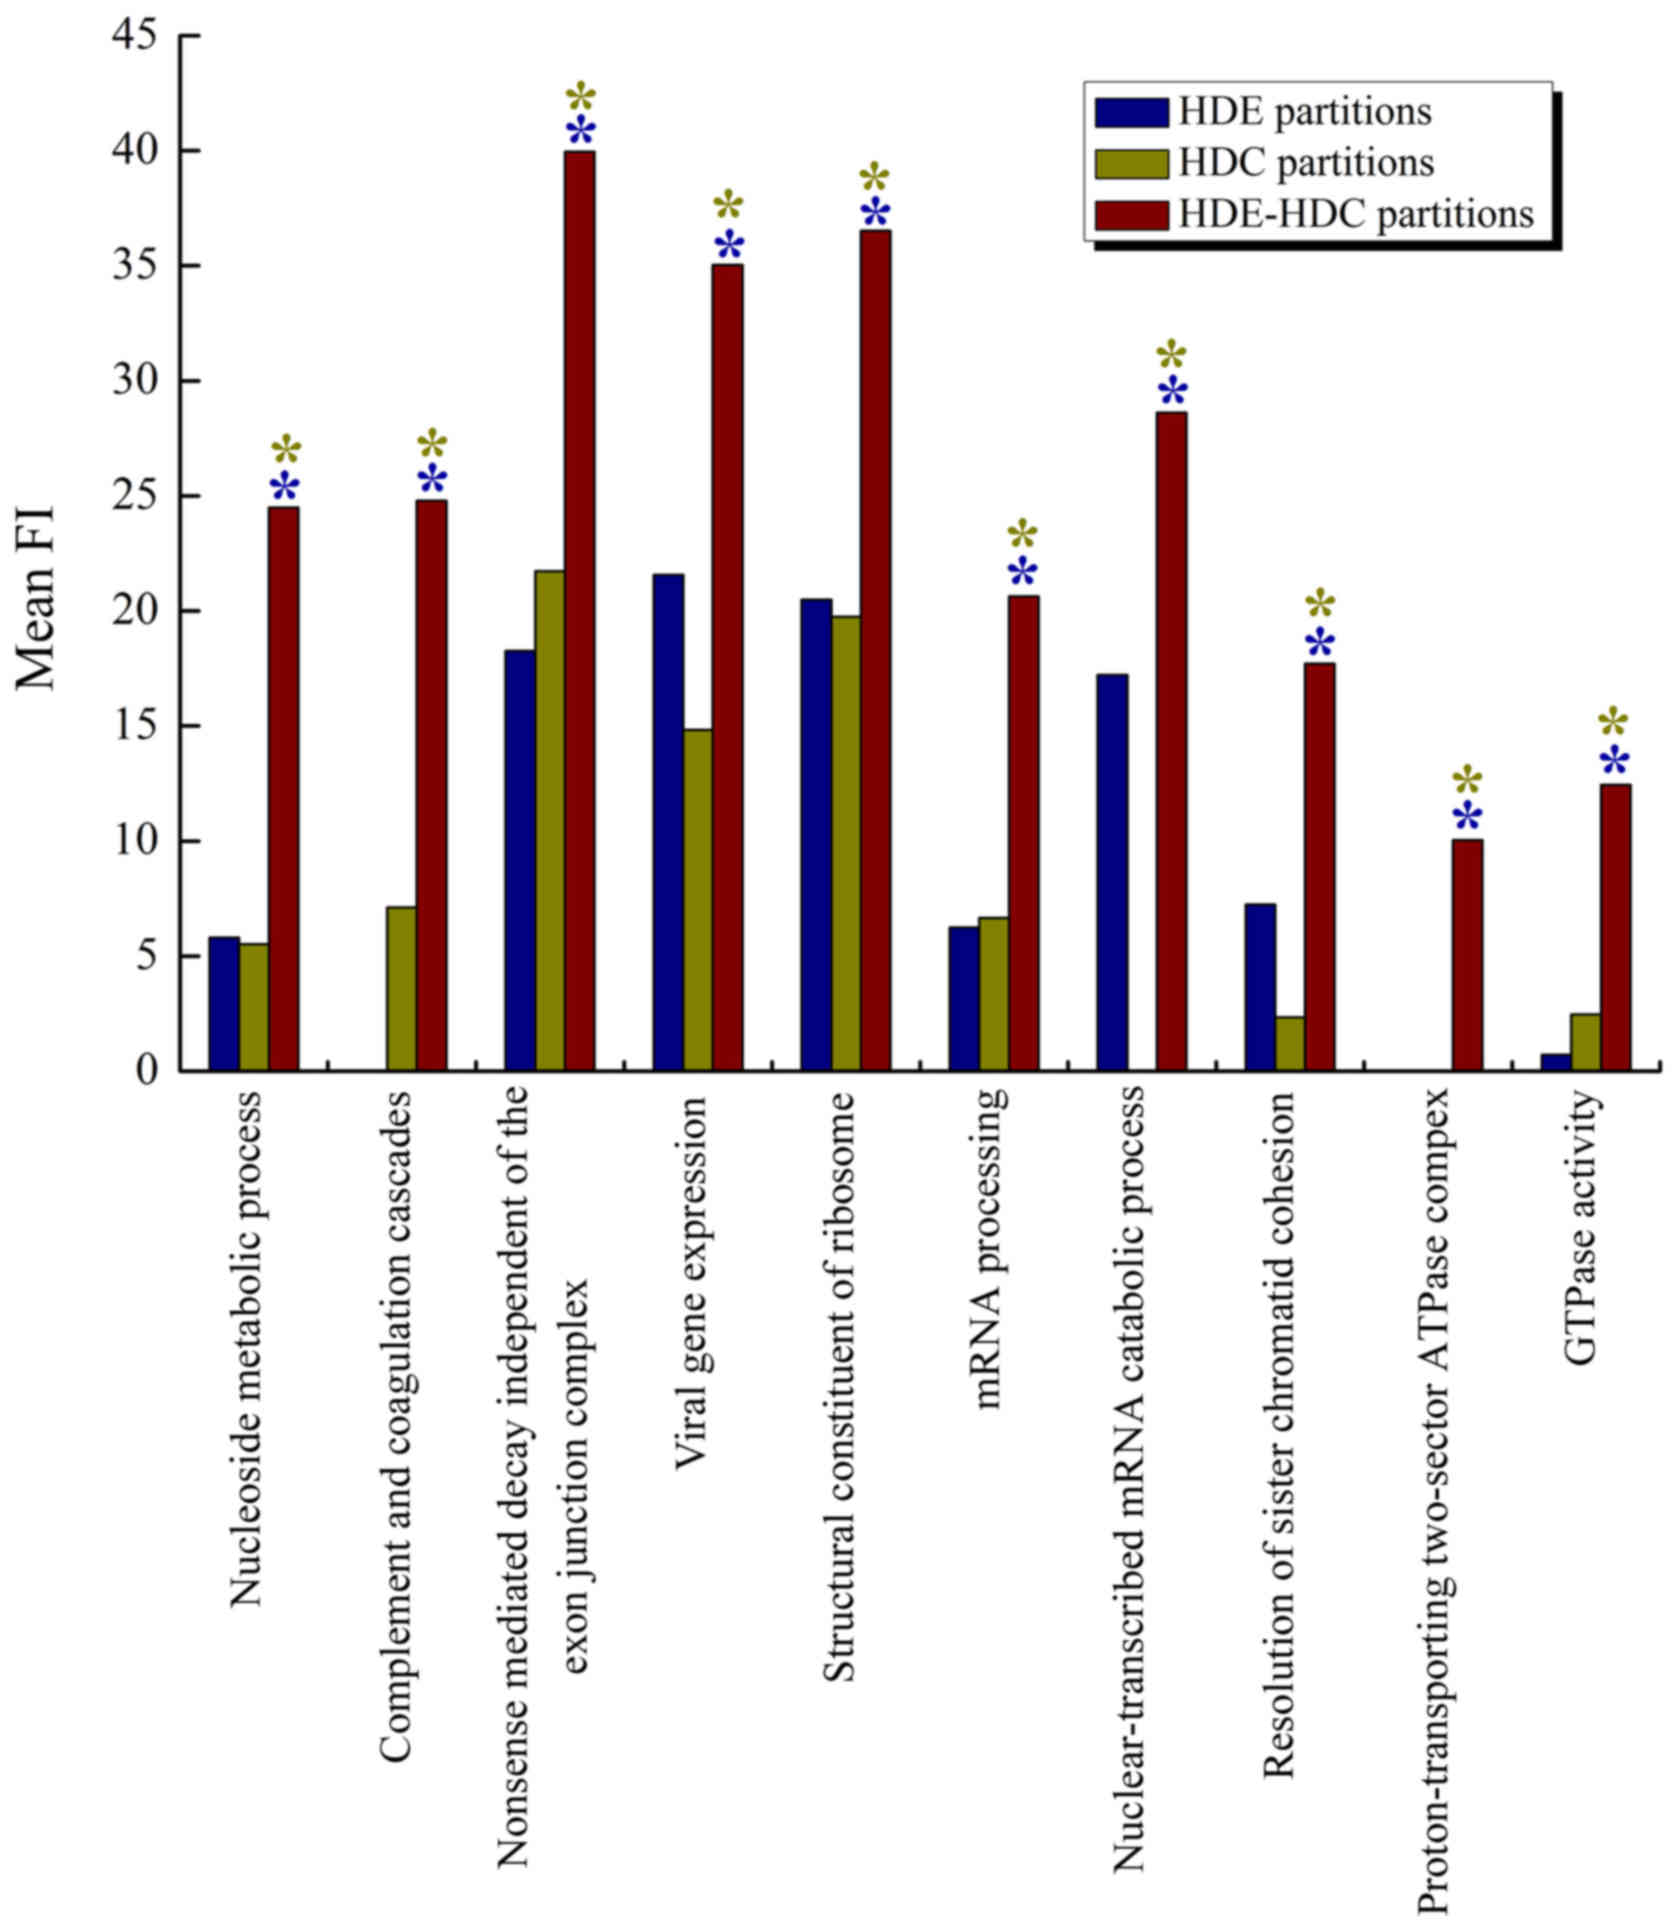
In addition, the best associated gene set for each
gene partition of these positive associations was obtained, and the
top 10 best associated gene sets with the highest mean minimum FI
gain (Δ*G) are shown in Table II. The result showed that
nucleoside metabolic process (GO\GO:0009116) with
Δ*G=18.681, complement and coagulation cascades
(KEGG\hsa04610) with Δ*G=17.692, and nonsense
mediated decay independent of the exon junction complex
(REACTOME\REACT_75768.1) with Δ*G=15.294 were the
top three gene sets. Fig. 5 shows
the top 10 gene sets with mean FI for HDE, HDC and HDE-HDC
partitions. We found that the combined HDE-HDC criteria
outperformed both of the individual criteria in all gene sets, as
marked by both blue and yellow asterisks.
| Table II.Top 10 best associated gene sets with
highest mean minimum FI gain. |
Table II.
Top 10 best associated gene sets with
highest mean minimum FI gain.
| Rank | Gene sets | Gene set
category |
Δ*G |
|---|
| 1 | Nucleoside
metabolic process | GO\GO:0009116 | 18.681 |
| 2 | Complement and
coagulation cascades | KEGG\hsa04610 | 17.692 |
| 3 | Nonsense mediated
decay independent of the exon junction complex |
REACTOME\REACT_75768.1 | 15.294 |
| 4 | Viral gene
expression | GO\GO:0019080 | 13.465 |
| 5 | Structural
constituent of ribosome | GO\GO:0003735 | 12.028 |
| 6 | mRNA
processing | GO\GO:0006397 | 11.794 |
| 7 | Nuclear-transcribed
mRNA catabolic process | GO\GO:0000956 | 11.389 |
| 8 | Resolution of
sister chromatid cohesion |
REACTOME\REACT_150425.2 | 10.452 |
| 9 | Proton-transporting
two-sector ATPase complex | GO\GO:0016469 | 10.040 |
| 10 | GTPase
activity | GO\GO:0003924 | 9.983 |
Association between MAPRE1 and the
nucleoside metabolic process
To illustrate the DC and DE analysis in more
detail, we selected the first ranked best association gene set for
further exploration. As shown in Fig.
5, the first ranked gene set was nucleoside metabolic process.
It was the best associated gene set among a total of 24 HDE-HDC
partitions. Among these partitions, the gene MAPRE1 attained
a highest minimum FI gain of 18.681. Specifically, the gene set was
associated with the HDE-HDC, HDE, and HDC partitions with the
adjusted P of 2.67E-43, 3.98E-07 and 4.24E-18, respectively. The
average expression of MAPRE1 in the tumor state was
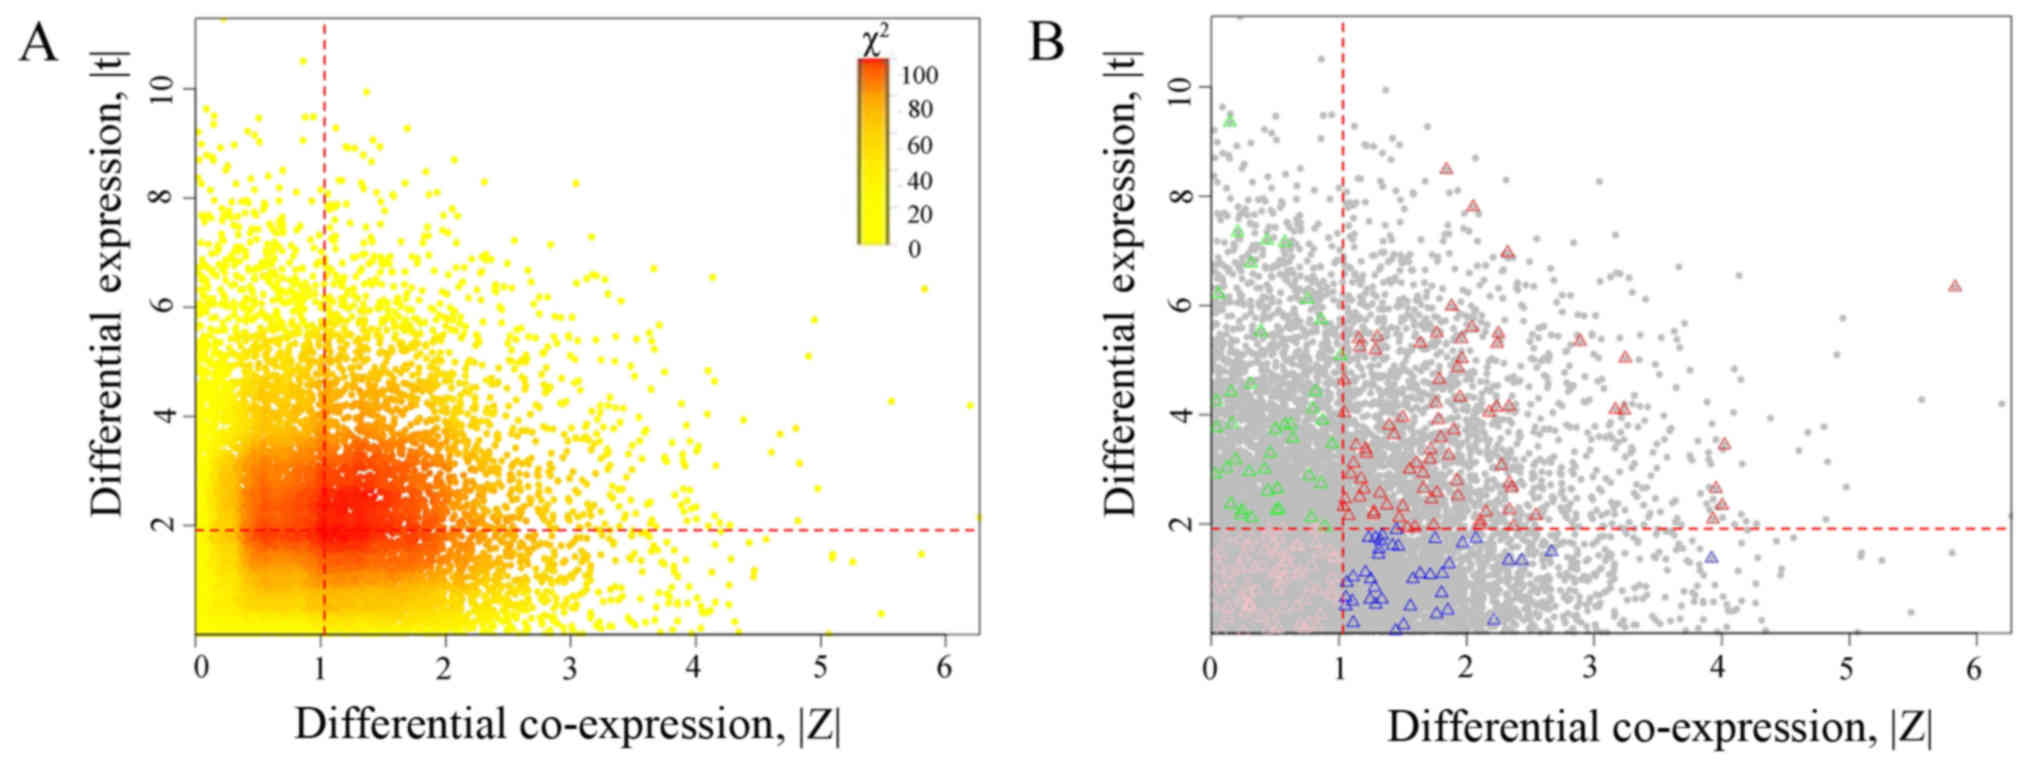
significantly higher than that in the normal state (P<0.05).
Moreover, the scatter plots of DE and DC for MAPRE1 are
shown in Fig. 6A, and red dashed
lines represent the optimal thresholds. With the optimal gene of
(1.032, 1.911), genes were divided into four partitions including:
HDE-HDC (2,053 genes), HED-LDC (2,822 genes), LDE-HDC (2,622
genes), and LDE-LDC (6,169 genes). The amount of expected
frequencies for HDE-HDC was 1667.7, which was lower than the
observed 2,053, and hence the association was positive. Genes of
nucleoside metabolic process in these four partitions are
highlighted using triangles as shown in Fig. 6B.
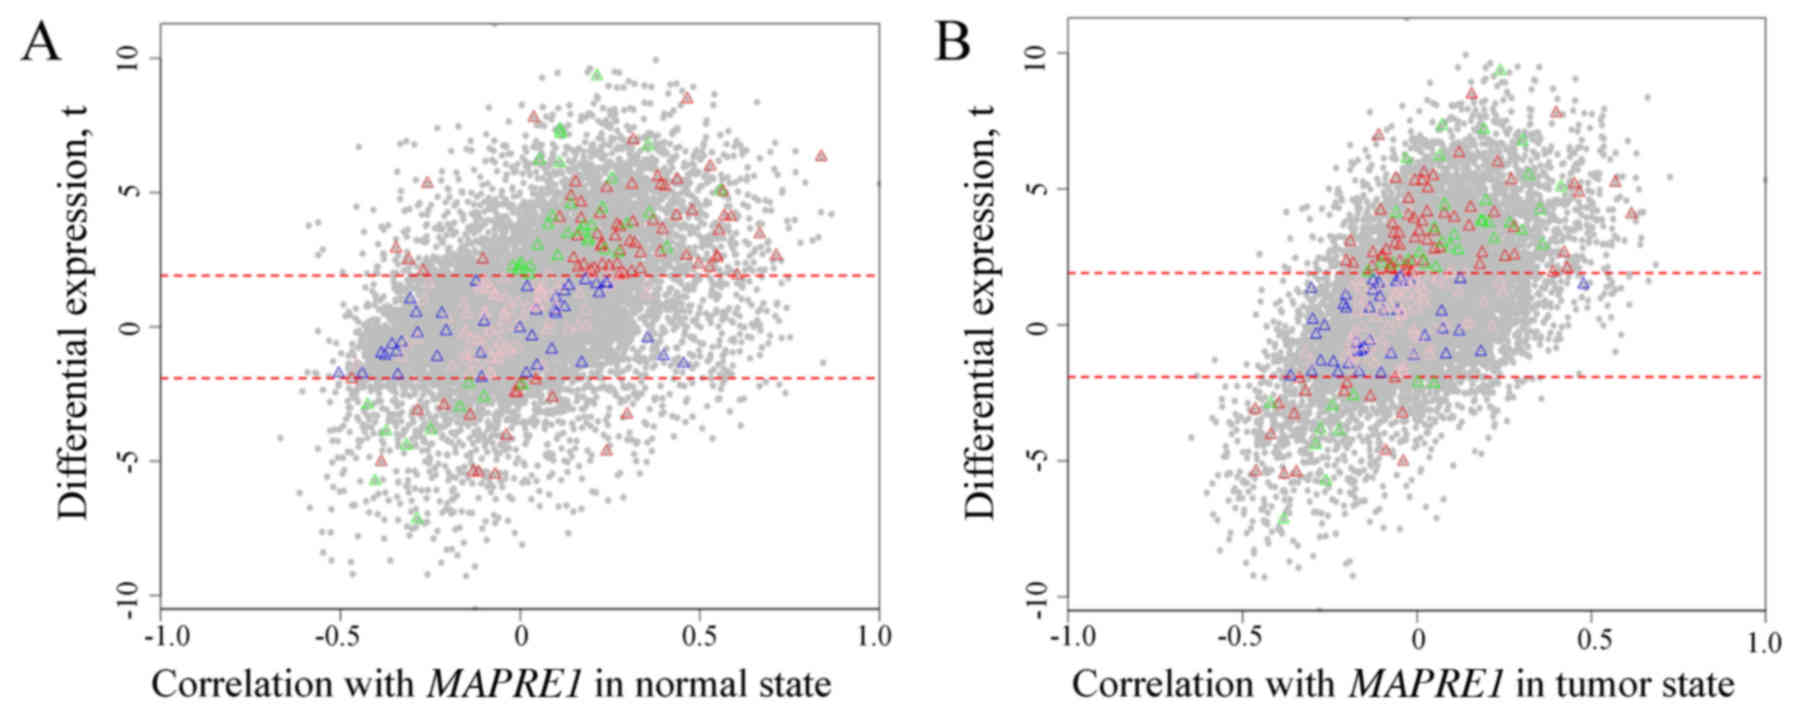
The scatter plot of DE and correlation between
genes and MAPRE1 in the normal (Fig. 7A) and tumor state (Fig. 7B) are shown in Fig. 7, separately. Most selected genes in
HDE-HDC partitions were more positively correlated with
MAPRE1 in the tumor group compared to the normal state. All
of selected genes in the HDE-HDC partition attained a higher
expression in the HCC state. There was a difference for the
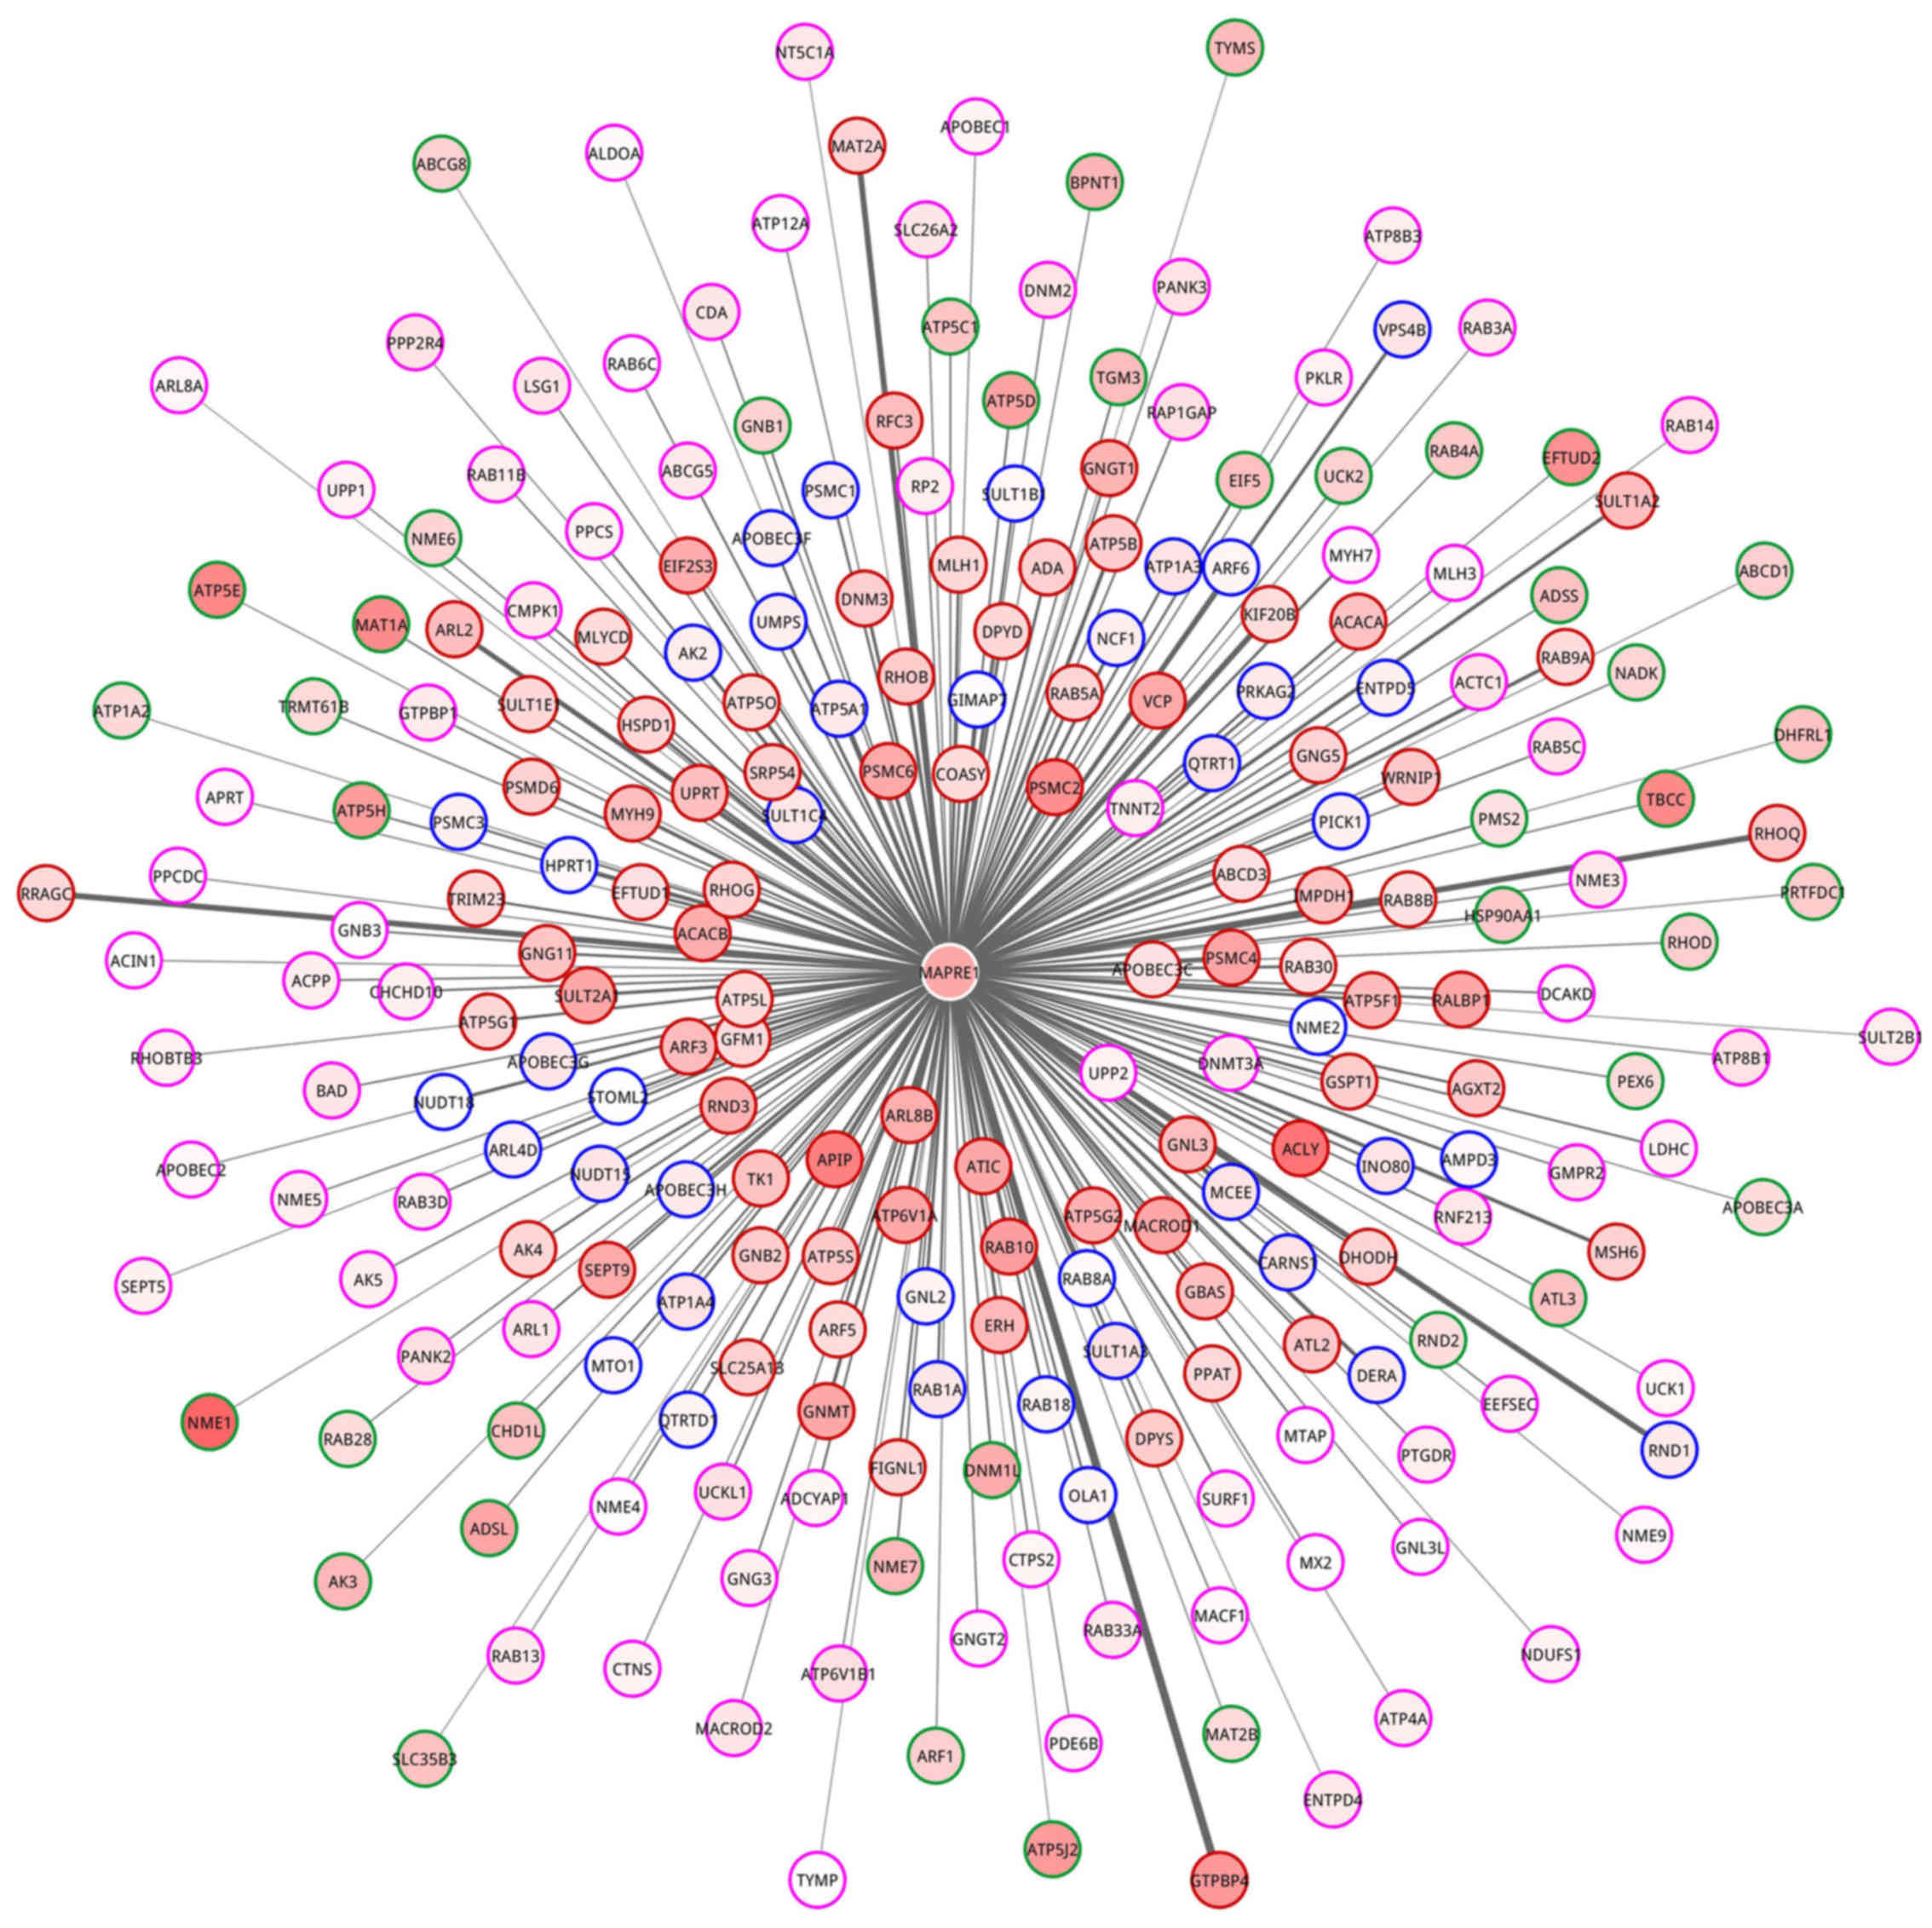
correlation with MAPRE1 between the normal and tumor state.
Meanwhile, a network for MAPRE1 and 238 gene enriched in
nucleoside metabolic process was constructed (Fig. 8). In the network, 79, 40, 41 and 78
genes belonged to HDE-HDC, LDE-HDC, HDE-LDC and LDE-LDC partition,
respectively.
Discussion
Generally, researchers concentrate only on DE or DC
analysis, and it is rarity for a study to integrate the two types
of analysis together. In the present study, we employed a DEDC
method which combined DE and DC analysis to investigate the optimal
gene and gene set in HCC. When compared with the single approach,
the DEDC algorithm is a valuable methodology for investigating
biological functions of genes exhibiting disease-associated DE and
DC combined characteristics, and these functional genes and
processes may not be easily revealed through DE or DC approach
alone. The main procedures for this approach include calculation of
DE and DC levels, determination of the optimal thresholds and
evaluation of functional relevance of different gene partitions.
The optimal threshold for DC and DE were 1.032 and 1.911, and the
corresponding gene was MAPRE1 which was validated by RT-PCR
assay (P<0.05) between HCC and the normal state. This outcome
also confirmed the feasibility of the DEDC method in turn.
MAPRE1, encoded EB1, regulates microtubule
dynamic instability and chromosomal stability during mitosis,
interacts with the adenomatous polyposis coli (APC) tumor
suppressor, and may play an important role in tumorigenesis
(37). Dysregulation of the APC-EB1
interaction, through APC mutation or EB1 overexpression, may
promote cellular proliferation, spindle defects, and aberrant
chromosomal segregation (38).
Overexpression of MAPRE1 has been found to induce nuclear
accumulation of β-catenin and activate the β-catenin/T-cell factor
pathway leading to a promotion of cell growth and increase in
colony formation (39,40). Moreover, Taguchi et al showed
a significant elevation of circulating MAPRE1 protein in
newly diagnosed and pre-diagnostic colorectal cancer plasma samples
(41). It was demonstrated that
this gene was elevated in tissue from head and neck cancer
(42) and was correlated with tumor
size and associated with poor differentiation in HCC tissue
(43). Therefore, we inferred that
MAPRE1 plays a significant role in the progression of HCC,
and it was consistent with our RT-PCR result. The finding confirmed
the accuracy and feasibility of the DEDC method.
Based on the DEDC algorithm, the optimal gene set
was nucleoside metabolic process (GO\GO:0009116) with
Δ*G=18.681 and 24 HDE-HDC partitions in total.
Nucleoside metabolic process refers to chemical reactions and
pathways involving a nucleoside, a nucleobase linked to either
β-D-ribofuranose (a ribonucleoside) or 2-deoxy-β-D-ribofuranose (a
deoxyribonucleoside), for example, uridine, inosine, guanosine,
adenosine, cytidine and deoxyadenosine, deoxyguanosine,
deoxycytidine and thymidine (44).
Metabolic incorporation of azido nucleoside analogues into living
cells enables sensitive detection of DNA replication through copper
(I)-catalyzed azide-alkyne cycloaddition and strain-promoted
azide-alkyne cycloaddition (45),
whereas the altered DNA replications often lead to disease or even
cancer. A previous study suggested that MYC contributes to the
metabolic reprogramming of tumor cells by stimulating nucleotide
synthesis and mitochondrial biogenesis (46). Recently, Laks et al showed
that nucleoside salvage pathway kinases regulate hematopoiesis by
linking nucleotide metabolism with replication stress in
glioblastoma patients (47). Hence,
we may deduce that nucleoside metabolic process is closely
correlated to tumors. It is the first time to uncover the functions
of nucleoside metabolic process in HCC.
In conclusion, we successfully investigated the
optimal gene (MAPRE1) and gene set (nucleoside metabolic
process) which may be potential biomarkers for targeted therapy and
we provide significant insight for revealing the pathological
mechanism underlying HCC.
Acknowledgements
This study received no specific grants from any
funding agency in public, commercial, or not-for-profit
sectors.
References
|
1
|
Kaseb AO, Xiao L, Naguib R, El-Shikh W,
Hassan M, Hassabo H, Lee JH, Yoon JH, Lee HS, Chae YK, et al:
Abstract C26: Development and validation of a scoring system using
insulin-like growth factor to assess hepatic reserve in
hepatocellular carcinoma. Mol Cancer Ther. 12:(Suppl 11). C262013.
View Article : Google Scholar
|
|
2
|
Arzumanyan A, Reis HM and Feitelson MA:
Pathogenic mechanisms in HBV- and HCV-associated hepatocellular
carcinoma. Nat Rev Cancer. 13:123–135. 2013. View Article : Google Scholar : PubMed/NCBI
|
|
3
|
Aoki T, Kokudo N, Matsuyama Y, Izumi N,
Ichida T, Kudo M, Ku Y, Sakamoto M, Nakashima O, Matsui O, et al:
Liver Cancer Study Group of Japan: Prognostic impact of spontaneous
tumor rupture in patients with hepatocellular carcinoma: An
analysis of 1160 cases from a nationwide survey. Ann Surg.
259:532–542. 2014. View Article : Google Scholar : PubMed/NCBI
|
|
4
|
Llovet JM, Peña CE, Lathia CD, Shan M,
Meinhardt G and Bruix J: SHARP Investigators Study Group: Plasma
biomarkers as predictors of outcome in patients with advanced
hepatocellular carcinoma. Clin Cancer Res. 18:2290–2300. 2012.
View Article : Google Scholar : PubMed/NCBI
|
|
5
|
Jordán F, Nguyen TP and Liu WC: Studying
protein-protein interaction networks: A systems view on diseases.
Brief Funct Genomics. 11:497–504. 2012. View Article : Google Scholar : PubMed/NCBI
|
|
6
|
Doncheva NT, Kacprowski T and Albrecht M:
Recent approaches to the prioritization of candidate disease genes.
Wiley Interdiscip Rev Syst Biol Med. 4:429–442. 2012. View Article : Google Scholar : PubMed/NCBI
|
|
7
|
Kulkarni H, Göring HHH, Diego V, Cole S,
Walder KR, Collier GR, Blangero J and Carless MA: Association of
differential gene expression with imatinib mesylate and omacetaxine
mepesuccinate toxicity in lymphoblastoid cell lines. BMC Med
Genomics. 5:372012. View Article : Google Scholar : PubMed/NCBI
|
|
8
|
McCormick KP, Willmann MR and Meyers BC:
Experimental design, preprocessing, normalization and differential
expression analysis of small RNA sequencing experiments. Silence.
2:22011. View Article : Google Scholar : PubMed/NCBI
|
|
9
|
Choi CH, Choi JJ, Park YA, Lee YY, Song
SY, Sung CO, Song T, Kim MK, Kim TJ, Lee JW, et al: Identification
of differentially expressed genes according to chemosensitivity in
advanced ovarian serous adenocarcinomas: Expression of GRIA2
predicts better survival. Br J Cancer. 107:91–99. 2012. View Article : Google Scholar : PubMed/NCBI
|
|
10
|
Lucas SM and Heath EI: Current challenges
in development of differentially expressed and prognostic prostate
cancer biomarkers. Prostate Cancer. 2012:6409682012. View Article : Google Scholar : PubMed/NCBI
|
|
11
|
Anglani R, Creanza TM, Liuzzi VC, Piepoli
A, Panza A, Andriulli A and Ancona N: Loss of connectivity in
cancer co-expression networks. PLoS One. 9:e87075. 2014. View Article : Google Scholar : PubMed/NCBI
|
|
12
|
de la Fuente A: From ‘differential
expression’ to ‘differential networking’ - identification of
dysfunctional regulatory networks in diseases. Trends Genet.
26:326–333. 2010. View Article : Google Scholar : PubMed/NCBI
|
|
13
|
Bockmayr M, Klauschen F, Györffy B,
Denkert C and Budczies J: New network topology approaches reveal
differential correlation patterns in breast cancer. BMC Syst Biol.
7:782013. View Article : Google Scholar : PubMed/NCBI
|
|
14
|
Cornella H, Alsinet C, Sayols S, Zhang Z,
Hao K, Cabellos L, Hoshida Y, Villanueva A, Thung S, Ward SC, et
al: Unique genomic profile of fibrolamellar hepatocellular
carcinoma. Gastroenterolog. 148:806–818. 2015. View Article : Google Scholar
|
|
15
|
Mah WC, Thurnherr T, Chow PK, Chung AY,
Ooi LL, Toh HC, Teh BT, Saunthararajah Y and Lee CG: Methylation
profiles reveal distinct subgroup of hepatocellular carcinoma
patients with poor prognosis. PLoS One. 9:e1041582014. View Article : Google Scholar : PubMed/NCBI
|
|
16
|
Irizarry RA, Bolstad BM, Collin F, Cope
LM, Hobbs B and Speed TP: Summaries of Affymetrix GeneChip probe
level data. Nucleic Acids Res. 31:e15. 2003. View Article : Google Scholar : PubMed/NCBI
|
|
17
|
Bolstad BM, Irizarry RA, Astrand M and
Speed TP: A comparison of normalization methods for high density
oligonucleotide array data based on variance and bias.
Bioinformatics. 19:185–193. 2003. View Article : Google Scholar : PubMed/NCBI
|
|
18
|
Bolstad B: affy: Built-in Processing
Methods. 2013.https://www.bioconductor.org/packages/devel/bioc/vignettes/affy/inst/doc/builtinMethods.pdf
|
|
19
|
Allen JD, Wang S, Chen M, Girard L, Minna
JD, Xie Y and Xiao G: Probe mapping across multiple microarray
platforms. Brief Bioinform. 13:547–554. 2012. View Article : Google Scholar : PubMed/NCBI
|
|
20
|
Sims AH, Smethurst GJ, Hey Y, Okoniewski
MJ, Pepper SD, Howell A, Miller CJ and Clarke RB: The removal of
multiplicative, systematic bias allows integration of breast cancer
gene expression datasets - improving meta-analysis and prediction
of prognosis. BMC Med Genomics. 1:422008. View Article : Google Scholar : PubMed/NCBI
|
|
21
|
Asness CS, Moskowitz TJ and Pedersen LH:
Value and momentum everywhere. J Finance. 68:929–985. 2013.
View Article : Google Scholar
|
|
22
|
Wang J: Pearson correlation
coefficientEncyclopedia of Systems Biology. Dubitzky W, Wolkenhauer
O, Cho KH and Yokota H: Springer; New York, NY: pp. 16712013,
View Article : Google Scholar
|
|
23
|
Gayen AK: The frequency distribution of
the product-moment correlation coefficient in random samples of any
size drawn from non-normal universes. Biometrika. 38:219–247. 1951.
View Article : Google Scholar : PubMed/NCBI
|
|
24
|
McHugh ML: The chi-square test of
independence. Biochem Med Zagreb. 23:143–149. 2013. View Article : Google Scholar : PubMed/NCBI
|
|
25
|
Agresti A: Categorical Data Analysis. 1st.
John Wiley & Sons; New York, NY: 1996
|
|
26
|
Simas AB and Cordeiro GM: Adjusted Pearson
residuals in exponential family nonlinear models. J Stat Comput
Simul. 79:411–425. 2009. View Article : Google Scholar
|
|
27
|
Dolinski K and Botstein D: Automating the
construction of gene ontologies. Nat Biotechnol. 31:34–35. 2013.
View Article : Google Scholar : PubMed/NCBI
|
|
28
|
Ashburner M, Ball CA, Blake JA, Botstein
D, Butler H, Cherry JM, Davis AP, Dolinski K, Dwight SS, Eppig JT,
et al: The Gene Ontology Consortium: Gene ontology: Tool for the
unification of biology. Nat Genet. 25:25–29. 2000. View Article : Google Scholar : PubMed/NCBI
|
|
29
|
Croft D, O'Kelly G, Wu G, Haw R, Gillespie
M, Matthews L, Caudy M, Garapati P, Gopinath G, Jassal B, et al:
Reactome: a database of reactions, pathways and biological
processes. Nucleic Acids Res. 39:D691–D697. 2011. View Article : Google Scholar : PubMed/NCBI
|
|
30
|
Kanehisa M, Goto S, Sato Y, Furumichi M
and Tanabe M: KEGG for integration and interpretation of
large-scale molecular data sets. Nucleic Acids Res. 40:D109–D114.
2012. View Article : Google Scholar : PubMed/NCBI
|
|
31
|
Upton GJ: Fisher's exact test. J R Stat
Soc Ser A Stat Soc. 155:395–402. 1992. View Article : Google Scholar
|
|
32
|
Bonferroni CE: Teoria statistica delle
classi e calcolo delle probabilita. Libreria internazionale Seeber.
1936.
|
|
33
|
Benjamini Y and Hochberg Y: Controlling
the false discovery rate: A practical and powerful approach to
multiple testing. J R Stat Soc B. 57:289–300. 1995.
|
|
34
|
Lui TW, Tsui NB, Chan LW, Wong CS, Siu PM
and Yung BY: DECODE: An integrated differential co-expression and
differential expression analysis of gene expression data. BMC
Bioinformatics. 16:1822015. View Article : Google Scholar : PubMed/NCBI
|
|
35
|
Bryman A and Cramer D: Quantitative Data
Analysis with SPSS 12 and 13. Routledge; Hove, East Sussex:
2005
|
|
36
|
Haynes W: Student's t-TestEncyclopedia of
Systems Biology. Dubitzky W, Wolkenhauer O, Cho KH and Yokota H:
Springer; New York, NY: pp. 2023–2025. 2013, View Article : Google Scholar
|
|
37
|
Ladd JJ, Busald T, Johnson MM, Zhang Q,
Pitteri SJ, Wang H, Brenner DE, Lampe PD, Kucherlapati R, Feng Z,
et al: Increased plasma levels of the APC-interacting protein
MAPRE1, LRG1, and IGFBP2 preceding a diagnosis of colorectal cancer
in women. Cancer Prev Res (Phila). 5:655–664. 2012. View Article : Google Scholar : PubMed/NCBI
|
|
38
|
Stypula-Cyrus Y, Mutyal NN, Cruz M Dela,
Kunte DP, Radosevich AJ, Wali R, Roy HK and Backman V: End-binding
protein 1 (EB1) up-regulation is an early event in colorectal
carcinogenesis. FEBS Lett. 588:829–835. 2014. View Article : Google Scholar : PubMed/NCBI
|
|
39
|
Liu M, Yang S, Wang Y, Zhu H, Yan S, Zhang
W, Quan L, Bai J and Xu N: EB1 acts as an oncogene via activating
β-catenin/TCF pathway to promote cellular growth and inhibit
apoptosis. Mol Carcinog. 48:212–219. 2009. View Article : Google Scholar : PubMed/NCBI
|
|
40
|
Wang Y, Zhou X, Zhu H, Liu S, Zhou C,
Zhang G, Xue L, Lu N, Quan L, Bai J, et al: Overexpression of EB1
in human esophageal squamous cell carcinoma (ESCC) may promote
cellular growth by activating β-catenin/TCF pathway. Oncogene.
24:6637–6645. 2005. View Article : Google Scholar : PubMed/NCBI
|
|
41
|
Taguchi A, Rho JH, Yan Q, Zhang Y, Zhao Y,
Xu H, Tripathi SC, Wang H, Brenner DE, Kucherlapati M, et al:
MAPRE1 as a plasma biomarker for early-stage colorectal cancer and
adenomas. Cancer Prev Res (Phila). 8:1112–1119. 2015. View Article : Google Scholar : PubMed/NCBI
|
|
42
|
Ralhan R, Desouza LV, Matta A, Tripathi S
Chandra, Ghanny S, Gupta S Datta, Bahadur S and Siu KW: Discovery
and verification of head-and-neck cancer biomarkers by differential
protein expression analysis using iTRAQ labeling, multidimensional
liquid chromatography, and tandem mass spectrometry. Mol Cell
Proteomics. 7:1162–1173. 2008. View Article : Google Scholar : PubMed/NCBI
|
|
43
|
Orimo T, Ojima H, Hiraoka N, Saito S,
Kosuge T, Kakisaka T, Yokoo H, Nakanishi K, Kamiyama T, Todo S, et
al: Proteomic profiling reveals the prognostic value of adenomatous
polyposis coli-end-binding protein 1 in hepatocellular carcinoma.
Hepatology. 48:1851–1863. 2008. View Article : Google Scholar : PubMed/NCBI
|
|
44
|
Waszczuk-Jankowska M, Markuszewski MJ,
Markuszewski M and Kaliszan R: Comparison of RP-HPLC columns used
for determination of nucleoside metabolic patterns in urine of
cancer patients. Bioanalysis. 4:1185–1194. 2012. View Article : Google Scholar : PubMed/NCBI
|
|
45
|
Neef AB and Luedtke NW: An azide-modified
nucleoside for metabolic labeling of DNA. ChemBioChem. 15:789–793.
2014. View Article : Google Scholar : PubMed/NCBI
|
|
46
|
Wahlström T and Henriksson MA: Impact of
MYC in regulation of tumor cell metabolism. Biochim Biophys Acta.
1849:563–569. 2015. View Article : Google Scholar : PubMed/NCBI
|
|
47
|
Laks DR, Ta L, Crisman TJ, Gao F, Coppola
G, Radu CG, Nathanson DA and Kornblum HI: Inhibition of nucleotide
synthesis targets brain tumor stem cells in a subset of
glioblastoma. Mol Cancer Ther. 15:1271–1278. 2016. View Article : Google Scholar : PubMed/NCBI
|