Introduction
Gastric cancer (GC) is the 4th most common cause of
cancer-related deaths worldwide. In 2012, there were almost
1,000,000 new cases and over 720,000 deaths (1). Currently, the standard care for GC
patients includes surgery, chemotherapy, radiotherapy and targeted
therapy. However, even after multimodal therapy most patients still
suffer a high rate of disease recurrence, metastasis and
progression (2). Insight into the
molecular mechanisms of gastric carcinogenesis may offer novel,
more effective treatment options. Several studies in GC have
investigated inhibition of targets such as HER-2, EGFR, VEGFR,
mTOR, C-Met and HGF alone or in combination with chemotherapy
(3–7). However, to date, only two studies have
shown promising clinical results of molecular-target agents in GC.
First, the TOGA study established trastuzumab in combination with
chemotherapy as a new standard of care for patients with
HER2-neu-positive advanced or metastatic GC (5). Second, the REGARD trial demonstrated a
survival benefit for ramucirumab in patients with advanced gastric
or esophagogastric junction (EGJ) adenocarcinoma after progression
following first-line chemotherapy (3). Overall, however, the population of
patients who can benefit from available targeted therapies is very
limited. Therefore, identification of novel GC therapeutic targets
is essential.
Alterations at chromosomal position 9q21 have been
detected in numerous types of human cancer, including breast and
lung cancer, melanoma and glioblastoma (8–11). G
protein subunit α q (GNAQ) is a protein coding gene and the
oncogenic potential of GNAQ was revealed by a systematic analysis
of the transforming potential of G proteins and GPCRs (12). Additionally gain of function
mutations in GNAQ or GNA11 oncogenes, encoding persistently active
GNAQ, have been previously demonstrated to drive uveal melanoma
growth (13). However, the precise
molecular mechanism of the GNAQ contribution to oncogenesis remains
unknown and its potential role in GC has yet to be examined. In the
present study, we investigated the relationship between GNAQ
overexpression and the clinicopathological features of patients
with GC, and also determined the biological functions of GNAQ in
GC.
Materials and methods
Patient samples
GC patients treated with curative gastrectomy at the
First Hospital of Jilin University (Changchun, China) were enrolled
in the present study. Tumor specimens were collected from patients
between 2011 and 2013. The World Health Organization Classification
of Tumors was used for histological grading. Tumors were staged
according to the TNM classification of the American Joint Committee
on Cancer (AJCC)/Union for International Cancer Control (UICC).
Survival status was updated in November 2015. Overall survival (OS)
was calculated from the date of surgery to the date of death or to
the date of the most recent follow-up. Disease-free survival (DFS)
was calculated from the date of curative surgery to the date of
progression, or to the date of the most recent follow-up. The
present study, was retrospectively performed and approved by the
Institutional Review Board of the First Hospital of Jilin
University. All patients provided informed consent for the use of
their clinical specimens in the present study.
Tissue sample
immunohistochemistry
Tumor specimens containing normal and carcinoma
tissues were obtained from the patients after surgery. Histology of
the surgical specimens was observed using the
streptavidin-peroxidase (SP) assay according to the manufacturer's
instructions (Histostain-Bulk-SP kit; Zymed, South San Francisco,
CA, USA). Primary anti-GNAQ antibody (diluted 1:50; Proteintech,
Chicago, IL, USA) was used for immunohistochemical staining.
Specimen staining results were evaluated by two independent
pathologists blinded to the clinicopathological data. Scores for
each specimen were calculated by multiplying the staining intensity
and the distribution area of GNAQ-positively stained cells. The
specimen staining intensity was divided into light yellow, yellow,
brown yellow and reddish brown which were scored as 0, 1, 2 and 3,
respectively. The distribution area of the positively-stained cells
(0%; 1–20%; 21–60%; 61–100%) was scored as 0, 1, 2 and 3,
respectively. The final total score was determined as negative
(scores 0–1) and positive (scores 2–6).
Cell culture
Human GC cell lines MGC80-3, SGC7901, AGS and human
embryonic kidney cell line 293T (HEK293T) were obtained from the
Cell Bank of the Chinese Academy of Sciences (Shanghai, China).
MGC80-3 and SGC7901 cells were maintained in RPMI-1640 medium
(HyClone, Logan, UT, USA) with 10% fetal bovine serum (FBS;
Biological Industries, Kibbutz Beit Haemek, Israel). AGS cells were
cultured in Ham's F12 medium (Gibco-BRL, Grand Island, NY, USA) and
10% FBS. HEK293T cells were grown to confluence in Dulbecco's
modified Eagle's medium (HyClone) supplemented with 5% FBS. These
cell lines were maintained in a 5% CO2-humidified
atmosphere at 37̊C.
Lentivirus construction and
transfection
Targeting human GNAQ (NM_002072.4) shRNA (S1)
sequence
(5′-GATCCCTATGATAGACGACGAGAATACTCGAGTATTCTCGTCGTCTATCATAGTTTTTG-3′),
shRNA (S2) sequence
(5′-GATCCCTATGATAGACGACGAGAATACTCGAGAGATATTCTCGTCGTCTATCATTTTTTG-3′)
and the control shRNA sequence
(5′-GATCCTTCTCCGAACGTGTCACGTCTCGAGACGACGCACTGGCGGAGAATTTTTG-3′)
were designed and inserted into the pFH lentivirus vector
(Hollybio, Shanghai, China). The recombinant GNAQ silencing and
control plasmid were transfected into HEK293T cells using
Lipofectamine 2000 (Invitrogen, Carlsbad, CA, USA). After 48 h of
transfection, the recombinant lentivirus encoding shRNA against
GNAQ or the control shRNA were harvested and purified. Short
hairpin RNA (shRNA) interference vector pFH-L containing an H1
promoter upstream of the shRNA, lentivirus packaging vector pVSVG-I
and pCMV4R8.92 were obtained from Shanghai Hollybio (Shanghai,
China), which uses green fluorescent protein (GFP) as an internal
control with an independent promoter. For the generation of
MGC80-3-shGNAQ (S1), MGC80-3-shGNAQ (S2), MGC80-3-shControl,
SGC7901-shGNAQ (S1) and SGC7901-shControl cells, the MGC80-3 and
SGC7901 cells were added together with shGNAQ or shCon lentivirus
at a multiplicity of infection (MOI) of 40, respectively. A
fluorescence microscope was used to verify recombinant lentiviral
transduction efficiency. After 120 h of infection, cells were
observed and photographed under a fluorescence microscope (BX50;
Olympus, Tokyo, Japan) and then harvested to assess GNAQ silencing
efficiency using qRT-PCR and western blotting.
Quantitative real-time PCR (qRT-PCR)
analysis
Total RNA from the cultured MGC80-3 and SGC7901 cell
lines were reversely transcribed into cDNA using oligo(dT) primer
and M-MLV reverse transcriptase (Promega, Madison, WI, USA)
following the manufacturer's protocol. The mixture of 10 µl 2X SYBR
Premix Ex Taq, 0.8 µl forward and reverse primers (2.5 µM), 5 µl
cDNA and 4.2 µl ddH2O was added to qRT-PCR reactions
using the ABI 7300 cycler (Applied Biosystems, Foster City, CA,
USA). The β-actin gene was used to normalize expression levels in
subsequent quantitative analyses. To amplify the target genes, the
following primers were used: GNAQ forward,
5′-GACACCATCCTCCAGTTGAACC-3′ and reverse,
5′-ACACGCTCACACAGAGTCCAG-3′; β-actin forward,
5′-GTGGACATCCGCAAAGAC-3′ and reverse,
5′-AAAGGGTGTAACGCAACTA-3′.
Western blotting
Cell samples were harvested in protein lysis buffer
2X SDS lysis buffer containing 100 mM Tris-HCl (pH 6.8), 10 mM
EDTA, 4% SDS and 10% glycine. Protein supernatants were obtained by
centrifugation at 12,000 rpm for 10 min at 4̊C. Protein
quantification was carried out using a BCA protein assay kit
(PF205629; Thermo Fisher Scientific, Waltham, MA USA). Protein was
separated using SDS-PAGE and was blotted onto a polyvinylidene
fluoride (PVDF) membrane (Millipore, Billerica, MA, USA). After
blocking with 5% skim milk in a Tris-buffered saline (TBS) buffer,
the membrane was probed with a primary antibody for GNAQ
(#13927-1-AP), p53 (#10442-1-AP; both from Proteintech), p21
(#2947; Cell Signaling Technology, Inc., Danvers, MA, USA), cyclin
A (#18202-1-AP; Proteintech), p-CDK2 (#2561), CDK2 (#2546), p-ERK
(#4370), ERK (#Sc-154) (all from Cell Signaling Technology, Inc.,),
p-MEK (#11205) and MEK (#21428) [both from Signalway Antibody
(SAB), College Park, MD, USA] with a dilution of 1:1,000,
respectively, and GAPDH (#10494-1-AP; Proteintech) as a control
with a dilution of 1:100,000 at 4̊C overnight. After rinsing three
times with TBS solution buffer, the membrane was incubated with
horseradish peroxidase-conjugated secondary goat anti-rabbit IgG
antibody (#Sc-2054; Santa Cruz Biotechnology, Inc., Dallas, TX,
USA) and then washed, followed by visualization using a
chemiluminescence analysis system (Tanon-4200; Tianneng, Shanghai,
China).
Cell growth assay
Cellular growth of the MGC80-3 control (Con group),
MGC80-3-transfected (shCon and shGNAQ groups), SGC7901 control (Con
group) and SGC7901 transfected cells (shCon and shGNAQ groups),
were assessed using
3-(4,5-dimethylthiazol-2-yl)-2,5-diphenyltetrazolium bromide (MTT)
assay. After 72 h of incubation, the cells were trypsinized,
resuspended, counted and plated in a 96-well plate at a density of
2×10³ cells/well for five time-points (day 1, 2, 3, 4
and 5). At each time point, MTT solution was added for 4 h followed
by acidic isopropanol overnight. The absorbance at 595 nm was
assessed to evaluate cell growth. The experiment was performed in
triplicate for each data point.
Cell colony formation assay
A total of 500 cells for each group including the
MGC80-3 control cells (Con group), MGC80-3 transfected cells (shCon
and shGNAQ groups), SGC7901 control cells (Con group) and
SGC7901-transfected cells (shCon and shGNAQ groups), were seeded
into each well of a 6-well plate. The culture medium was changed
every three days, and cells were cultured for 9 days at 37̊C.
Subsequently, the cells were washed with phosphate-buffered saline
(PBS), fixed with 4% paraformaldehyde for 30 min, and then stained
with 0.1% crystal violet for 20 min. The cell colonies were then
counted under a light microscope (CH-2; Olympus) and photographed
under a digital camera (Nikon, Tokyo, Japan). The experiments were
performed in triplicate.
Cell cycle analysis
The MGC80-3 control cells (Con group),
MGC80-3-transfected cells (shCon and shGNAQ groups), SGC7901
control cells (Con group) and SGC7901-transfected cells (shCon and
shGNAQ groups) were trypsinized, washed twice in cold PBS with 0.1%
bovine serum albumin, and fixed with 75% ethanol overnight. Before
being run on the flow cytometer, the cells were washed twice again
as aforementioned and incubated with 5 µl RNase (200 U/ml,
DNase-free) for 15 min. The cells were then stained with 10 µg/ml
propidium iodide for at least 1 h in the dark. The cell cycle
distribution was analyzed by a FACSCalibur flow cytometer (BD
Biosciences, San Jose, CA, USA). Each experiment was performed in
triplicate.
Statistical analysis
Results were analyzed using SPSS 17.0 software
(SPSS, Inc., Chicago, IL, USA). Data are presented as the mean ±
SD. Statistical significance was determined by Student's t-test.
The characteristics of two GC patient groups were compared using
the χ2 test. DFS and OS curves were estimated using the
Kaplan-Meier method. A p-value <0.05 was considered
statistically significant.
Results
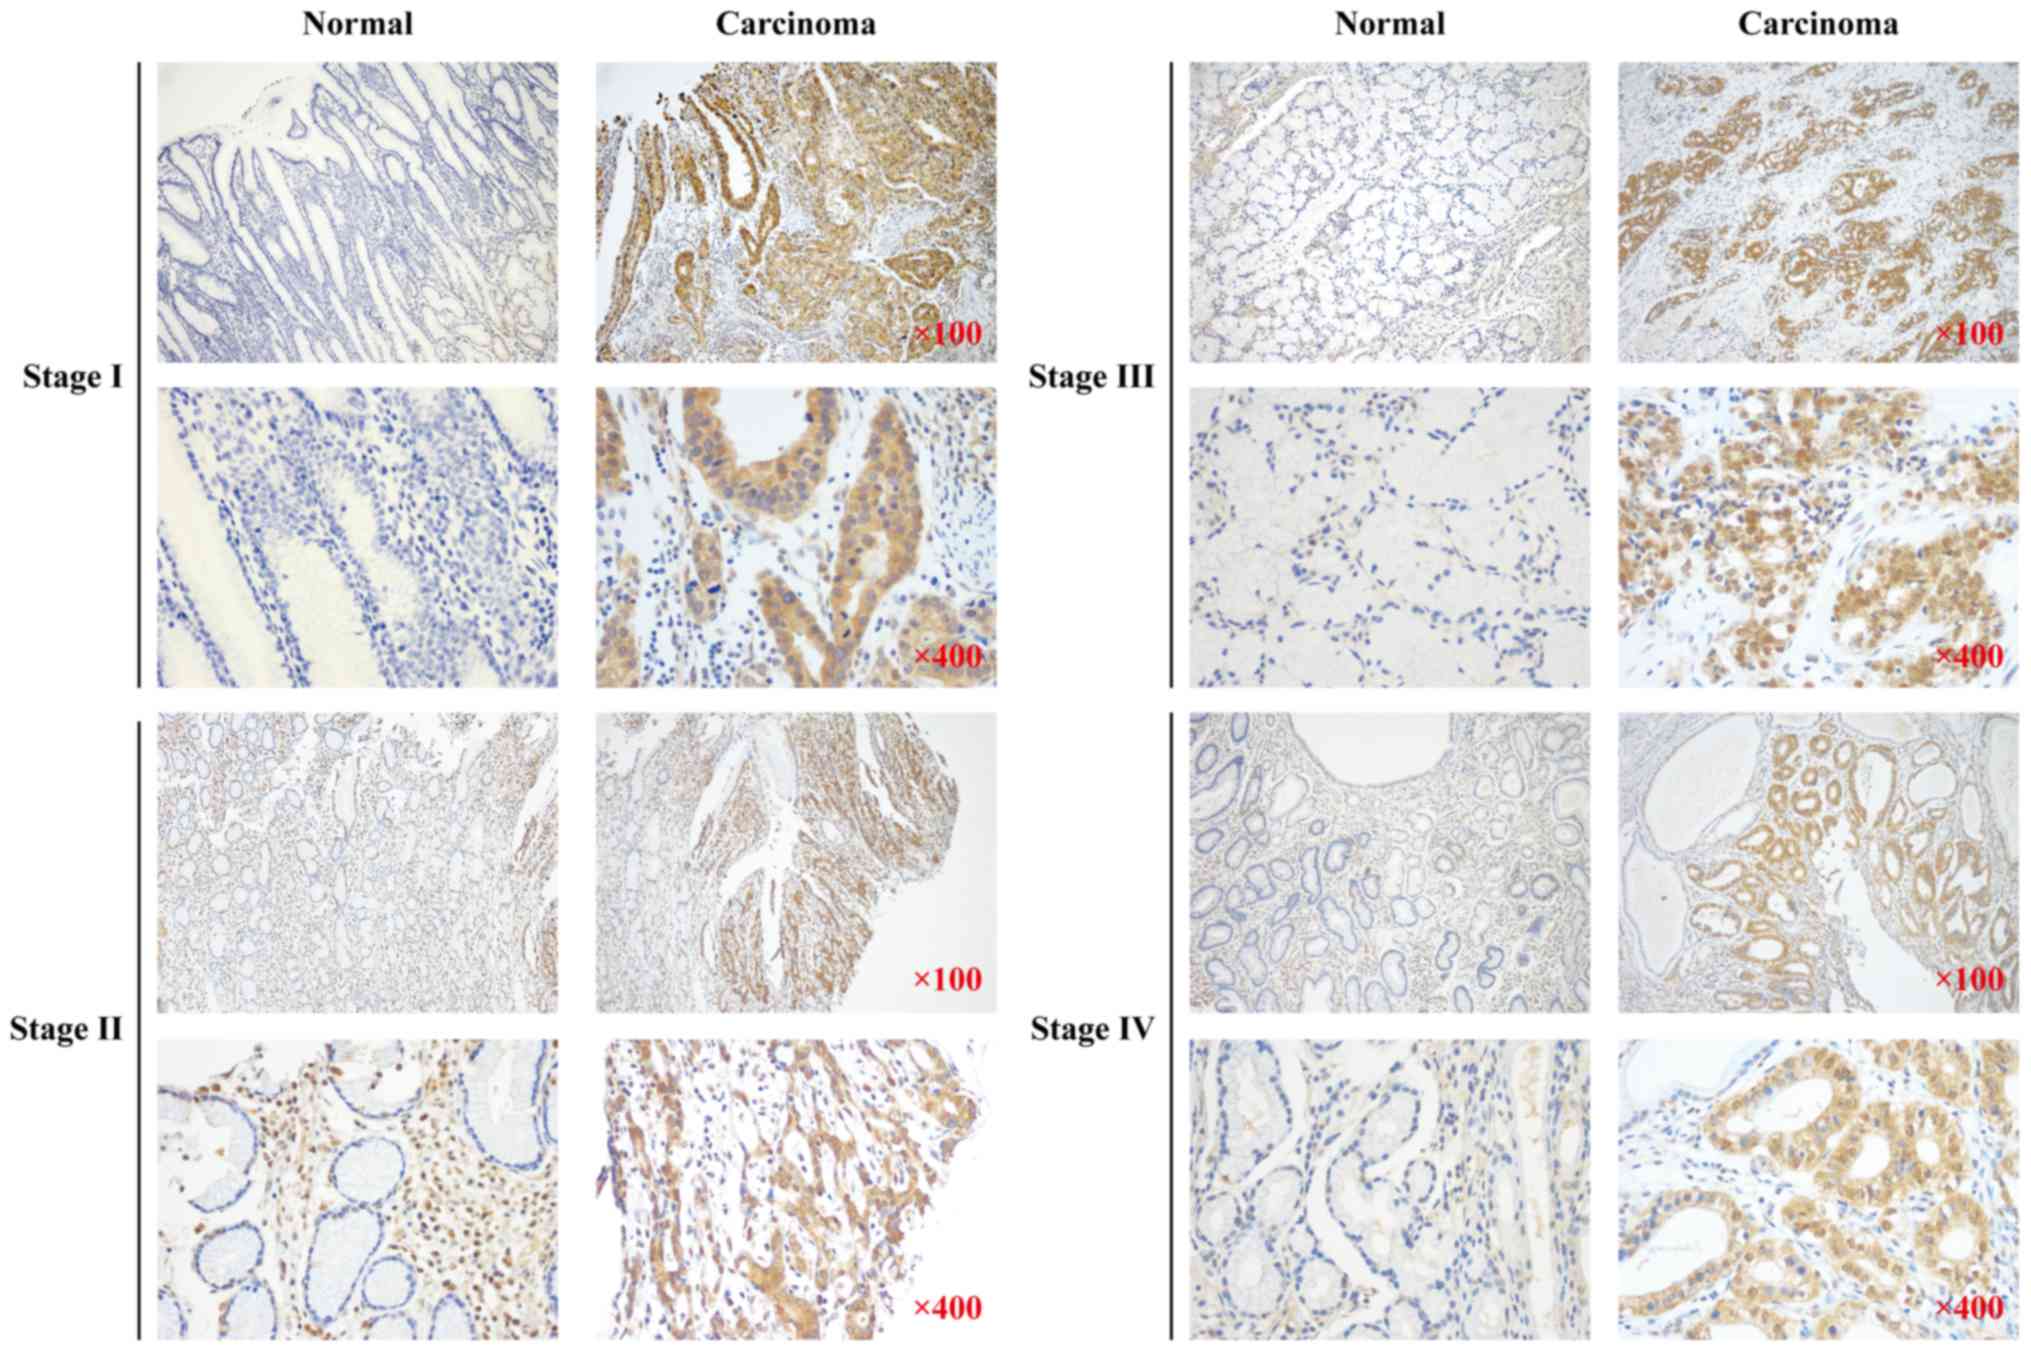
GNAQ expression in GC patient samples
is significantly higher in the regions with carcinoma vs. normal
tissues
To examine GNAQ expression in the surgical tissue of
GC patients, we performed immunohistochemistry (IHC) on surgical
specimens from 280 GC patients with a history of gastrectomy.
Higher expression of the GNAQ protein was observed in the regions
with carcinoma as compared to normal adjacent tissues >5 cm
distance from the tumor tissue (76.4 vs. 50.7%, p<0.001;
Table I). GNAQ overexpression was
observed in all stages (I–IV) of GC and was not significantly
different between the stages (Fig.
1). These data suggest that GNAQ expression is dysregulated in
GC patient samples.
 | Table I.GNAQ expression in surgical specimens
of the gastric cancer patients (n=280). |
Table I.
GNAQ expression in surgical specimens
of the gastric cancer patients (n=280).
|
| GNAQ in normal
tissues |
|
|---|
|
|
|
|
|---|
| Group | (−) | (+) | P-values |
|---|
| GNAQ in carcinoma
tissues |
|
|
|
| (−) | 27 | 39 |
<0.001a |
| (+) | 111 | 103 |
|
| Total | 138 | 142 |
|
GNAQ overexpression is associated with
the age and histological subtype of GC patients
A total of 280 GC patients treated with gastrectomy
were enrolled in this retrospective, pilot cohort study. We
evaluated the clinicopathological features of GC patients according
to the GNAQ expression status in the cancer tissues. No significant
difference was found in gender, stage and tumor location between
patients according to the GNAQ expression status (p=0.256, 0.264
and 0.106, respectively; Table
II), however, the age and histological differentiation were
significantly associated with GNAQ expression. Higher expression
levels of GNAQ were found in the tumor tissues of older patients
(≥60 years) compared with younger patients (<60 years, 88.5 vs.
68.3%, p<0.001; Table II).
Furthermore, GNAQ overexpression was observed in patients with
worse histological characteristics (87.5 vs. 69%, p<0.001;
Table II).
| Table II.Association between patient
characteristics and GNAQ expression in gastric carcinoma tissues
(n=280). |
Table II.
Association between patient
characteristics and GNAQ expression in gastric carcinoma tissues
(n=280).
|
| GNAQ expression in
carcinoma tissues |
|
|---|
|
|
|
|
|---|
| Patient
characteristics | (+), n (%) | (−), n (%) | P-values |
|---|
| Gender |
|
| 0.256 |
| Male | 158 (78.2) | 44 (21.8) |
|
|
Female | 56 (71.8) | 22 (28.2) |
|
| Age, years |
|
|
<0.001b |
|
<60 | 114 (68.3) | 53 (31.7) |
|
|
≥60 | 100 (88.5) | 13 (11.5) |
|
| Stage
(AJCC/UICC) |
|
| 0.264 |
| I,
II | 132 (79.5) | 34 (20.5) |
|
| III,
IV | 82 (71.9) | 32 (28) |
|
| Location |
|
| 0.106 |
|
GEJ | 37 (86) | 6 (14) |
|
|
N-GEJ | 177 (74.7) | 60 (25.3) |
|
|
Differentiation |
|
|
<0.001b |
|
Intermediate | 116 (69) | 52 (31) |
|
|
Poor | 98 (87.5) | 14 (12.5) |
|
| Adjuvant
therapy |
|
|
0.002a |
|
Yes | 84 (67.7) | 40 (32.3) |
|
| No | 126 (83.4) | 25 (16.6) |
|
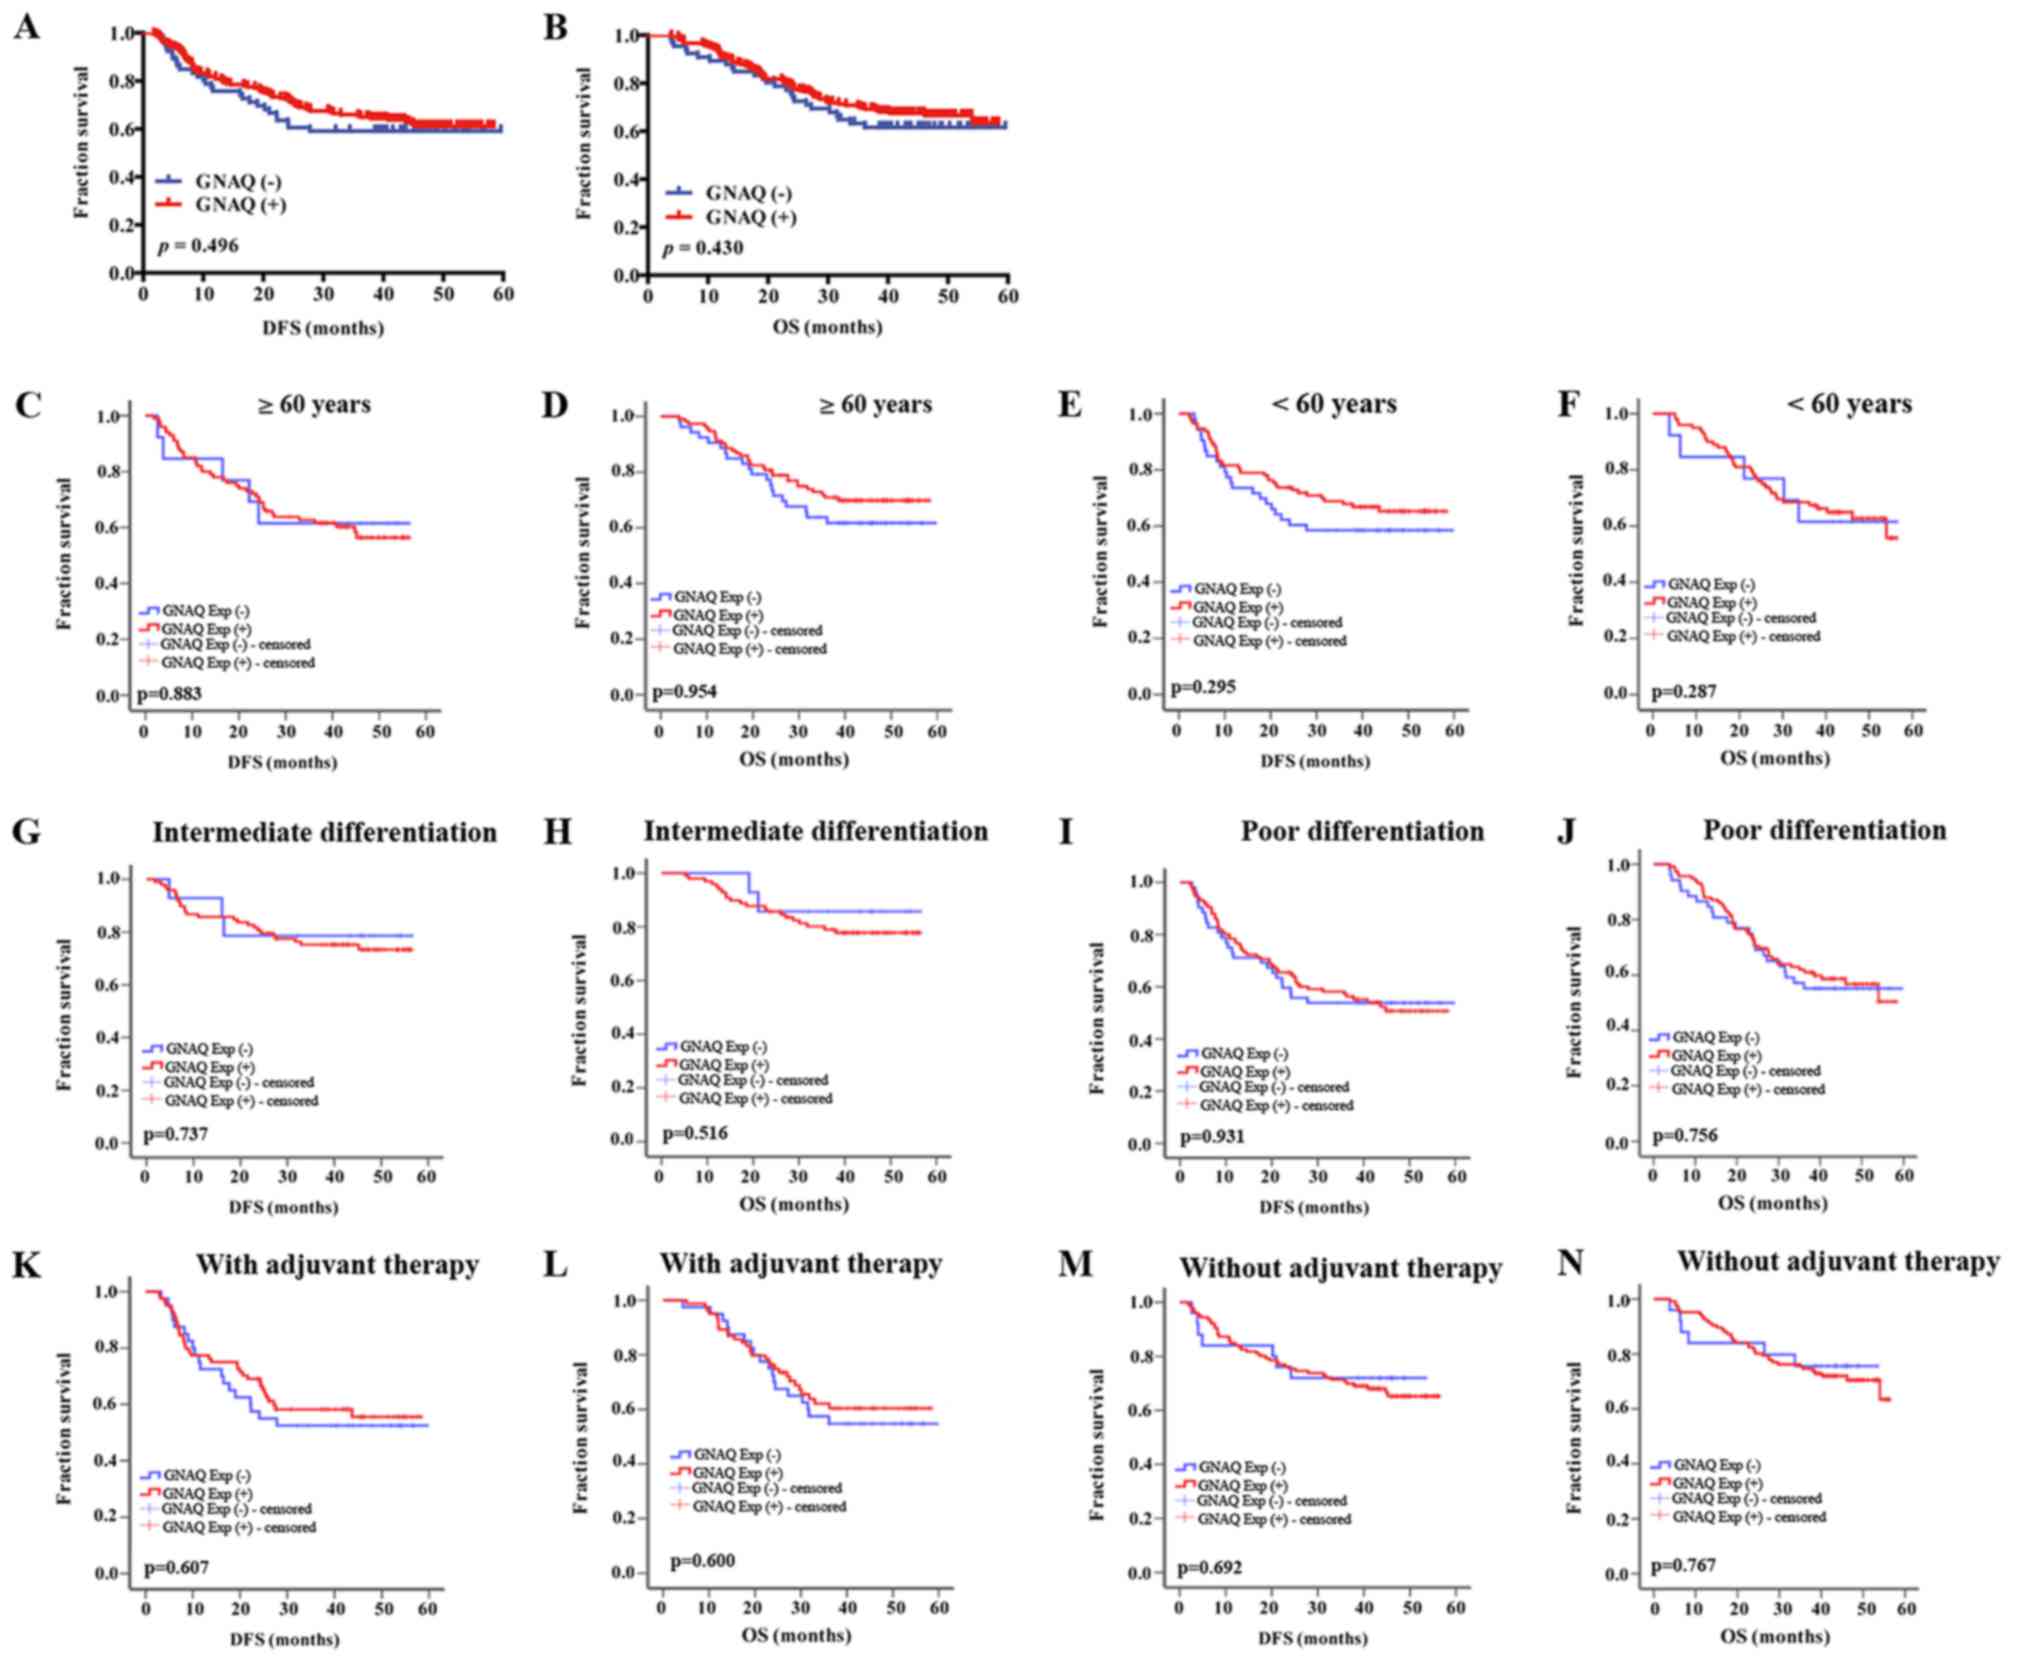
GNAQ expression is not correlated with
clinical outcomes
To estimate the prognostic value of GNAQ
overexpression in cancer tissues, we used Kaplan-Meier survival
analysis to compare clinical outcomes between GNAQ-positive and
-negative patients. All 280 eligible patients were analyzed for DFS
and OS. Median follow-up was 40.2 months (from 3.8 to 59.6 months).
However, no difference was observed in the DFS and OS of GC
patients after gastrectomy between GC patients with GNAQ-positive
and -negative tumors (median DFS, 42.288 vs. 40.308 months,
p=0.496, and median OS, 45.675 vs. 44.076 months, p=0.430,
respectively) (Fig. 2A and B).
Subgroup analysis of the survival time according to age,
histological differentiation and with the application of adjuvant
treatment or without were analyzed in the positive GNAQ expression
group and negative GNAQ expression group (Fig. 2C-N). However, no significant
difference was observed in the survival time between GNAQ-positive
and negative GC patients.
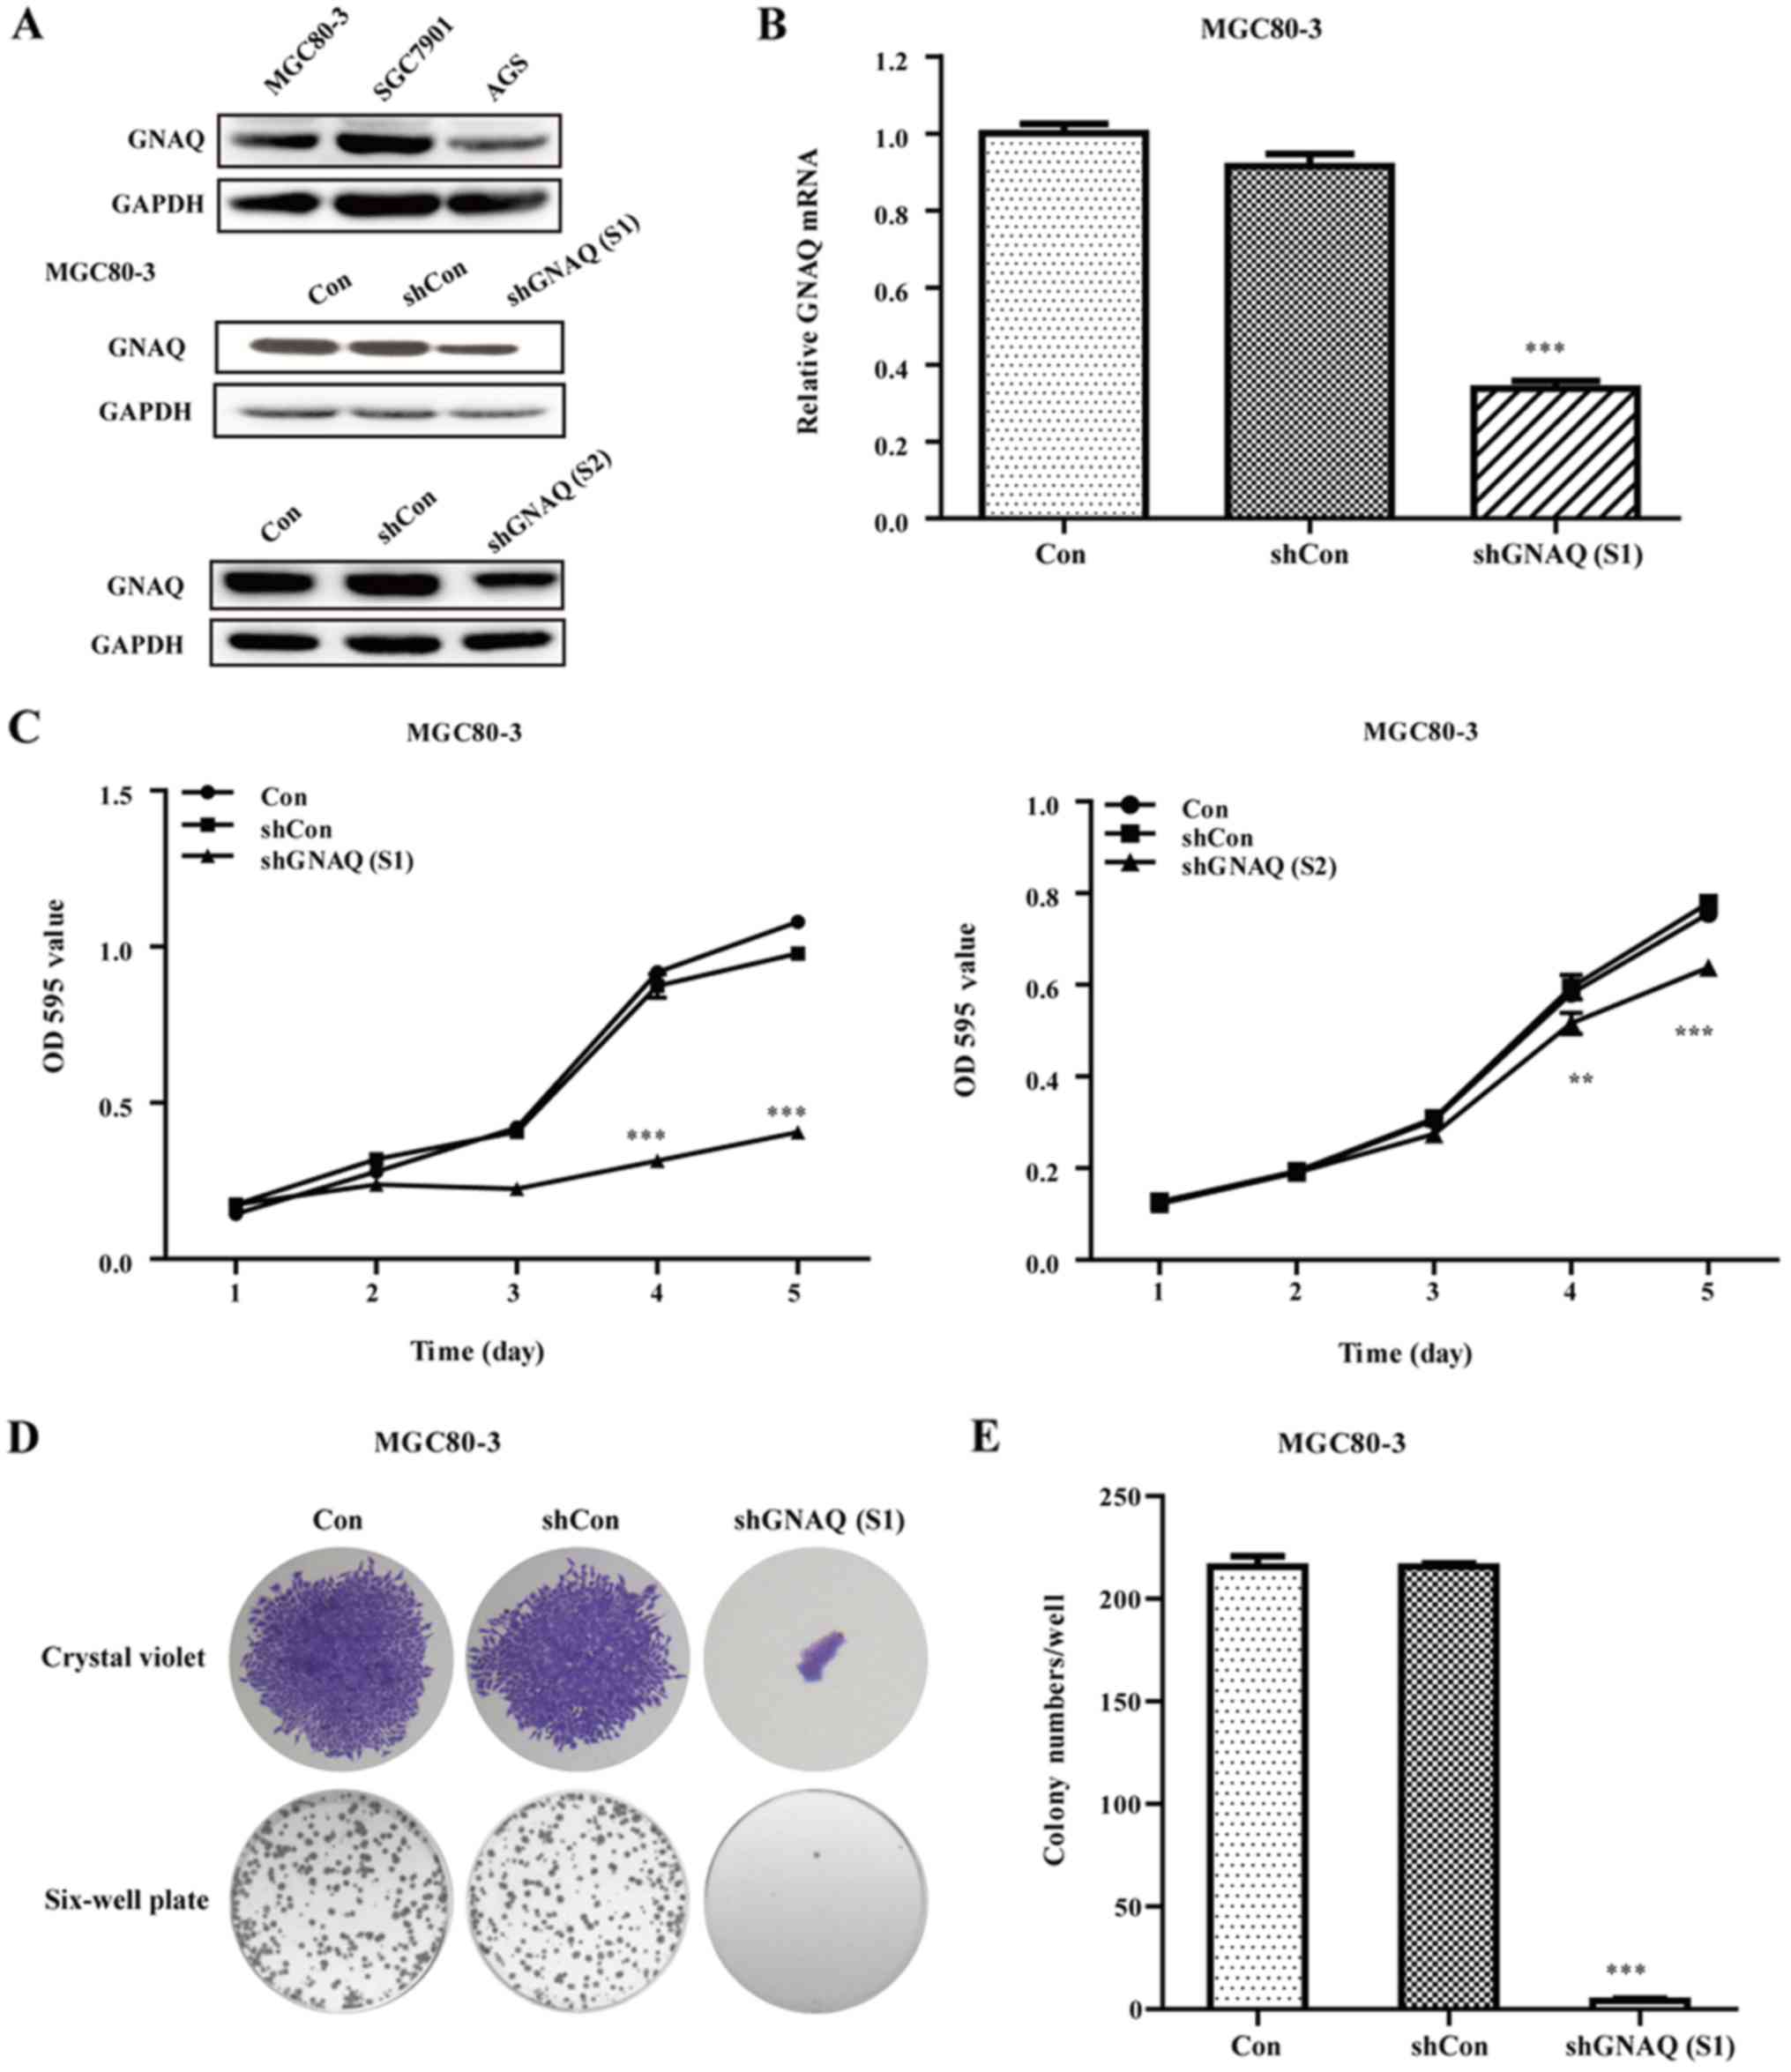
Expression of GNAQ in GC cells
To analyze the expression of GNAQ in different GC
cells, we performed western blotting assay to estimate the
expression in MGC80-3, SGC7901 and AGS cell lines. As shown in
Fig. 3A, The GNAQ expression levels
ranked as SGC7901 > MGC80-3 > AGS.
GNAQ knockdown inhibits cellular
growth and colony formation
To investigate the function of the GNAQ gene in GC,
the lentivirus targeting the GNAQ gene [shGNAQ (S1) group and
shGNAQ (S2) group] and negative control (shCon group) was infected
into MGC80-3 cells. We performed qRT-PCR and western blotting assay
to estimate the GNAQ knockdown efficiency in MGC80-3 cells and
found that both the mRNA and protein levels of GNAQ were
significantly decreased in the shGNAQ group as compared to the
blank control (Con group) and shCon group (p<0.001; Fig. 3A and B). Moreover, the GNAQ protein
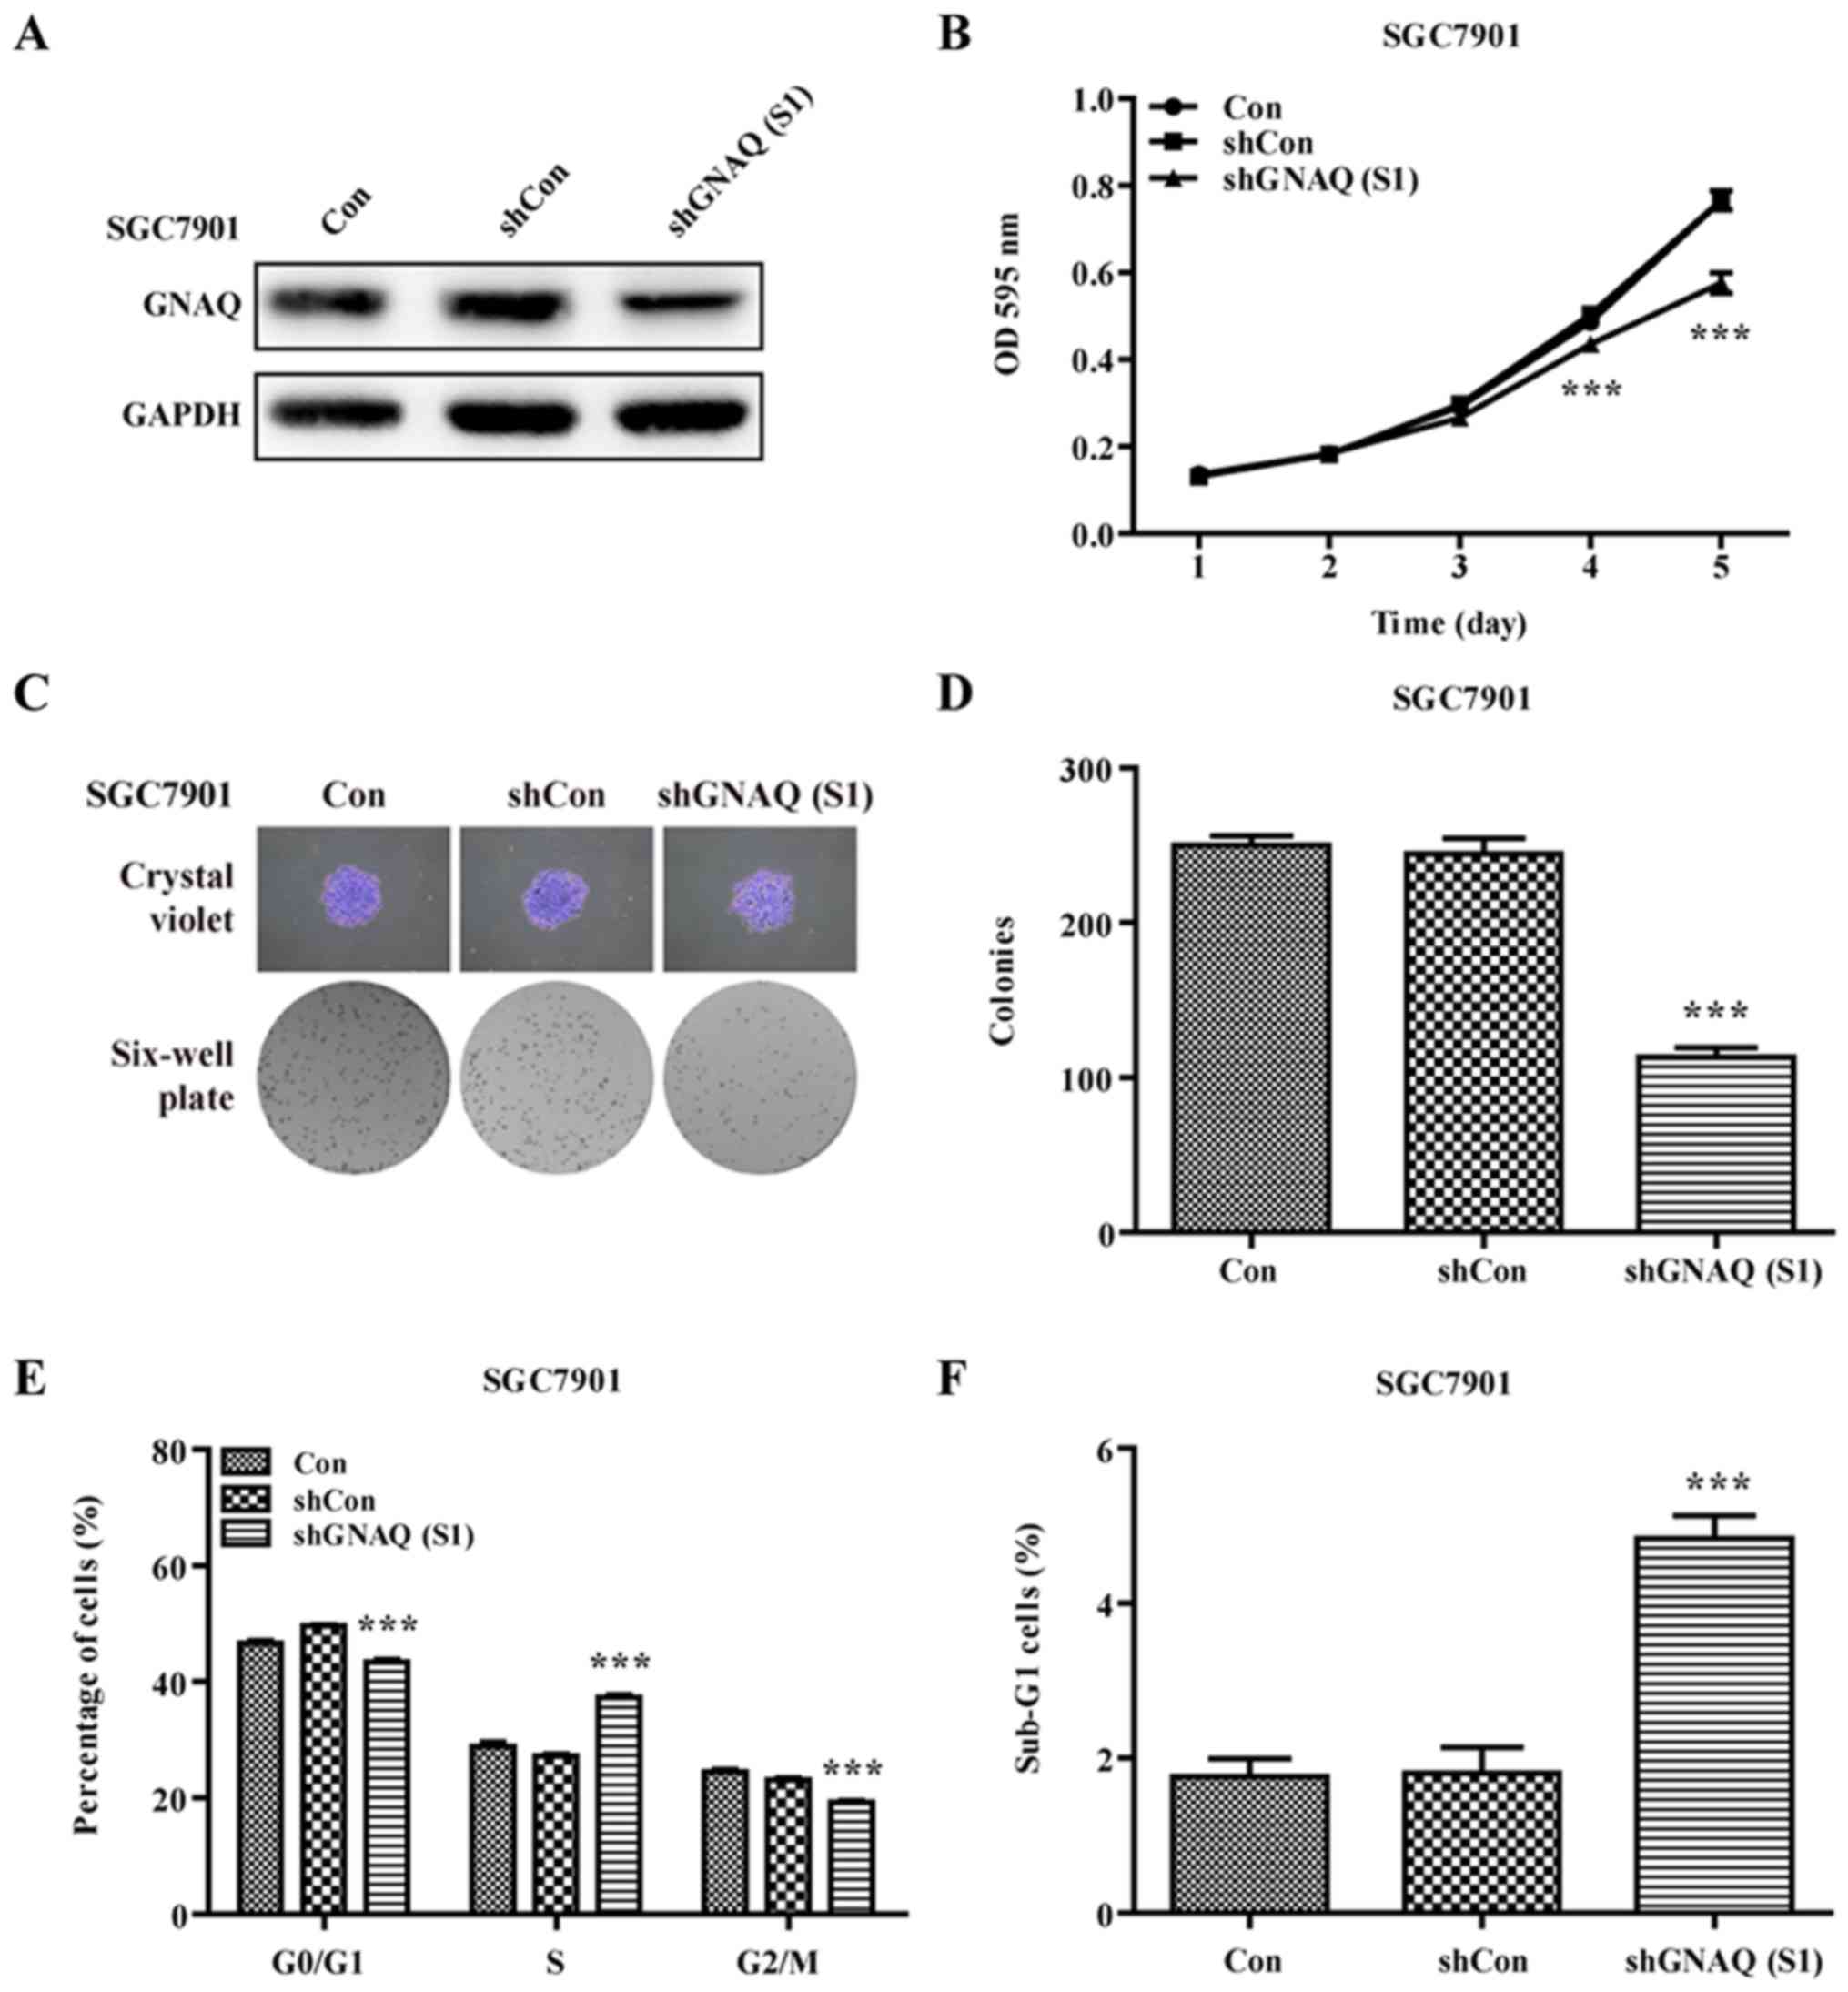
levels in the SGC7901 cells were significantly decreased in the
shGNAQ group compared to the blank control (Con group) and shCon
group (Fig. 4A). Subsequently, MTT
and colony formation assays were further performed to examine the
influence of GNAQ on GC cell growth. As shown in Figs. 3C and 4B, the cellular proliferation in the
shGNAQ group was markedly lower compared with the control groups
(Con and shCon groups) in vitro. Similarly, GNAQ silencing
obviously decreased the colony formation ability of the MGC80-3 and
SGC7901 cells in size and number when compared with the Con and
shCon groups (p<0.001; Fig. 3D and
E) (p<0.001; Fig. 4C and D).
Although, the cellular proliferation as determined by MTT assay in
the shGNAQ (S1) group of the SGC7901 cells was lower compared with
the control groups (Con and shCon groups) in vitro
(p<0.001) it was not as decreased as in the shGNAQ (S1) group of
the MGC80-3 cells. The aforementioned findings indicate that the
GNAQ gene may be involved in the cellular growth of GC.
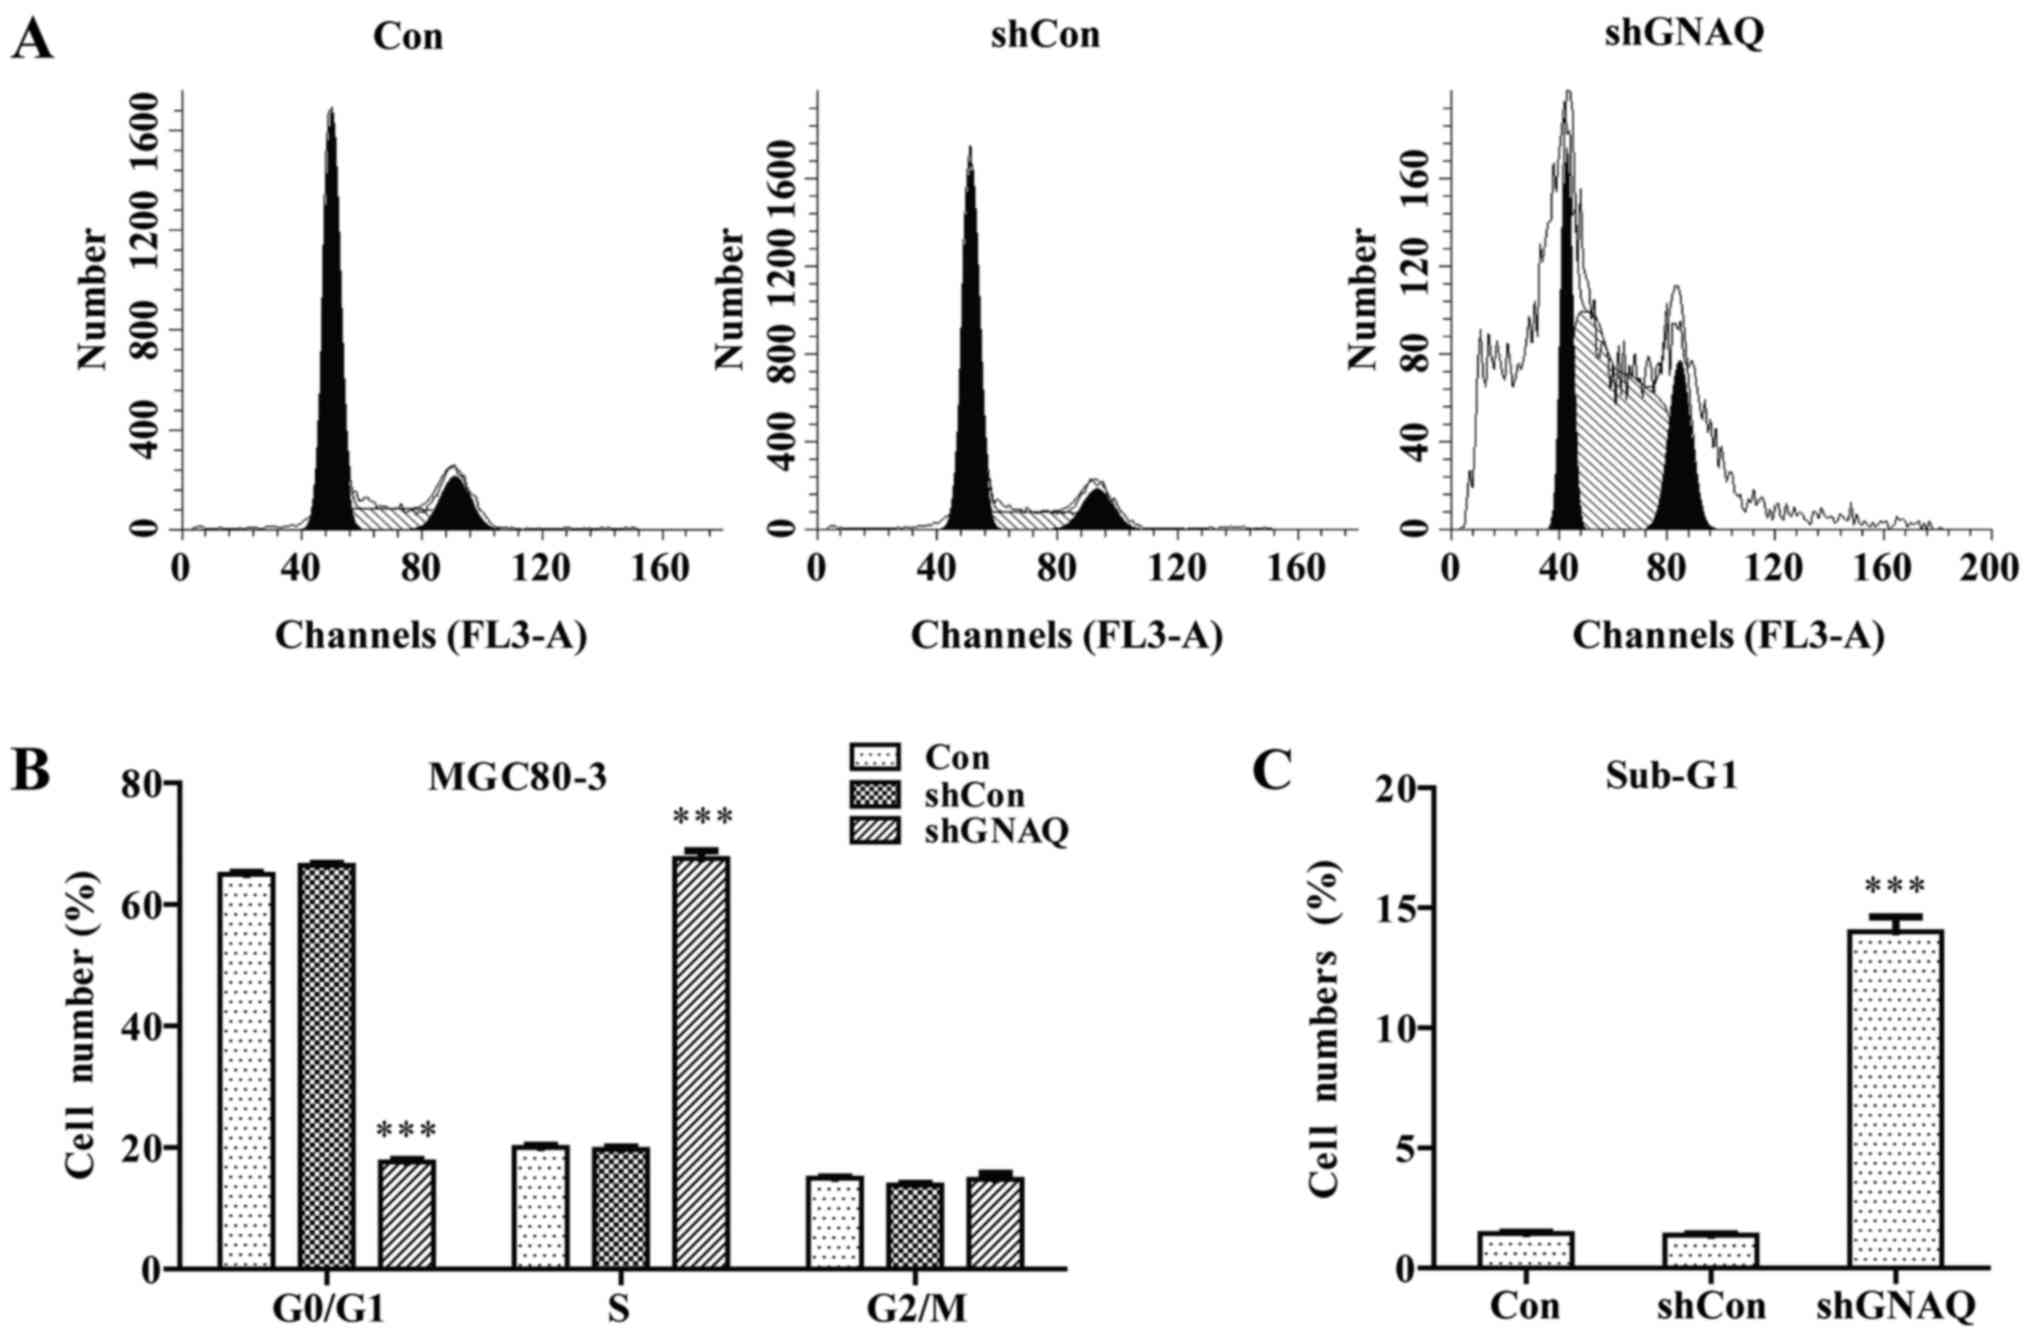
GNAQ knockdown induces GC cell cycle
arrest and promotes apoptosis
To examine the role of GNAQ in GC cell cycle
kinetics, we performed flow cytometry. We found that a
significantly greater percentage of GNAQ-silenced MGC80-3 cells was
observed in the S phase, and cells in the G0/G1 phase presented a
decreased population compared with the control groups (Con and
shCon groups) (p<0.001; Fig. 5A and
B). Moreover, we observed a similar result in the GNAQ-silenced
SGC7901 cells. Cells in the S phase were significantly increased
whereas cells in the G0/G1 phase presented a decreased population
compared with the control groups (Con and shCon groups)
(p<0.001; Fig. 4E). The cell
cycle assay analysis also revealed that knockdown of GNAQ increased
the percentage of sub-G1 cells, indicative of an increase in
apoptosis (Figs. 5C and 4F). Therefore, GNAQ gene silencing in GC
cells led to an S phase arrest and promoted apoptosis.
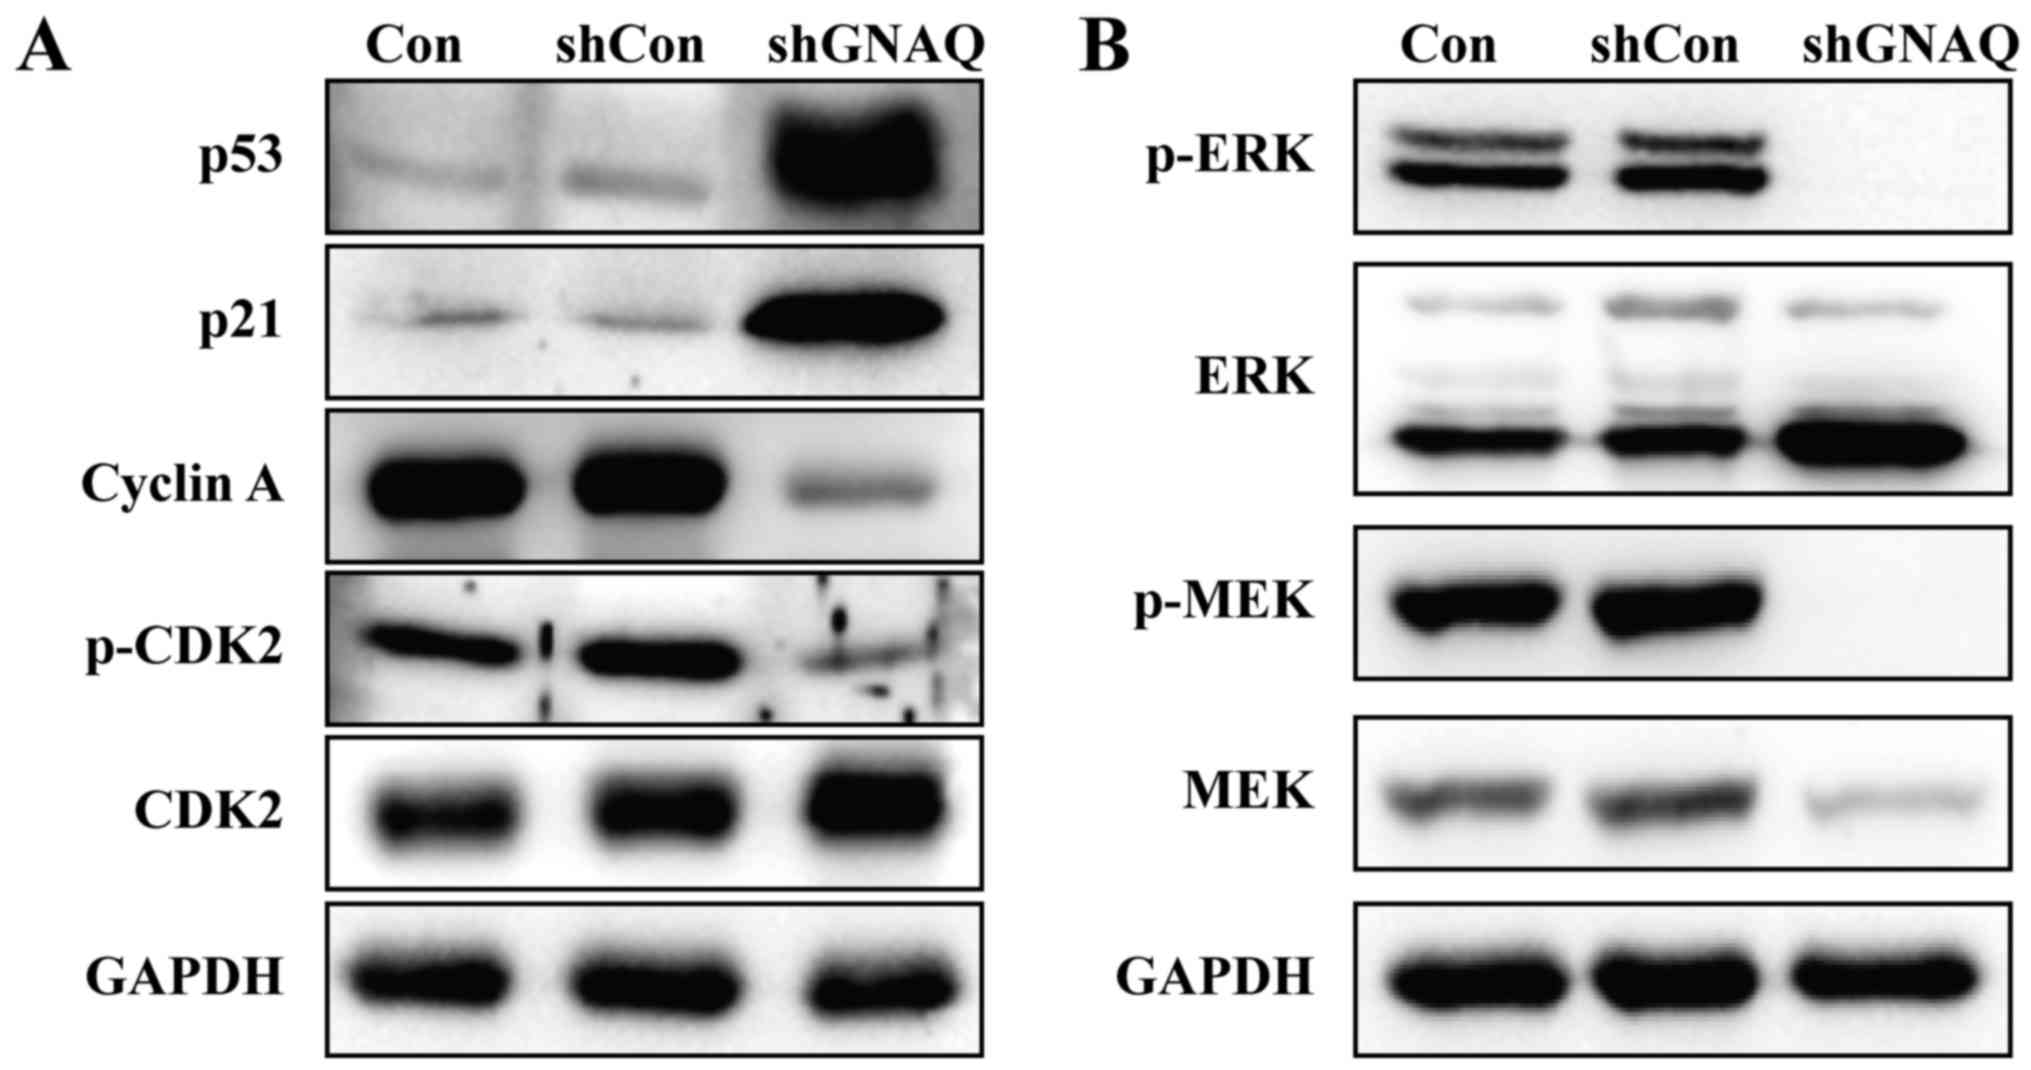
GNAQ knockdown significantly increases
p53 expression and inhibits cell cycle-related proteins
To determine the mechanism by which GNAQ alters the
cell cycle and apoptosis, MGC80-3 cell lysates from different
groups (Con, shCon or shGNAQ group) were used for the immunoblot
analysis of p53, p21, phospho-CDK2 and other cyclin family members.
As shown in Fig. 6A, the expression
of p53 was significantly increased in the shGNAQ group compared
with the Con and shCon groups. Similarly, higher p21 expression was
observed in the knockdown GNAQ cells compared with the controls
(Con and shCon groups). Furthermore, cyclin A and phospho-CDK2 were
decreased in cells infected with shGNAQ compared to the controls
(Fig. 6A). Collectively, these data
suggested that GNAQ directly or indirectly inhibits p53 and several
key regulators of cell cycle signaling.
GNAQ knockdown inhibits MAPK pathway
activity
Mitogen-activated protein kinase (MAPK) signaling
regulates cell proliferation in numerous tumor and normal cells. We
therefore examined the key components of the MAPK pathway by
western blotting assay, and found that knockdown of GNAQ decreased
the phosphorylation of two key signaling proteins along the MAPK
pathway: ERK and MEK (Fig. 6B).
These data indicated that GNAQ expression was required for MEK/ERK
phosphorylation in MGC80-3 cells.
Discussion
G protein-coupled receptor (GPCR) proteins are a
large, diverse family of heterotrimeric transmembrane proteins that
function as signal transducers from the extracellular environment
to the cellular interior. On account of their critical importance
and the variety of GPCR signaling to normal homeostatic function,
it is perhaps not surprising that alterations in the activity of
GPCRs and their downstream effectors are frequently implicated in
the pathogenesis of cancer. Nearly 20% of human tumors are
associated with GPCR aberrancies (14). The GNAQ gene encodes a G protein α
subunit of GPCR and has been identified within chromosomal band
9q21, a region that has been associated with many types of human
cancer. However, its explicit function in human cancer particularly
in gastric cancer (GC) remains largely unclear.
Our findings revealed that GNAQ was overexpressed in
GC patient samples as compared to normal matched tissue.
Furthermore, GNAQ expression was found to be associated with poorly
differentiated GC, suggesting that GNAQ may be a useful biomarker.
We investigated the prognostic value of GNAQ overexpression and
determined that it had no predictive value in patient outcome for
the population we sampled. To conclusively determine the prognostic
value of GNAQ, a larger patient population may be examined and
perhaps additional types of cancer may be investigated in future
studies.
The GNAQ gene encodes a G protein α subunit that has
long been known to activate downstream signaling molecule
phospholipase C (PLC), which cleaves phosphotidylinositol
diphosphate into inositol triphosphate and diacylglycerol (DAG)
(15). Inositol triphosphate and
DAG then signal calcium and protein kinase C (PKC) via
phosphorylation (16).
Phosphorylation of PKC can turn on the mitogen-activated protein
kinase (MAPK) pathway, which consists of a cascade of kinases
including the GTPase Ras, followed by BRAF, MEK and ERK, leading to
activation of various transcription factors involved in normal cell
growth and proliferation (17–20).
Excessive activation of MAPK signaling is the primary driver of
cell cycle dysfunction and unregulated proliferation in most cancer
cells (20–23). Our data demonstrated that GNAQ
regulates GC proliferation, colony formation, the cell cycle, and
either directly or indirectly promotes MEK and ERK phosphorylation.
Notably, in the Catalogue of Somatic Mutations in Cancer (COSMIC)
v69, there is a high prevalence of GNAQ activating mutations in
tumor types known to require the MAPK pathway for pathogenesis
including uveal melanomas (32%), cutaneous melanomas (1.4%) and
colon adenocarcinoma (1.4%). Additionally, a study by Van Raamsdonk
et al identified activating mutations in GNAQ that could
function as oncogenic drivers in models of human uveal melanoma.
Furthermore, knockdown of GNAQ in the melanoma cell lines they
used, resulted in decreased growth and increased apoptosis,
consistent with our findings in GC (24). Ultimately, GNAQ may act as an
oncogene in a broad range of human types of cancer by driving MAPK
signaling.
p53 is the ‘guardian of the genome’ and the most
commonly mutated tumor suppressor in cancer (25). In normal unstressed cells, p53 is
maintained at a low level by its negative regulators, such as MDM2.
In response to a wide variety of stress signals, activated p53
transcriptionally regulates the expression of its target genes to
modulate various cellular processes, including apoptosis and cell
cycle arrest (26). p53 provides a
critical barrier to the development of cancer by blocking
proliferation or eliminating cancer cells. Over the last two
decades, numerous p53-responsive genes have been identified,
including the gene encoding cyclin-dependent kinase inhibitor
p21Waf1 (alternatively p21Cip1), which
mediates cell cycle arrest at the G1/S and G2/M phase (27,28).
CDK2 has high activity during the S phase, which may be due to
cyclin A driving the transition from the S phase to mitosis. We
observed for the first time that GNAQ is involved in the p53
signaling pathway. Suppression of GNAQ expression in GC cells
resulted in increased p53 and p21 expression. The increased
expression of p21 inhibited the activity of the cyclin A/CDK2
complex, slowed down cell proliferation and therefore arrested the
cells at the S phase. These data suggest that GNAQ may mediate its
effects on the cell cycle and apoptosis through p21 via p53
signaling.
Overall we determined that GNAQ regulates GC
proliferation, the cell cycle and apoptosis through a
multifactorial mechanism involving downstream pathways including
MAPK, p53 and CDKs. In precision medicine, whole genome sequencing
data along with related molecular information and individual
clinical data, are often employed for selecting appropriate and
optimal therapies and for the development of targeted drugs in
order to achieve accurate medical care. At present, next generation
sequencing (NGS) technology is being applied in some clinical
studies. GNAQ, as a target, is detected in the serum of GC
patients. The present study indicates that GNAQ is a potential
target for the treatment of GC patients. The GNAQ inhibitor is
expected to be a novel drug for GC patients with activated gene
mutations. These observations provide important insight into the
functional significance of GNAQ overexpression in GC and indicate
that GNAQ may be a novel target for GC treatment.
Acknowledgements
We thank all the individuals who participated in the
present study. We acknowledge Hua He for help in data and
statistical analysis. The principle funding for the present study
was provided by the Key Clinical Project of the Ministry of Health
of the People's Republic of China (2010–2012) (grant no.
2001133).
References
|
1
|
Ferlay J, Soerjomataram I, Dikshit R, Eser
S, Mathers C, Rebelo M, Parkin DM, Forman D and Bray F: Cancer
incidence and mortality worldwide: Sources, methods and major
patterns in GLOBOCAN 2012. Int J Cancer. 136:E359–E386. 2015.
View Article : Google Scholar : PubMed/NCBI
|
|
2
|
Harder J and Opitz OG: Gastric cancer -
risk factors and medical therapy. Praxis. 95:1021–1028. 2006.(In
German). View Article : Google Scholar : PubMed/NCBI
|
|
3
|
Fuchs CS, Tomasek J, Yong CJ, Dumitru F,
Passalacqua R, Goswami C, Safran H, dos Santos LV, Aprile G, Ferry
DR, et al: REGARD Trial Investigators: Ramucirumab monotherapy for
previously treated advanced gastric or gastro-oesophageal junction
adenocarcinoma (REGARD): An international, randomised, multicentre,
placebo-controlled, phase 3 trial. Lancet. 383:31–39. 2014.
View Article : Google Scholar : PubMed/NCBI
|
|
4
|
Ligtenberg MJ, Kuiper RP, Chan TL,
Goossens M, Hebeda KM, Voorendt M, Lee TY, Bodmer D, Hoenselaar E,
Hendriks-Cornelissen SJ, et al: Heritable somatic methylation and
inactivation of MSH2 in families with Lynch syndrome due to
deletion of the 3′ exons of TACSTD1. Nat Genet. 41:112–117.
2009. View
Article : Google Scholar : PubMed/NCBI
|
|
5
|
Bang YJ, Van Cutsem E, Feyereislova A,
Chung HC, Shen L, Sawaki A, Lordick F, Ohtsu A, Omuro Y, Satoh T,
et al: ToGA Trial Investigators: Trastuzumab in combination with
chemotherapy versus chemotherapy alone for treatment of
HER2-positive advanced gastric or gastro-oesophageal junction
cancer (ToGA): A phase 3, open-label, randomised controlled trial.
Lancet. 376:687–697. 2010. View Article : Google Scholar : PubMed/NCBI
|
|
6
|
Roder JD, Böttcher K, Busch R, Wittekind
C, Hermanek P and Siewert JR: German Gastric Cancer Study Group:
Classification of regional lymph node metastasis from gastric
carcinoma. Cancer. 82:621–631. 1998. View Article : Google Scholar : PubMed/NCBI
|
|
7
|
Chen J, Cheong JH, Yun MJ, Kim J, Lim JS,
Hyung WJ and Noh SH: Improvement in preoperative staging of gastric
adenocarcinoma with positron emission tomography. Cancer.
103:2383–2390. 2005. View Article : Google Scholar : PubMed/NCBI
|
|
8
|
O'Hayre M, Vázquez-Prado J, Kufareva I,
Stawiski EW, Handel TM, Seshagiri S and Gutkind JS: The emerging
mutational landscape of G proteins and G-protein-coupled receptors
in cancer. Nat Rev Cancer. 13:412–424. 2013. View Article : Google Scholar : PubMed/NCBI
|
|
9
|
Wang HJ, Zhou M, Jia L, Sun J, Shi HB, Liu
SL and Wang ZZ: Identification of aberrant chromosomal regions in
human breast cancer using gene expression data and related gene
information. Med Sci Monit. 21:2557–2566. 2015. View Article : Google Scholar : PubMed/NCBI
|
|
10
|
Lo FY, Chang JW, Chang IS, Chen YJ, Hsu
HS, Huang SF, Tsai FY, Jiang SS, Kanteti R, Nandi S, et al: The
database of chromosome imbalance regions and genes resided in lung
cancer from Asian and Caucasian identified by array-comparative
genomic hybridization. BMC Cancer. 12:2352012. View Article : Google Scholar : PubMed/NCBI
|
|
11
|
Cannon-Albright LA, Teerlink CC, Farnham
JM, Thomas AW, Zone JJ and Leachman SA: Linkage analysis of
extended high-risk pedigrees replicates a cutaneous malignant
melanoma predisposition locus on chromosome 9q21. J Invest
Dermatol. 133:128–134. 2013. View Article : Google Scholar : PubMed/NCBI
|
|
12
|
Koh Y, Park I, Sun CH, Lee S, Yun H, Park
CK, Park SH, Park JK and Lee SH: Detection of a distinctive genomic
signature in rhabdoid glioblastoma, a rare disease entity
identified by whole exome sequencing and whole transcriptome
sequencing. Transl Oncol. 8:279–287. 2015. View Article : Google Scholar : PubMed/NCBI
|
|
13
|
Vaqué JP, Dorsam RT, Feng X,
Iglesias-Bartolome R, Forsthoefel DJ, Chen Q, Debant A, Seeger MA,
Ksander BR, Teramoto H, et al: A genome-wide RNAi screen reveals a
Trio-regulated Rho GTPase circuitry transducing mitogenic signals
initiated by G protein-coupled receptors. Mol Cell. 49:94–108.
2013. View Article : Google Scholar : PubMed/NCBI
|
|
14
|
Van Raamsdonk CD, Griewank KG, Crosby MB,
Garrido MC, Vemula S, Wiesner T, Obenauf AC, Wackernagel W, Green
G, Bouvier N, et al: Mutations in GNA11 in uveal melanoma. N
Engl J Med. 363:2191–2199. 2010. View Article : Google Scholar : PubMed/NCBI
|
|
15
|
Lee CH, Park D, Wu D, Rhee SG and Simon
MI: Members of the Gq α subunit gene family
activate phospholipase C β isozymes. J Biol Chem. 267:16044–16047.
1992.PubMed/NCBI
|
|
16
|
Rozengurt E: Mitogenic signaling pathways
induced by G protein-coupled receptors. J Cell Physiol.
213:589–602. 2007. View Article : Google Scholar : PubMed/NCBI
|
|
17
|
Cobb MH and Goldsmith EJ: How MAP kinases
are regulated. J Biol Chem. 270:14843–14846. 1995. View Article : Google Scholar : PubMed/NCBI
|
|
18
|
Karin M: The regulation of AP-1 activity
by mitogen-activated protein kinases. J Biol Chem. 270:16483–16486.
1995. View Article : Google Scholar : PubMed/NCBI
|
|
19
|
Dhawan P and Richmond A: A novel NF-kappa
B-inducing kinase-MAPK signaling pathway up-regulates NF-kappa B
activity in melanoma cells. J Biol Chem. 277:7920–7928. 2002.
View Article : Google Scholar : PubMed/NCBI
|
|
20
|
Kortylewski M, Heinrich PC, Kauffmann ME,
Böhm M, MacKiewicz A and Behrmann I: Mitogen-activated protein
kinases control p27/Kip1 expression and growth of human melanoma
cells. Biochem J. 357:297–303. 2001. View Article : Google Scholar : PubMed/NCBI
|
|
21
|
Roberts PJ and Der CJ: Targeting the
Raf-MEK-ERK mitogen-activated protein kinase cascade for the
treatment of cancer. Oncogene. 26:3291–3310. 2007. View Article : Google Scholar : PubMed/NCBI
|
|
22
|
Weber JD, Raben DM, Phillips PJ and
Baldassare JJ: Sustained activation of
extracellular-signal-regulated kinase 1 (ERK1) is required for the
continued expression of cyclin D1 in G1 phase. Biochem J.
326:61–68. 1997. View Article : Google Scholar : PubMed/NCBI
|
|
23
|
Schwartz MA and Assoian RK: Integrins and
cell proliferation: Regulation of cyclin-dependent kinases via
cytoplasmic signaling pathways. J Cell Sci. 114:2553–2560.
2001.PubMed/NCBI
|
|
24
|
Van Raamsdonk CD, Bezrookove V, Green G,
Bauer J, Gaugler L, O'Brien JM, Simpson EM, Barsh GS and Bastian
BC: Frequent somatic mutations of GNAQ in uveal melanoma and
blue naevi. Nature. 457:599–602. 2009. View Article : Google Scholar : PubMed/NCBI
|
|
25
|
Lane DP: Cancer. p53, guardian of the
genome. Nature. 358:15–16. 1992. View
Article : Google Scholar : PubMed/NCBI
|
|
26
|
Liu J, Zhang C and Feng Z: Tumor
suppressor p53 and its gain-of-function mutants in cancer. Acta
Biochim Biophys Sin. 46:170–179. 2014. View Article : Google Scholar : PubMed/NCBI
|
|
27
|
Riley T, Sontag E, Chen P and Levine A:
Transcriptional control of human p53-regulated genes. Nat Rev Mol
Cell Biol. 9:402–412. 2008. View
Article : Google Scholar : PubMed/NCBI
|
|
28
|
Mirza A, Wu Q, Wang L, McClanahan T,
Bishop WR, Gheyas F, Ding W, Hutchins B, Hockenberry T, Kirschmeier
P, et al: Global transcriptional program of p53 target genes during
the process of apoptosis and cell cycle progression. Oncogene.
22:3645–3654. 2003. View Article : Google Scholar : PubMed/NCBI
|