Introduction
Pancreatic cancer is the fourth most common cause of
global cancer-related deaths (1)
There were ~44,000 newly diagnosed cases of pancreatic cancer and
more than 37,000 related deaths in 2012 in the US (2). In addition, the average 5-year
survival rate is ~7.7% based on the data from 2006 to 2012
(3). Pancreatic ductal
adenocarcinoma (PDAC), the most common histological subtype,
comprises 90% of all pancreatic cancer cases (4). PDAC always displays local invasion and
distant metastasis during early stages leading to poor prognosis
with an overall 5-year survival rate of only 5% (5). World Health Organization (WHO) and
Surveillance, Epidemiology and End Results (SEER) mortality data
indicate that the occurrence of PDAC increases with age (~71 years)
(6). In addition, researchers have
shown that various risk factors can contribute to the development
of PDAC. In Italy, PDAC risk was found to be 4.3-fold higher in
heavy smokers (>20 cigarettes/day) compared with never smokers
(7). In addition, alcohol intake
was found to be associated with PDAC mortality based on data from
the Cancer Prevention Study II. The results show evidence that
alcohol consumption promotes PDAC mortality (8).
To explore the molecular mechanism of PDAC, numerous
studies have been carried out using advanced microarray or
next-generation sequencing technology. Previous studies based on
microarrays have identified several genes that play an important
role in PDAC. GNAI2, G protein subunit αi2, was found to be
significantly upregulated in PDAC, and can mediate the functions of
dopamine receptor D2 (DRD2) on cAMP signaling. Knockdown or
inhibition of DRD2 was found to reduce the proliferation of
PDAC cells (9). Teodorczyk at
al revealed that CD95 is associated with stemness and
epithelial-mesenchymal transition (EMT) in PDAC based on an in
silico analysis of 36 RNA profiles (10). An in vitro experiment
demonstrated that PDAC growth and metastasis can be significantly
reduced by pharmacological inhibition of CD95 activity, and
Sck is necessary for the CD95 induction of cell cycle
progression (10). In addition,
expression levels of microRNAs and lncRNAs were also explored in
PDAC, and several markers have been identified including miR-10b,
miR-155, miR-106b (11) and lncRNA
AFAP1-AS1 (12). Recently,
whole-exome sequencing of 109 micro-dissected PDAC samples
identified multiple novel mutated genes in PDAC such as
RBM10, KRAS, BRAF and high-frequency
alterations in Wnt signaling, chromatin remodelling and cell cycle
pathways (13).
Research has been carried out to explore the
molecular mechanisms of PDAC based on microarray expression
profiles or next-generation sequencing. However, studies with the
integration of mRNA and miRNA expression profiles have not been
widely applied in PDAC. In recent years, more and more microarray
expression datasets have been submitted to the Gene Expression
Omnibus (GEO) database, and re-analysis of the deposited datasets
with various bioinformatics algorithms can be helpful (14). In the present study, we firstly
identified the common differentially expressed genes (DEGs) in PDAC
based on 2 mRNA expression profiles from 2 independent
laboratories. Then functional annotation of the common DEGs based
on Gene Ontology (GO) and Kyoto Encyclopedia of Genes and Genomes
(KEGG) pathway databases was carried out. Furthermore, an
interaction network between the identified DEGs and documented
miRNAs was constructed. Finally, the identified DEGs were virtually
validated using SurvExpress online database.
Materials and methods
Acquisition of mRNA and miRNA
expression profiles
In the present study, publicly available datasets
from Expression Omnibus Database (GEO) (http://www.ncbi.nlm.nih.gov/geo/)were used. Firstly,
we carefully searched the GEO database, and downloaded 2 mRNA
expression profiles. GSE71989 submitted by Thomas Schmittgen in
2015 (https://www.ncbi.nlm.nih.gov/geo/query/acc.cgi?acc=GSE71989)
consists of 14 PDAC and 8 normal pancreas tissues. The other
dataset GSE32676 submitted by Tran in 2011 (15) consists of 25 PDAC and 7 normal
pancreas tissues. Based on the instruction from manufacturer, RNAs
were extracted and hybridized to Affymetrix Human Genome U133 Plus
2.0 array. Detailed sample information and experiment designs were
documented in the previous studies.
Differentially expressed gene
screening
Data analysis was carried out using in-house R
script and publicly available annotation database. In brief, mRNA
expression values were firstly subject to background correction,
normalization and log2 transformation using GeneChip
Robust Multi-array Analysis (GC-RMA) algorithm (16). Furthermore, uninformative control
probe sets were filtered out. In addition, the average expression
value was calculated for the genes with multiple probes. Finally,
DEGs were screened using Linear Models for Microarray Data (Limma)
package (17) within the
bioconductor. The criteria were set to adjust p-value ≤0.05 and
|log2 fold-change (FC)| ≥2. In addition, the common DEGs
between the 2 datasets were identified based on a Venn diagram. The
common DEGs were used to construct a heat map using Heatmap.2
method within ggplot package (18).
GO and KEGG pathway annotation
The functions of the identified DEGs were further
annotated using GO and KEGG pathway databases using the online
tools of Database for Annotation, Visualization and Integrated
Discovery (DAVID) (19). The GO
term consist of biological process (BP), cellular component (CC)
and molecular function (MF). The criterion was set to
p<0.05.
mRNA-miRNA interaction network
Numerous studies show that miRNAs play an important
role in the regulation of carcinogenesis, malignant transformation
and metastatic processes by preventing mRNA expression or via other
processes (20). Cote et al
(11) showed that 5 miRNAs,
miR-10b-5p, miR-155-5p, miR-106b-5p, miR-30c-5p and miR-212-3p,
have excellent performance to distinguish PDAC from normal samples.
In addition, the sensitivity and specificity were 96 and 100%,
respectively, in the training and validation cohorts. In the
present study, we constructed the mRNA-miRNA interaction network
based on the common DEGs and the 5 miRNAs. In brief, target genes
of the 5 miRNAs were predicted based on the microCosm, mirTarbase
and TargetScan databases. Then, the intersection between the common
DEGs and the target genes were selected. Finally, the interaction
network was constructed using CyTargetLinker (21) plugin in Cytoscape (22).
Virtual validation of the common
DEGs
Clinical outcomes of the DEGs are critical for the
diagnosis or treatment of PDAC. In the present study, virtual
validation of the DEGs was carried out using SurvExpress online
tool (23). This tool is based on a
cancer-wide gene expression database with clinical outcomes. Four
datasets were used for the virtual validation including GSE21501,
GSE28735, TCGA PDAC and ICGC PDAC. Detailed information for the
datasets can be found in previous studies. Parameter setting were
carefully selected according to the developer's instructions.
Results
DEGs in PDAC
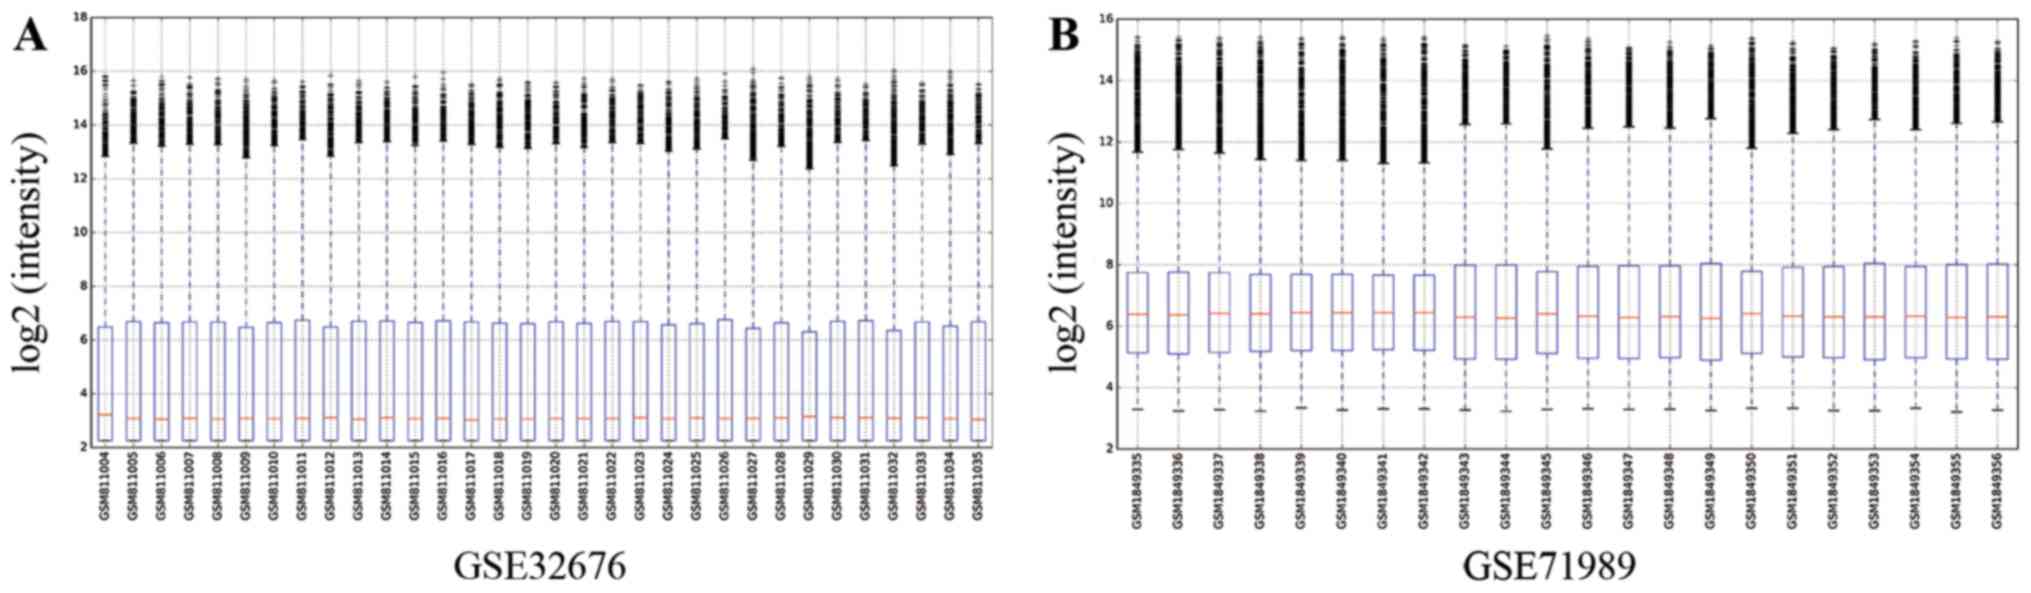
After background correction and normalization, the
gene expression median values for different samples in the 2
datasets were almost at the same level (Fig. 1). Then, the datasets were subjected
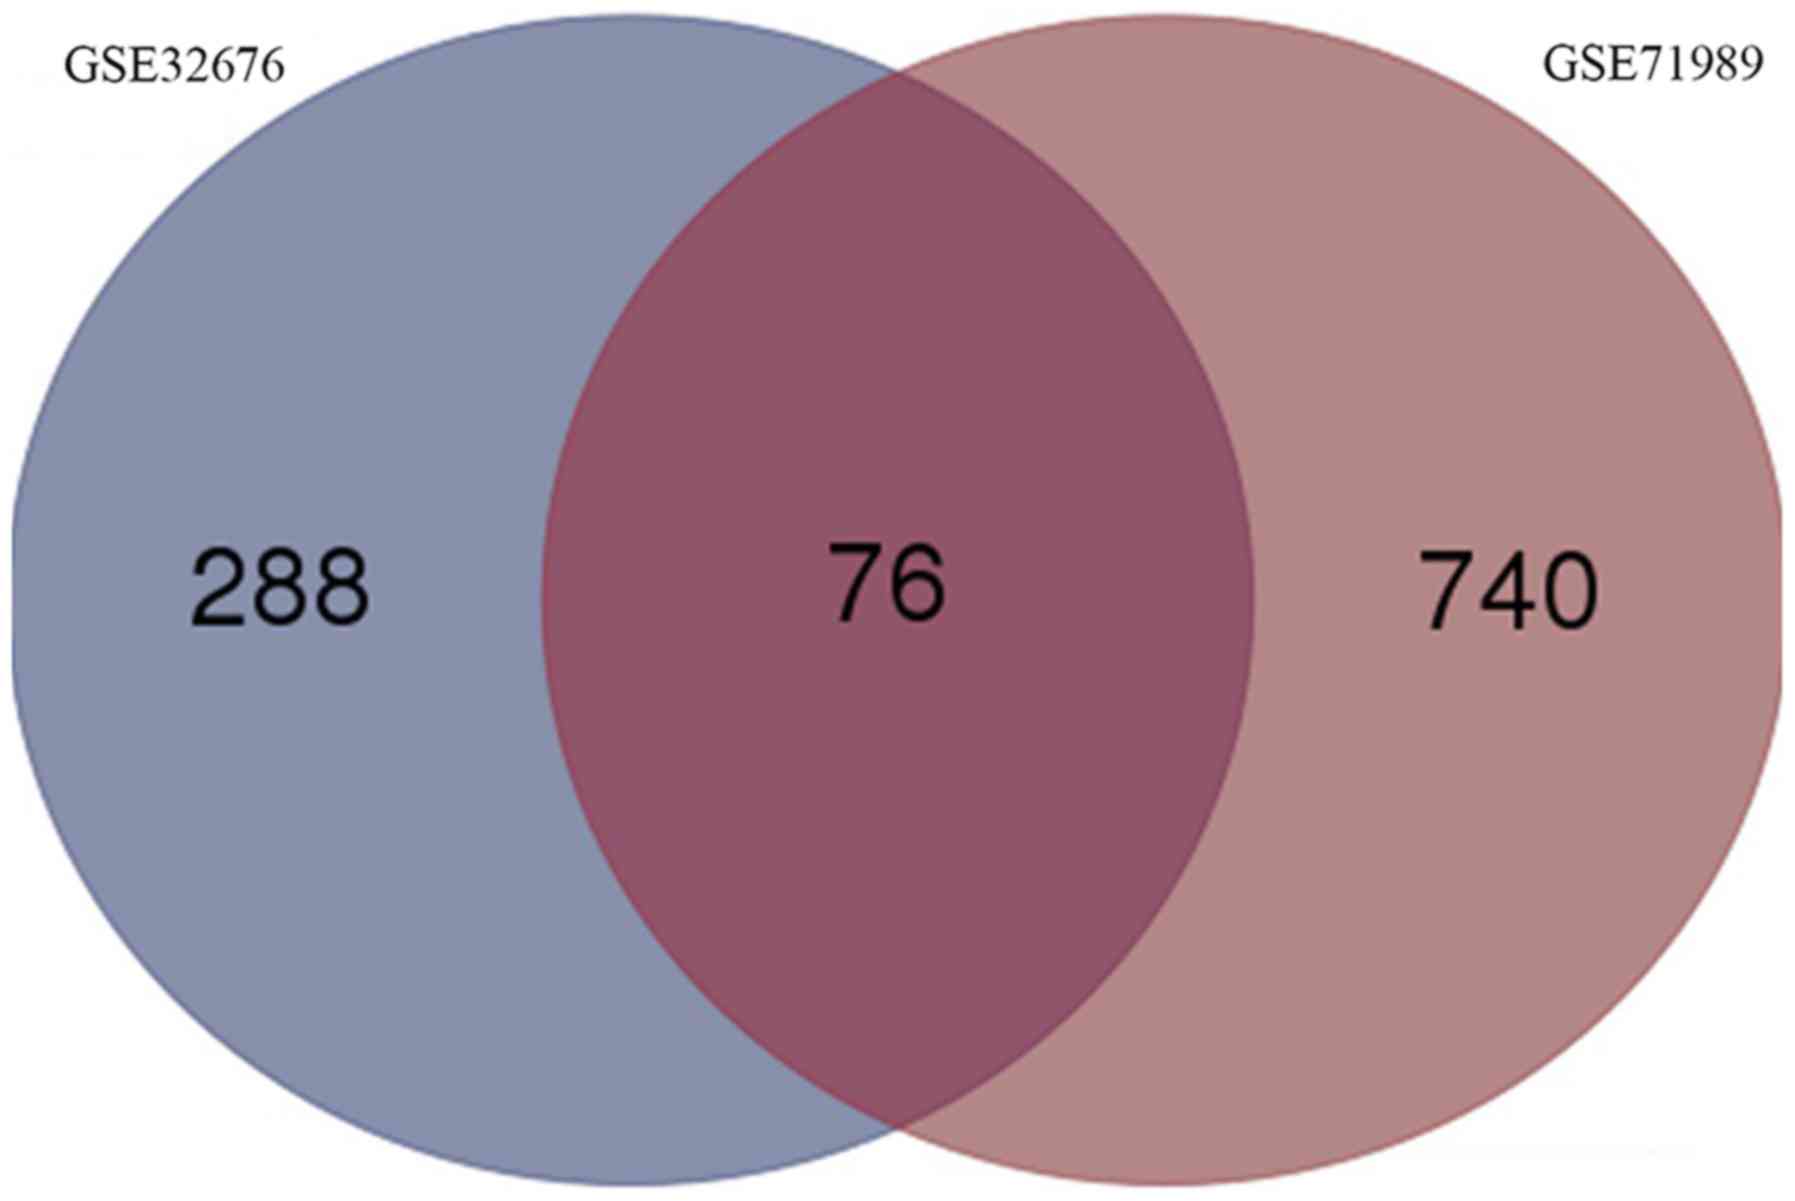
to DEG analysis. Results showed that a total of 364 and 816 DEGs
were screened out for GSE32676 and GSE71989, respectively. For
GSE32676, 292 genes (80.2%) were upregulated and 72 genes (19.8%)
were downregulated. For GSE71989, 666 genes (81.6%) were
upregulated and 150 genes (18.4%) were downregulated. Among those
DEGs, 76 genes were differentially expressed in both GSE32676 and
GSE71989 (Fig. 2). Fold-changes for
the common DEGs are listed in Table
I.
 | Table I.The identified 76 common DEGs in
GSE32676 and GSE71989. |
Table I.
The identified 76 common DEGs in
GSE32676 and GSE71989.
|
| Fold-change |
| Fold-change |
|---|
|
|
|
|
|
|---|
| Gene | GSE32676 | GSE71989 | Gene | GSE32676 | GSE71989 |
|---|
| CCL2 | −3.71 | 2.77 | LAMA3 | 3.75 | 2.80 |
| TMC5 | 3.33 | 2.93 | NR4A2 | −2.28 | 2.50 |
| GJB2 | 4.54 | 2.58 | HOXB3 | 2.08 | 2.09 |
| DPCR1 | 4.23 | 2.29 | EFNA5 | 2.12 | 2.16 |
| MMP11 | 2.88 | 2.92 | ANLN | 2.39 | 2.08 |
| CCL8 | −3.23 | 2.12 | CTSE | 5.12 | 3.49 |
| LCN2 | 4.59 | 2.18 | ANO1 | 2.83 | 2.80 |
| ZWINT | 2.30 | 2.12 | MTUS2 | −2.32 | −2.39 |
| IFI27 | 2.10 | 3.37 | TSPAN1 | 4.41 | 2.18 |
| MMP19 | −3.00 | 2.39 |
C15orf48 | 3.77 | 2.57 |
| NQO1 | 3.09 | 3.41 | MMP28 | 3.06 | 2.26 |
| SLC6A14 | 5.88 | 3.34 |
C19orf33 | 5.67 | 2.99 |
|
ADAMTS12 | 2.69 | 2.41 | LAMC2 | 2.25 | 2.37 |
| RRM2 | 2.40 | 2.38 | VILL | 2.98 | 2.10 |
| SFTA2 | 4.14 | 2.27 |
SERPINB5 | 5.62 | 2.29 |
| PTGDS | −2.79 | 2.17 | CAMK2N1 | 2.08 | 2.47 |
| LAMB3 | 4.87 | 2.48 |
ST6GALNAC1 | 3.75 | 2.61 |
| GPRC5A | 3.14 | 3.46 | ETV1 | 2.18 | 2.38 |
| PHLDA2 | 3.04 | 3.40 | DCBLD1 | 2.26 | 2.40 |
| PPP1R1A | −2.42 | −2.03 | CST1 | 4.90 | 2.25 |
| OAS1 | 2.51 | 2.10 | GCNT3 | 3.93 | 2.38 |
| ECT2 | 2.40 | 3.04 | SOCS3 | −2.43 | 3.25 |
| SDR16C5 | 4.78 | 3.21 | MUC4 | 4.30 | 2.44 |
|
LOC100505984 | 4.96 | 3.34 | SDC1 | 2.68 | 2.36 |
| MALL | 2.13 | 2.34 | EPPK1 | 3.54 | 2.31 |
| THBS1 | −3.11 | 2.60 | AGR2 | 3.96 | 2.45 |
| CEACAM1 | 3.47 | 2.08 | AGR3 | 3.76 | 3.11 |
| CLDN23 | 3.21 | 2.21 | SFN | 2.64 | 3.75 |
| KLF5 | 3.09 | 2.09 | CDK1 | 2.60 | 2.21 |
| CEACAM5 | 6.81 | 3.96 | OGN | −3.20 | 2.42 |
| ITGA2 | 3.33 | 2.65 | AOC1 | 3.76 | 2.44 |
| CEACAM6 | 5.85 | 4.22 | EMP1 | −2.63 | 3.38 |
| KRT17 | 4.01 | 3.00 | S100P | 6.75 | 4.78 |
| S100A6 | 3.11 | 2.92 | AHNAK2 | 3.76 | 2.55 |
| FOSB | −3.97 | 3.40 | MSLN | 6.44 | 3.48 |
| TFF1 | 5.06 | 2.92 | CAPN8 | 5.28 | 2.99 |
| TOP2A | 2.76 | 3.21 | KRT19 | 6.22 | 3.93 |
| LY6E | 2.16 | 2.37 | CH25H | −2.42 | 2.06 |
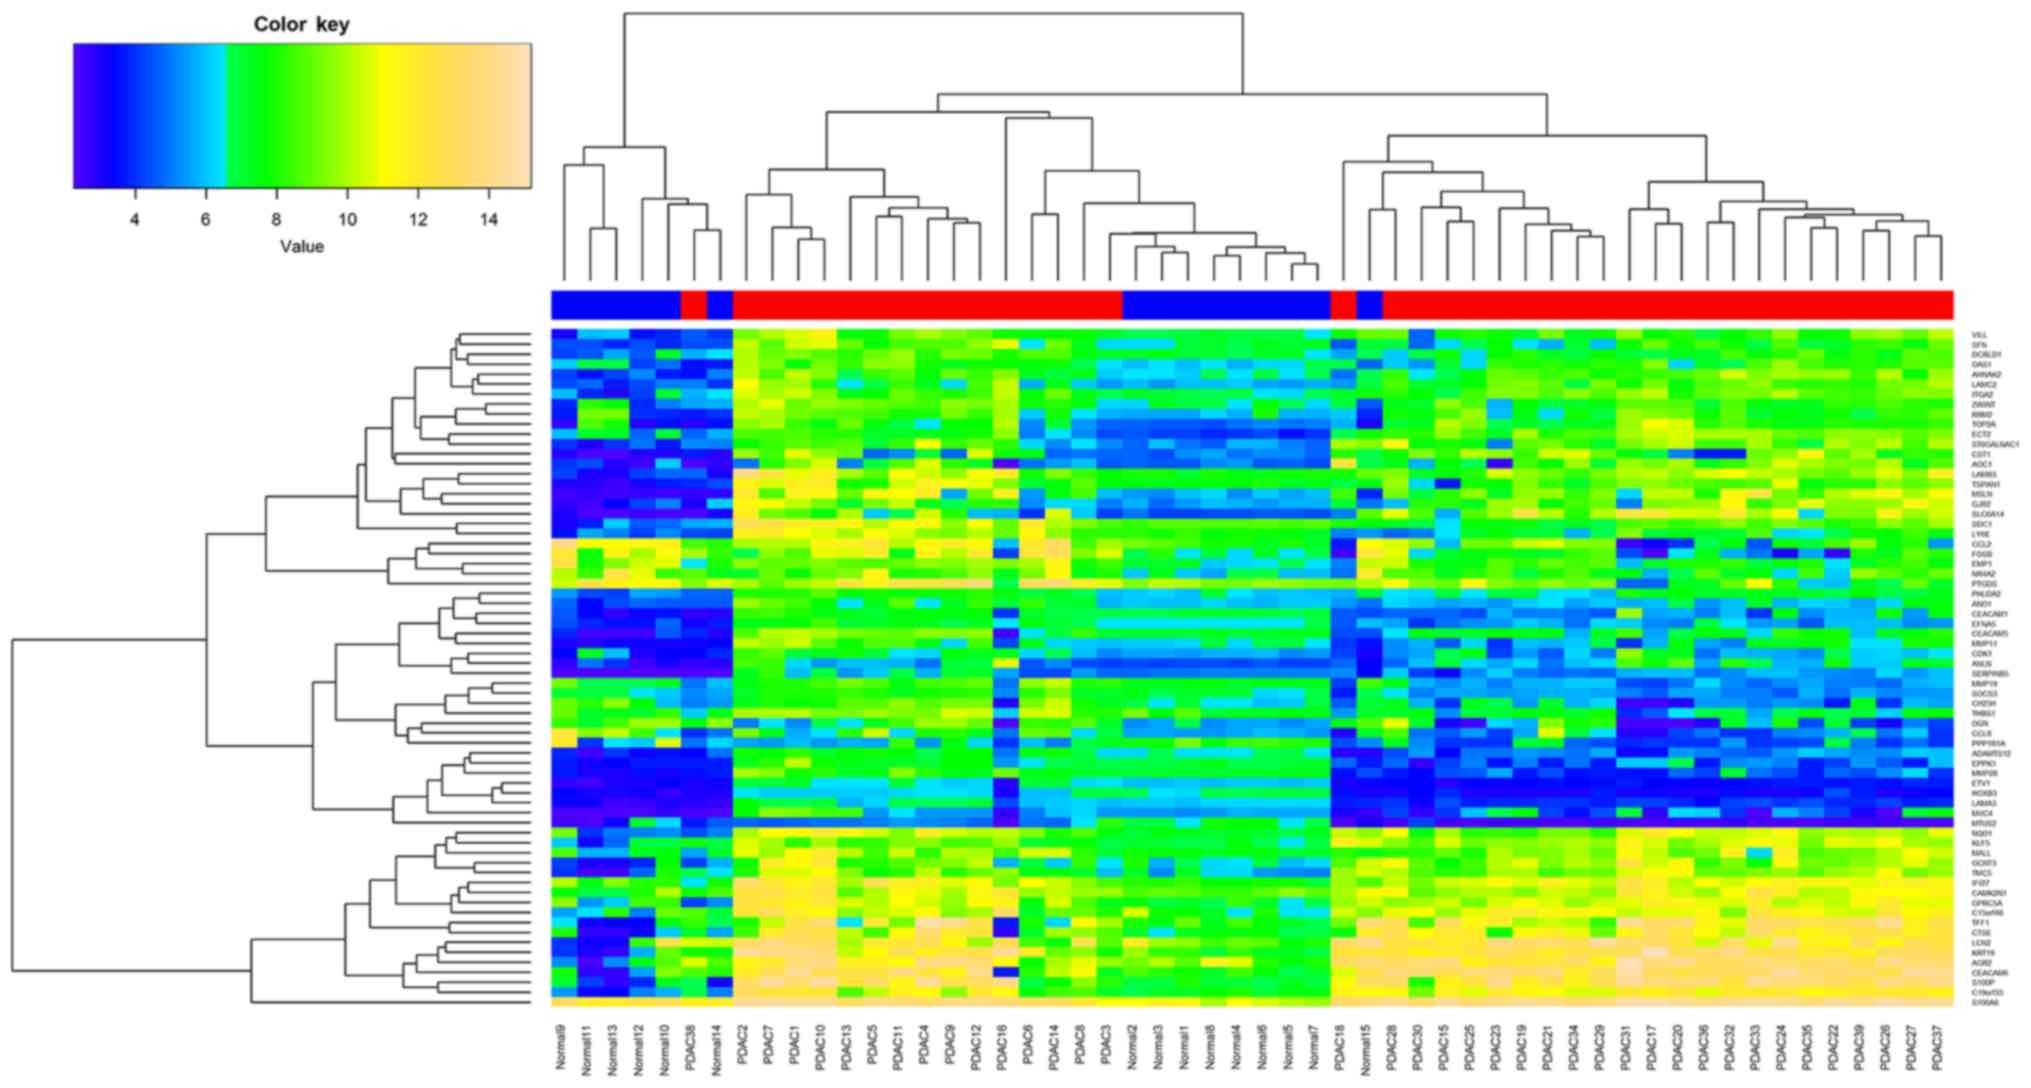
Furthermore, all samples from the 2 datasets were
subjected to hierarchical clustering analysis based on the common
DEGs. As shown in Fig. 3, tumor
(red) and normal (blue) samples were abe to be clearly classified
into different subgroups. Due to tumor heterogeneity and expression
value variation, a few normal and tumor samples were erroneously
classified.
GO and KEGG pathway annotation
In order to explore the biological functions of the
common DEGs, functional annotation of the common DEGs was carried
out using DAVID online tool based on GO and KEGG pathway databases.
Results showed that the common DEGs can be significantly enriched
into 4 KEGG pathways (Table II).
Six genes participated in the ECM-receptor interaction pathway
(p=0.000013), 5 genes were involved in the p53 signaling pathway
(p=0.00012), 4 genes mapped to small cell lung cancer (p=0.0040)
and 5 genes play a role in the pathway of focal adhesion
(p=0.0069). In addition, the common DEGs were mainly related to the
biological process of epidermis development (p=0.0001), ectoderm
development (p=0.0002) and cell adhesion (p=0.0008) (Table III). In addition, the top 5
cellular components include extracellular matrix (p=0.0),
extracellular region (p=0.0), extracellular region part (p=0.0),
proteinaceous extracellular matrix (p=0.0002) and anchored to
membrane (p=0.023) (Table III).
In addition, 5 significant molecular function were enriched for the
common DEGs including structural molecule (p=0.0035), enzyme
inhibitor (p=0.0044), heparin binding (p=0.0081),
metalloendopeptidase (p=0.0083) and protein kinase inhibitor
activities (p=0.0091) (Table
III).
| Table II.KEGG pathway enrichment result for
the common DEGs. |
Table II.
KEGG pathway enrichment result for
the common DEGs.
| Term | Genes | P-value |
|---|
|
hsa04512:ECM-receptor interaction | LAMB3,
SDC1, LAMA3, ITGA2, LAMC2,
THBS1 | 1.39E-05 |
| hsa04115:p53
signaling pathway | CDK1,
SERPINB5, RRM2, SFN, THBS1 | 1.21E-04 |
| hsa05222:Small cell
lung cancer | LAMB3,
LAMA3, ITGA2, LAMC2 | 0.0040471 |
| hsa04510:Focal
adhesion | LAMB3,
LAMA3, ITGA2, LAMC2, THBS1 | 0.0069739 |
| Table III.Top 5 GO terms for the common
DEGs. |
Table III.
Top 5 GO terms for the common
DEGs.
| ID | GO term | P-values | Genes |
|---|
| BP |
|
GO:0008544 | Epidermis
development | 0.0001 | LAMB3,
LAMA3, KRT17, AHNAK2, LAMC2,
SFN, EMP1 |
|
GO:0007398 | Ectoderm
development | 0.0002 | LAMB3,
LAMA3, KRT17, AHNAK2, LAMC2,
SFN, EMP1 |
|
GO:0007155 | Cell adhesion | 0.0008 | DCBLD1,
LAMB3, LAMA3, CCL2, MSLN, ITGA2,
LAMC2, THBS1, CEACAM1, CLDN23,
MUC4 |
|
GO:0022610 | Biological
adhesion | 0.0008 | DCBLD1,
LAMB3, LAMA3, CCL2, MSLN, ITGA2,
LAMC2, THBS1, CEACAM1, CLDN23,
MUC4 |
|
GO:0048545 | Response to steroid
hormone stimulus | 0.0015 | KRT19,
SDC1, CCL2, SOCS3, TFF1,
THBS1 |
| CC |
|
GO:0031012 | Extracellular
matrix | 0.0000 | OGN,
LAMB3, LAMA3, MMP19, LAMC2,
MMP28, ADAMTS12, THBS1, MMP11,
MUC4 |
|
GO:0005576 | Extracellular
region | 0.0000 | CCL2,
MMP19, CCL8, CST1, MMP28, SFN,
MUC4, MMP11, LCN2, OGN, LAMB3,
LAMA3, PTGDS, SERPINB5, MSLN,
SFTA2, LAMC2, EFNA5, ADAMTS12,
TFF1, AGR3, THBS1, AGR2,
CEACAM1 |
|
GO:0044421 | Extracellular
region part | 0.0000 | CCL2,
MMP19, CCL8, MMP28, SFN, MMP11,
MUC4, OGN LAMB3, LAMA3, SERPINB5,
LAMC2, EFNA5, TFF1, ADAMTS12, THBS1 |
|
GO:0005578 | Proteinaceous
extracellular matrix | 0.0002 | OGN,
LAMB3, LAMA3, MMP19, LAMC2,
MMP28, ADAMTS12, MMP11, MUC4 |
|
GO:0031225 | Anchored to
membrane | 0.0231 | LY6E,
MSLN, CEACAM6, CEACAM5, EFNA5 |
| MF |
|
GO:0005198 | Structural molecule
activity | 0.0035 | KRT19,
LAMB3, LAMA3, EPPK1, KRT17,
THBS1, VILL, CLDN23, MUC4 |
|
GO:0004857 | Enzyme inhibitor
activity | 0.0044 | SERPINB5,
SOCS3, PPP1R1A, CST1, SFN,
CAMK2N1 |
|
GO:0008201 | Heparin
binding | 0.0081 | CCL2,
CCL8, LAMC2, THBS1 |
|
GO:0004222 |
Metalloendopeptidase activity | 0.0083 | MMP19,
MMP28, ADAMTS12, MMP11 |
|
GO:0004860 | Protein kinase
inhibitor activity | 0.0091 | SOCS3,
SFN, CAMK2N1 |
mRNA-miRNA network construction
To explore mRNA and miRNA regulation mechanism, the
mRNA-miRNA pairings were constructed. The results indicated that
the 5 miRNAs were able to target 3,760, 827 and 3,671 genes in the
MicroCosm, mirTarbase and TargetScan database, respectively. Among
those, 22 genes were also identified in the common DEGs. Then, the
interaction network between the 22 genes and 5 miRNAs were
constructed (Fig. 4). Based on the
figure, we found that hsa-miR-212-3p can regulate 6 genes,
hsa-miR-106p-5p can regulate 5 genes, hsa-miR-155-5p can regulate 5
genes, hsa-miR-10b-5p can regulate 5 genes and hsa-miR-30c-5p can
regulate 6 genes.
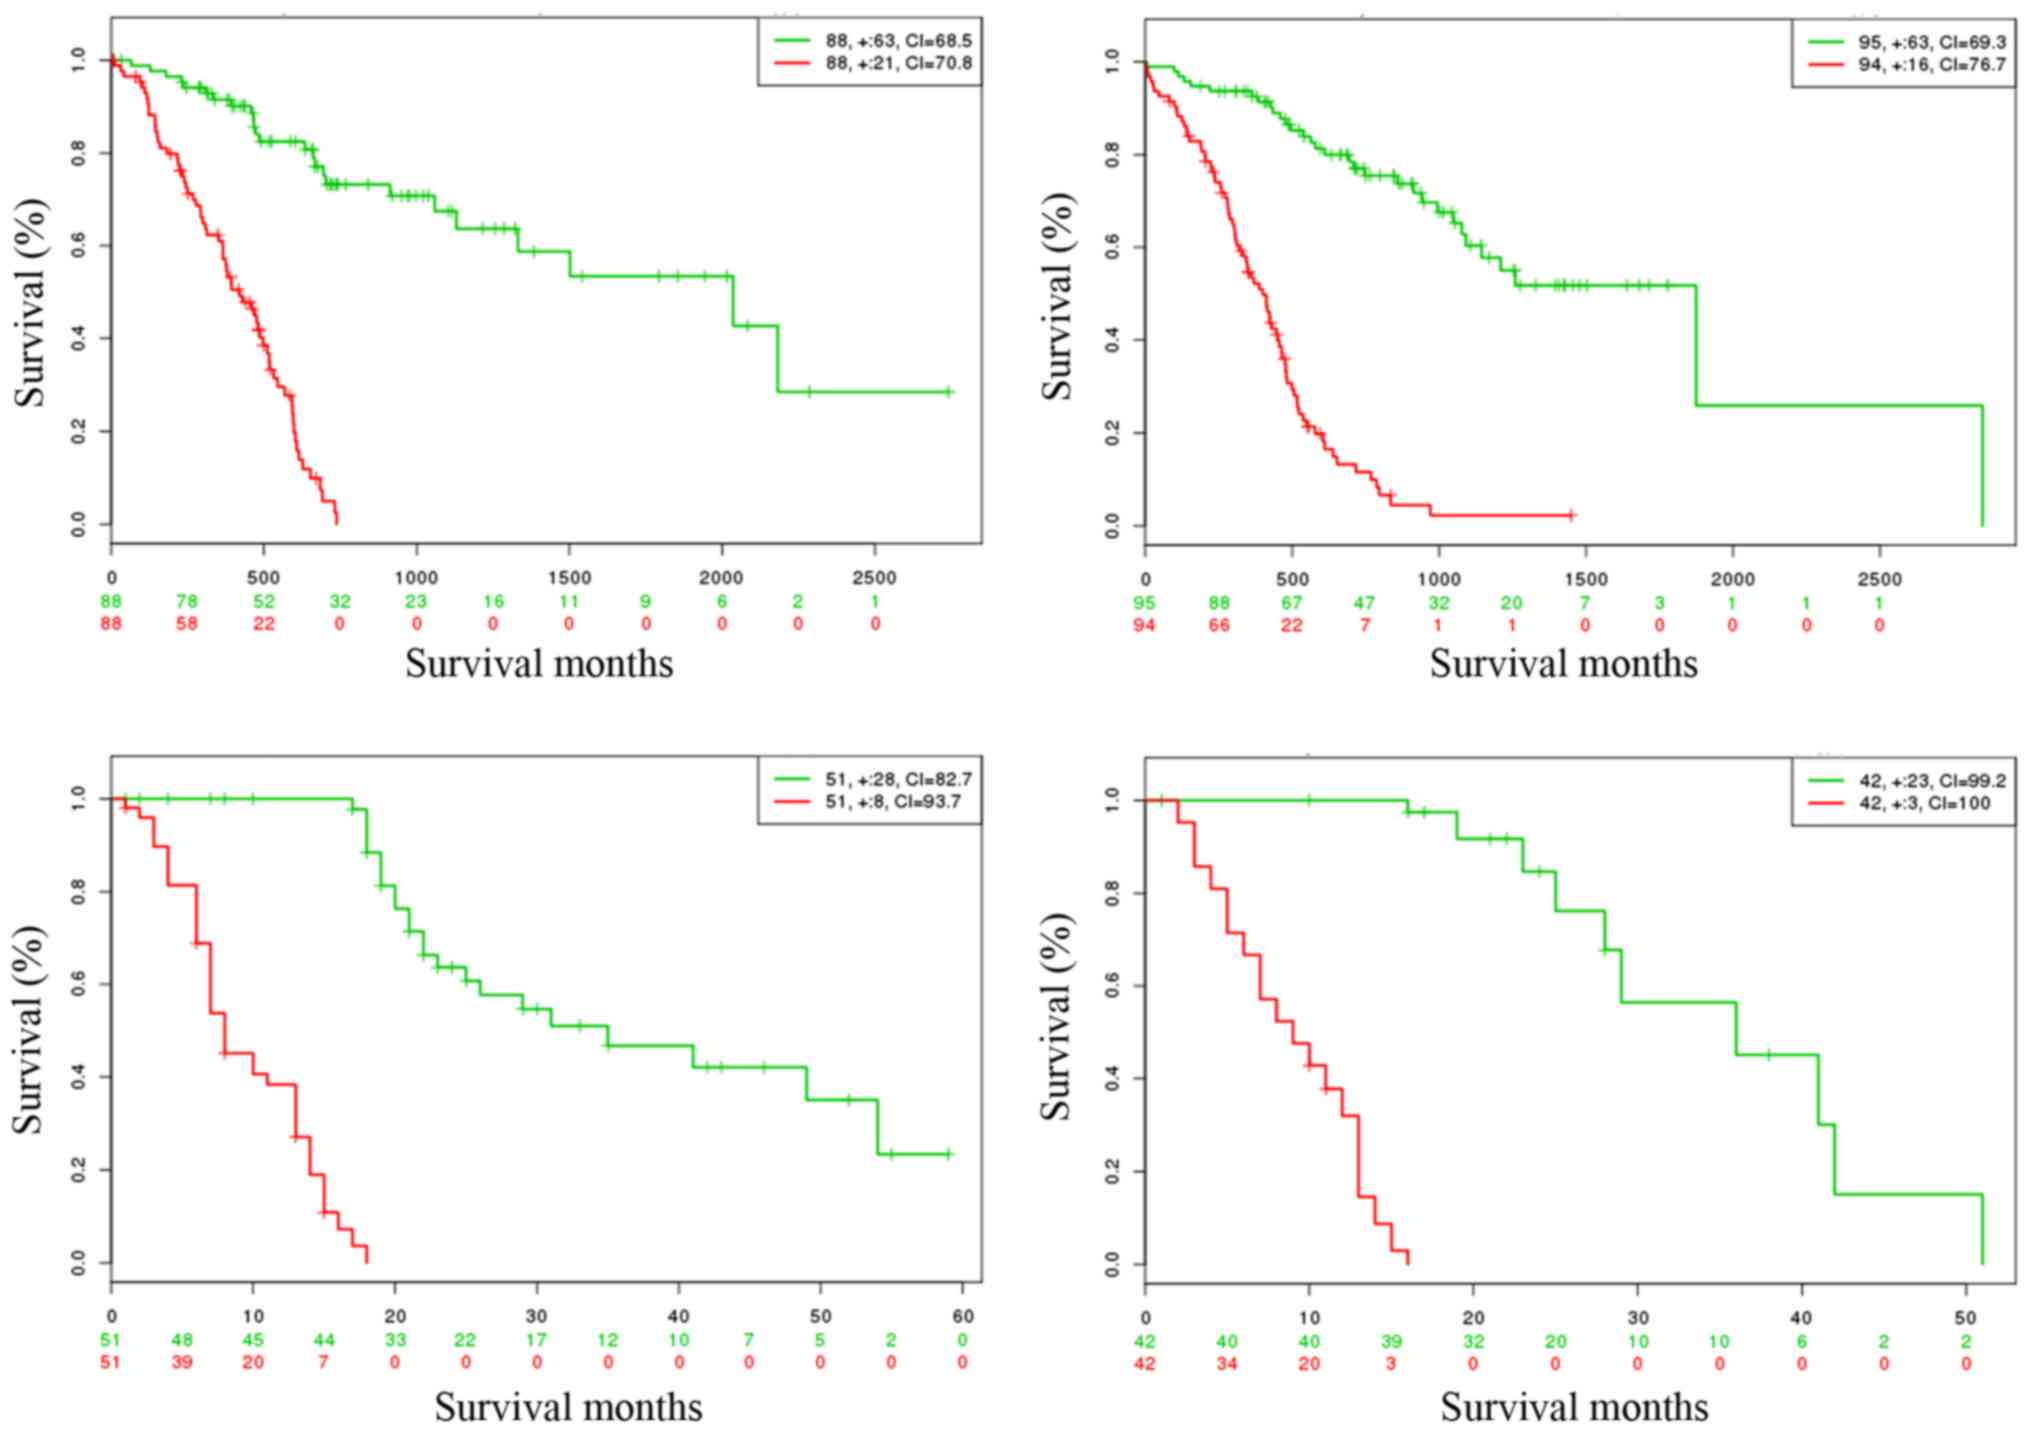
Virtual validation
Biomarker validation is critical in the study of
cancer molecular mechanism research. The prognostic performance of
the common DEGs were validated using the SurvExpress online tool
which provides survival analysis and risk assessment. Results are
shown in Fig. 5 and are summarized
in Table IV. The figure indicated
that low- and high-risk PDAC groups can be significantly
differentiated in the 4 datasets, and the p-values were 9.9e-15,
0.0, 6.0e-13 and 1.1e-06, respectively. In addition, the higher
concordance index (CI) demonstrated that better prediction results
can be achieved based on those DEGs (Table IV).
| Table IV.Virtual validation results of the
common DEGs using 4 PDAC datasets. |
Table IV.
Virtual validation results of the
common DEGs using 4 PDAC datasets.
|
| DEGs between risk
groups |
|---|
|
|
|
|---|
| Dataset | Samples | Genes found | Risk groups
p-value | CI | No. | DEGs |
|---|
| TCGA | 176 | 75 | 9.90E-15 | 79.6 | 49 | TMC5,
GJB2, DPCR1, MMP11, ZWINT… |
| ICGC | 189 | 75 | 0.00E+00 | 82.1 | 17 | CCL8,
ZWINT, NQO1, OAS1, ECT2… |
| GSE21501 | 132 | 75 | 6.00E-13 | 95.4 | 11 | SLC6A14,
CEACAM5, FOSB, LAMA3, ANO1… |
| GSE28735 | 90 | 73 | 1.10E-06 | 99.9 | 4 | RRM2,
PTGDS, ITGA2, C15orf48 |
Discussion
With the development of microarray and next
generation sequencing technologies, understanding of the molecular
mechanism of pancreatic ductal adenocarcinoma (PDAC) has been
significantly advanced. In the present study, we aimed to unveil
the complex mechanism of PDAC by integrating different types of
omics data. A total of 76 genes were simultaneously differentially
expressed in 39 tumor tissues. Notably, a heat map showed that
tumor and normal samples were able to be clearly distinguished
based on the DEGs. The erroneous assignment of 2 samples was
probably due to tumor heterogeneity.
KEGG pathway enrichment revealed that the DEGs were
involved in the ECM-receptor interaction pathway. Studies have
shown that PDAC is characterized by prominent desmoplasia (24). Extracellular matrix (ECM) proteins,
ECM metabolizing enzymes and growth factors are main components of
desmoplasia, and the components can promote the growth of cancer
cells (25). In addition, ECM
proteins and desmoplastic secreted growth factors can activate
intracellular signals including reactive oxygen species that
prevent the death of PDAC cancer cells (25). In addition, several ECM components
such as collagens I/III/IV, decorin and versican may be of clinical
prognostic significance in PDAC (26). Another significantly enriched
pathway is focal adhesion. Researches have demonstrated that
interaction between integrin and focal adhesion kinase can regulate
cancer cell adhesion and invasion (27,28).
Sawai et al showed that phosphorylation of focal adhesion
kinase is involved in the aggressive capability of PDAC via the
Ras/ERK signaling pathway (29). In
addition, MUC16, a heavily glycosylated type-I transmembrane mucin,
can facilitate PDAC growth and metastasis via focal adhesion
signaling (30).
The mRNA and miRNA interaction network analysis
further unveiled the complex mechanism of PDAC. The interaction
network showed that hsa-miR-212-3p can regulate the DEG
MUC4. This gene encodes highly glycosylated integral
membrane glycoprotein in the cell surface (31). In addition, immunohistochemical
analyses based on 135 PDAC tissues demonstrated that MUC4
was significantly highly expressed in patients with poor prognosis
(p=0.0043) (32). In addition,
hypomethylation of the MUC4 promoter probably participated
in the carcinogenesis and malignant development of PDAC based on
DNA methylation-specific PCR analysis of 116 microdissected foci
(33). Jonckheere et al
showed that MUC4 can interact with the ErbB2 oncogenic
receptor via EGF domains, and inhibition of MUC4 expression
can affect the downstream JNK pathway (34).
Another important gene is RRM2 which encodes
one of 2 non-identical subunits for ribonucleotide reductase.
Ribonucleotide reductase has been demonstrated to be a determinant
of gemcitabine chemoresistance in human cancers (35), and the level of RRM2 can
regulate enzyme activity (36).
Duxbury et al showed that high expression of RRM2 is
related to gemcitabine chemoresistance in PDAC (37). The suppression of RRM2 by
siRNA significantly inhibited tumor growth, metastasis and
increased tumor apoptosis (37).
Research has also shown that NF-κB is the key mediator by
which RRM2 induces invasiveness in PDAC (38). RRM2 and its downstream
intermediaries can become potential drug targets (38). The mRNA-miRNA interaction network
demonstrated that hsa-miR-106p-5p and hsa-miR-155-5p can regulate
RRM2.
In addition, the CCL2 gene, which is also
refered to as monocyte chemoattractant protein 1 and is a small
cytokine (39), has been widely
reported to be related to PDAC progression. In PDAC, the expression
of CCL2 was found to be significantly elevated (40). In addition, Kalbasi et al
demonstrated that highly expressed CCL2 can recruit
Ly6C+CCR2+ inflammatory monocytes or
macrophages to the regions surrounding the tumor and promote tumor
proliferation and vascularization (41). In addition, PDAC cancer cells can
construct an immunosuppressive tumor microenvironment by recruiting
regulatory T cells with the high-expression of CCL5 (42). The mRNA-miRNA interaction network
showed that hsa-miR-155-5p can regulate CCL2.
Apart from the above-mentioned 3 critical genes in
PDAC, some rarely reported or novel genes such as ECT2,
SDC1, SOCS3, TMC5 and NR4A2, also play
a role in the development of PDAC. The ECT2 gene can promote
Rho activity during cytokinesis, and RT-PCR results showed that it
was highly expressed in PDAC (43).
Statistical analysis showed that epithelial expression of
SDC1 was positively correlated with survival time in PDAC
patients (p=0.029) (44). Lesina
et al showed that homozygous deletion of Socs3 can
aberrantly activate Stat3 and promote PDAC development
(45).
In summary, the development and progression of PDAC
were probably induced via various processes. Firstly, activation of
MUC4 induces nuclear translocation of β-catenin and promotes
the process of angiogenesis that can provide necessary nutrition or
oxygen for cancer cells. Then, RRM2 can induce the
invasiveness of PDAC via NF-κB. Finally, the formation of an
immunosuppressive tumor microenvironment by recruiting regulatory T
cells with high expression of CCL2 further promotes cancer
cell proliferation and vascularization.
Acknowledgements
The present study was funded by the Natural Science
Foundation of Zhejiang Province (nos. LY15H030016 and LY15H160056)
and Wenzhou Science & Technology Bureau (no. Y20140696).
References
|
1
|
Hariharan D, Saied A and Kocher HM:
Analysis of mortality rates for pancreatic cancer across the world.
HPB. 10:58–62. 2008. View Article : Google Scholar : PubMed/NCBI
|
|
2
|
American Cancer Society: Cancer Facts
& Figures 2012. American Cancer Society; Atlanta, GA, USA:
2012
|
|
3
|
Stat Fact Sheets SEER: Pancreas Cancer.
National Cancer Institute; 2013
|
|
4
|
Ishiwata T: Pancreatic ductal
adenocarcinoma: Basic and clinical challenges for better prognosis.
J Carcinog Mutagen. S9:2157–2518. 2013.http://dx.doi.org/4172/2157-2518.S9-005
|
|
5
|
Siegel R, Ward E, Brawley O and Jemal A:
Cancer statistics, 2011: The impact of eliminating socioeconomic
and racial disparities on premature cancer deaths. CA Cancer J
Clin. 61:212–236. 2011. View Article : Google Scholar : PubMed/NCBI
|
|
6
|
Partensky C: Toward a better understanding
of pancreatic ductal adenocarcinoma: Glimmers of hope? Pancreas.
42:729–739. 2013. View Article : Google Scholar : PubMed/NCBI
|
|
7
|
Talamini R, Polesel J, Gallus S, Dal Maso
L, Zucchetto A, Negri E, Bosetti C, Lucenteforte E, Boz G,
Franceschi S, et al: Tobacco smoking, alcohol consumption and
pancreatic cancer risk: A case-control study in Italy. Eur J
Cancer. 46:370–376. 2010. View Article : Google Scholar : PubMed/NCBI
|
|
8
|
Gapstur SM, Jacobs EJ, Deka A, McCullough
ML, Patel AV and Thun MJ: Association of alcohol intake with
pancreatic cancer mortality in never smokers. Arch Intern Med.
171:444–451. 2011. View Article : Google Scholar : PubMed/NCBI
|
|
9
|
Jandaghi P, Najafabadi HS, Bauer AS,
Papadakis AI, Fassan M, Hall A, Monast A, von Knebel Doeberitz M,
Neoptolemos JP, Costello E, et al: Expression of DRD2 is increased
in human pancreatic ductal adenocarcinoma and inhibitors slow tumor
growth in mice. Gastroenterology. 151:1218–1231. 2016. View Article : Google Scholar : PubMed/NCBI
|
|
10
|
Teodorczyk M, Kleber S, Wollny D, Sefrin
JP, Aykut B, Mateos A, Herhaus P, Sancho-Martinez I, Hill O,
Gieffers C, et al: CD95 promotes metastatic spread via Sck in
pancreatic ductal adenocarcinoma. Cell Death Differ. 22:1192–1202.
2015. View Article : Google Scholar : PubMed/NCBI
|
|
11
|
Cote GA, Gore AJ, McElyea SD, Heathers LE,
Xu H, Sherman S and Korc M: A pilot study to develop a diagnostic
test for pancreatic ductal adenocarcinoma based on differential
expression of select miRNA in plasma and bile. Am J Gastroenterol.
109:1942–1952. 2014. View Article : Google Scholar : PubMed/NCBI
|
|
12
|
Ye Y, Chen J, Zhou Y, Fu Z, Zhou Q, Wang
Y, Gao W, Zheng S, Zhao X, Chen T, et al: High expression of
AFAP1-AS1 is associated with poor survival and short-term
recurrence in pancreatic ductal adenocarcinoma. J Transl Med.
13:1372015. View Article : Google Scholar : PubMed/NCBI
|
|
13
|
Witkiewicz AK, McMillan EA, Balaji U, Baek
G, Lin WC, Mansour J, Mollaee M, Wagner KU, Koduru P, Yopp A, et
al: Whole-exome sequencing of pancreatic cancer defines genetic
diversity and therapeutic targets. Nat Commun. 6:67442015.
View Article : Google Scholar : PubMed/NCBI
|
|
14
|
Berger B, Peng J and Singh M:
Computational solutions for omics data. Nat Rev Genet. 14:333–346.
2013. View
Article : Google Scholar : PubMed/NCBI
|
|
15
|
Donahue TR, Tran LM, Hill R, Li Y,
Kovochich A, Calvopina JH, Patel SG, Wu N, Hindoyan A, Farrell JJ,
et al: Integrative survival-based molecular profiling of human
pancreatic cancer. Clin Cancer Res. 18:1352–1363. 2012. View Article : Google Scholar : PubMed/NCBI
|
|
16
|
Gentleman RC, Carey VJ, Bates DM, Bolstad
B, Dettling M, Dudoit S, Ellis B, Gautier L, Ge Y, Gentry J, et al:
Bioconductor: Open software development for computational biology
and bioinformatics. Genome Biol. 5:R802004. View Article : Google Scholar : PubMed/NCBI
|
|
17
|
Kerr MK: Linear models for microarray data
analysis: Hidden similarities and differences. J Comput Biol.
10:891–901. 2003. View Article : Google Scholar : PubMed/NCBI
|
|
18
|
Hadley W: ggplot2: Elegant Graphics for
Data Analysis. Springer; Switzerland: 2016
|
|
19
|
Dennis G Jr, Sherman BT, Hosack DA, Yang
J, Gao W, Lane HC and Lempicki RA: DAVID: Database for Annotation,
Visualization, and Integrated Discovery. Genome Biol. 4:32003.
View Article : Google Scholar
|
|
20
|
Acunzo M and Croce CM: MicroRNA in cancer
and cachexia - A mini-review. J Infect Dis. 212:(Suppl 1). S74–S77.
2015. View Article : Google Scholar : PubMed/NCBI
|
|
21
|
Kutmon M, Kelder T, Mandaviya P, Evelo CT
and Coort SL: CyTargetLinker: A cytoscape app to integrate
regulatory interactions in network analysis. PLoS One.
8:e821602013. View Article : Google Scholar : PubMed/NCBI
|
|
22
|
Shannon P, Markiel A, Ozier O, Baliga NS,
Wang JT, Ramage D, Amin N, Schwikowski B and Ideker T: Cytoscape: A
software environment for integrated models of biomolecular
interaction networks. Genome Res. 13:2498–2504. 2003. View Article : Google Scholar : PubMed/NCBI
|
|
23
|
Aguirre-Gamboa R, Gomez-Rueda H,
Martínez-Ledesma E, Martínez-Torteya A, Chacolla-Huaringa R,
Rodriguez-Barrientos A, Tamez-Peña JG and Treviño V: SurvExpress:
An online biomarker validation tool and database for cancer gene
expression data using survival analysis. PLoS One. 8:e742502013.
View Article : Google Scholar : PubMed/NCBI
|
|
24
|
Mollenhauer J, Roether I and Kern HF:
Distribution of extracellular matrix proteins in pancreatic ductal
adenocarcinoma and its influence on tumor cell proliferation in
vitro. Pancreas. 2:14–24. 1987. View Article : Google Scholar : PubMed/NCBI
|
|
25
|
Pandol S, Edderkaoui M, Gukovsky I, Lugea
A and Gukovskaya A: Desmoplasia of pancreatic ductal
adenocarcinoma. Clin Gastroenterol Hepatol. 7:(Suppl 11). S44–47.
2009. View Article : Google Scholar : PubMed/NCBI
|
|
26
|
Mahadevan D and Von Hoff DD: Tumor-stroma
interactions in pancreatic ductal adenocarcinoma. Mol Cancer Ther.
6:1186–1197. 2007. View Article : Google Scholar : PubMed/NCBI
|
|
27
|
Crowe DL and Ohannessian A: Recruitment of
focal adhesion kinase and paxillin to beta1 integrin promotes
cancer cell migration via mitogen activated protein kinase
activation. BMC Cancer. 4:182004. View Article : Google Scholar : PubMed/NCBI
|
|
28
|
Schmitz KJ, Grabellus F, Callies R,
Otterbach F, Wohlschlaeger J, Levkau B, Kimmig R, Schmid KW and
Baba HA: High expression of focal adhesion kinase
(p125FAK) in node-negative breast cancer is related to
overexpression of HER-2/neu and activated Akt kinase but does not
predict outcome. Breast Cancer Res. 7:R194–R203. 2005. View Article : Google Scholar : PubMed/NCBI
|
|
29
|
Sawai H, Okada Y, Funahashi H, Matsuo Y,
Takahashi H, Takeyama H and Manabe T: Activation of focal adhesion
kinase enhances the adhesion and invasion of pancreatic cancer
cells via extracellular signal-regulated kinase-1/2 signaling
pathway activation. Mol Cancer. 4:372005. View Article : Google Scholar : PubMed/NCBI
|
|
30
|
Muniyan S, Haridas D, Chugh S, Rachagani
S, Lakshmanan I, Gupta S, Seshacharyulu P, Smith LM, Ponnusamy MP
and Batra SK: MUC16 contributes to the metastasis of pancreatic
ductal adenocarcinoma through focal adhesion mediated signaling
mechanism. Genes Cancer. 7:110–124. 2016.PubMed/NCBI
|
|
31
|
Mall AS: Analysis of mucins: Role in
laboratory diagnosis. J Clin Pathol. 61:1018–1024. 2008. View Article : Google Scholar : PubMed/NCBI
|
|
32
|
Saitou M, Goto M, Horinouchi M, Tamada S,
Nagata K, Hamada T, Osako M, Takao S, Batra SK, Aikou T, et al:
MUC4 expression is a novel prognostic factor in patients with
invasive ductal carcinoma of the pancreas. J Clin Pathol.
58:845–852. 2005. View Article : Google Scholar : PubMed/NCBI
|
|
33
|
Zhu Y, Zhang JJ, Zhu R, Zhu Y, Liang WB,
Gao WT, Yu JB, Xu ZK and Miao Y: The increase in the expression and
hypomethylation of MUC4 gene with the progression of pancreatic
ductal adenocarcinoma. Med Oncol. 28:(Suppl 1). S175–S184. 2011.
View Article : Google Scholar : PubMed/NCBI
|
|
34
|
Jonckheere N, Skrypek N, Merlin J, Dessein
AF, Dumont P, Leteurtre E, Harris A, Desseyn JL, Susini C, Frénois
F, et al: The mucin MUC4 and its membrane partner ErbB2 regulate
biological properties of human CAPAN-2 pancreatic cancer cells via
different signalling pathways. PLoS One. 7:e322322012. View Article : Google Scholar : PubMed/NCBI
|
|
35
|
Goan YG, Zhou B, Hu E, Mi S and Yen Y:
Overexpression of ribonucleotide reductase as a mechanism of
resistance to 2,2-difluorodeoxycytidine in the human KB cancer cell
line. Cancer Res. 59:4204–4207. 1999.PubMed/NCBI
|
|
36
|
Eriksson S and Martin DW Jr:
Ribonucleotide reductase in cultured mouse lymphoma cells. Cell
cycle-dependent variation in the activity of subunit protein M2. J
Biol Chem. 256:9436–9440. 1981.PubMed/NCBI
|
|
37
|
Duxbury MS, Ito H, Zinner MJ, Ashley SW
and Whang EE: RNA interference targeting the M2 subunit of
ribonucleotide reductase enhances pancreatic adenocarcinoma
chemosensitivity to gemcitabine. Oncogene. 23:1539–1548. 2004.
View Article : Google Scholar : PubMed/NCBI
|
|
38
|
Duxbury MS and Whang EE: RRM2 induces
NF-kappaB-dependent MMP-9 activation and enhances cellular
invasiveness. Biochem Biophys Res Commun. 354:190–196. 2007.
View Article : Google Scholar : PubMed/NCBI
|
|
39
|
Carr MW, Roth SJ, Luther E, Rose SS and
Springer TA: Monocyte chemoattractant protein 1 acts as a
T-lymphocyte chemoattractant. Proc Natl Acad Sci USA. 91:3652–3656.
1994. View Article : Google Scholar : PubMed/NCBI
|
|
40
|
Monti P, Leone BE, Marchesi F, Balzano G,
Zerbi A, Scaltrini F, Pasquali C, Calori G, Pessi F, Sperti C, et
al: The CC chemokine MCP-1/CCL2 in pancreatic cancer progression:
Regulation of expression and potential mechanisms of antimalignant
activity. Cancer Res. 63:7451–7461. 2003.PubMed/NCBI
|
|
41
|
Kalbasi A, Komar CA, Tooker GM, Liu M, Lee
JW, Gladney WL, Ben-Josef E and Beatty GL: Tumor-derived CCL2
mediates resistance to radiotherapy in pancreatic ductal
adenocarcinoma. Clin Cancer Res. 23:137–148. 2017. View Article : Google Scholar : PubMed/NCBI
|
|
42
|
Tan MC, Goedegebuure PS, Belt BA, Flaherty
B, Sankpal N, Gillanders WE, Eberlein TJ, Hsieh CS and Linehan DC:
Disruption of CCR5-dependent homing of regulatory T cells inhibits
tumor growth in a murine model of pancreatic cancer. J Immunol.
182:1746–1755. 2009. View Article : Google Scholar : PubMed/NCBI
|
|
43
|
Zhang ML, Lu S, Zhou L and Zheng SS:
Correlation between ECT2 gene expression and methylation change of
ECT2 promoter region in pancreatic cancer. Hepatobiliary Pancreat
Dis Int. 7:533–538. 2008.PubMed/NCBI
|
|
44
|
Hrabar D, Aralica G, Gomercic M, Ljubicic
N, Kruslin B and Tomas D: Epithelial and stromal expression of
syndecan-2 in pancreatic carcinoma. Anticancer Res. 30:2749–2753.
2010.PubMed/NCBI
|
|
45
|
Lesina M, Kurkowski MU, Ludes K, Rose-John
S, Treiber M, Klöppel G, Yoshimura A, Reindl W, Sipos B, Akira S,
et al: Stat3/Socs3 activation by IL-6 transsignaling promotes
progression of pancreatic intraepithelial neoplasia and development
of pancreatic cancer. Cancer Cell. 19:456–469. 2011. View Article : Google Scholar : PubMed/NCBI
|