Introduction
Ovarian cancer is the most lethal cancer among
gynecologic malignancies (1).
Early-stage ovarian cancer is frequently asymptomatic and difficult
to detect, and thus diagnosis usually occurs after the disease has
disseminated beyond the ovaries (2). The current standard treatment for
advanced ovarian cancer is surgical debulking followed by
platinum/taxane-based chemotherapy (3). Although this standard treatment
significantly reduces the mortality rates and prolongs the survival
time, the majority of patients will eventually relapse (4). The main obstacle to a successful
treatment for ovarian cancer is the development of drug resistance
that finally leads to fatal disease (5), and 5-year survival rates of ovarian
cancer are less than 40%, with only modest improvement over the
past 40 years (2). Therefore, there
is a consistent and urgent need to understand the mechanism of drug
resistance and to identify useful biomarkers for overall survival
in ovarian cancer (6).
The present study was based on profiles of 1648
ovarian cancer patients, in microarrays from The Cancer Genome
Atlas (TCGA) and Gene Expression Omnibus (GEO). We identified
several genes significantly associated with overall survival (OS);
thus, these genes are potential biomarkers for prognosis in OC. We
also found that these genes were potentially involved in regulation
of drug resistance in OC.
Materials and methods
Cell culture
The human epithelial OC cell lines SKOV3 and A2780
were maintained in our laboratory and propagated in vitro by
serial passage in RPMI-1640 medium supplemented with 10% fetal
bovine serum (FBS). The cisplatin-resistant cell line SKOV3-DDP and
the carboplatin-resistant cell line A2780-CBP were established by
sequential exposure of cells to increasing concentrations of
cisplatin and carboplatin, respectively (7).
Real-time quantitative polymerase
chain reaction analysis
Total RNA was isolated from the cell lines SKOV3,
SKOV3-DDP, A2780 and A2780-CBP, using TRIzol reagent (Life
Technologies, Grand Island, NY, USA). The quantity and quality of
the RNA were measured using a Thermo Scientific NanoDrop 2000
spectrophotometer (Thermo Fisher Scientific, Wilmington, DE, USA).
cDNA was synthesized from 2 µg of RNA using the SuperScript III
First-Strand synthesis system (Life Technologies). mRNA expression
was measured using real-time quantitative polymerase chain reaction
(RT-qPCR) and the Power SYBR-Green PCR Master Mix (Applied
Biosystems, Waltham, MA, USA). Data were collected with the Applied
Biosystems StepOne RT-PCR system in accordance with the
manufacturers instructions. The RT-qPCR gene-specific primers were:
CAKP2: forward primer, 5-AA GCCACAAAACCTCAGCCT-3 and reverse
primer, 5-CA TGAGGCCCTTTCCGGATT-3. BCHE: forward primer,
5-GGCCTGTCTTCAAAAGCACTG-3 and reverse primer,
5-TCCTGCTTTCCACTCCCATTC-3. CLDN10: forward primer,
5-GGAGGCTCCGATAAAGCCAA-3 and reverse primer,
5-GTGGCCCCGTTGTATGTGTA-3. OVGP1: forward primer,
5-AGCGAAGAAGCACTGGATTGA-3 and reverse primer,
5-ATTCACAGCAGATGACAGCCA-3. For GAPDH, used as the control,
the forward primer was 5-GA GGTGAAGGTCGGAGT-3 and the reverse
primer 5-GAA GATGGTGATGGGATTT-3.
Gene expression profiles
Gene expression data and survival information of the
1648 OC patients were deposited in the KM plotter, which was
established based on the microarrays from GEO and TCGA (8). Twelve independent microarrays from GEO
profiles covered 1083 patients, including GSE14764 (n=80), GSE15622
(n=36), GSE18520 (n=63), GSE19829 (n=28), GSE23554 (n=28), GSE26193
(n=107), GSE26712 (n=195), GSE27651 (n=49), GSE30161 (n=58),
GSE3149 (n=166), GSE51373 (n=28) and GSE9891 (n=285); the TCGA
ovarian cohort covered 565 patients. Detailed information of gene
expression and clinical characteristics of the 565 OC patients in
TCGA cohort were retrieved from the cBioPortal for cancer genomics
(http://cbioportal.org) (9,10).
Microarray GDS3754 (Human U133 plus 2.0 GeneChips;
Affymetrix, Inc., Santa Clara, CA, USA) was deposited in GEO
Profiles (11), and used for the
analyses of gene expression in drug-resistant OC cells. In this
analysis, in the case of two probe sets that target one gene, only
the probe set with significant variability was retained. In the
case of more than three probe sets that target one gene, the set
exhibiting the most divergent expression was excluded and the set
with significant variability was retained (12).
The TCGA ovarian cohort and GEO profiles are well
known publicly available cohorts that can be downloaded by
researchers for further analysis. No changes were made to mRNA
expression values used in the analysis.
Bioinformatics analysis
Protein/gene interaction network was generated using
the GeneMANIA (http://www.genemania.org/), which is a web-based
database and a tool for the prediction of gene functions on the
basis of multiple networks derived from different genomic or
proteomic data/sources (13). It is
fast enough to predict gene functions with great accuracy using
GeneMANIA because hundreds of datasets from GEO, BioGRID, Pathway
Commons and I2D, as well as organismspecific functional genomics
data sets have been collected in this software (14).
Biological process annotation was performed using
the Coremine Medical (http://www.coremine.com/medical/), which is a
gene/protein database and a web-based tool for text mining. It
carries out automated extraction of experimental and theoretical
biomedical knowledge from publicly available gene and text
databases to create a gene-to-gene co-citation network for millions
of named human genes by automated analysis of titles and abstracts
in over 10 million MEDLINE records (15).
Data analysis
The data were analyzed using SPSS 20.0 software. The
probability of survival and significance were calculated using the
Kaplan-Meier method and KM plotter (8). The correlation between gene expression
and the clinicopathological characteristics was evaluated by
Pearsons χ2 test (two-sided). Gene expression was
dichotomized into high and low values using the median as a cut-off
in all above analyses, in accordance with previous studies
(16). Gene mRNA expression levels
are shown as mean ± SD. Homogeneity of the variance was analyzed
using the t-test. P<0.05 was considered significant. The desired
Affymetrix ID for CKAP2, BCHE, CLDN10, and OVGP1 is 218252_at,
205433_at, 205328_at, and 205432_at, respectively.
Results
Determination of genes associated with
OS in OC
We previously reported that 60 genes were
upregulated, and 126 genes were downregulated by at least 4-fold in
594 ovarian serous cystadenocarcinomas compared with 8 normal
ovaries, respectively, according to TCGA ovarian statistics data
deposited in the Oncomine database (17). Of these, we selected 136 genes (38
upregulated and 98 downregulated genes) for which we found ≤2
articles in PubMed using a search with (ovarian[Title]) and
‘gene’[Title/Abstract], for further analysis of their relationships
with OS. The mRNA expression data of the 136 genes and related
clinical data for 489 OC patients in the TCGA cohort were retrieved
from cBioPortal for Cancer Genomics (9,10).
Gene expression was dichotomized into high and low values using the
median as a cut-off in all above analyses, in accordance with a
previous study (16). As shown in
Table I, among all 136 genes, 11
were closely associated with OS, as determined by Kaplan-Meier
analysis. CKAP2 is upregulated, and ATXN10,
BCHE, CLDN10, CRISP3, FCGBP,
LYVE1, NDNF, OVGP1, PTGIS and
REEP1 are downregulated in OC (17). We found that the upregulation of
CKAP2, and downregulation of CLDN10, CRISP3
and OVGP1 were associated with shorter OS, whereas the
downregulation of ATXN10, BCHE, FCGBP,
LYVE1, NDNF, PTGIS and REEP1 were
associated with longer OS. To elucidate whether any of the above
genes was an independent factor for predicting OS, we performed
multivariate analyses of histological grade, tumor stage, residual
tumor and platinum status for the 11 genes, using a Cox
proportional hazards model (Table
II). The results indicated that BCHE (P=0.026),
CRISP3 (P=0.031), LYVE1 (P=0.014) and OVGP1
(P=0.001) were independent prognostic factors for OS in 489 OC
patients.
 | Table I.Eleven genes were determined by
Kaplan-Meier analysis to be closely associated with overall
survival in ovarian cancer. |
Table I.
Eleven genes were determined by
Kaplan-Meier analysis to be closely associated with overall
survival in ovarian cancer.
|
|
|
| 95% CI |
|
|---|
|
|
|
|
|
|
|---|
| Dysregulation of
genes |
| Estimate | Sth. Error | Lower | Upper | P-value |
|---|
| Upregulated
genes |
|
|
|
|
|
|
|
CKAP2 | H | 39.900 | 2.482 | 35.035 | 44.765 | 0.024 |
|
| L | 47.500 | 3.060 | 41.503 | 53.497 |
|
|
| Overall | 43.800 | 2.105 | 39.675 | 47.925 |
|
| Downregulated
genes |
|
|
|
|
|
|
|
ATXN10 | H | 41.000 | 2.782 | 35.547 | 46.453 | 0.03 |
|
| L | 45.300 | 2.671 | 40.066 | 50.534 |
|
|
| Overall | 43.800 | 2.105 | 39.675 | 47.925 |
|
|
BCHE | H | 36.300 | 2.283 | 31.826 | 40.774 | 0.000 |
|
| L | 49.000 | 3.206 | 42.717 | 55.283 |
|
|
| Overall | 43.800 | 2.105 | 39.675 | 47.925 |
|
|
CLDN10 | H | 48.300 | 1.797 | 44.777 | 51.823 | 0.036 |
|
| L | 38.200 | 2.075 | 34.134 | 42.266 |
|
|
| Overall | 43.800 | 2.105 | 39.675 | 47.925 |
|
|
CRISP3 | H | 47.700 | 1.795 | 44.181 | 51.219 | 0.043 |
|
| L | 38.300 | 2.023 | 34.336 | 42.264 |
|
|
| Overall | 43.800 | 2.105 | 39.675 | 47.925 |
|
|
FCGBP | H | 41.000 | 2.371 | 36.352 | 45.648 | 0.025 |
|
| L | 44.900 | 2.866 | 39.283 | 50.517 |
|
|
| Overall | 43.800 | 2.105 | 39.675 | 47.925 |
|
|
LYVE1 | H | 41.500 | 2.221 | 37.148 | 45.852 | 0.032 |
|
| L | 44.900 | 3.643 | 37.761 | 52.039 |
|
|
| Overall | 43.800 | 2.105 | 39.675 | 47.925 |
|
|
NDNF | H | 41.000 | 2.070 | 36.944 | 45.056 | 0.034 |
|
| L | 45.100 | 2.086 | 41.012 | 49.188 |
|
|
| Overall | 43.800 | 2.105 | 39.675 | 47.925 |
|
|
OVGP1 | H | 49.000 | 3.581 | 41.981 | 56.019 | 0.003 |
|
| L | 37.900 | 1.947 | 34.084 | 41.716 |
|
|
| Overall | 43.800 | 2.105 | 39.675 | 47.925 |
|
|
PTGIS | H | 40.400 | 2.890 | 34.735 | 46.065 | 0.004 |
|
| L | 47.500 | 1.975 | 43.629 | 51.371 |
|
|
| Overall | 43.800 | 2.105 | 39.675 | 47.925 |
|
|
REEP1 | H | 38.400 | 2.053 | 34.377 | 42.423 | 0.007 |
|
| L | 47.700 | 3.021 | 41.779 | 53.621 |
|
|
| Overall | 43.800 | 2.105 | 39.675 | 47.925 |
|
| Table II.Multivariate analysis of overall
survival of ovarian cancer patients using Cox proportional hazard
model. |
Table II.
Multivariate analysis of overall
survival of ovarian cancer patients using Cox proportional hazard
model.
|
|
|
|
|
|
|
| 95% CI |
|---|
|
|
|
|
|
|
|
|
|
|---|
| Factors | B | SE | Wald | df | Sig. | Exp(B) | Lower | Upper |
|---|
| CKAP2 | 0.172 | 0.135 | 1.626 | 1 | 0.202 | 1.187 | 0.912 | 1.546 |
| ATXN10 | 0.156 | 0.126 | 1.538 | 1 | 0.215 | 1.169 | 0.913 | 1.496 |
| BCHE | 0.310 | 0.139 | 4.955 | 1 | 0.026 | 1.363 | 1.038 | 1.790 |
| CLDN10 | −0.184 | 0.130 | 1.988 | 1 | 0.159 | 0.832 | 0.644 | 1.074 |
| CRISP3 | −0.282 | 0.131 | 4.647 | 1 | 0.031 | 0.754 | 0.584 | 0.975 |
| FCGBP | 0.196 | 0.128 | 2.330 | 1 | 0.127 | 1.217 | 0.946 | 1.565 |
| LYVE1 | 0.324 | 0.132 | 6.004 | 1 | 0.014 | 1.382 | 1.067 | 1.791 |
| NDNF | 0.057 | 0.132 | 0.184 | 1 | 0.668 | 1.058 | 0.818 | 1.370 |
| OVGP1 | −0.439 | 0.135 | 10.577 | 1 | 0.001 | 0.645 | 0.495 | 0.840 |
| PTGIS | 0.030 | 0.142 | 0.045 | 1 | 0.832 | 1.030 | 0.781 | 1.360 |
| REEP1 | 0.075 | 0.132 | 0.325 | 1 | 0.568 | 1.078 | 0.833 | 1.395 |
| Grade |
|
|
|
|
|
|
|
|
(G2/G3) | −0.279 | 0.197 | 2.010 | 1 | 0.156 | 0.756 | 0.514 | 1.113 |
| Platinum
status |
|
|
|
|
|
|
|
|
(R/S) | 1.230 | 0.168 | 53.690 | 1 | 0.000 | 3.420 | 2.462 | 4.753 |
| Residual (mm) |
|
|
|
|
|
|
|
|
(≤10/>10) | −0.176 | 0.145 | 1.482 | 1 | 0.223 | 0.838 | 0.631 | 1.113 |
| Stage |
|
|
|
|
|
|
|
|
(II/III–IV) | −0.636 | 0.406 | 2.449 | 1 | 0.118 | 0.530 | 0.239 | 1.174 |
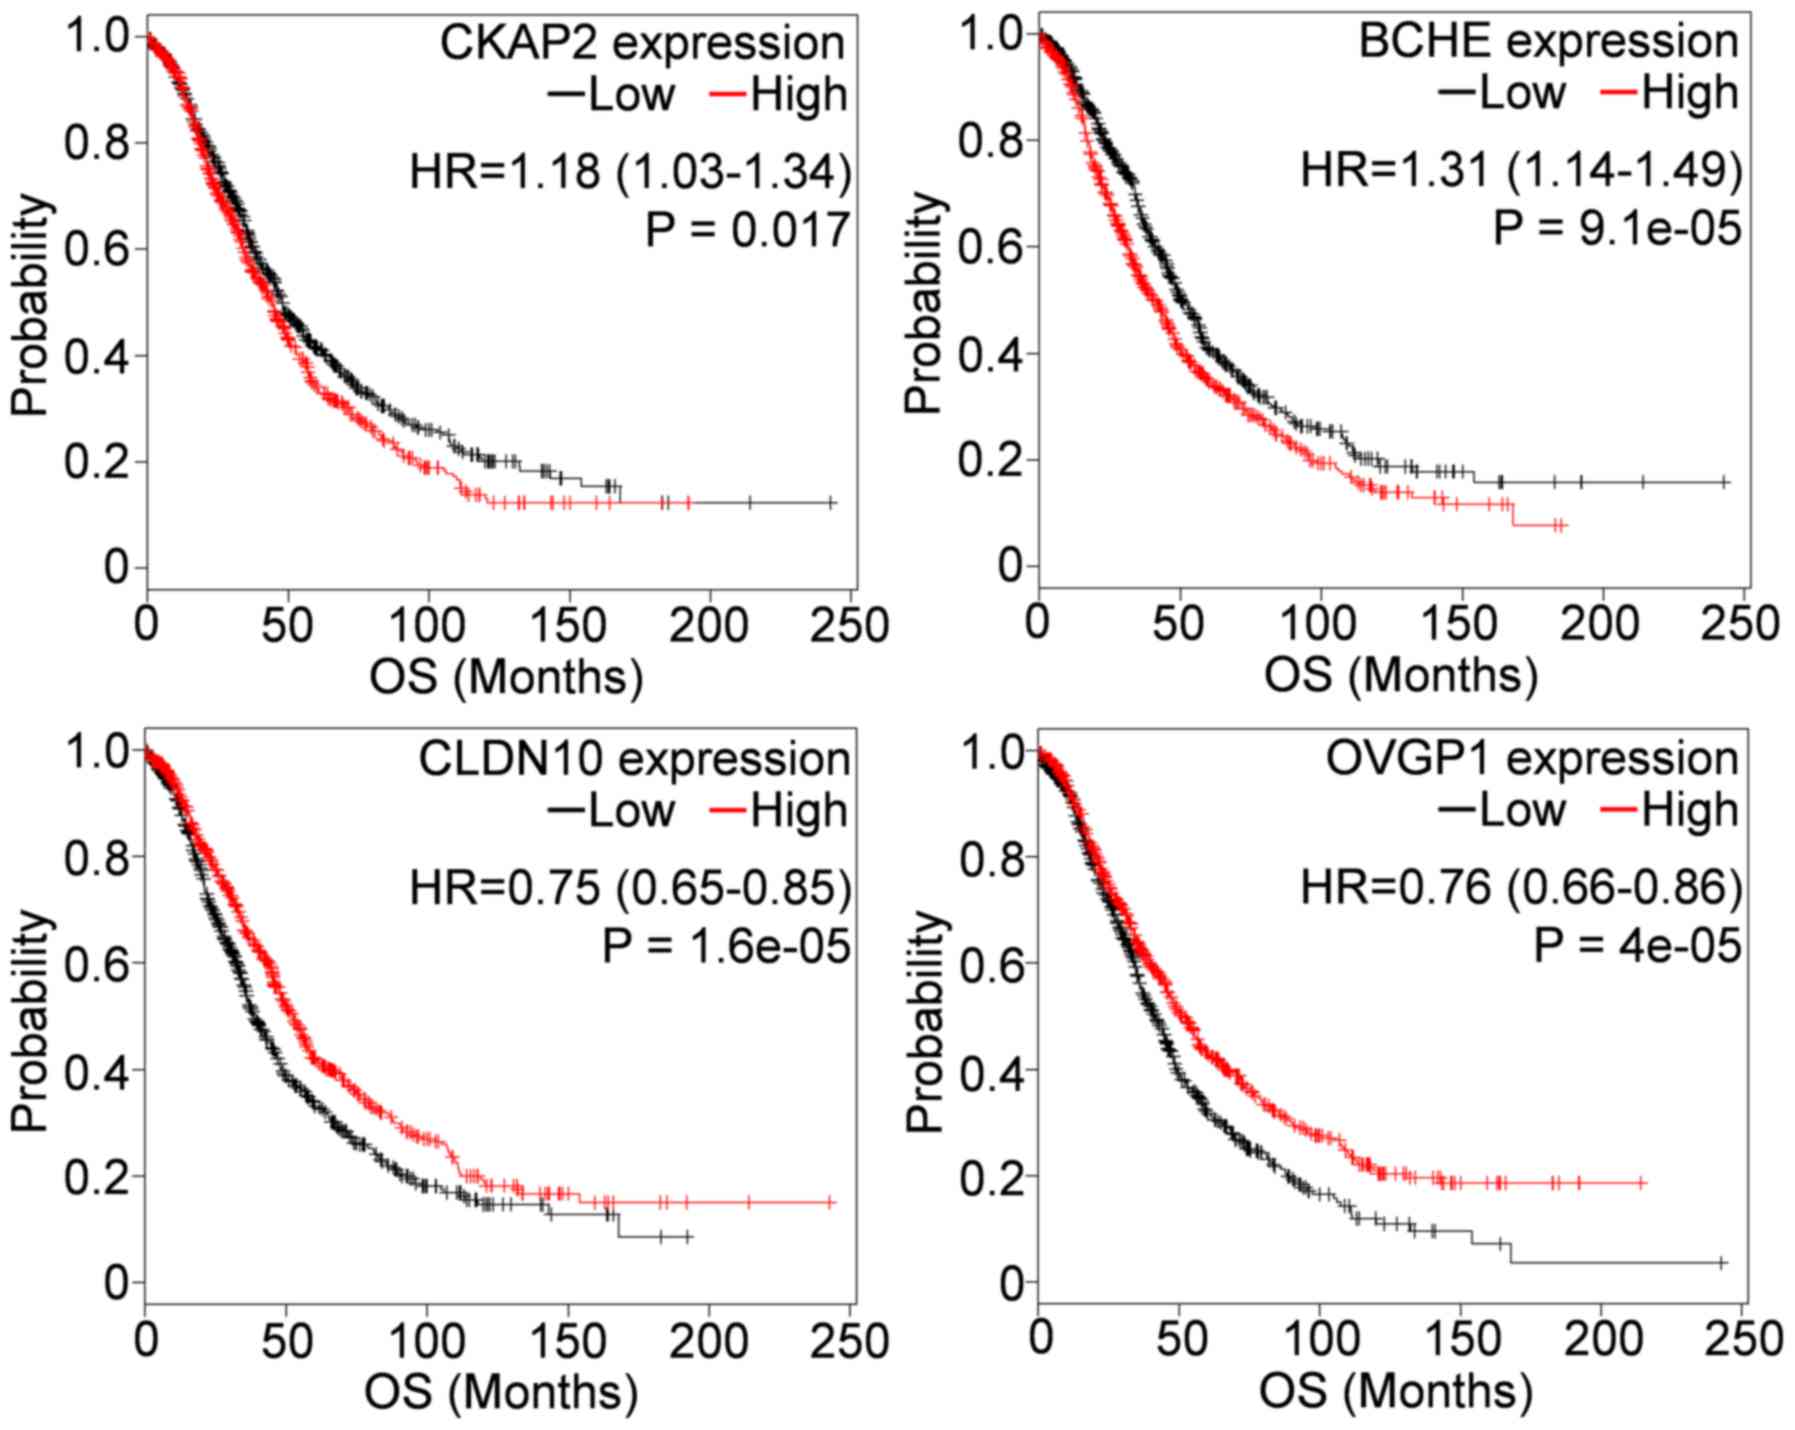
The associations of the 11 genes with OS were
further validated using KM plotter which included gene expression
data and survival information of 1287 OC patients downloaded from
GEO and TCGA ovarian data in 2012 (8), and updated to 1648 patients for the
2015 version. As shown in Fig. 1,
among the 11 genes, CKAP2, BCHE, CLDN10 and
OVGP1 were consistently associated with OS when the number
of patients increased from 489 in TCGA cohort to 1583 in KM plotter
(Table I and Fig. 1). Of these, upregulation of
CKAP2, and downregulation of CLDN10 and OVGP1
were associated with shorter OS, whereas downregulation of
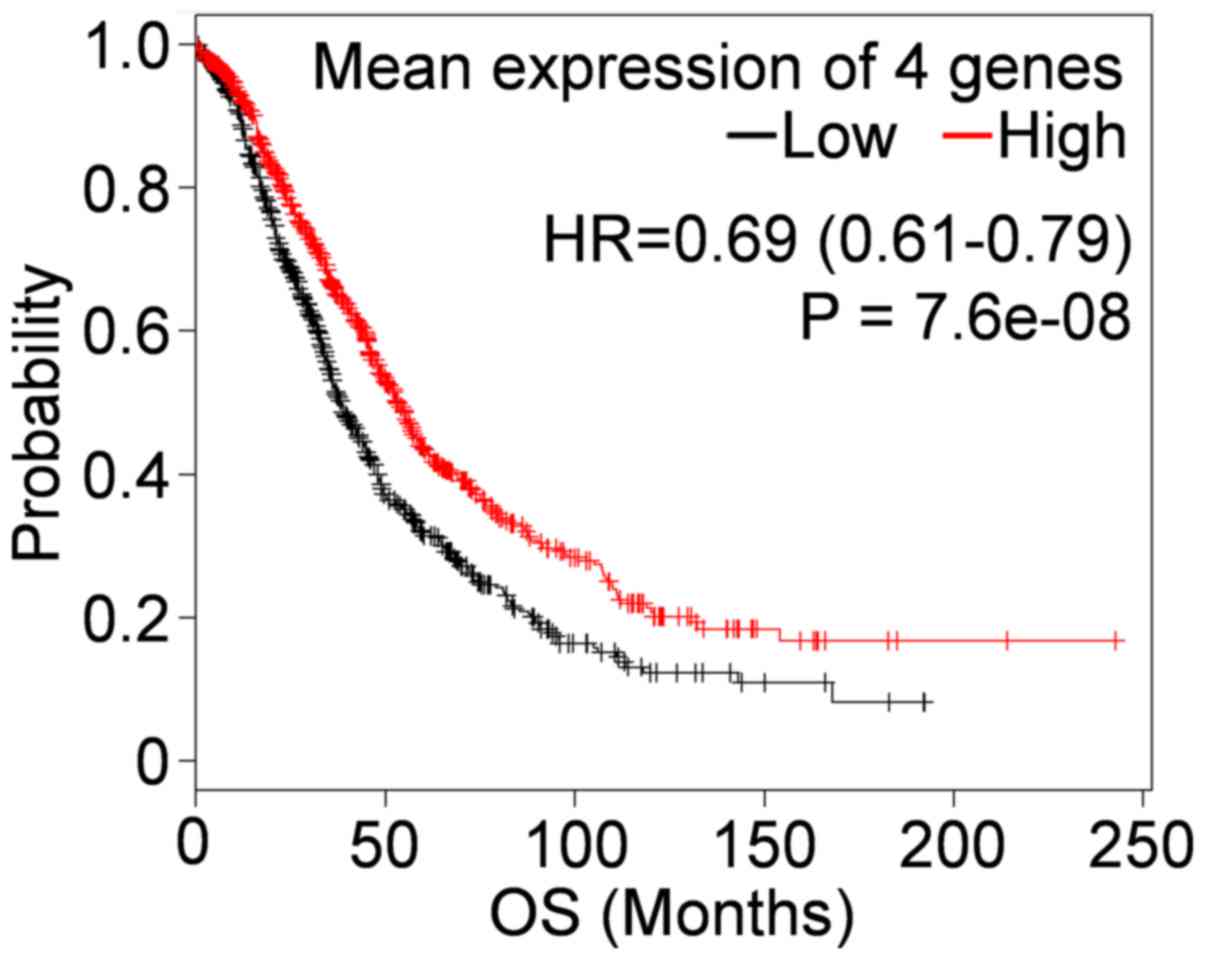
BCHE was associated with longer OS. When the four genes were
combined, we found that their mean expression in combination was
greatly more associated with OS than any of the genes used
separately (Fig. 2).
Verification of genes associated with
OS in OC patients treated with different chemotherapy regimens
As shown in Table
III, in subgroups of patients treated with different regimens,
we found that the high expression of CKAP2 was associated
with shorter OS in 752 patients treated with taxol-based regimens,
and in 763 treated with regimens containing both platin and taxol,
but the association was not significant in 1364 patient treated
with only platins; downregulation of BCHE predicts a longer
OS in patients treated with platin, but not in patients treated
with taxols or taxols with platin; downregulation of CLDN10
was associated with shorter OS in patients treated with platin or
platin with taxol, but not in the taxol-only group, and
downregulation of OVGP1 predicted a shorter OS in all three
subgroups of ovarian patients treated with different regimens.
| Table III.Four genes were associated with
overall survival in subgroups of ovarian patients treated with
different chemotherapy regiments, as determined by KM plotter. |
Table III.
Four genes were associated with
overall survival in subgroups of ovarian patients treated with
different chemotherapy regiments, as determined by KM plotter.
|
| Chemotherapy
containing (no. of patients) |
|---|
|
|
|
|---|
|
| Platin (1364) | Taxol (780) | Platin and taxol
(763) |
|---|
|
|
|
|
|
|---|
| Gene | HR (95% CI) | P-value | HR (95% CI) | P-value | HR (95% CI) | P-value |
|---|
| CKAP2 | 1.09
(0.94–1.26) | 0.27 | 1.24
(1.02–1.5) | 0.033 | 1.24
(1.01–1.51) | 0.037 |
| BCHE | 1.26
(1.09–1.46) | 0.0017 | 1.19
(0.97–1.44) | 0.088 | 1.19
(0.97–1.45) | 0.091 |
| CLDN10 | 0.76
(0.66–0.88) | 0.00029 | 0.82 (0.68–1) | 0.052 | 0.81
(0.67–0.99) | 0.042 |
| OVGP1 | 0.77
(0.66–0.89) | 0.00037 | 0.74
(0.61–0.91) | 0.0031 | 0.74
(0.61–0.91) | 0.0035 |
Verification of genes associated with
OS in subgroups of OC patients
The relationships between dysregulation of the four
genes (CKAP2, BCHE, CLDN10 and OVGP1)
with OS in subgroups of OC patients with different CA125 levels,
grades, stages and TP53 mutation status were further
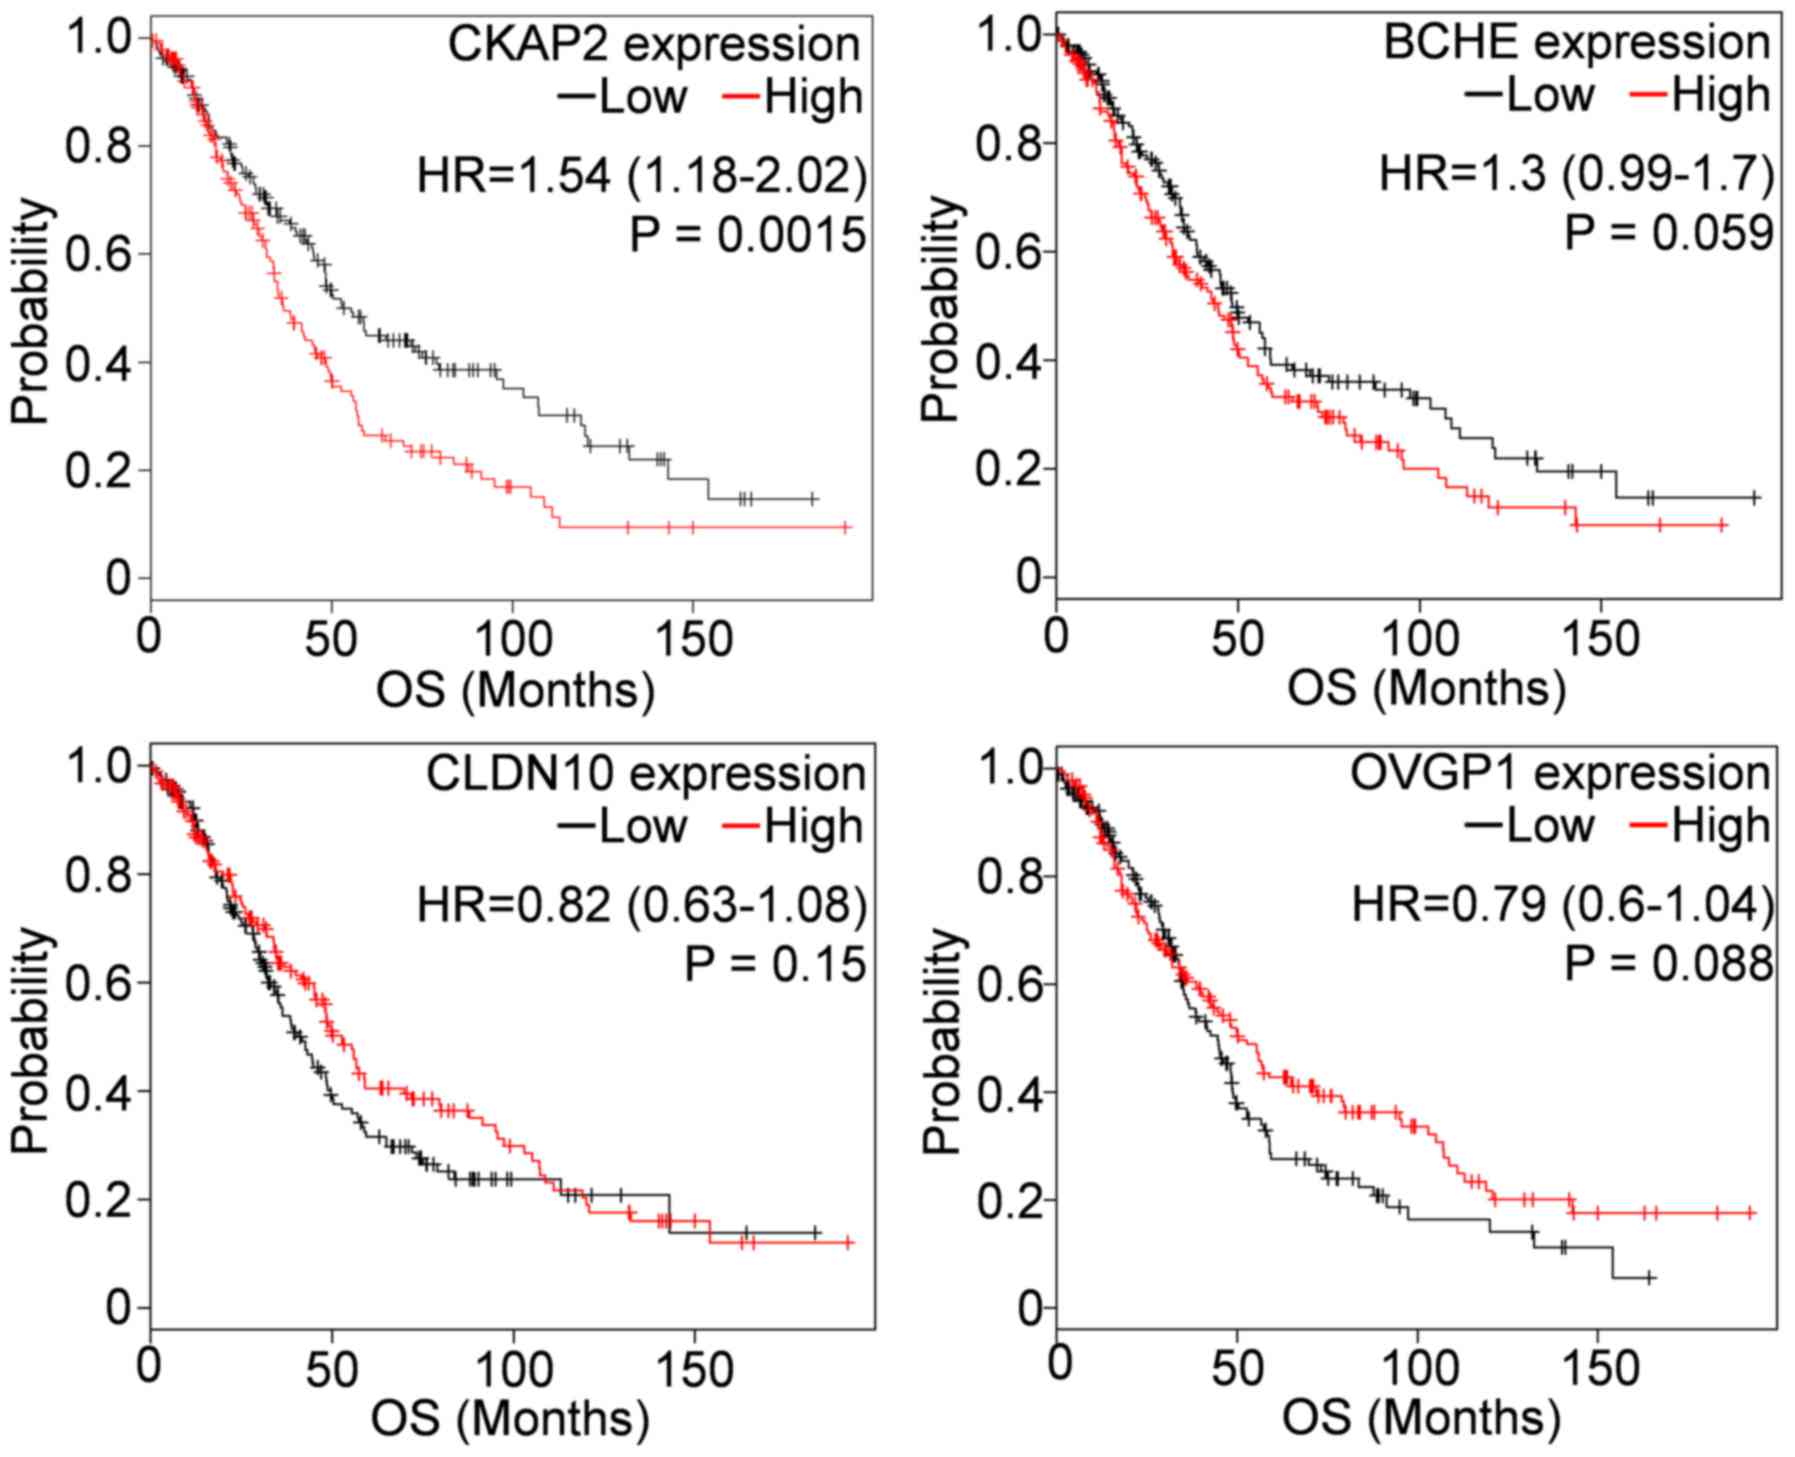
investigated. We revealed that the high CKAP2 expression
significantly associated with shorter OS in 515 OC patients having
low CA125 levels (the average CA125 below lower quartile) (Fig. 3). Besides, as shown in Table IV, all four genes were
significantly associated with OS in 968 OC patients with grade 3
disease, but only BCHE and OVGP1 were associated with
OS in 371 patients with grade 1–2 disease. CLDN10 and
OVGP1 were associated with OS in 1148 patients with stage
III–IV OC, but none of the genes was associated with OS in 133
patients with stage I–II OC. In the subgroup of 439 patients with
TP53 mutation, downregulation of OVGP1 predicted
shorter OS, whereas downregulation of CLDN10 predicted
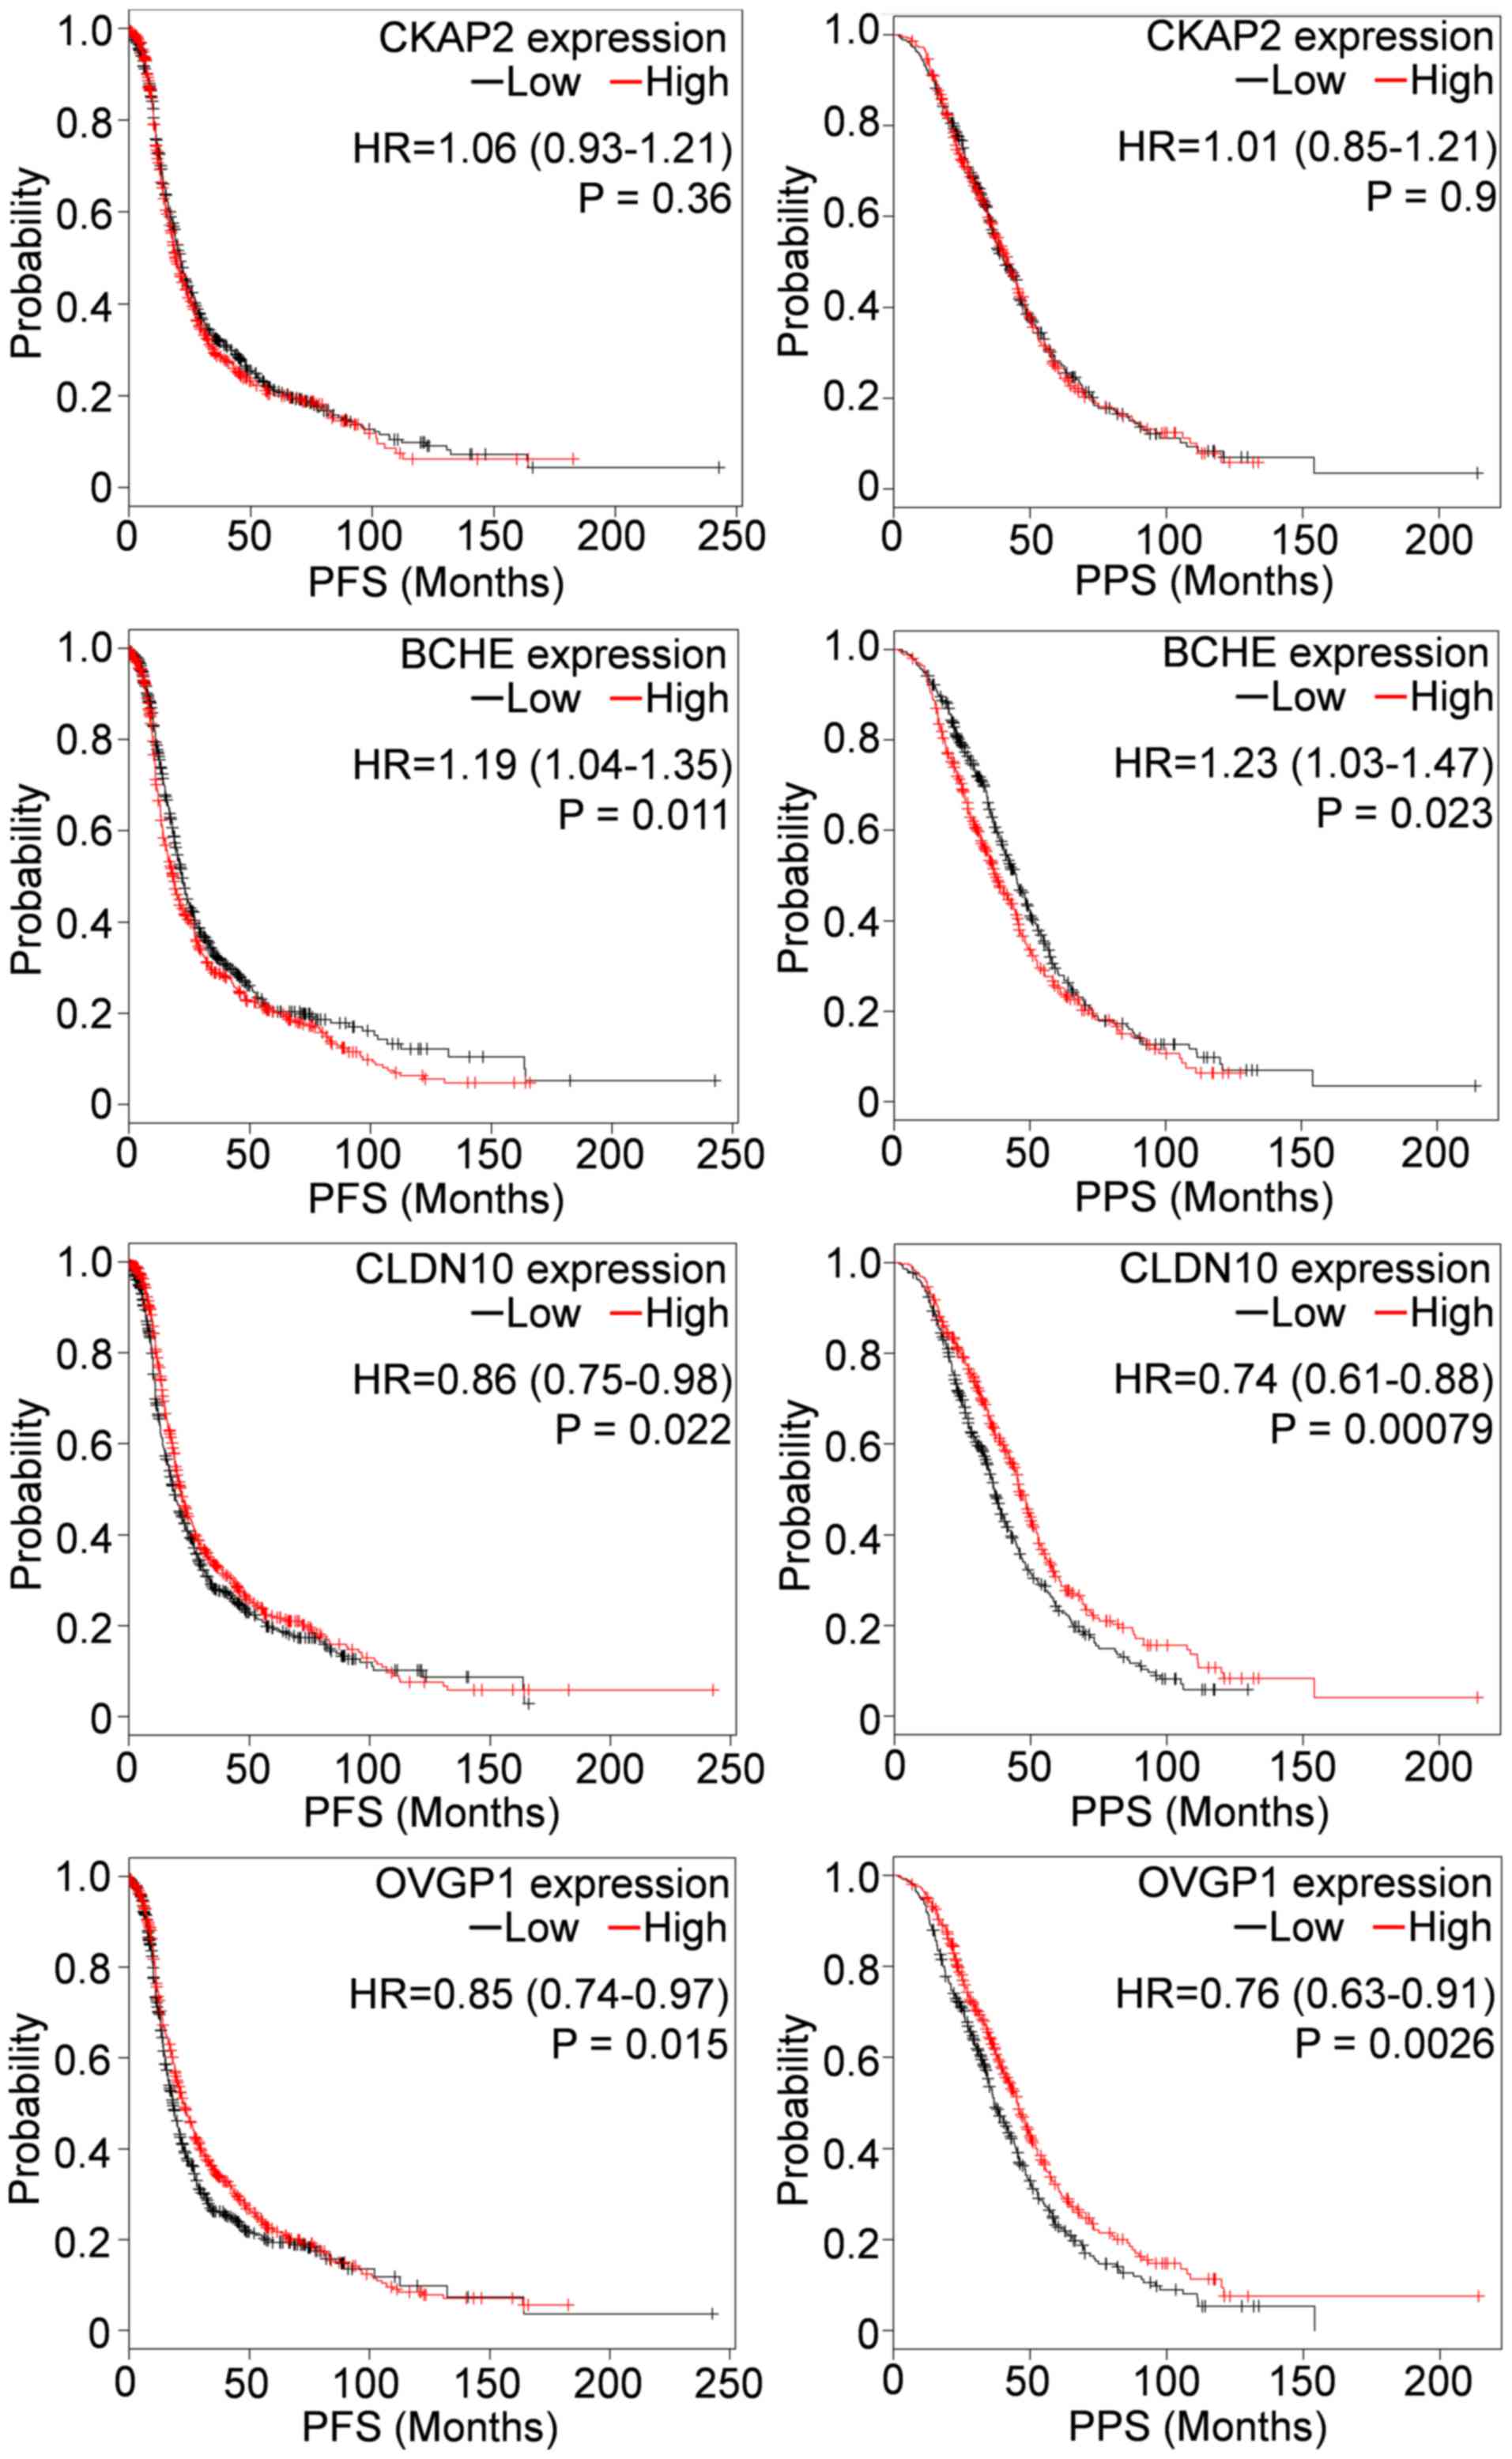
shorter OS in the TP53 wild-type group. In addition,
downregulation of BCHE was associated with longer PFS and
PPS in cohorts of 1307 and 708 patients, respectively; whereas
downregulation of CLDN10 and OVGP1 were associated
with shorter PFS and PPS (Fig.
4).
| Table IV.The four genes were associated with
overall survival in subgroups of ovarian patients with different
grades, stages and TP53 mutation status, as determined by KM
plotter. |
Table IV.
The four genes were associated with
overall survival in subgroups of ovarian patients with different
grades, stages and TP53 mutation status, as determined by KM
plotter.
|
|
| CKAP2 | BCHE | CLDN10 | OVGP1 |
|---|
|
|
|
|
|
|
|
|---|
| Subgroup | No. of
patients | HR (95% CI) | P-value | HR (95% CI) | P-value | HR (95%CI) | P-value | HR (95%CI) | P-value |
|---|
| Grade |
|
|
|
|
|
|
|
|
|
|
I–II | 371 | 1.22
(0.91–1.64) | 0.18 | 1.73
(1.28–2.34) | 0.00026 | 0.78
(0.58–1.04) | 0.091 | 0.58
(0.43–0.78) | 0.00027 |
|
III | 968 | 1.21
(1.02–1.43) | 0.032 | 1.20
(1.01–1.42) | 0.04 | 0.75
(0.63–0.89) | 0.00088 | 0.80
(0.67–0.95) | 0.011 |
| Stage |
|
|
|
|
|
|
|
|
|
|
I–II | 133 | 1.36
(0.61–3.01) | 0.45 | 1.04
(0.47–2.31) | 0.92 | 0.90
(0.41–1.97) | 0.78 | 0.70
(0.32–1.55) | 0.38 |
|
III–IV | 1148 | 1.1
(0.94–1.29) | 0.22 | 1.13
(0.97–1.32) | 0.12 | 0.84
(0.72–0.98) | 0.024 | 0.73
(0.62–0.85) | 8.0e-5 |
| TP53 |
|
|
|
|
|
|
|
|
|
|
Wild | 86 | 0.99
(0.55–1.78) | 0.97 | 2.0
(1.09–3.66) | 0.023 | 0.78
(0.43–1.39) | 0.4 | 0.8
(0.44–1.43) | 0.45 |
|
Mutation | 439 | 1.02
(0.79–1.31) | 0.9 | 1.12
(0.87–1.44) | 0.37 | 0.85
(0.66–1.09) | 0.2 | 0.75
(0.58–0.96) | 0.024 |
Clinical importance of the
analysis
The four OS-related genes, CKAP2,
BCHE, CLDN10 and OVGP1, with clinical
characteristics such as tumor stage, histological grade, and
primary therapy outcome were checked in the TCGA cohort (n=489). As
shown in Table V, BCHE and
OVGP1 were closely associated with primary therapy outcomes.
Downregulation of BCHE was associated with good complete
response, whereas downregulation of OVGP1 was associated
with poor complete response. Besides, downregulation of BCHE
was associated with lower tumor stage, in particular, stage II.
Only CLDN10 was associated with platinum status; its
downregulation might predict drug resistance. The 4 genes were not
significantly associated with histological grade in this
analysis.
| Table V.Correlation between gene expression
and the clinicopathological characteristics of 489 patients with
ovarian cancer in TCGA cohort. |
Table V.
Correlation between gene expression
and the clinicopathological characteristics of 489 patients with
ovarian cancer in TCGA cohort.
|
|
| CKAP2 | BCHE | CLDN10 | OVGP1 |
|---|
|
|
|
|
|
|
|
|---|
|
Characteristics | No. of patients
(%) | High n (%) | Low n (%) | High P-value | Low n (%) | High n (%) | P-value | High n (%) | Low n (%) | P-value | High n (%) | Low n (%) | P-value |
|---|
| Primary therapy
outcome | 395 (100) |
|
| 0.451 |
|
| 0.005 |
|
| 0.521 |
|
| 0.012 |
| Complete
response | 276 (69.9) | 142 (51.4) | 134 (48.6) |
| 127 (46.0) | 149 (54.0) |
| 149 (54.0) | 127 (46.0) |
| 148 (53.6) | 128 (46.4) |
| Partial
response | 57 (14.4) | 23 (40.4) | 34 (59.6) |
| 37 (64.9) | 20 (35.1) |
| 25 (43.9) | 32 (56.1) |
| 20 (35.1) | 37 (64.9) |
| Progressive
disease | 37 (9.4) | 20 (54.1) | 17 (45.9) |
| 26 (70.3) | 11 (29.7) |
| 18 (48.6) | 19 (51.4) |
| 12 (32.4) | 25 (67.6) |
| Stable disease | 25 (6.3) | 12 (48.0) | 13 (52.0) |
| 12 (48.0) | 13 (52.0) |
| 12 (48.0) | 13 (52.0) |
| 11 (44.0) | 14 (56.0) |
| Tumor stage | 484 (100.0) |
|
| 0.110 |
|
| 0.013 |
|
| 0.094 |
|
| 0.602 |
| II | 24 (5.0) | 13 (54.2) | 11 (45.8) |
| 5 (20.8) | 19 (79.2) |
| 17 (70.8) | 7 (29.2) |
| 10 (41.7) | 14 (58.3) |
|
III | 381 (78.7) | 198 (52.0) | 183 (48.0) |
| 197 (51.7) | 184 (48.3) |
| 184 (48.3) | 197 (51.7) |
| 193 (50.7) | 188 (49.3) |
| IV | 79 (16.3) | 31 (39.2) | 48 (60.8) |
| 38 (48.1) | 41 (51.9) |
| 41 (51.9) | 38 (48.1) |
| 37 (46.8) | 42 (53.2) |
| Platinum
status | 287 (100) |
|
| 0.377 |
|
| 0.079 |
|
| 0.017 |
|
| 0.153 |
|
Resistance | 90 (31.4) | 45 (50.0) | 45 (50.0) |
| 49 (54.4) | 41 (45.6) |
| 36 (40.0) | 54 (60.0) |
| 50 (55.6) | 40 (44.4) |
|
Sensitive | 197 (69.6) | 93 (47.2) | 104 (52.8) |
| 88 (44.7) | 109 (55.3) |
| 107 (54.3) | 90 (45.7) |
| 95 (48.2) | 102 (51.8) |
Possible associations with drug
resistance
The four genes, CKAP2, BCHE,
CLDN10 and OVGP1, were dysregulated in
platinum-resistant OC cells, as determined using microarray data
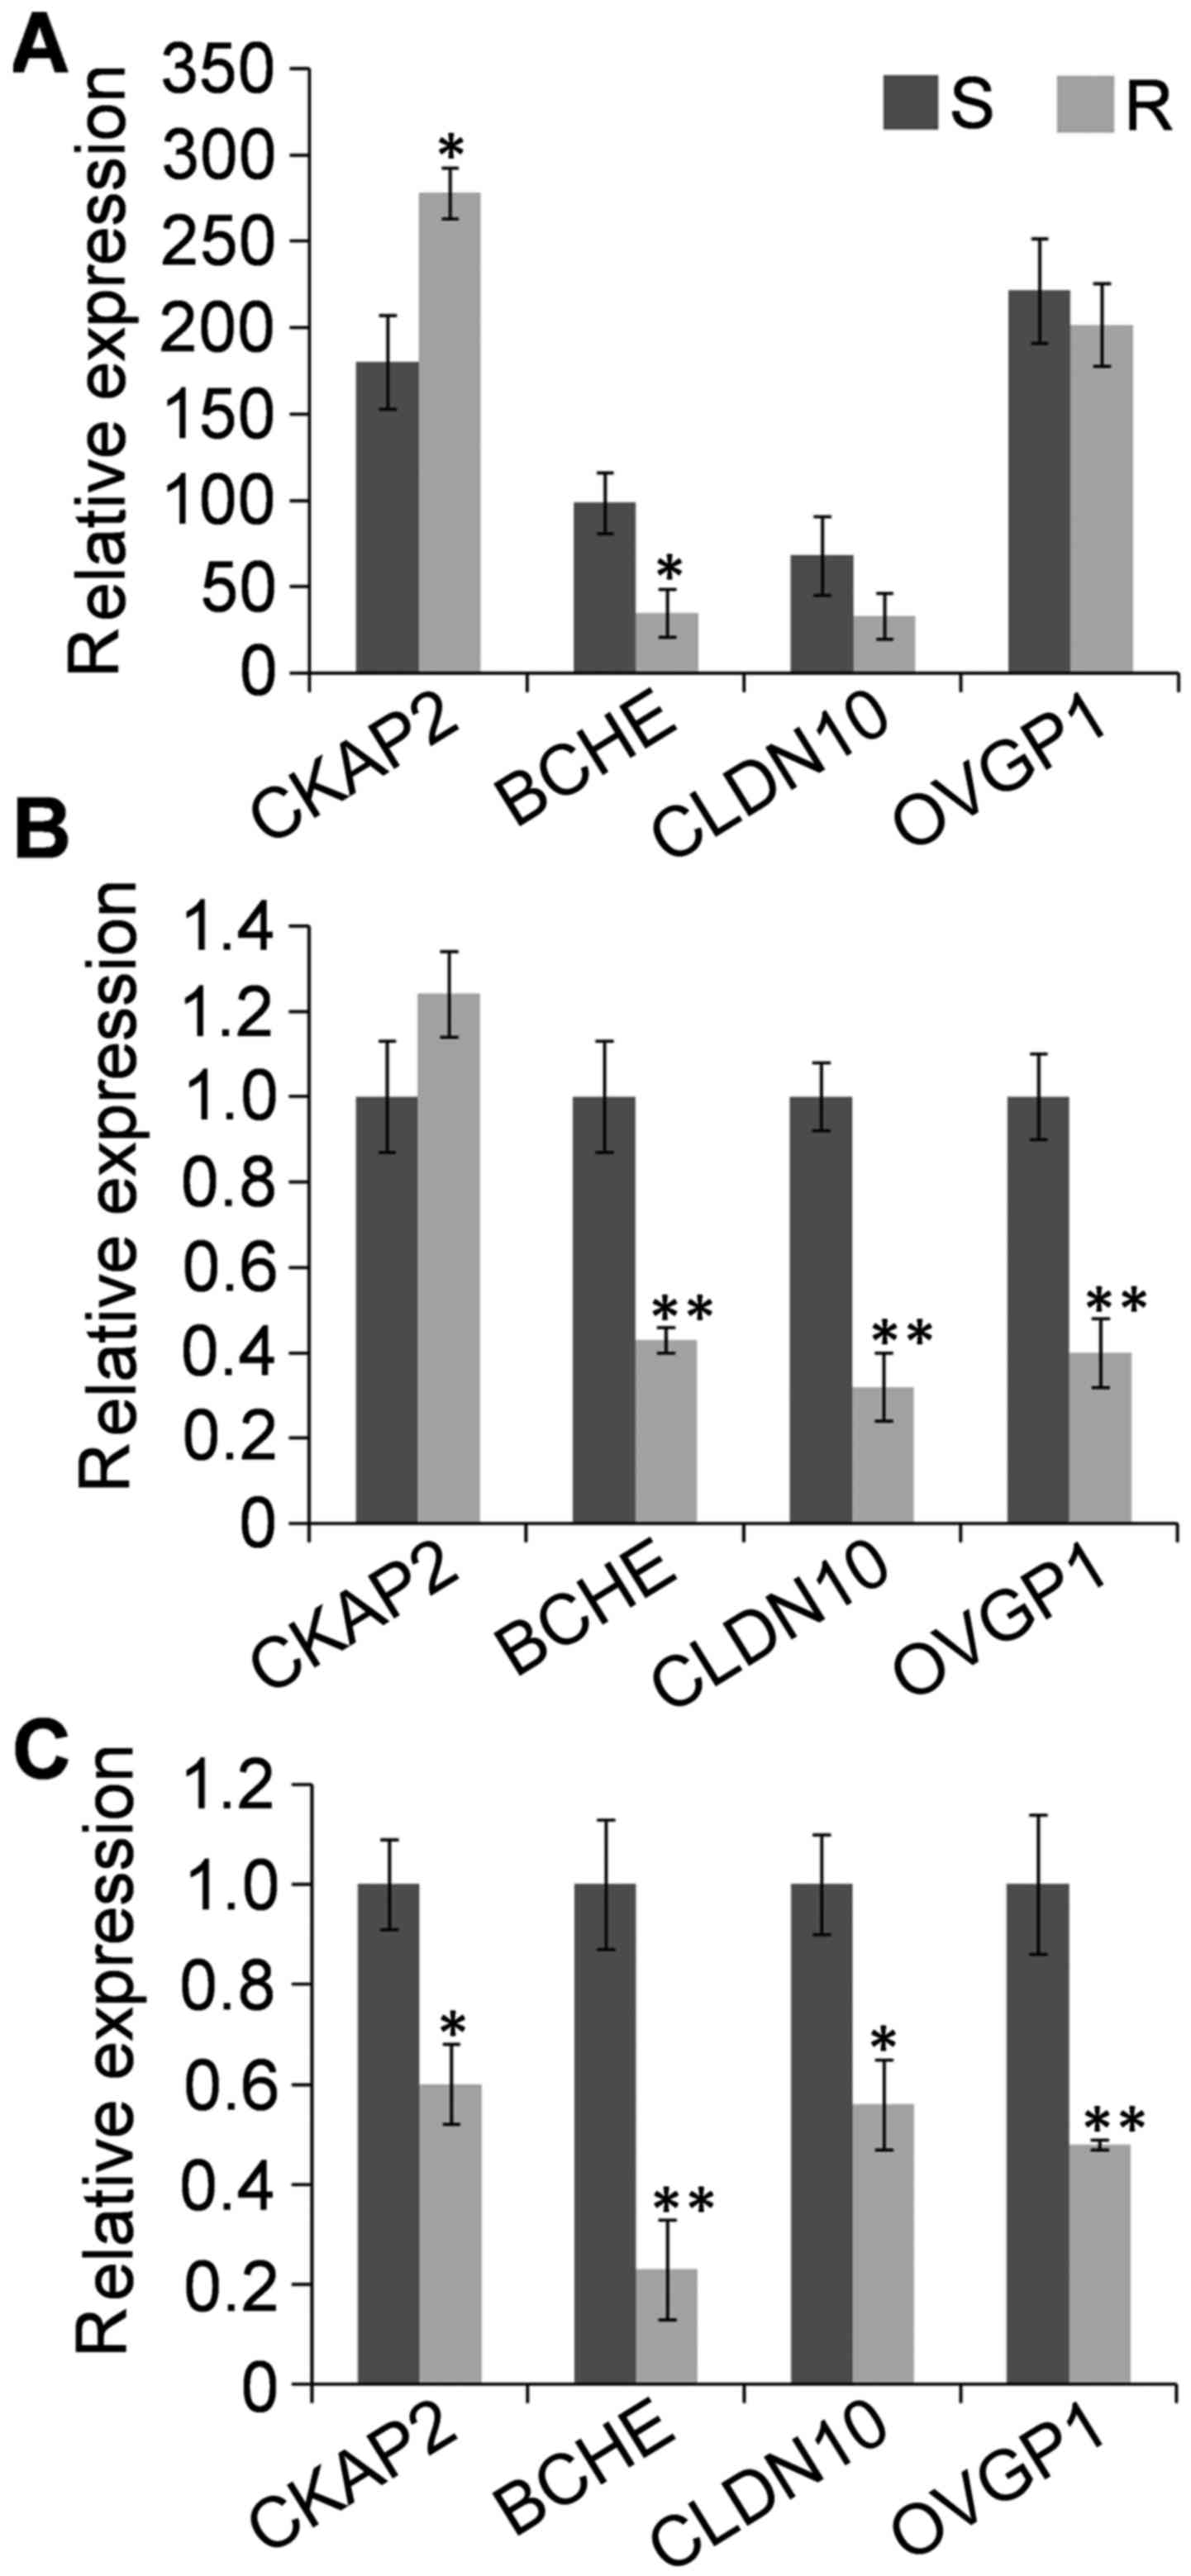
retrieved from GEO Profiles and RT-qPCR analysis (Fig. 5). Compared with their expression in
sensitive cells, expression of CKAP2 was increased in
cisplatin-resistant cells, but decreased in carboplatin-resistant
cells; BCHE, CLDN10 and OVGP1 all were
decreased in cisplatin- and carboplatin-resistant cells, although
the changes in CLDN10 and OVGP1 were not significant
in one analysis (Fig. 5A).
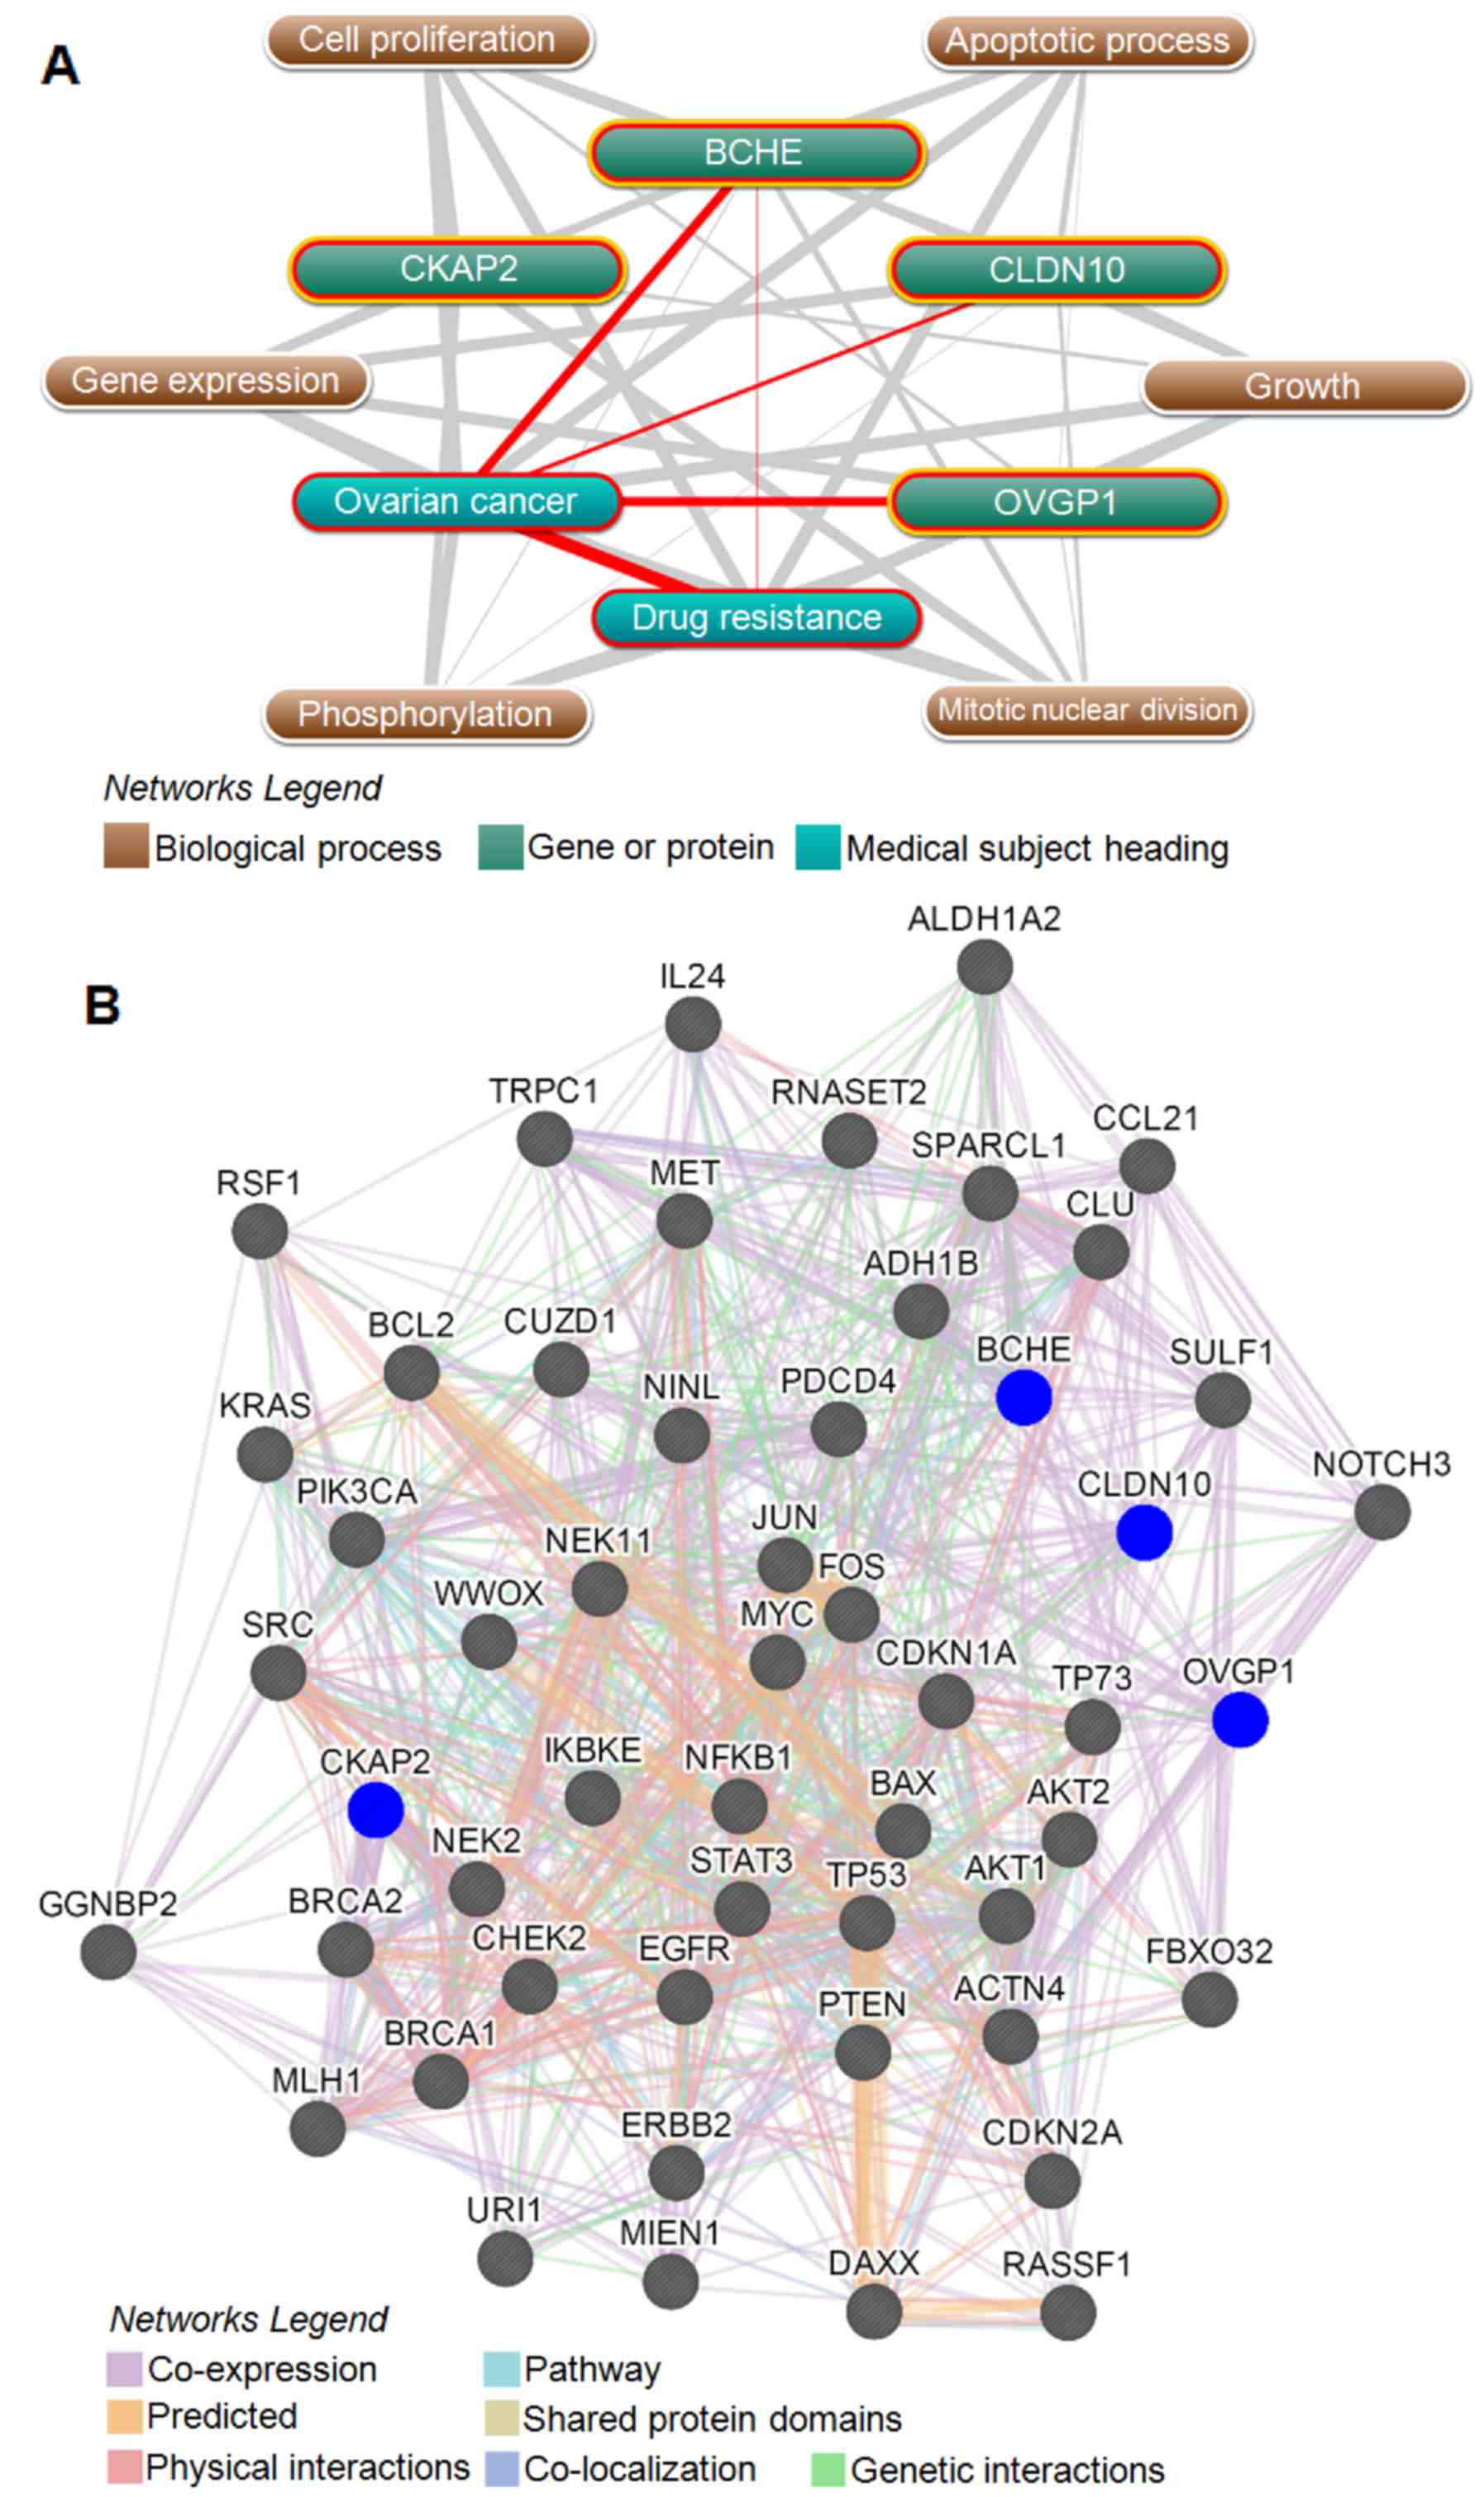
Bioinformatics analyses were performed to further
explain the associations of the four genes with drug resistance in
OC. As shown in Fig. 6A, text
mining indicated that BCHE had direct associations with drug
resistance and OC, and all the four genes were indirectly
associated with drug resistance and OC through six biological
processes (P<0.05), including cell proliferation, apoptosis,
mitotic nuclear division, phosphorylation, growth and gene
expression. We further generated a protein/gene interaction network
for the four genes and their products with 49 drug-resistance
proteins/genes in OC, which including 15 tumor suppressors
(19): BRCA1, BRCA2, CHEK2, FBXO32,
MLH1, SULF1, IL24, CDKN2A, CDKN1A, TP53, TP73, PDCD4, PTEN, RASSF1
and WWOX, 25 oncoproteins (20):
ACTN4, AKT1, AKT2, BAX, BCL2, MIEN1, CLU, CUZD1, DAXX, EGFR, ERBB2,
FOS, JUN, IKBKE, KRAS, MET, MYC, NFKB1, NINL, NOTCH3, PIK3CA, RSF1,
SRC, STAT3 and URI1, NEK2 (21),
NEK11 (22), TRPC1 (12), CCL21 and SPARCL1 (23), GGNBP2 and RNASET2 (7), ALDH1A2 and ADH1B (17). As shown in Fig. 6B, CKAP2, BCHE, CLDN10 and OVGP1 had
direct and indirect interactions with all of the 49 drug-resistant
proteins/genes, and directly interacted with 11, 23, 19 and 13 of
those 49 proteins/genes, respectively. The four genes and their
products also directly interacted with each other, with
OVGP1 and BCHE both directly interacting with
CKAP2 and CLDN10.
Discussion
Biomarkers not only have prognostic implications,
but are also helpful in monitoring treatment responses,
surveillance for tumor recurrence and guidance of clinical
decisions (24). Long-term survival
of OC patients remains very poor as a result of recurrence and
emergence of drug resistance, and the 5-year survival rates is only
~40% (2). Thus, prognostic
biomarkers for OC patients are particularly necessary and crucial,
and there is ongoing search for predictive biomarkers. In the
present study, we identified a group of genes significantly
associated with OS in 489 OC patients from a TCGA cohort (Table I), of which BCHE,
CRISP3, LYVE1 and OVGP1 were identified as
independent risk prognostic factors for OS (Table II). Four genes (CKAP2,
BCHE, CLDN10 and OVGP1) were consistently
associated with OS when the number of patients increased from 489
to 1583 (Fig. 1). Of these,
upregulation of CKAP2, and downregulation of CLDN10
and OVGP1 were associated with shorter OS, whereas
downregulation of BCHE was associated with longer OS. With
the exception of CKAP2, the other three genes all were
significantly related to PFS and PPS, with decreased BCHE
expression associated with longer PFS and PPS in 1307 and 708 OC
patients, respectively; and decreased expression of CLDN10
and OVGP1 were associated with shorter PFS and PPS (Fig. 4). In subgroups of patients with OC,
we further verified that downregulation of OVGP1 was
significantly associated with shorter OS in all OC subgroups,
including the 752 patients treated with chemotherapy regimens that
contained taxol, 763 treated with both platin and taxol, 1364
treated with platin, 371 patients with grade 1–2 disease, 968 with
grade 3 disease, 1148 with stage III–IV disease, and 439 with TP53
mutations (Tables III and
IV). All these results together
suggest that CKAP2, BCHE, CLDN10 and
OVGP1, (especially OVGP1), are potential biomarkers
for predicting OS in OC.
The relationship between these genes and prognosis
in OC is poorly studied. Upregulation of chromatin CKAP2 is
an independent prognostic marker for shorter relapse-free survival
in early-stage breast cancer (25),
and for significantly worse prognoses in male patients with T1-2
gastric cancer (26).
Downregulation of CLDN10 indicates shorter OS in some
patients with lung adenocarcinoma (27). All these reports were consistent
with our findings in this study. However, low levels of
preoperative serum BCHE were validated as an independent
negative prognostic factor for prostate cancer patients who undergo
radical prostatectomy (28), and a
predictor of shorter OS and DFS in patients with muscle-invasive
bladder cancer who undergo radical cystectomy (29). These results were contrary to our
findings that downregulation of BCHE was associated with
longer OS. The associations of the four genes with OS in OC is
rare, with only one study reporting that the downregulation of
BCHE predicts a longer OS in OC patients, which was also
based on the analysis of data in the TCGA cohort (30).
Serum CA125 is widely used to distinguish malignant
from benign pelvic masses, to monitor response to treatment, to
assess prognosis and to detect disease recurrence. Low levels of
CA125 are normally an optimistic indicator of OC progression and
prognosis. For example, preoperative CA125 <65 U/ml correlates
with longer survival in OC patients (31); CA125 <50 U/ml correlates with
significantly longer DFS and OS in patient with borderline ovarian
tumors (32). However, no data are
available that further predicts OS in subgroups of patients with
low levels of CA125. CKAP2 expression was significantly associated
with shorter OS in 515 OC patients who had low CA125 levels (the
average CA125 below lower quartile) (Fig. 3), which suggests that this gene
could be used for prognosis prediction with CA125. However, this
study measured tissue levels of CA125, whereas the FDA-approved
test for OC is serum-based (8).
Associations between CKAP2 and OS in patients with low CA125
levels should be further studied.
The relationships of the four genes with drug
resistance in cancer has not been widely reported. In the present
study, we found that CKAP2, BCHE, CLDN10 and
OVGP1 all were significantly dysregulated in cisplatin- and
carboplatin-resistant cells (Fig.
5). Text mining indicated that the four genes were directly and
indirectly associated with drug resistance through several
biological processes. A protein/gene interaction network indicated
that the four genes interacted with 49 drug-resistant
proteins/genes in OC. In particular, BCHE and CLDN10
directly interacted with 23 and 19 of those 49 proteins/genes
(Fig. 6). Downregulation of
CLDN10 was also an indicator of drug resistance, and
downregulation of OVGP1 was significantly associated with
poor complete response (Table IV).
All these results imply that dysregulation of the four genes
affects drug resistance in OC. Furthermore, among patients treated
with different regimens, high expression of CKAP2 was
associated with shorter OS in patients treated with
taxol-containing regimens, whereas downregulation of BCHE
was associated with OS in patient treated by regimens without
taxol; downregulation of CLDN10 was associated with shorter
OS in patients treated with platin, and downregulation of
OVGP1 predicted a shorter OS in patients treated with either
platin or taxol (Table III).
These results indicated that CKAP2 is associated with taxol
resistance, BCHE and CLDN10 with platin resistance,
and OVGP1 with both platin and taxol resistance.
The roles of CKAP2, BCHE,
CLDN10 and OVGP1 in OC have rarely been studied. We
previously reported that CKAP2 was upregulated, and
BCHE, CLDN10 and OVGP1 were downregulated in
OC, by a 4.26, −8.39, −7.04 and −102.95-fold changes, respectively
(17). Downregulation of
OVGP1 in OC was recently confirmed in a study that showed
the protein to be less abundant in high-grade serous ovarian tumor
fluids (malignant) than in benign serous cystadenoma tumor fluids
(33). CLDN10 mRNA was
specifically detected in five cancerous ovaries compared with three
normal controls in experimental hens, which suggests that
CLDN10 is a novel biomarker for detecting OC in chickens
(34); however, its association
with human OC was not discussed.
In summary, we identified 11 genes significantly
related to OS in 489 OC patients. Of these, BCHE,
CRISP3, LYVE1 and OVGP1 were identified as
independent risk prognostic factors. Four genes CKAP2,
BCHE, CLDN10, and particularly the OVGP1, were
remarkably associated with OS in total of 1583 OC patients, and
combination of these genes had much better prediction potential.
Besides, comprehensive analysis indicated that CKAP2,
BCHE, CLDN10 and OVGP1 might contribute to
drug resistance in OC. This study has implicated genes that might
be both prognostic markers and potential therapeutic targets to
pursue in the treatment of ovarian cancer.
Acknowledgements
This study was supported by the National Natural
Science Foundation of China (grant nos. 81302283, 81560424,
81660606 and 81460397), the China Postdoctoral Science Foundation
(nos. 2014M552535XB and 2014M552291), the Natural Science
Foundation of Guangxi (nos. 2014GXNSFCA118010, 2015GXNSFBA139115,
2015GXNSFAA139151 and 2014GXNSFBA118155).
References
|
1
|
Coleman RL, Monk BJ, Sood AK and Herzog
TJ: Latest research and treatment of advanced-stage epithelial
ovarian cancer. Nat Rev Clin Oncol. 10:211–224. 2013. View Article : Google Scholar : PubMed/NCBI
|
|
2
|
Siegel RL, Miller KD and Jemal A: Cancer
statistics, 2016. CA Cancer J Clin. 66:7–30. 2016. View Article : Google Scholar : PubMed/NCBI
|
|
3
|
Vaughan S, Coward JI, Bast RC Jr, Berchuck
A, Berek JS, Brenton JD, Coukos G, Crum CC, Drapkin R,
Etemadmoghadam D, et al: Rethinking ovarian cancer: Recommendations
for improving outcomes. Nat Rev Cancer. 11:719–725. 2011.
View Article : Google Scholar : PubMed/NCBI
|
|
4
|
Pliarchopoulou K and Pectasides D:
Epithelial ovarian cancer: Focus on targeted therapy. Crit Rev
Oncol Hematol. 79:17–23. 2011. View Article : Google Scholar : PubMed/NCBI
|
|
5
|
Cannistra SA: Cancer of the ovary. N Engl
J Med. 351:2519–2529. 2004. View Article : Google Scholar : PubMed/NCBI
|
|
6
|
Holohan C, Van Schaeybroeck S, Longley DB
and Johnston PG: Cancer drug resistance: An evolving paradigm. Nat
Rev Cancer. 13:714–726. 2013. View Article : Google Scholar : PubMed/NCBI
|
|
7
|
Yin F, Liu L, Liu X, Li G, Zheng L, Li D,
Wang Q, Zhang W and Li L: Downregulation of tumor suppressor gene
ribonuclease T2 and gametogenetin binding protein 2 is associated
with drug resistance in ovarian cancer. Oncol Rep. 32:362–372.
2014.PubMed/NCBI
|
|
8
|
Gyorffy B, Lánczky A and Szállási Z:
Implementing an online tool for genome-wide validation of
survival-associated biomarkers in ovarian-cancer using microarray
data from 1287 patients. Endocr Relat Cancer. 19:197–208. 2012.
View Article : Google Scholar : PubMed/NCBI
|
|
9
|
Cerami E, Gao J, Dogrusoz U, Gross BE,
Sumer SO, Aksoy BA, Jacobsen A, Byrne CJ, Heuer ML, Larsson E, et
al: The cBio cancer genomics portal: An open platform for exploring
multidimensional cancer genomics data. Cancer Discov. 2:401–404.
2012. View Article : Google Scholar : PubMed/NCBI
|
|
10
|
Gao J, Aksoy BA, Dogrusoz U, Dresdner G,
Gross B, Sumer SO, Sun Y, Jacobsen A, Sinha R, Larsson E, et al:
Integrative analysis of complex cancer genomics and clinical
profiles using the cBioPortal. Sci Signal. 6:pl12013. View Article : Google Scholar : PubMed/NCBI
|
|
11
|
Edgar R, Domrachev M and Lash AE: Gene
Expression Omnibus: NCBI gene expression and hybridization array
data repository. Nucleic Acids Res. 30:207–210. 2002. View Article : Google Scholar : PubMed/NCBI
|
|
12
|
Liu X, Zou J, Su J, Lu Y, Zhang J, Li L
and Yin F: Downregulation of transient receptor potential cation
channel, subfamily C, member 1 contributes to drug resistance and
high histological grade in ovarian cancer. Int J Oncol. 48:243–252.
2016.PubMed/NCBI
|
|
13
|
Mostafavi S, Ray D, Warde-Farley D,
Grouios C and Morris Q: GeneMANIA: A real-time multiple association
network integration algorithm for predicting gene function. Genome
Biol. 9:(Suppl 1). S42008. View Article : Google Scholar : PubMed/NCBI
|
|
14
|
Warde-Farley D, Donaldson SL, Comes O,
Zuberi K, Badrawi R, Chao P, Franz M, Grouios C, Kazi F, Lopes CT,
et al: The GeneMANIA prediction server: Biological network
integration for gene prioritization and predicting gene function.
Nucleic Acids Res. 38:(Web Server). W214–W220. 2010. View Article : Google Scholar : PubMed/NCBI
|
|
15
|
Jenssen TK, Laegreid A, Komorowski J and
Hovig E: A literature network of human genes for high-throughput
analysis of gene expression. Nat Genet. 28:21–28. 2001. View Article : Google Scholar : PubMed/NCBI
|
|
16
|
Hedditch EL, Gao B, Russell AJ, Lu Y,
Emmanuel C, Beesley J, Johnatty SE, Chen X, Harnett P, George J, et
al: Australian Ovarian Cancer Study Group: ABCA transporter gene
expression and poor outcome in epithelial ovarian cancer. J Natl
Cancer Inst. 106:1062014. View Article : Google Scholar
|
|
17
|
Liu X, Gao Y, Zhao B, Li X, Lu Y, Zhang J,
Li D, Li L and Yin F: Discovery of microarray-identified genes
associated with ovarian cancer progression. Int J Oncol.
46:2467–2478. 2015.PubMed/NCBI
|
|
18
|
Li M, Balch C, Montgomery JS, Jeong M,
Chung JH, Yan P, Huang TH, Kim S and Nephew KP: Integrated analysis
of DNA methylation and gene expression reveals specific signaling
pathways associated with platinum resistance in ovarian cancer. BMC
Med Genomics. 2:342009. View Article : Google Scholar : PubMed/NCBI
|
|
19
|
Yin F, Liu X, Li D, Wang Q, Zhang W and Li
L: Tumor suppressor genes associated with drug resistance in
ovarian cancer (Review). Oncol Rep. 30:3–10. 2013.PubMed/NCBI
|
|
20
|
Liu X, Gao Y, Lu Y, Zhang J, Li L and Yin
F: Oncogenes associated with drug resistance in ovarian cancer. J
Cancer Res Clin Oncol. 141:381–395. 2015. View Article : Google Scholar : PubMed/NCBI
|
|
21
|
Liu X, Gao Y, Lu Y, Zhang J, Li L and Yin
F: Upregulation of NEK2 is associated with drug resistance in
ovarian cancer. Oncol Rep. 31:745–754. 2014.PubMed/NCBI
|
|
22
|
Liu X, Gao Y, Lu Y, Zhang J, Li L and Yin
F: Downregulation of NEK11 is associated with drug resistance in
ovarian cancer. Int J Oncol. 45:1266–1274. 2014.PubMed/NCBI
|
|
23
|
Yin F, Liu X, Li D, Wang Q, Zhang W and Li
L: Bioinformatic analysis of chemokine (C-C motif) ligand 21 and
SPARC-like protein 1 revealing their associations with drug
resistance in ovarian cancer. Int J Oncol. 42:1305–1316.
2013.PubMed/NCBI
|
|
24
|
Wong KF, Xu Z, Chen J, Lee NP and Luk JM:
Circulating markers for prognosis of hepatocellular carcinoma.
Expert Opin Med Diagn. 7:319–329. 2013. View Article : Google Scholar : PubMed/NCBI
|
|
25
|
Kim HS, Koh JS, Choi YB, Ro J, Kim HK, Kim
MK, Nam BH, Kim KT, Chandra V, Seol HS, et al: Chromatin CKAP2, a
new proliferation marker, as independent prognostic indicator in
breast cancer. PLoS One. 9:e981602014. View Article : Google Scholar : PubMed/NCBI
|
|
26
|
Kim YW, Eom BW, Kook MC, Kim HS, Kim MK,
Hwang HL, Chandra V, Poojan S, Song Y, Koh JS, et al: Clinical
implications of proliferation activity in T1 or T2 male gastric
cancer patients. Exp Mol Med. 47:e1932015. View Article : Google Scholar : PubMed/NCBI
|
|
27
|
Zhang Z, Wang A, Sun B, Zhan Z, Chen K and
Wang C: Expression of CLDN1 and CLDN10 in lung adenocarcinoma in
situ and invasive lepidic predominant adenocarcinoma. J
Cardiothorac Surg. 8:952013. View Article : Google Scholar : PubMed/NCBI
|
|
28
|
Koie T, Ohyama C, Hatakeyama S, Imai A,
Yoneyama T, Hashimoto Y, Yoneyama T, Tobisawa Y, Hosogoe S,
Yamamoto H, et al: Significance of preoperative
butyrylcholinesterase as an independent predictor of biochemical
recurrence-free survival in patients with prostate cancer treated
with radical prostatectomy. Int J Clin Oncol. 21:379–383. 2016.
View Article : Google Scholar : PubMed/NCBI
|
|
29
|
Koie T, Ohyama C, Yamamoto H, Hatakeyama
S, Imai A, Yoneyama T, Hashimoto Y, Kitayam M and Hirota K:
Significance of preoperative butyrylcholinesterase as an
independent predictor of survival in patients with muscle-invasive
bladder cancer treated with radical cystectomy. Urol Oncol.
32:820–825. 2014. View Article : Google Scholar : PubMed/NCBI
|
|
30
|
Willis S, Villalobos VM, Gevaert O,
Abramovitz M, Williams C, Sikic BI and Leyland-Jones B: Single gene
prognostic biomarkers in ovarian cancer: A meta-analysis. PLoS One.
11:e01491832016. View Article : Google Scholar : PubMed/NCBI
|
|
31
|
Nagele F, Petru E, Medl M, Kainz C, Graf
AH and Sevelda P: Preoperative CA 125: An independent prognostic
factor in patients with stage I epithelial ovarian cancer. Obstet
Gynecol. 86:259–264. 1995. View Article : Google Scholar : PubMed/NCBI
|
|
32
|
Tang A, Kondalsamy-Chennakesavan S, Ngan
H, Zusterzeel P, Quinn M, Carter J, Leung Y and Obermair A:
Prognostic value of elevated preoperative serum CA125 in ovarian
tumors of low malignant potential: A multinational collaborative
study (ANZGOG0801). Gynecol Oncol. 126:36–40. 2012. View Article : Google Scholar : PubMed/NCBI
|
|
33
|
Poersch A, Grassi ML, Carvalho VP,
Lanfredi GP, Palma CS, Greene LJ, de Sousa CB, Carrara HH, Dos
Candido Reis FJ and Faça VM: A proteomic signature of ovarian
cancer tumor fluid identified by highthroughput and verified by
targeted proteomics. J Proteomics. 145:226–236. 2016. View Article : Google Scholar : PubMed/NCBI
|
|
34
|
Seo HW, Rengaraj D, Choi JW, Ahn SE, Song
YS, Song G and Han JY: Claudin 10 is a glandular epithelial marker
in the chicken model as human epithelial ovarian cancer. Int J
Gynecol Cancer. 20:1465–1473. 2010.PubMed/NCBI
|