Introduction
Epidemiological studies have suggested an
association among obesity, type 2 diabetes mellitus (DM) and cancer
(1). Insulin resistance induces
hyperinsulinemia in patients with obese or early-stage type 2 DM
(2). Insulin is not only a key
regulator in carbohydrate metabolism, but also a strong mitogenic
molecule that activates the PI3K/Akt/mTOR pathway (3). Increased insulin signaling induced by
hyperinsulinemia may play a significant role in carcinogenesis and
cancer progression in patients with obesity or DM (3).
Regarding the recent increased incidence of renal
cell carcinoma (RCC) (4), it has
been reported that the association between obesity and the
incidence of RCC was stronger than that of prostate or breast
cancers (5–8). Moreover, it has also been reported
that type 2 DM is associated with the incidence of RCC (9–11), an
association that has also been observed for prostate and breast
cancer (9,10,12,13).
In contrast, regarding progression of RCC, numerous
epidemiological studies have provided strong evidence that the
prognosis of obese patients with RCC is better than that of
non-obese patients, a finding that has been called the ‘obese
paradox’ in RCC (14–21). However, the prognosis of obese
patients has been reportedly poor in prostate cancer (22–24),
and not different from that of non-obese patients in breast cancer
(25,26). There appears to be an inverse
relationship between cancer incidence and progression in patients
with RCC. Recent studies have shown a positive relationship between
pre-existing type 2 DM and poor RCC prognosis (27), or no significant relationship
(28). It is plausible that the
insulin-signaling pathway activated by hyperinsulinemia may play a
significant role in the progression and ‘obese paradox’ of RCC.
Previous studies have shown that insulin receptor
(IR) expression is higher in RCC tumors than that in normal
proximal convoluted tubules (29)
and was inversely associated with the Fuhrman's grade (30). In breast cancer, IR expression has
been reported to be positively (31) or negatively (32,33)
associated with cancer progression. Phosphorylation of insulin-like
growth factor 1 receptor (IGF1R/IR), detected by
immunohistochemistry (31), and a
high fasting serum insulin level (34,35)
have been associated with poor prognosis in breast cancer. In
prostate cancer, IR expression and serum C-peptide levels have been
associated with histological grade and cancer-specific survival,
respectively (36,37). In a murine xenograft model of
prostate cancer, hyperinsulinemia induced by a high-carbohydrate
diet was found to be associated with cancer progression and
activation of insulin-signaling pathways (38). However, there have been no reports
of animal studies investigating the role of hyperinsulinemia, IR
expression and downstream signaling pathways in the progression of
RCC.
In the present study, we investigated the role of
hyperinsulinemia, IR expression and insulin signaling in RCC
progression. Initially, we evaluated the relationship among IR
expression, the serum C-peptide level, and cancer prognosis in
patients with RCC who underwent nephrectomy. We then explored the
role of insulin signaling in a murine RCC allograft model in obese,
hyperglycemic and hyperinsulinemic mice induced by a
high-carbohydrate diet. Furthermore, we used biguanide metformin,
which is a common anti-type 2 diabetes agent, to investigate
whether the indirect effect of metformin on the decrease of serum
insulin levels (3) inhibits murine
RCC progression.
Materials and methods
Patients and immunohistochemistry
A total of 99 patients who underwent nephrectomy for
RCC from February 2007 to June 2011 were included in the
immunohistochemical analysis. Fifteen and 84 patients underwent
partial and radical nephrectomy, respectively. The characteristics
of the patients are presented in Table
I. All patients provided written informed consent and the study
protocols regarding immunohistochemical analyses were approved by
the Akita University Medical Center Institutional Review Board. The
histology of the 99 RCC tumors was clear cell in 83, papillary type
2 in 8, chromophobe in 4, and spindle cell in 4 cases. The tumor
specimens, which were 20% formalin-fixed and paraffin-embedded,
were sliced into 5-µm thick sections and immunohistochemically
analyzed using anti-IR-β subunit (#07-724; Millipore, St. Charles,
MO, USA) and anti-IGF1R β subunit antibodies (#3024; Cell Signaling
Technology, Danvers, MA, USA). Each of the stained sections was
scored according to the Allred scoring method (39), which adds the intensity of staining
(absent, 0; weak, 1; moderate, 2; and strong, 3) to the percentage
of carcinoma cells stained (none, 0; <1%, 1; 1–10%, 2; 11–33%,
3; 34–66%, 4; and 67–100%, 5). The intensity of staining was
defined focusing on the intensity of the membranous and/or
cytoplasmic staining in the evaluation of the IR and IGF1R
expression. The total expression score was calculated as the sum of
the 2 parameters. Serum specimens were collected from the patients
before surgery and the serum C-peptide and IGF1 levels were
assessed using a chemiluminescent enzyme immunoassay for C-peptide
or radioimmunoassay for IGF1.
 | Table I.Demographic data of the 99 patients
who underwent nephrectomy. |
Table I.
Demographic data of the 99 patients
who underwent nephrectomy.
| Demographics | n=99 |
|---|
| Gender |
|
|
Male | 70 |
|
Female | 29 |
| Median age, in
years (range) | 63.5 (22–93) |
| BMI (median
(range) | 23.0 (16–37) |
| Type 2 diabetes
mellitus |
|
Yes | 19 |
| Treated
with insulin | 6 |
| No | 80 |
| Nephrectomy |
|
|
Partial | 15 |
|
Radical | 84 |
| TNM stage |
|
|
pT1 | 65 |
|
pT2 | 12 |
|
pT3 | 21 |
|
pT4 | 1 |
| N0 | 88 |
| N1 | 4 |
| N2 | 7 |
| M0 | 82 |
| M1 | 17 |
| Pathology |
|
| Clear
cell renal cell carcinoma | 84 |
|
Papillary renal cell carcinoma
type 2 | 7 |
| Spindle
cell carcinoma | 4 |
|
Chromophobe renal cell
carcinoma | 4 |
| Fuhrman grade |
|
| G1 | 25 |
| G2 | 40 |
| G3 | 34 |
|
Immunohistochemistry scorea |
| IR
expression |
|
|
0–2 | 10 |
|
3–5 | 65 |
|
6 | 15 |
|
7–8 | 9 |
| IGF1R
expression |
|
|
0–2 | 12 |
|
3–5 | 59 |
|
6 | 18 |
|
7–8 | 10 |
Cell culture
Human RCC cell lines (786-O, Caki-1, Caki-2 and
ACHN) and a murine cell line, RENCA, were purchased from the
American Type Culture Collection (ATCC; Manassas, VA, USA) and
maintained in Roswell Park Memorial Institute (RPMI)-1640 medium
supplemented with 10% fetal bovine serum (FBS) at 37̊C in a 5%
CO2-humidified incubator. 786-O, Caki-1, Caki-2, ACHN,
RENCA and LNCaP cells which were purchased from ATCC were
authenticated by STRS analysis. RENCA was used in cell
proliferation assays, western blotting, and in vivo murine
experiments within 6 passages after being purchased from ATCC.
Cell proliferation assay
RENCA cells were plated at 5×10³
cells/well onto 96-well plates in culture medium containing 10%
FBS. After a 24-h incubation in serum-free medium, the medium was
completely replaced with a test medium containing various doses of
insulin or metformin for 72 h. Then, a 1 mg/ml solution of
3-(4,5-dimethylthiazol-2-yl)-2,5-diphenyltetrazolium bromide (MTT)
was added to each well, and all plates were incubated for 3 h.
After the MTT solution was removed, 0.05 N isopropanol-HCl solution
was added, and the optical density was assessed between 570 and 650
nm using a spectrometer.
Animals, diets and metformin
All procedures used in the animal experiments were
approved by the Institutional Review Board of the Akita University
School of Medicine. Seventy-two female C57BL/6 NCrl mice aged 5–6
weeks (Charles River Laboratories, Inc., Yokohama, Japan) were
randomized into 2 groups for the initial experiment and 4 groups
for the second experiment: low- and high-carbohydrate diet groups
for the initial experiment, and low- and high-carbohydrate diet,
low-carbohydrate diet plus metformin, and high-carbohydrate diet
plus metformin groups for the second experiment. Each group
contained 12 mice and only 2 mice were placed in each cage to
prevent fighting.
The food was administered ad libitum. The
high- and low-carbohydrate diets were provided by Ren's Feed and
Supplies Ltd. (#5381 and #5382) (38). The caloric amounts in each diet were
adjusted to be equal. The energy contributions of the carbohydrate,
fat, and protein contents in the high- and low-carbohydrate diets
were 47.5 and 11.4% for carbohydrates, 44.9 and 44.7% for fats and
15.1 and 45.1% for proteins.
Metformin (#130-15485; Wako, Osaka, Japan) was
administered at a dose of 50 mg/kg body weight/day via the drinking
water from the beginning of the experiment. The concentration of
metformin in the water was adjusted to 0.124 mg/ml, so that a 30-g
mouse would consume 1.5 mg of metformin in 7 ml of water/day. The
water and metformin were changed weekly, and the dose was adjusted
for weight gain every 2 weeks (40).
Glucose tolerance test
Glucose tolerance tests were performed at 8–14 weeks
after the randomization to start the experimental diets and
metformin. Blood glucose levels were assessed before i.p. injection
of 1.5 g/kg glucose at 30, 60 and 90 min after the glucose
injection using a OneTouch Ultra glucometer (Lifescan Inc.,
Scotland, UK), and blood was collected from a severed saphenous
vein.
Murine RCC allograft model
A total of 2×10⁵ RENCA cells were mixed
in serum-free RPMI-1640 medium and subcutaneously injected into the
right flanks of the C57BL/6 NCrl mice using a 26-gauge 1-ml syringe
at 9–19 weeks after the randomization to start the experimental
diets and metformin. Once the tumor became palpable, the tumor
volume was calculated twice a week according to the following
formula: [Tumor volume = (short diameter)2×long
diameter×0.52].
All of the mice were starved overnight and
euthanized under anesthesia using isoflurane. Blood samples were
collected from the left ventricle using 24-gauge needles, and the
flank tumors were excised under anesthesia. The excised tumors were
stored into cryotubes and frozen immediately in liquid nitrogen and
stored in a −80̊C deep freezer until sodium dodecyl
sulfate-polyacrylamide gel electrophoresis (SDS-PAGE) and
immunoblotting were performed. The collected blood was centrifuged
at 3,000 rpm for 10 min, and the serum was stored at −80̊C until
the measurement. The serum insulin level was asssessed using a
rat/mouse insulin enzyme-linked immunosorbent assay (ELISA) kit
(#EZRMI-13K; Millipore).
Immunoblotting
Tumor tissues or cells on the plates were
homogenized in lysis buffer consisting of 50 mM HEPES, 1% Triton
X-100, 150 mM NaCl, 0.02% sodium azide, 60 mM β-glycerophosphate, 1
mM DTT, Complete Protease Inhibitor Cocktail (#1169749800) and
PhosSTOP Phosphatase Inhibitor Cocktail Tablets (#04906845001)
(both from Roche Diagnostics GmbH, Mannheim Germany) using a
homogenizer (#S8N-5G; IKA®-Werke GmbH & Co.,
Staufen, Germany). The lysates were centrifuged at 13,000 rpm for
50 min at 4̊C, and the supernatant was collected and stored at
−80̊C. The protein concentration of the supernatant was measured
using a protein assay reagent (BCA protein assay kit; Thermo Fisher
Scientific, Waltham, MA, USA).
A total of 30 µg of protein lysate/sample was
subjected to 10% SDS-PAGE after being denatured by boiling at 100̊C
for 10 min with SDS sample buffer (#AE-1430; ATTO, Tokyo, Japan).
After blocking using 5% skim milk, the membranes were probed using
an iBlot® Dry Blotting System (Thermo Fisher Scientific)
and antibodies specific for various molecules and β-actin (#4967;
Cell Signaling Technology). Membranes were treated with the
appropriate peroxidase-conjugated secondary antibodies (#7074s;
Cell Signaling Technology) and visualized using the enhanced
chemiluminescence reagent ECLTM system (#RPN2232; Amersham,
Piscataway, NJ, USA). The signal was captured using a
chemiluminescence imaging system (#AE-9300; ATTO).
Antibodies
Phospho-IGF1R (Tyr1135/1136)/IR (Tyr1150/1151;
#3024), total IR-β subunit (#07-724; Millipore), total IGF1R-β
subunit (#3027), phospho-Akt (Ser473; #9271), total Akt (#9272),
phospho-p44/42 mitogen-activated protein kinase (MAPK)
(Thr202/Tyr204; #9101), total p44/42MAPK (#9102), phospho-p70 S6K
(Thr389; #9205), total p70 S6K (#9202) and β-actin (#4967) were
used for immunoblotting. All the antibodies were purchased from
Cell Signaling Technology except for the total IR-β subunit
antibody (#07-724; Millipore).
Statistical analysis
The Chi-squared test was used to examine the
relationship between the status of IR expression and clinical
parameters. To analyze survival after radical nephrectomy, the
log-rank test and Cox proportional hazard model were used. A
one-way repeated measures analysis of variance (ANOVA)-covariance
model and Student's t-test were used to determine between-group
differences and within-group changes overtime, respectively. All
statistical analyses were performed using SPSS software, version
16.0 (IBM Corporation, New York, NY, USA), and a P-value <0.05
was considered to indicate a statistically significant result.
Results
Inverse association among IR
expression in tumor tissue, preoperative serum C-peptide level, and
survival in patients with RCC who underwent nephrectomy
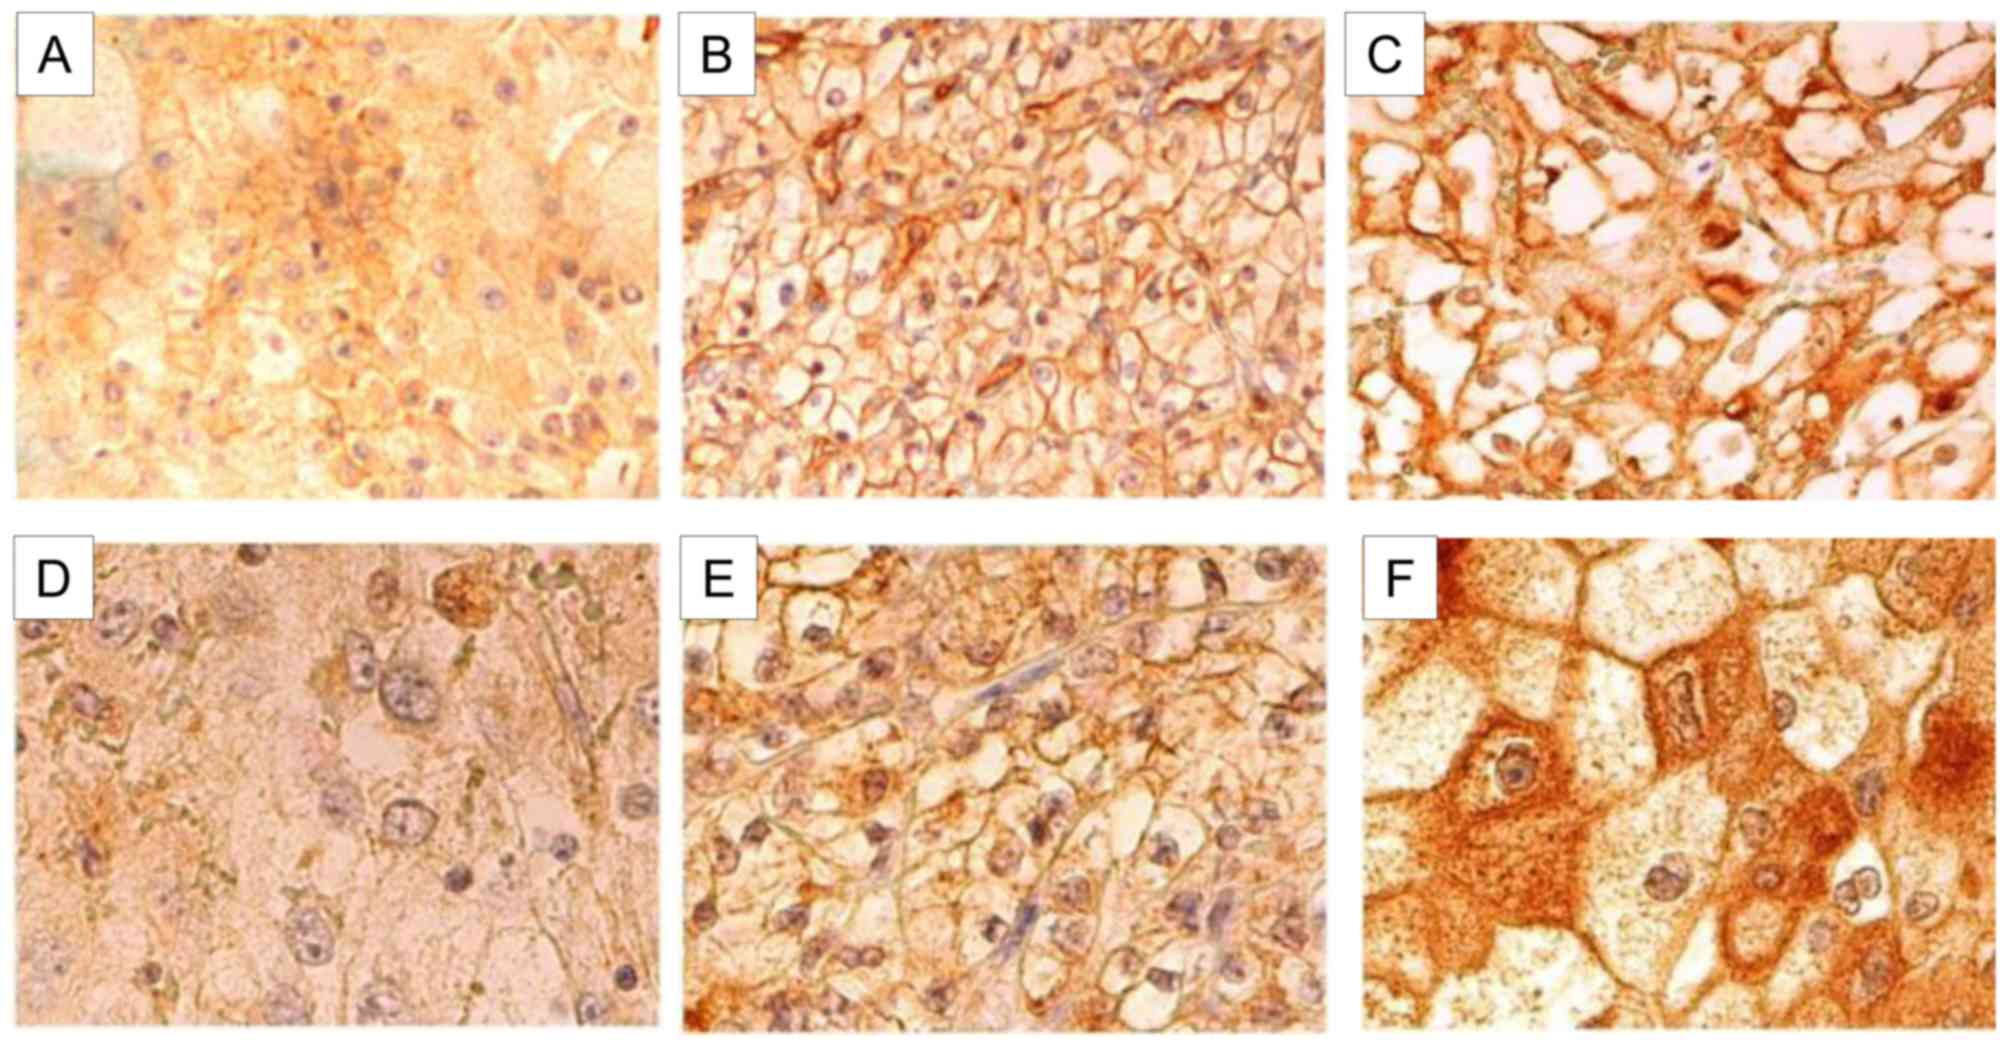
The IR expression level in RCC tumor tissue was 0–2
(Allred score) in 10 (10.1%), 3–5 in 65 (65.7%), 6 in 15 (15.2%)
and 7–8 in 9 (9.1%) patients. The IGF1R expression level was 0–2 in
12 (12.1%), 3–5 in 59 (59.6%), 6 in 18 (18.2%) and 7–8 in 10
(10.1%; Table I; Fig. 1) patients. The IR expression level
was significantly lower in tumors of pT2 than that of pT1 and
significantly lower in patients with distant metastasis than in
those without (P=0.028 and P=0.005, respectively, Fisher's exact
test, Table II). Similarly, the IR
expression level was significantly lower when the preoperative
serum C-peptide level was ≥5.14 ng/ml (median) (P=0.044; Fisher's
exact test; Table II). The
preoperative serum C-peptide level was not associated with the
diagnosis of type 2 DM (P=0.288; Fisher's exact test).
| Table II.Relationship between status of IR and
IGF1R expression, and clinical parameters. |
Table II.
Relationship between status of IR and
IGF1R expression, and clinical parameters.
|
| IR expression
scorea | IGF1R expression
scorea |
|---|
|
|
|
|
|---|
| Parameters | 6-8 (n=24) n
(%) | 0-5 (n=75) n
(%) | P-value | 6-8 (n=28) n
(%) | 0-5 (n=71) n
(%) | P-value |
|---|
| Gender |
|
|
|
|
| 0.921 |
|
Male | 14 (20.0) | 56 (80.0) | 0.125 | 20 (29.0) | 50 (71.0) |
|
|
Female | 10 (34.5) | 19 (65.5) |
| 8 (27.6) | 21 (72.4) |
|
| Age (years) |
|
|
|
|
| 0.949 |
| ≥Median
(65) | 12 (24.0) | 38 (76.0) | 0.954 | 14 (28.0) | 36 (72.0) |
|
|
<Median (65) | 12 (24.5) | 37 (75.5) |
| 14 (29.0) | 35 (71.0) |
|
| BMI |
|
|
|
|
| 0.068 |
| ≥Median
(23.0) | 16 (32.0) | 34 (68.0) | 0.055 | 16 (32.0) | 34 (68.0) |
|
|
<Median (23.0) | 8 (16.3) | 41 (83.7) |
| 8 (16.4) | 41 (83.6) |
|
| Serum C-peptide
(ng/ml) |
|
|
|
|
| 0.610 |
| ≥Median
(5.14) | 8 (16.0) | 42 (84.0) | 0.044 | 13 (26.0) | 37 (74.0) |
|
|
<Median (5.14) | 16 (32.6) | 33 (67.4) |
| 15 (30.7) | 34 (69.3) |
|
| Serum IGF1
(ng/ml) |
|
|
|
|
| 0.701 |
| ≥Median
(116) | 11 (22.0) | 39 (78.0) | 0.598 | 15 (30.0) | 35 (70.0) |
|
|
<Median (116) | 13 (26.6) | 36 (73.4) |
| 13 (26.6) | 36 (73.4) |
|
| Type 2 diabetes
mellitus |
|
|
|
|
| 0.318 |
|
Yes | 3 (15.7) | 16 (84.3) | 0.261 | 4 (21.1) | 15 (78.9) |
|
| No | 21 (26.3) | 59 (73.7) |
| 24 (30.0) | 56 (70.0) |
|
| Fuhrman grade |
|
|
|
|
| 0.447 |
|
3–4 | 5 (14.7) | 29 (85.3) | 0.085 | 8 (17.6) | 26 (82.4) |
|
|
1–2 | 19 (29.2) | 46 (70.8) |
| 20 (30.7) | 45 (69.3) |
|
| T stage |
|
|
|
|
| 0.089 |
|
≥pT2 | 4 (11.8) | 30 (88.2) | 0.028 | 6 (11.8) | 28 (88.2) |
|
|
≤pT1 | 20 (30.8) | 45 (69.2) |
| 22 (33.9) | 43 (66.1) |
|
| N stage |
|
|
|
|
| 0.051 |
|
N1–2 | 1 (9.1) | 10 (90.9) | 0.196 | 6 (54.5) | 5 (45.4) |
|
| N0 | 23 (26.1) | 65 (73.9) |
| 22 (25.0) | 66 (75.0) |
|
| M stage |
|
|
|
|
| 0.439 |
| M1 | 0 (0.0) | 17 (100.0) | 0.005 | 4 (23.5) | 13 (76.5) |
|
| M0 | 24 (29.2) | 58 (70.8) |
| 24 (29.2) | 58 (70.8) |
|
| Histological
type |
|
|
|
|
| 0.880 |
| Clear
cell carcinoma | 20 (24.0) | 63 (76.0) | 0.665 | 24 (27.7) | 60 (72.3) |
|
|
Others | 4 (25.0) | 12 (75.0) |
| 4 (31.3) | 11 (68.7) |
|
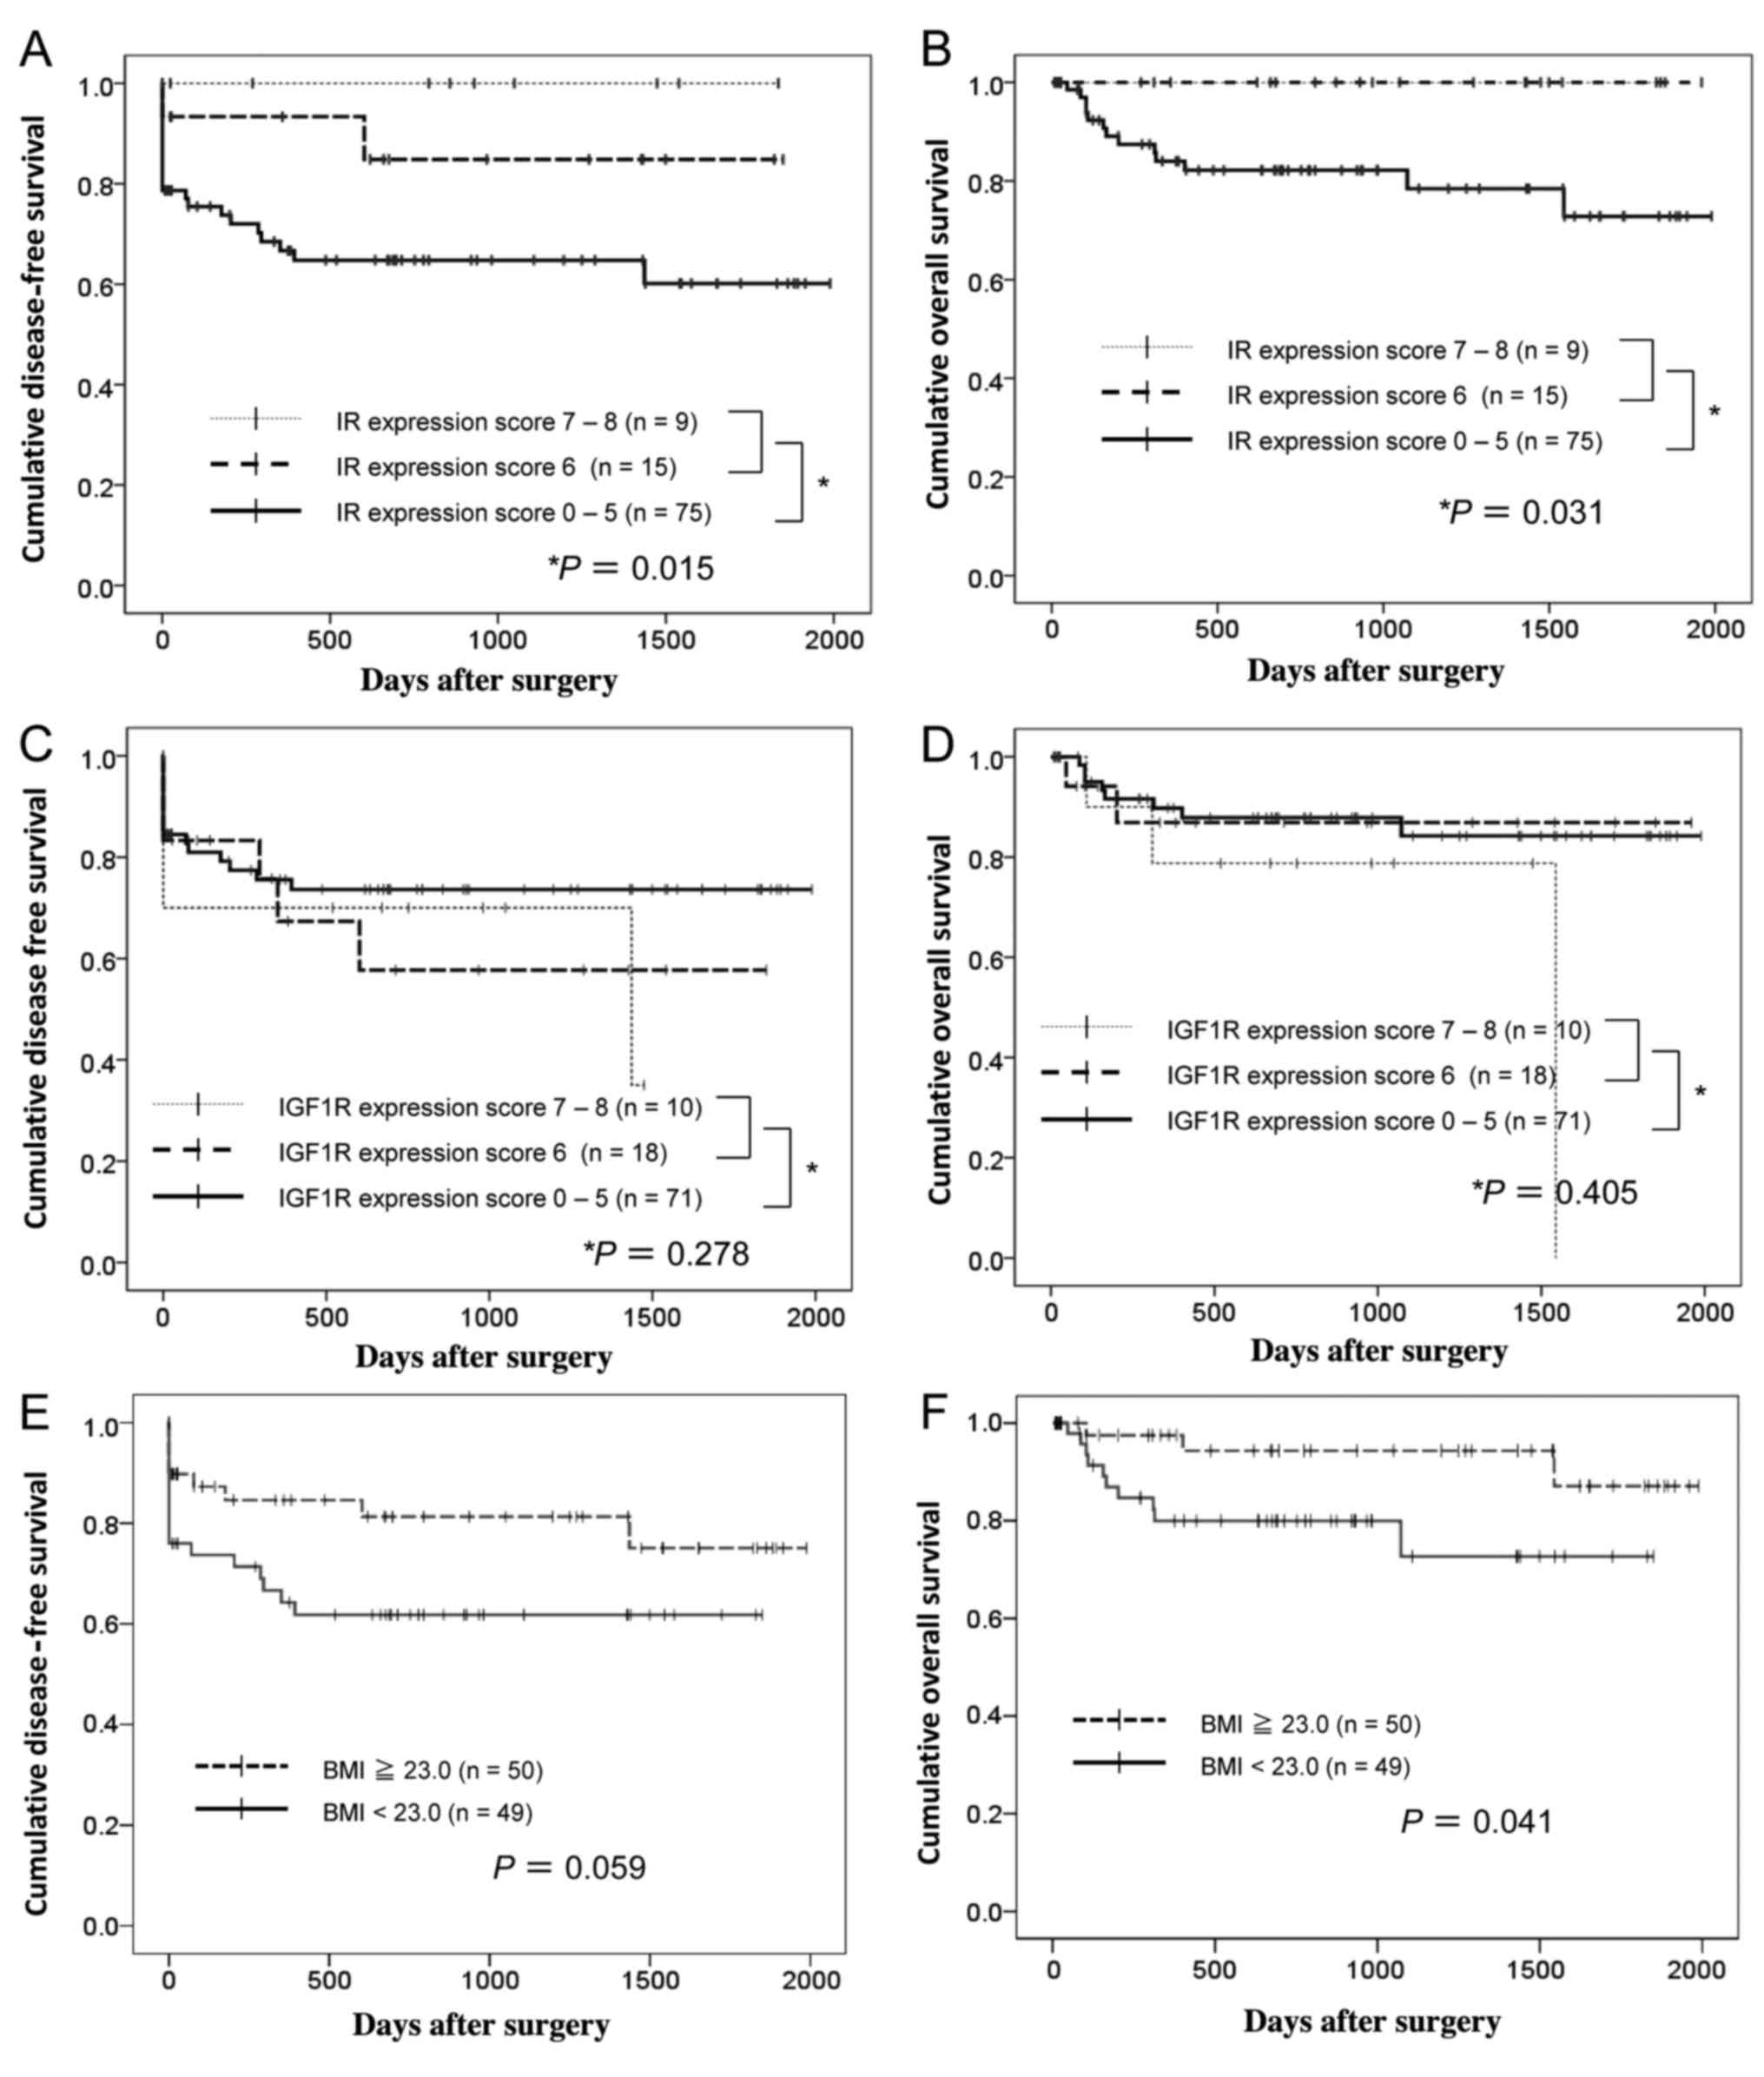
The median follow-up duration of the patients after
partial or total nephrectomy was 27 months (range, 1–71). The
disease-free and overall survival were significantly better in
patients with high-IR expression tumors (Allred scores of 6–8) than
in those with low-IR expression tumors (Allred scores of 0-5;
Table III; P=0.015 and P=0.031,
respectively, log-rank test; Fig. 2A
and B). The low IR expression level (Allred scores of 0–5); low
BMI (<23.0); high T, N and M stages; and Fuhrman grades 3–4 were
associated with poor disease-free and overall survival in the
univariate analysis. High-IR expression level (Allred scores of
6–8) was not an independent predictor of better disease-free and
overall survival in the multivariate analysis (Cox proportional
hazard model; Table III). The
preoperative serum C-peptide level was not associated with
disease-free or overall survival (Table III). Moreover, overall survival
was significantly better in patients with a body mass index (BMI)
≥23.0 than in patients with a BMI <23.0 (P=0.041, log-rank test;
Fig. 2E and F). In contrast, the
IGF1R expression level in the RCC specimens, preoperative serum
IGF1 level, and clinical parameters were not associated with
overall or disease-free survival, although, the statistical power
of the 99 patients was insufficient to detect differences (Fig. 2C and D; Table III).
| Table III.Cox proportional hazard model to
predict better disease-free and overall survival. |
Table III.
Cox proportional hazard model to
predict better disease-free and overall survival.
|
| Disease-free
survival | Overall
survival |
|---|
|
|
|
|
|---|
|
| Univariate
analysis | Multivariate
analysis | Univariate
analysis | Multivariate
analysis |
|---|
|
|
|
|
|
|
|---|
| Variables | HR | P-value | 95% CI | HR | P-value | 95% CI | HR | P-value | 95% CI | HR | P-value | 95% CI |
|---|
| Gender (male vs.
female) | 0.797 | 0.607 | 0.336–1.889 |
|
|
| 1.418 | 0.540 | 0.464–4.339 |
|
|
|
| Age, years | 0.608 | 0.213 | 0.278–1.330 |
|
|
| 0.589 | 0.380 | 0.242–2.263 |
|
|
|
| [≥median (65) vs.
<median] |
|
|
|
|
|
|
|
|
|
|
|
|
| BMI | 0.317 | 0.009 | 0.134–0.751 | 0.562 | 0.221 | 0.223–1.414 | 0.155 | 0.016 | 0.034–0.707 | 0.162 | 0.024 | 0.033–0.784 |
| [≥median (23.0) vs.
<median] |
|
|
|
|
|
|
|
|
|
|
|
|
| Type 2 diabetes
mellitus (yes vs. no) | 1.705 | 0.227 | 0.717–4.053 |
|
|
| 1.600 | 0.476 | 0.439–5.828 |
|
|
|
|
Immunohistochemistry scorea |
|
|
|
|
|
|
|
|
|
|
|
|
| IR
(expression score 6–8 vs. 0–5) | 0.214 | 0.036 | 0.051–0.904 | 0.473 | 0.336 | 0.103–2.177 | 0.192 | 0.031 | 0.001–5.767 | 0.739 | 0.812 | 0.112–16.38 |
| IGF1R
(expression score 6–8 vs. 0–5) | 1.502 | 0.308 | 0.687–3.287 |
|
|
| 1.602 | 0.409 | 0.523–4.904 |
| Serum level |
|
|
|
|
|
|
|
|
|
|
|
|
|
C-peptide | 1.067 | 0.867 | 0.396–1.798 |
|
|
| 0.573 | 0.329 | 0.187–1.754 |
|
|
|
|
[≥median (5.14 ng/ml) vs.
<median] |
|
|
|
|
|
|
|
|
|
|
|
|
|
IGF1 | 0.820 | 0.608 | 0.385–1.748 |
|
|
| 0.483 | 0.203 | 0.158–1.480 |
|
|
|
|
[≥median (116 ng/ml) vs.
<median] |
|
|
|
|
|
|
|
|
|
|
|
|
| Pathology |
|
|
|
|
|
|
|
|
|
|
|
|
|
Histologic type (clear cell
vs. others) | 0.604 | 0.252 | 0.293–1.786 |
|
|
| 0.470 | 0.210 | 0.144–1.530 |
|
|
|
| T stage
(≥pT2 vs. ≤pT1) | 2.476 | 0.021 | 1.488–6.533 | 0.739 | 0.516 | 0.297–1.842 | 7.751 | 0.002 | 2.102–28.59 | 1.617 | 0.513 | 0.383–6.833 |
| N stage
(≥N1 vs. N0) | 5.202 | <0.001 | 2.806–9.645 | 1.705 | 0.155 | 0.817–3.556 | 6.566 | <0.001 | 3.104–13.88 | 1.570 | 0.286 | 0.686–3.595 |
| M stage
(M1 vs. M0) | 36.170 | <0.001 | 8.273–158.19 | 14.57 | 0.002 | 2.629–80.80 | 42.120 | <0.001 | 9.148–193.95 | 13.860 | 0.007 | 2.033–94.56 |
| Fuhrman
grade (3–4 vs. 1–2) | 6.007 | <0.001 | 2.593–13.919 | 1.998 | 0.253 | 0.610–6.547 | 37.520 | 0.001 | 4.521–311.42 | 4.791 | 0.188 | 0.466–49.26 |
Enhanced in vitro RENCA proliferation
with insulin treatment
With the use of immunoblotting, IR was shown to be
expressed in Caki-2 (human RCC), RENCA (murine RCC) and LNCaP
(human prostate cancer) cell lines, whereas IR expression was
absent in 786-O (human RCC), ACHN (human RCC) and Caki-1 (human
RCC) cell lines. IGF1R was expressed in 786-O, ACHN, Caki-1,
Caki-2, RENCA and LNCaP cell lines (Fig. 3A). RENCA cell proliferation was
stimulated by insulin in a dose-dependent manner (Fig. 3B). To analyze the in vitro
effect of insulin and IR on RENCA cell proliferation,
immunoblotting was performed using a protein lysate of RENCA that
was stimulated by various concentrations of insulin for 30 min.
Phosphorylation of IR and Akt located downstream of IR was
stimulated by insulin in a dose-dependent manner (P<0.001;
Fig. 3C). The total IR protein
level was not altered in vitro according to the insulin
concentration of the medium (Fig.
3C). Phosphorylation of p44/42MAPK in RENCA was not enhanced by
insulin in vitro. The results suggested that
insulin-dependent proliferation of RENCA cells was induced by
stimulation of the PI3K/Akt/mTOR pathway rather than by stimulation
of the MAPK pathway in vitro.
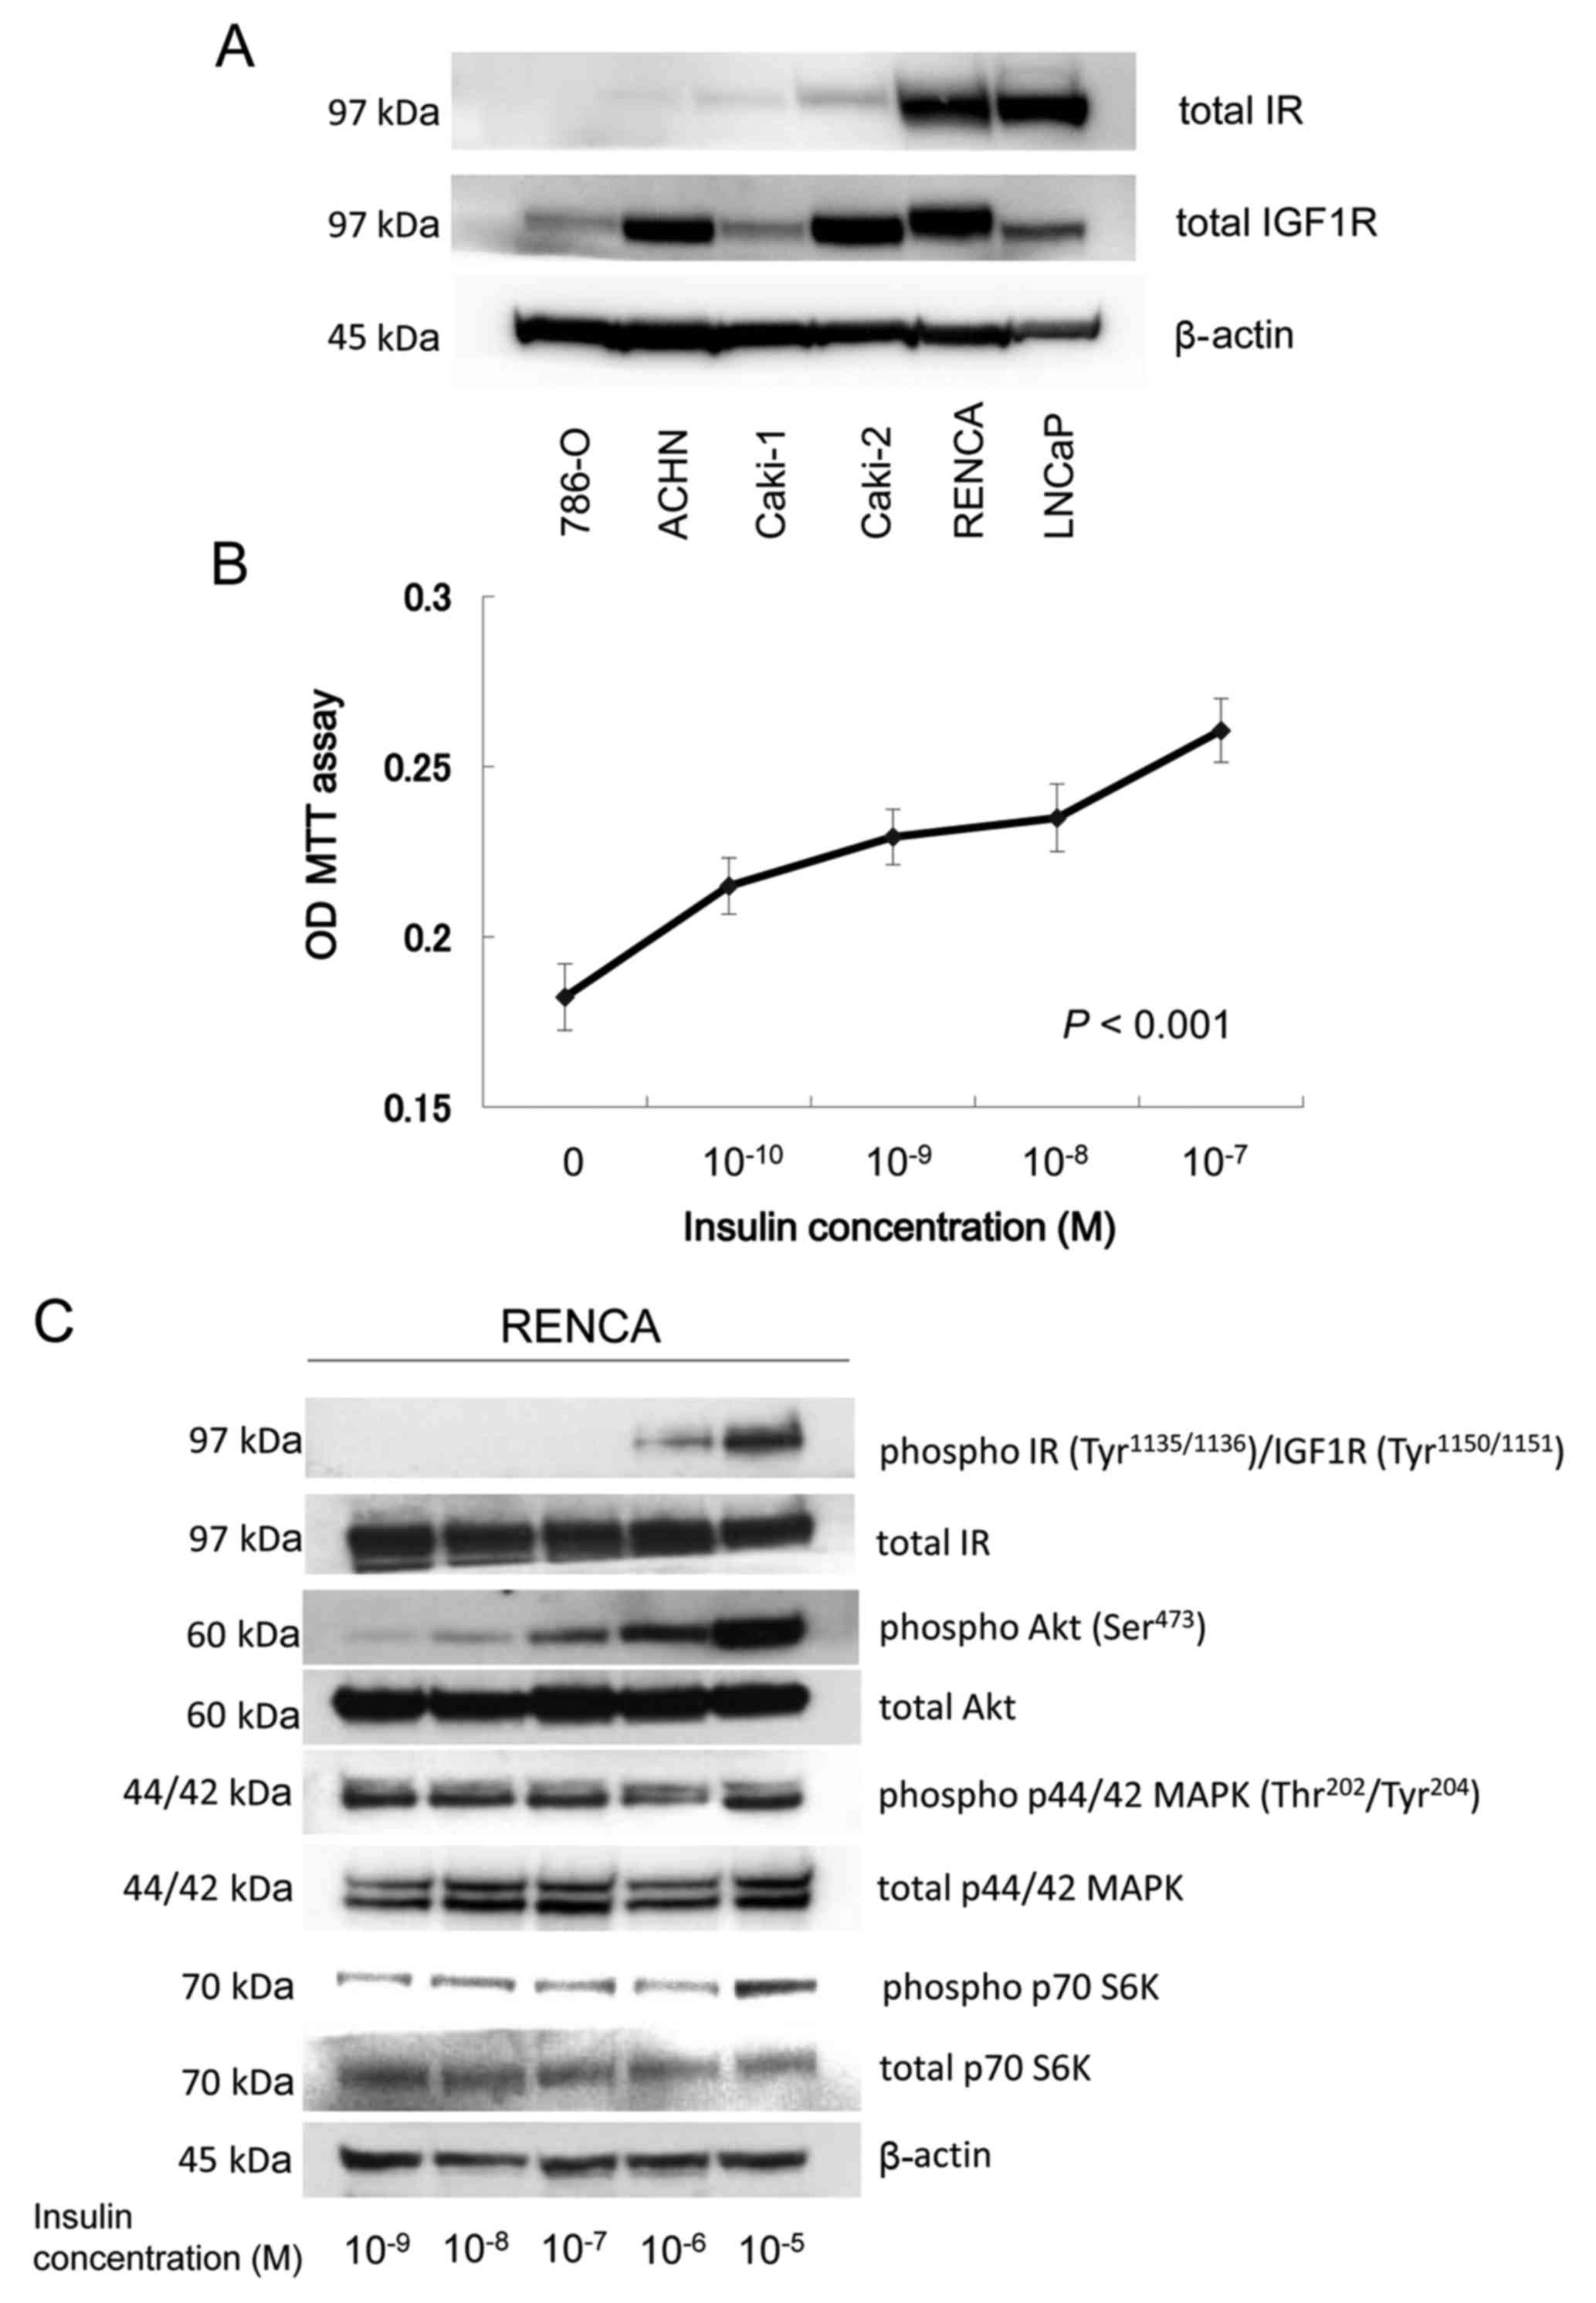 | Figure 3.IR and IGF1R expression in various
RCC cell lines and enhanced in vitro RENCA proliferation
with insulin treatment. (A) Proteins (30 µg) extracted from various
human and mouse cell lines were size fractionated using SDS-PAGE
and immunoblotted using total IR-β subunit and IGF1R antibodies.
(B) RENCA cells were plated at 5×10³ cells/well onto
96-well plates in culture medium containing 10% FBS. After a 24-h
incubation in serum-free medium, the complete medium was replaced
with a test medium containing various doses of insulin for 72 h.
After incubation with 1 mg/ml MTT solution for 3 h, 0.05 N
isopropanol-HCl solution was added and the OD was assessed. (C)
RENCA cells were plated on 10-cm Petri dishes in culture medium
containing 10% FBS. After a 24-h incubation in serum-free medium,
the complete medium was replaced with test medium containing
various doses of insulin for 30 min. Then, the proteins (30 µg)
extracted from the cells were size fractionated using SDS-PAGE and
immunoblotted with phospho- and total IR, Akt, p44/42 MAPK and
p70S6K antibodies. IR, insulin receptor; IGF1R, insulin-like growth
factor 1 receptor; RCC, renal cell carcinoma; OD, optical
density. |
No enhancement of in vivo progression
of RENCA tumors in hyperinsulinemic obese mice induced by a
high-carbohydrate diet
To investigate the in vivo contribution of
obesity, serum insulin and IR on murine RENCA progression, 24
C57BL/6 NCrl mice were divided into high-carbohydrate and
low-carbohydrate groups. During the first 50 days of the
experimental diets, the mouse body weights were significantly
higher in the high-carbohydrate group than in the low-carbohydrate
group (P=0.001, repeated measures ANOVA; Fig. 4A). At day 56 on the diets, the mean
serum glucose level was significantly higher in the
high-carbohydrate group than that in the low-carbohydrate group at
30, 60 and 90 min after the 1.5 g/kg glucose injections (P=0.014,
repeated measures ANOVA; Fig. 4B).
At day 62 on the diets, a total of 2×10⁵ RENCA cells
were subcutaneously injected into the right flanks of the C57BL/6
NCrl mice in the 2 groups. Thirty days after the injections, the
mice were euthanized under anesthesia using isoflurane to collect
blood and excise the tumors. The mean fasting serum insulin level
was significantly higher in the high-carbohydrate group than this
level in the low-carbohydrate group (P=0.029, Student's t-test;
Fig. 4C). However, the mean tumor
volume was not significantly higher in the high-carbohydrate group
than that in the low-carbohydrate group (P=0.127, repeated measures
ANOVA; Fig. 4D).
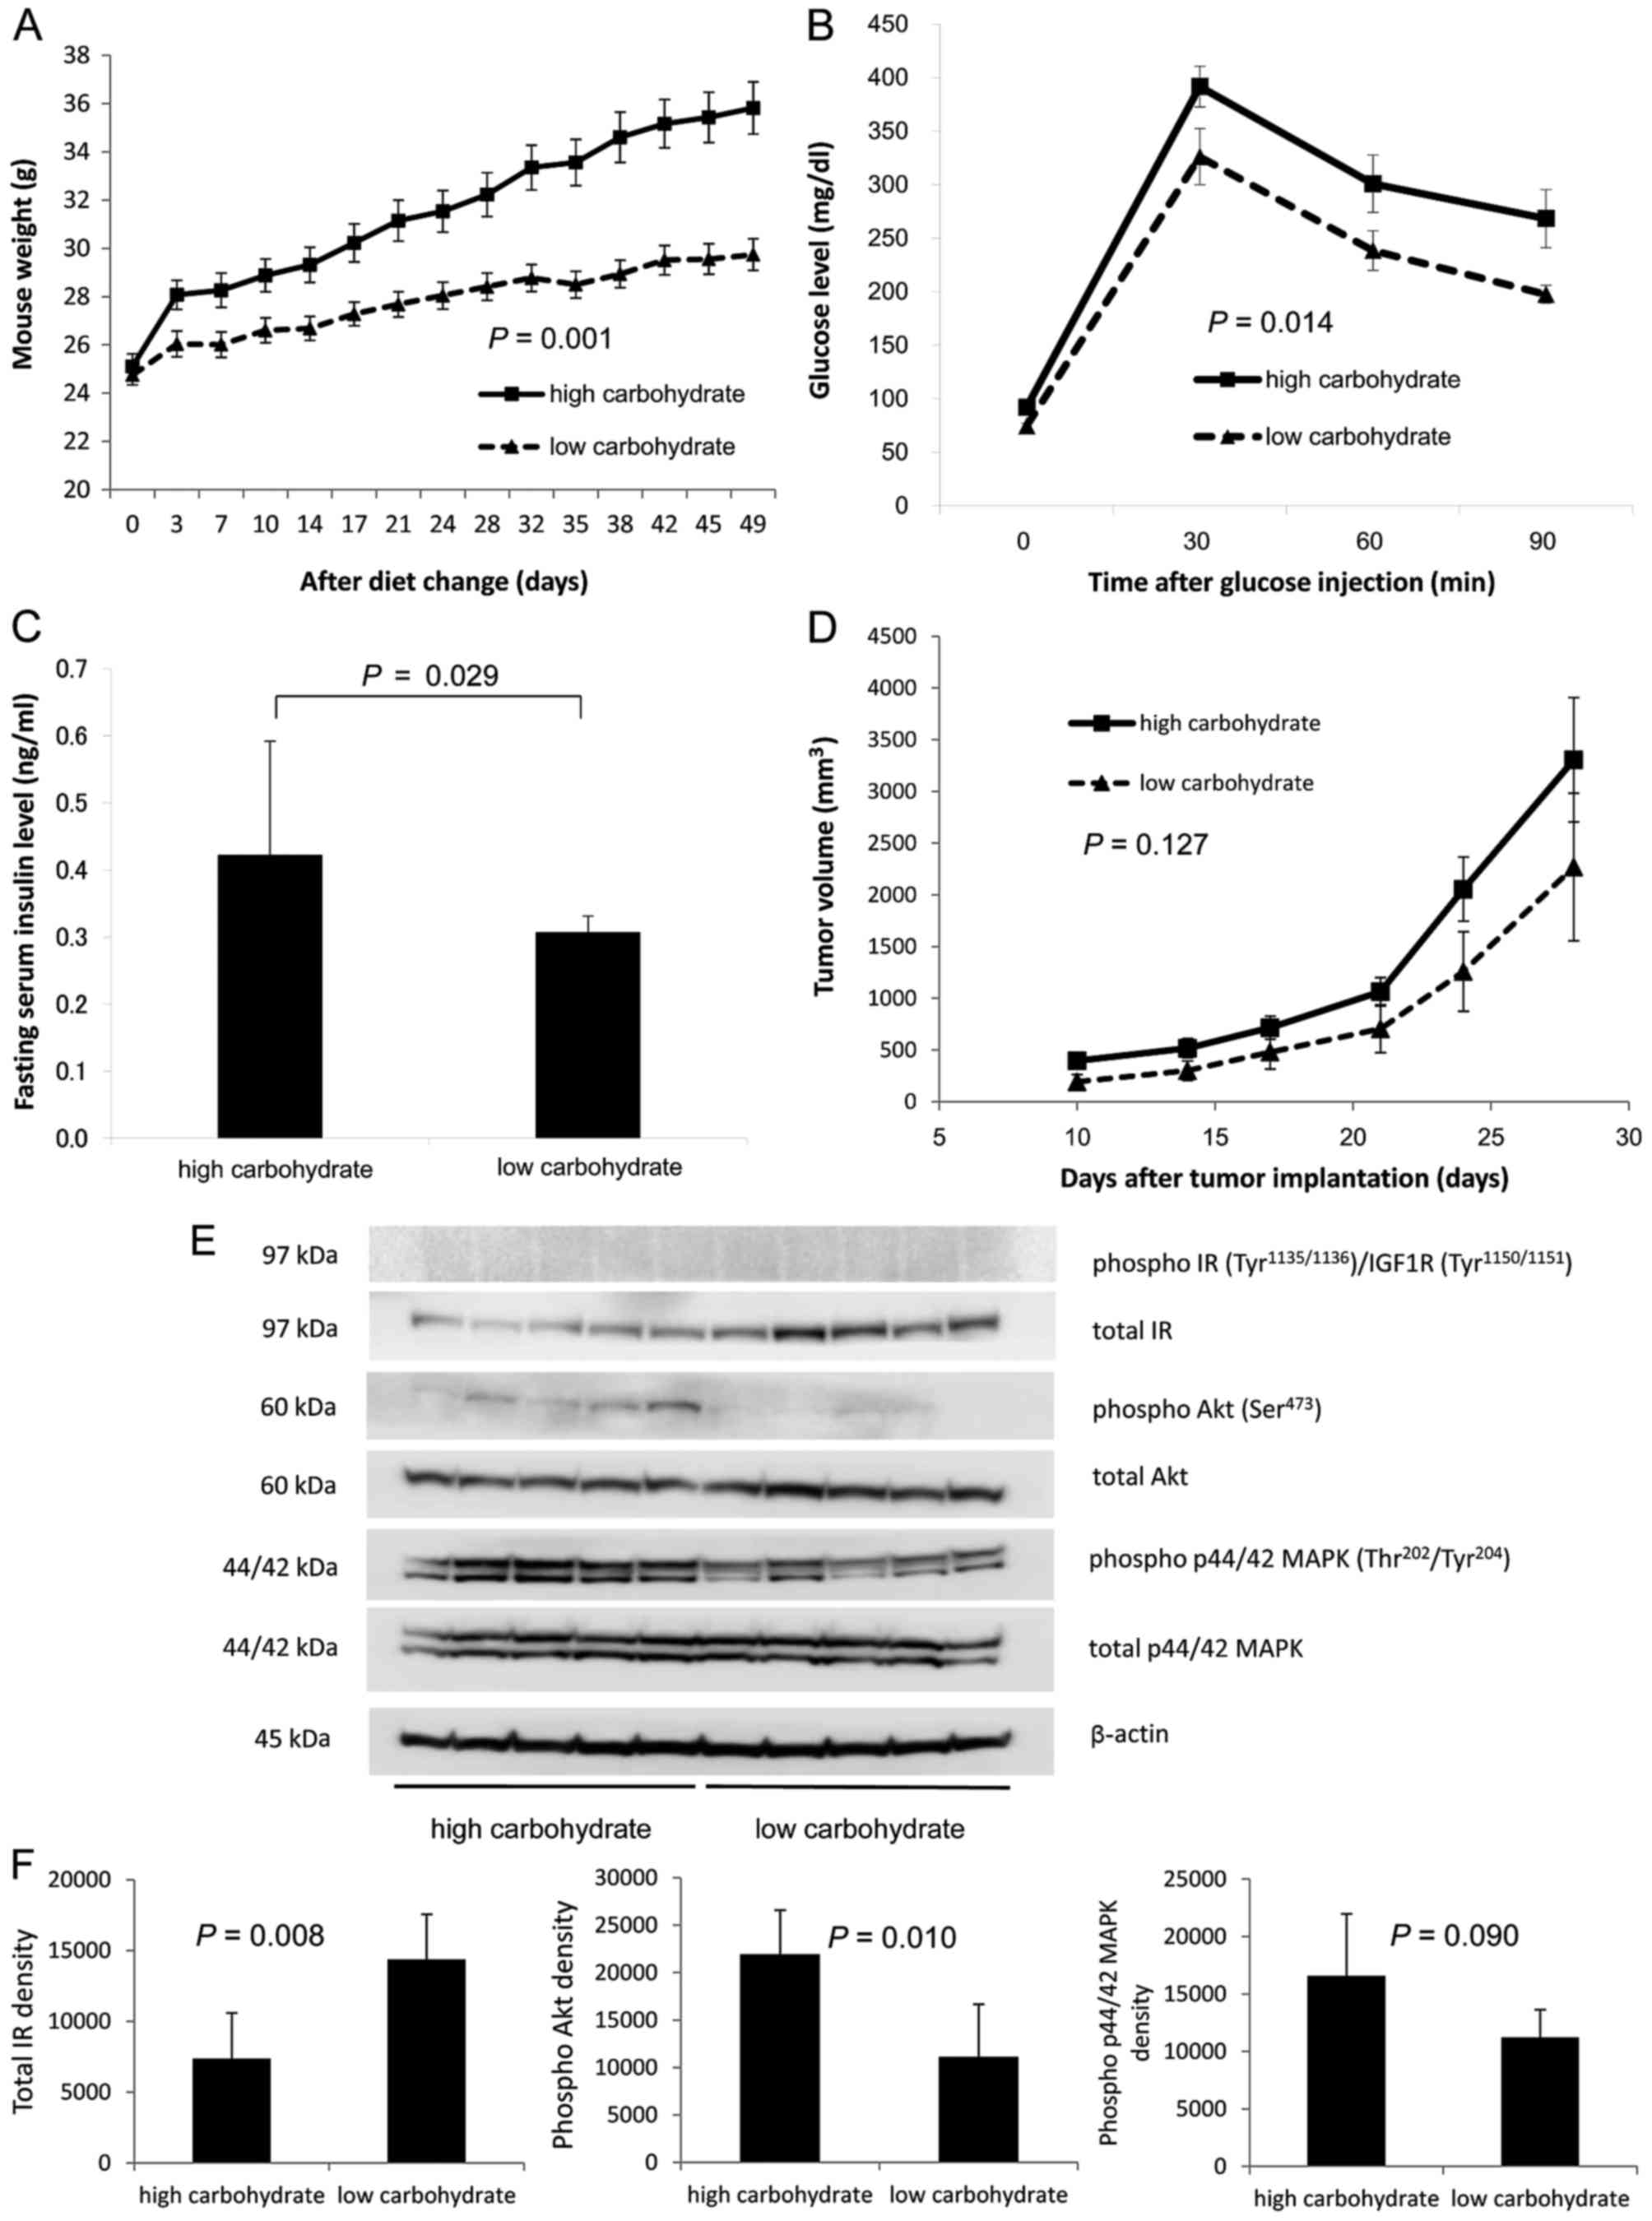 | Figure 4.In vivo progression of RENCA
tumors in hyperinsulinemic obese mice induced by a
high-carbohydrate diet. Comparison of (A) body weight, (B) serum
glucose levels determined by a glucose tolerance test, (C) fasting
serum insulin levels, (D) flank subcutaneous tumor volumes, (E)
tumor insulin signaling assessed by immunoblottings, and (F)
densitometry of each protein in the tumors between the mouse
high-carbohydrate diet and low-carbohydrate diet groups. (A) Body
weights of C57BL/6 NCrl mice in each group were assessed
twice/week. (B) Glucose tolerance tests were performed at 56 days
after the randomization. Blood glucose levels were assessed before
i.p. injection of 1.5 g/kg glucose at 30, 60 and 90 min after the
glucose injection using a OneTouch Ultra glucometer and blood
collected from a cut saphenous vein. (C) At 92 days after the
randomization, all mice were fasted overnight and euthanized under
anesthesia to collect blood and excise the tumors. Blood samples
were collected from the left ventricle using 24-gauge needles. The
collected blood was centrifuged, and the serum was stored at −80̊C.
The serum insulin levels were assessed using a rat/mouse ELISA kit.
(D) A total of 2×10⁵ RENCA cells were injected
subcutaneously into the right flanks of the mice 62 days after the
randomization. Once a tumor became palpable, the tumor volume was
calculated twice a week according to the formula: [Tumor volume =
(short diameter)2×long diameter×0.52]. (E) Tumor tissues
were homogenized in the lysis buffer containing a protease
inhibitor and phosphatase inhibitor cocktail. The lysates were
centrifuged, and the supernatant was stored at −80̊C. A total of 30
µg of protein lysate was size fractionated using SDS-PAGE and
immunoblotted using phospho- and total IR, Akt and p44/42 MAPK
antibodies. (F) The signal was captured using a chemiluminescence
imaging system. IR, insulin receptor. |
Decreased IR expression in RENCA
tumors in hyperinsulinemic mice
To investigate the effect of hyperinsulinemia on
insulin signaling, tumor tissues were analyzed by immunoblotting.
Although, phosphorylated IR was not detected in the tumors, total
IR expression was significantly lower in the tumors in the
high-carbohydrate group than that in the low-carbohydrate group, as
determined by densitometry (n=5, P=0.008; Fig. 4E and F). In contrast,
phosphorylation of both Akt and p44 MAPK was significantly enhanced
in the tumors in the high-carbohydrate group (P=0.010 and P=0.090,
respectively). In in vitro experiments, the proliferation of
RENCA cells was presumably enhanced by phosphorylation of Akt
rather than by the p44 MAPK pathway (Fig. 3C). However, in vivo, RENCA
tumor progression was presumably enhanced via both phosphorylation
of Akt and p44 MAPK in the mice with hyperinsulinemia. Although the
mean tumor volume was not significantly higher in the
high-carbohydrate group than that in the low-carbohydrate group
statistically, an alternative signaling pathway, distinct from that
in the in vitro experiment, may have been involved in the
in vivo progression of RENCA tumors induced by the
hyperinsulinemic and obesity-inducing environment under a
high-carbohydrate diet.
Direct anticancer effect of metformin
in murine RENCA tumors rather than the indirect effect of lowering
the serum insulin level
To investigate the in vivo contribution of
hyperinsulinemia on RENCA tumor progression, 48 C57BL/6 NCrl mice
were divided into 4 groups: the high-carbohydrate diet,
high-carbohydrate diet + metformin, low-carbohydrate diet and
low-carbohydrate diet + metformin groups. Among the possible
mechanisms underlying the cancer-suppressing effect of metformin,
direct regulation of cancer signaling via stimulation of
AMP-activated protein kinase (AMPK) and an indirect effect of
lowering the serum insulin level via hepatocytes have been proposed
(3,40).
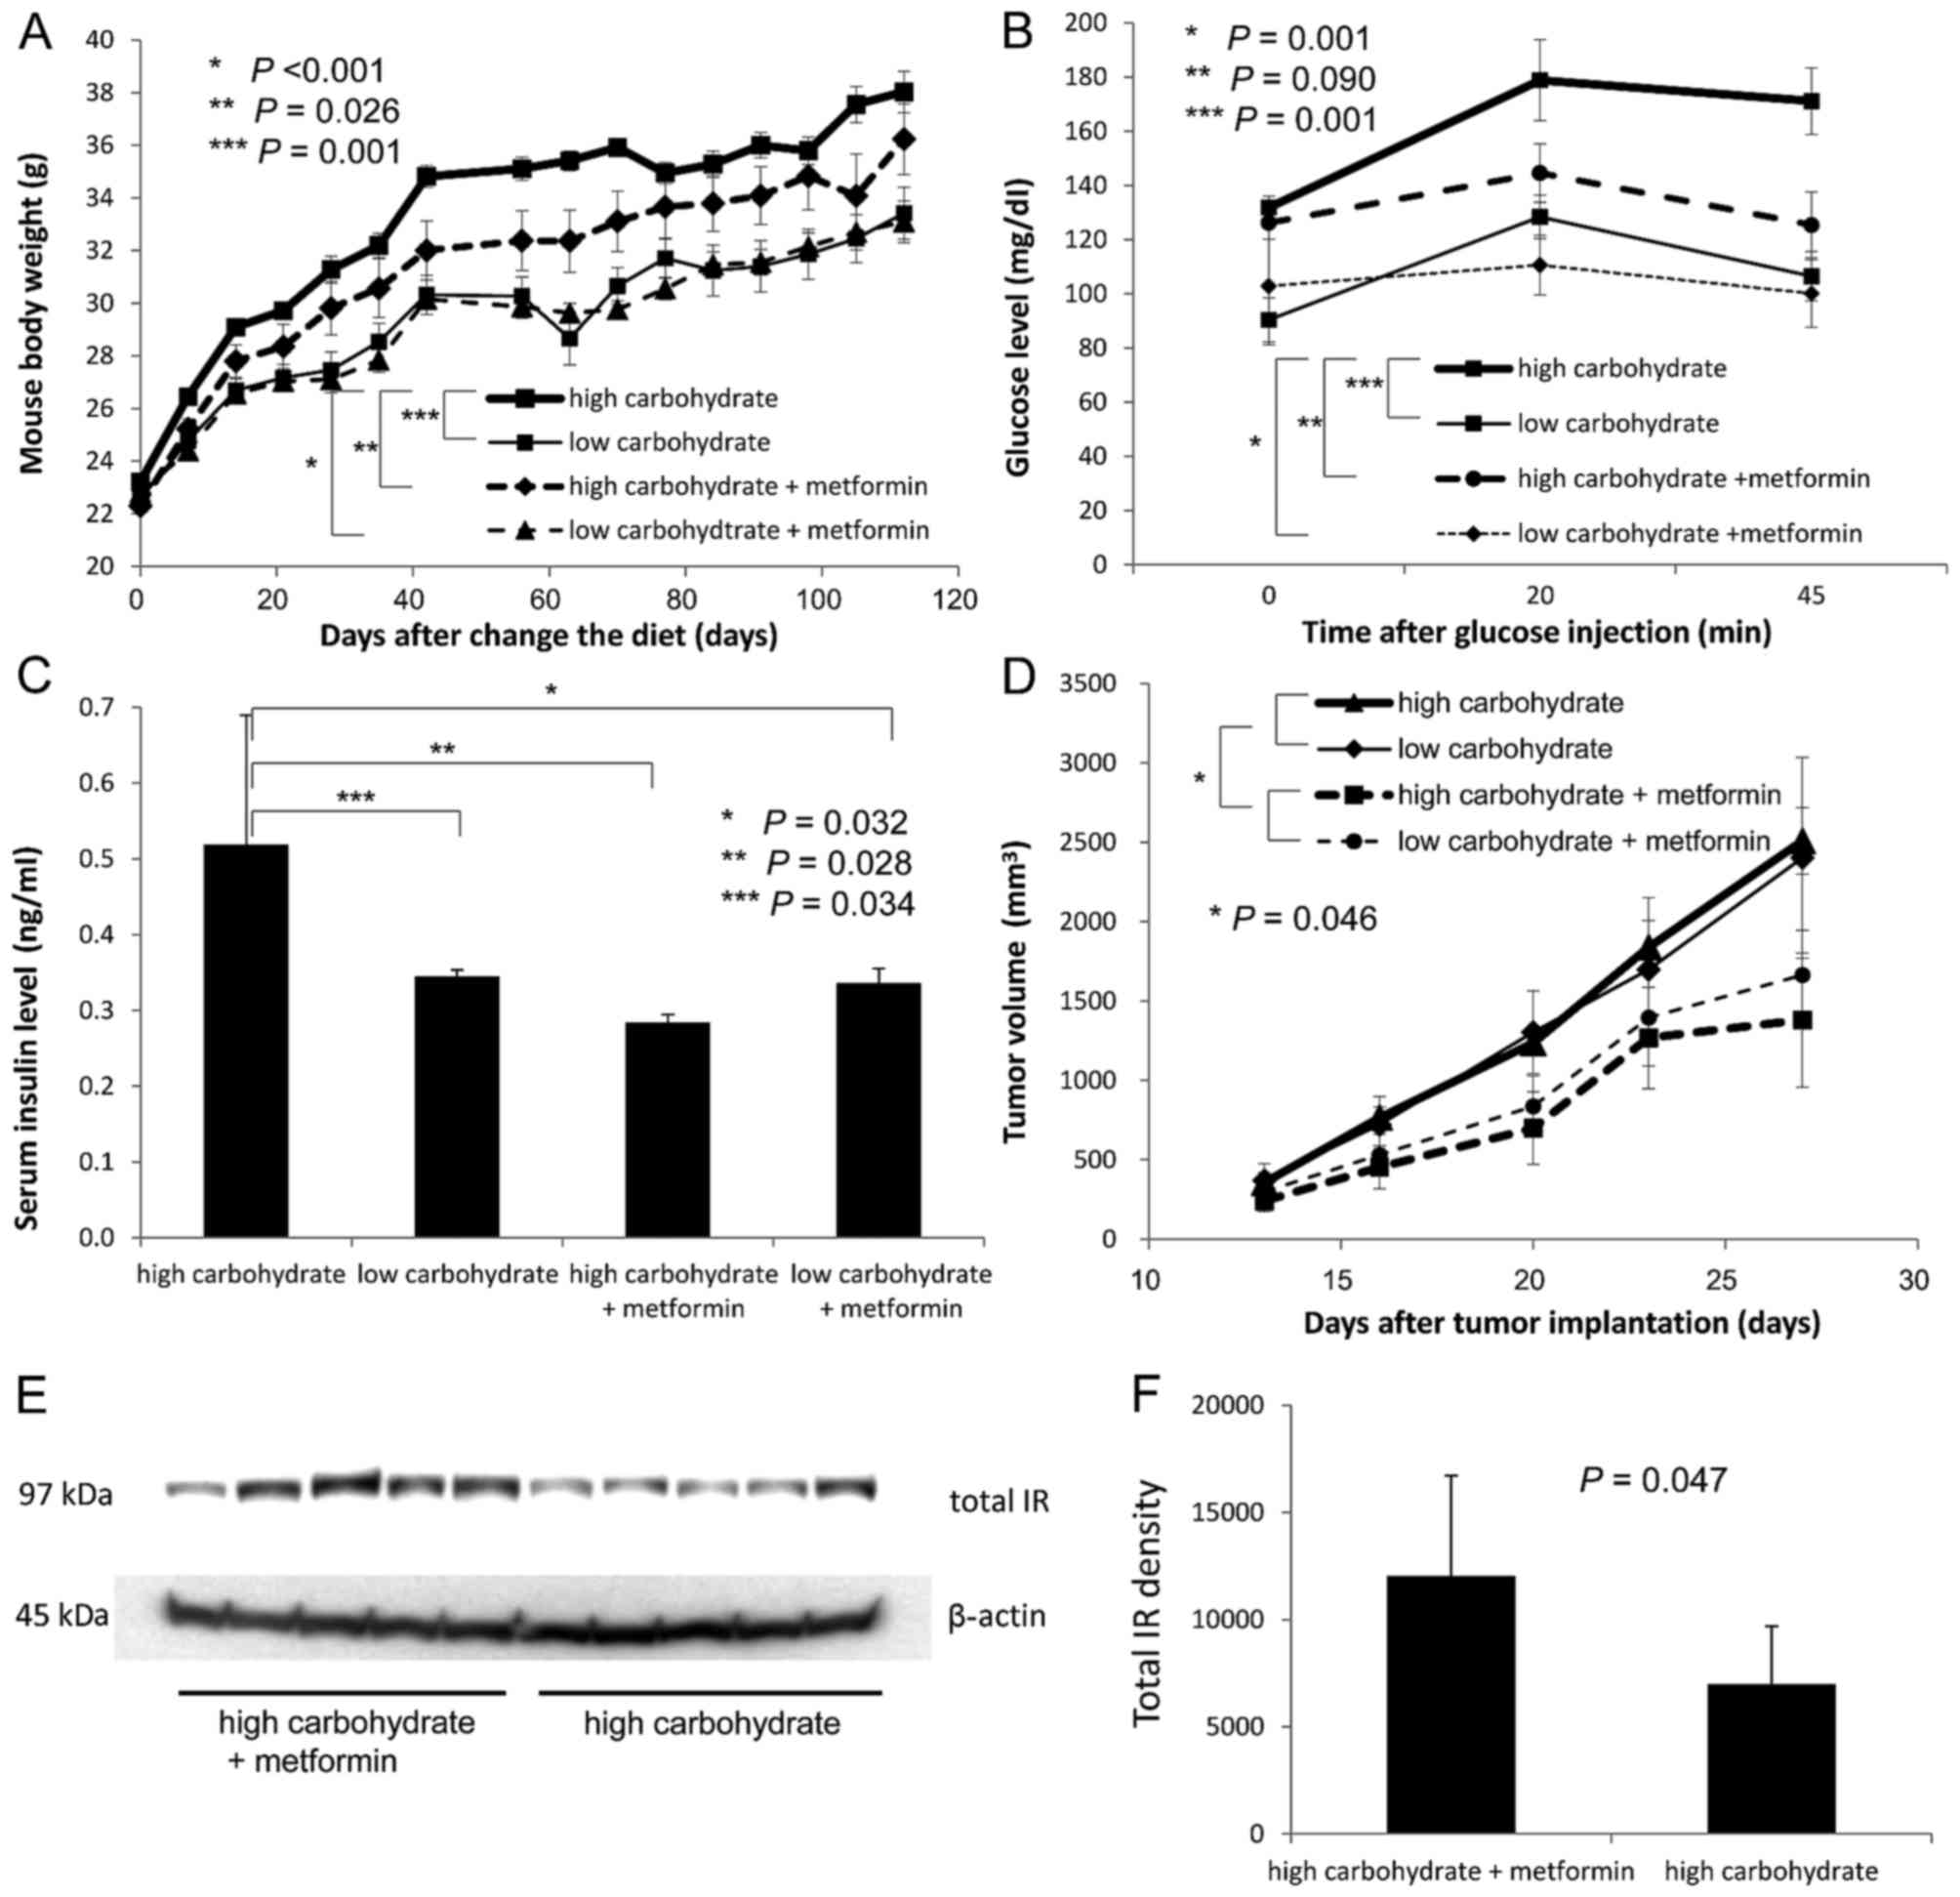
During the first 98 days after initiation of the
experimental diets, the mouse body weights were significantly
higher in the high-carbohydrate diet group than those in the
low-carbohydrate diet group, and were significantly lower in the
high-carbohydrate diet + metformin group than those in the
high-carbohydrate diet group (P=0.001 and P=0.026, repeated
measures ANOVA; Fig. 5A). In
addition, as determined by the glucose tolerance test at 98 days
after diet initiation, glucose levels were significantly higher in
the high-carbohydrate diet group than those in the low-carbohydrate
diet group, and were relatively lower in the high-carbohydrate +
metformin group than those in the high-carbohydrate diet group
(P=0.001 and P=0.090, repeated measures ANOVA; Fig. 5B).
At 133 days after diet initiation, a total of
2×10⁵ RENCA cells were subcutaneously injected into the
mice in each of the 4 groups. Thirty days after the injection, the
mice were euthanized to collect blood and excise the tumors. The
mean fasting serum insulin level was significantly higher in the
high-carbohydrate diet group than that in the low-carbohydrate diet
group, and significantly lower in the high-carbohydrate diet +
metformin group than that in the high-carbohydrate group at
euthanasia (P=0.034 and P=0.028; Fig.
5C). Although, the mean tumor volume was not significantly
higher in the high-carbohydrate group than that in the
low-carbohydrate diet group, the mean tumor volumes were
significantly lower in both the high- and low-carbohydrate diet +
metformin groups than the tumor volumes in the high- and
low-carbohydrate diet without metformin groups (P=0.046; Fig. 5D).
Enhanced IR expression in RENCA tumors
with metformin treatment
Although, phosphorylated IR was not detected in the
tumor tissues by immunoblotting analysis, total IR expression was
significantly higher in the tumors of the high-carbohydrate diet +
metformin group than that in the high-carbohydrate diet group
determined by densitometry (P=0.047; Fig. 5E and F).
Acceleration of RENCA tumor progression by a
high-carbohydrate diet was not observed in this experiment, and
tumor progression was inhibited by metformin not only in the
hyperinsulinemic mice, but also in the normoinsulinemic mice. The
results suggested that the mechanism of the metformin effect in
this model was the direct effect of enhancement of AMPK rather than
the indirect effect of lowering the serum insulin level. Of
interest, IR expression was increased in the tumors of the
hyperinsulinemic mice treated with metformin (Fig. 5E and F).
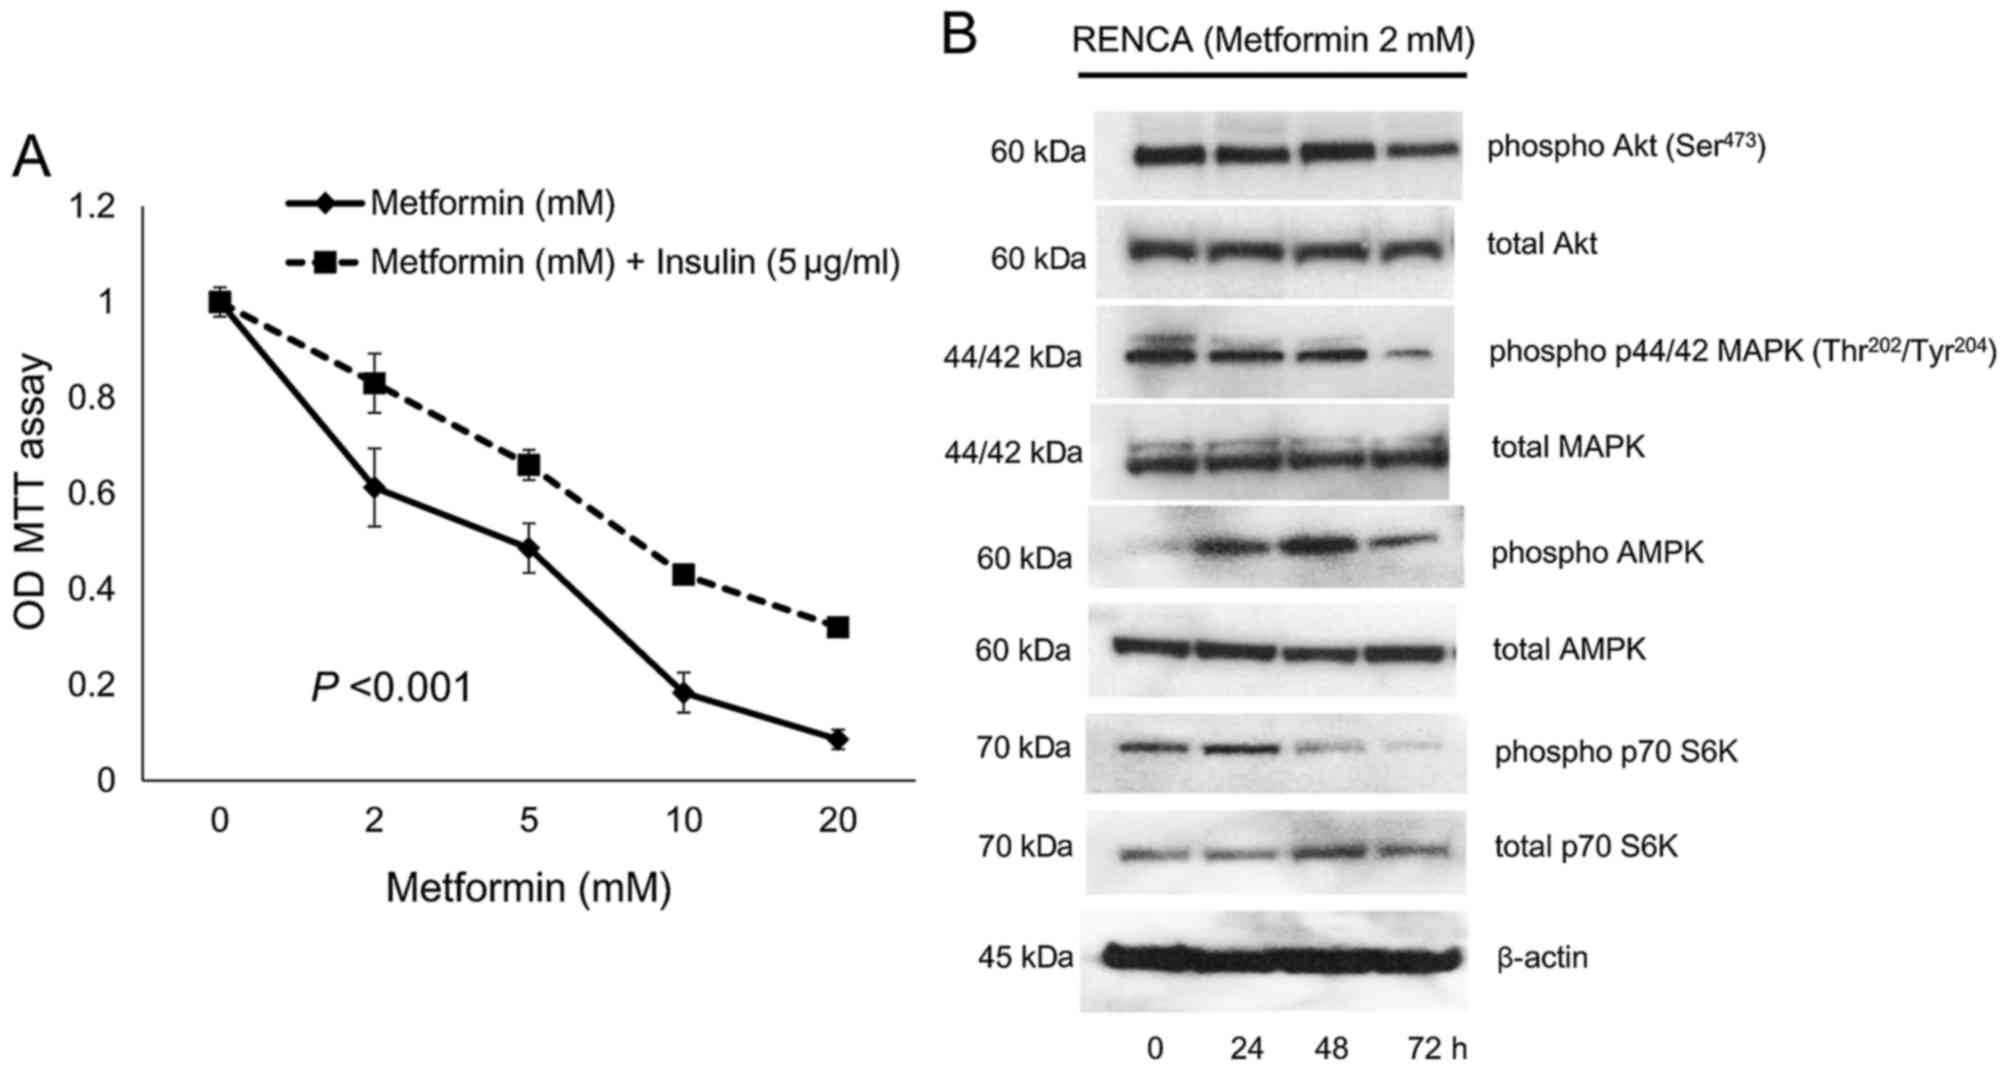
Metformin directly inhibits in vitro
RENCA proliferation
To confirm the direct effect of metformin on the
inhibition of the proliferation of RENCA cells in vitro, a
cell proliferation assay under various concentrations of metformin
with 4 µg/ml of insulin was evaluated. In vitro stimulation
of RENCA cells by insulin was inhibited in a dose-dependent manner
by metformin at 24 h (Fig. 6A).
Since, the suppressive effect of metformin on RENCA cells was
observed both in the presence and absence of insulin
supplementation in vitro, metformin directly inhibited in
vitro RENCA proliferation (Fig.
6A). The results of immunoblotting showed that metformin
enhanced the phosphorylation of AMPK at 24–48 h and inhibited that
of Akt, p44 MAPK and p70 S6K at 48–72 h (Fig. 6B).
Discussion
In the immunohistochemistry evaluation of RCC tumor
specimens, IR expression significantly decreased in tumors of ≥pT2,
patients with distant metastasis, and patients with serum C-peptide
levels higher than the median (Table
II). Disease-free and overall survival were significantly
better in patients with high-IR expression tumors (Allred scores of
6–8) than in those with low-IR expression tumor (Allred scores of
0-5; Fig. 2A and B; Table III). These results suggested that
a patient's hyperinsulinemia decreases the IR expression in RCC
tumors of aggressive phenotypes. However, preoperative serum
C-peptide level was not associated with disease-free or overall
survival in the present study. Furthermore, IR expression in RCC
tumor tissue was higher in low-grade tumors than in high-grade
tumors, although, the difference was not statistically significant
(P=0.085). The IR expression in human RCC cell lines was observed
in Caki-2 cells that were derived from primary tumors, whereas it
was absent in ACHN and Caki-1 cells that were derived from
metastatic disease (Fig. 3A). A
recent study from a Korean group showed similar results, although
the researchers did not observe a significant relationship between
survival and IR expression (30). A
similar inverse relationship among IR expression, tumor grade and
patient survival has been previously reported in breast cancer
(32,33).
The decreased IR expression in the murine RCC
allograft model in obese, hyperglycemic and hyperinsulinemic mice
induced by a high-carbohydrate diet was consistent with the results
from the immunohistochemical analysis of clinical RCC surgical
specimens. Moreover, decreased serum insulin levels, which were
induced by metformin treatment, increased IR expression in the
high-carbohydrate diet group (Fig. 5E
and F). These results suggest the presence of a negative
feedback pathway associated with the serum insulin level that
regulated the IR expression level in RCC tumor cells. In support of
this theory, a previous study showed that IR expression decreased
in intact skeletal muscle strips from obese and hyperinsulinemic
patients (41). In contrast, a
previous prostate cancer LNCaP xenograft study showed a positive
relationship between hyperinsulinemia and IR expression (38). The IR expression level in normal or
malignant cells may be positively or inversely regulated
distinctively by the serum insulin level according to the origin of
the tissue cell.
In the present murine RCC allograft model, a weak
tumor-promoting effect in RENCA tumors was associated with a
high-carbohydrate diet (Fig. 4D).
Cell proliferation and phosphorylation of Akt in RENCA cells were
enhanced by insulin in an in vitro study (Fig. 3C), and phosphorylation induced by a
high-carbohydrate diet of Akt in RENCA cells was also observed in
an in vivo study (Fig. 4E and
F). In contrast, phosphorylation of MAPK was also observed in
tumors in vivo but not in the in vitro cells
(Fig. 4E and F). These results
suggest that pathways other than the insulin-Akt signaling pathway
contributed to the weak tumor-promoting effect in the in
vivo model mice induced by a high-carbohydrate diet. The
results further suggest that, although, hyperinsulinemia promoted
RCC cell proliferation in the in vitro study, the
downregulation feedback effect of IR expression induced by
hyperinsulinemia and the contribution of other growth-promoting
pathways in the in vivo study may have complicated the
effect of a high-carbohydrate diet on RCC proliferation in the
in vivo RENCA allograft model.
To elucidate the real in vivo progression
effect of hyperinsulinemia induced by a high-carbohydrate diet, we
performed a second murine experiment using metformin to suppress
hyperinsulinemia in the high-carbohydrate diet group. Metformin is
a common anti-type 2 diabetes agent that lowers serum insulin
levels. The key mechanism of metformin is believed to be AMPK,
which inhibits mTOR. In RCC, metformin has been shown to suppress
RCC progression in both in vitro and in vivo studies
using the human RCC cell line 786-O (42). The mechanisms underlying the
suppressive effect of metformin for various cancers have been
suggested to involve direct and indirect pathways (3). The direct pathway of metformin
involves stimulation of AMPK in cancer cells, which leads to
decreased activity of downstream mitogenic molecules, such as Akt,
mTOR and S6K. The indirect metformin pathway involves suppression
of gluconeogenesis by stimulating AMPK in hepatocytes, which leads
to decreased hepatic glucose output and serum glucose levels, with
a secondary decrease in serum insulin levels (3,40). In
the present study, metformin significantly ameliorated obesity,
hyperglycemia and hyperinsulinemia induced by a high-carbohydrate
diet in the second in vivo experiment (Fig. 5B and C). However, the tumor
suppressive effect of metformin was observed in both the low- and
high-carbohydrate diet groups, even though decreased serum insulin
levels were observed only in the high-carbohydrate diet group
(Fig. 5D). Moreover, the direct
metformin anticancer effect induced by AMPK stimulation was also
observed in RENCA cells in vitro (Fig. 6). These results indicated that the
tumor suppressive effect of metformin in the present study resulted
from the direct effect of the agent rather than the indirect effect
of suppression of serum insulin levels. The expected indirect
effect of metformin, which was previously reported in a murine
colorectal cancer allograft model, was not observed in the present
RCC allograft model (39).
Although, it may be inappropriate to apply the results of the
murine allograft experiment directly to human clinical settings,
the results of the present RENCA model appear to support the
present clinical result that the preoperative serum C-peptide level
was not associated with RCC recurrence or survival.
The clinical analysis results of the present study
showed that disease-free or overall survival was significantly
better in patients with a BMI greater than or equal to the median.
This finding was consistent with the ‘obese paradox’ in RCC that
has been suggested by multiple epidemiological studies (14–21)
(Fig. 2E and F). The weakness or
lack of a tumor acceleration effect of hyperinsulinemia observed in
the present clinical and murine RCC model studies partly explained
the ‘obese paradox’ in RCC. In contrast, the finding of a low IR
expression level associated with the aggressive phenotypes of RCC,
such as tumors of ≥pT2, or poor disease-free survival in the
present clinical analysis was contradictory (Tables II and III). The discrepancy could be explained
by the hypothesis that hyperinsulinemia may have a stronger role in
carcinogenesis of aggressive types of RCC rather than in cancer
progression after tumor development. Notably, Othman et al
reported insulin-mediated genotoxicity associated with the PI3K-Akt
signaling pathway in kidney cells (43), and this type of genotoxicity causes
the genesis of aggressive types of RCC with DNA hypermutations.
Further investigation is warranted to elucidate the mechanism of
the ‘obesity paradox’ in RCC progression.
Collectively, we found that IR expression in RCC
tissue was inversely associated with cancer progression in the
clinical and murine experimental model studies. The anticancer
effect of metformin in the murine RCC experimental model was mainly
a direct effect of metformin rather than an indirect effect
involving suppression of serum insulin levels. The tumor-promoting
effect of hyperinsulinemia in RENCA tumors was not clearly observed
in either the clinical or murine experimental model studies.
Decreased IR expression in high-stage RCC tumors with poor
prognosis may be the result of downregulation induced by the host's
hyperinsulinemia.
Acknowledgements
The present study was in part supported by grants
(nos. 23791738, 24592373, 24592374, 25462466, 25293332 and
26670695) from the Japanese Society for the Promotion of
Science.
Glossary
Abbreviations
Abbreviations:
|
DM
|
diabetes mellitus
|
|
RCC
|
renal cell carcinoma
|
|
IR
|
insulin receptor
|
|
IGF1R
|
insulin-like growth factor 1
receptor
|
|
BMI
|
body mass index
|
References
|
1
|
Cohen DH and LeRoith D: Obesity, type 2
diabetes, and cancer: The insulin and IGF connection. Endocr Relat
Cancer. 19:F27–F45. 2012. View Article : Google Scholar : PubMed/NCBI
|
|
2
|
Ohnishi H, Saitoh S, Takagi S, Ohata J,
Takeuchi H, Isobe T, Katoh N, Chiba Y, Fujiwara T, Akasaka H, et
al: Incidence of insulin resistance in obese subjects in a rural
Japanese population: The Tanno and Sobetsu study. Diabetes Obes
Metab. 7:83–87. 2005. View Article : Google Scholar : PubMed/NCBI
|
|
3
|
Pollak M: Insulin and insulin-like growth
factor signalling in neoplasia. Nat Rev Cancer. 8:915–928. 2008.
View Article : Google Scholar : PubMed/NCBI
|
|
4
|
Nepple KG, Yang L, Grubb RL III and Strope
SA: Population based analysis of the increasing incidence of kidney
cancer in the United States: Evaluation of age specific trends from
1975 to 2006. J Urol. 187:32–38. 2012. View Article : Google Scholar : PubMed/NCBI
|
|
5
|
Bergström A, Hsieh CC, Lindblad P, Lu CM,
Cook NR and Wolk A: Obesity and renal cell cancer - a quantitative
review. Br J Cancer. 85:984–990. 2001. View Article : Google Scholar : PubMed/NCBI
|
|
6
|
Calle EE, Rodriguez C, Walker-Thurmond K
and Thun MJ: Overweight, obesity, and mortality from cancer in a
prospectively studied cohort of U.S. adults. N Engl J Med.
348:1625–1638. 2003. View Article : Google Scholar : PubMed/NCBI
|
|
7
|
Renehan AG, Tyson M, Egger M, Heller RF
and Zwahlen M: Body-mass index and incidence of cancer: A
systematic review and meta-analysis of prospective observational
studies. Lancet. 371:569–578. 2008. View Article : Google Scholar : PubMed/NCBI
|
|
8
|
Sawada N, Inoue M, Sasazuki S, Iwasaki M,
Yamaji T, Shimazu T and Tsugane S: JPHC Study Group: Body mass
index and subsequent risk of kidney cancer: A prospective cohort
study in Japan. Ann Epidemiol. 20:466–472. 2010. View Article : Google Scholar : PubMed/NCBI
|
|
9
|
Wideroff L, Gridley G, Mellemkjaer L, Chow
WH, Linet M, Keehn S, Borch-Johnsen K and Olsen JH: Cancer
incidence in a population-based cohort of patients hospitalized
with diabetes mellitus in Denmark. J Natl Cancer Inst.
89:1360–1365. 1997. View Article : Google Scholar : PubMed/NCBI
|
|
10
|
Inoue M, Iwasaki M, Otani T, Sasazuki S,
Noda M and Tsugane S: Diabetes mellitus and the risk of cancer:
Results from a large-scale population-based cohort study in Japan.
Arch Intern Med. 166:1871–1877. 2006. View Article : Google Scholar : PubMed/NCBI
|
|
11
|
Washio M, Mori M, Khan M, Sakauchi F,
Watanabe Y, Ozasa K, Hayashi K, Miki T, Nakao M, Mikami K, et al:
JACC Study Group: Diabetes mellitus and kidney cancer risk: The
results of Japan Collaborative Cohort Study for Evaluation of
Cancer Risk (JACC Study). Int J Urol. 14:393–397. 2007. View Article : Google Scholar : PubMed/NCBI
|
|
12
|
Pierce BL, Plymate S, Ostrander EA and
Stanford JL: Diabetes mellitus and prostate cancer risk. Prostate.
68:1126–1132. 2008. View Article : Google Scholar : PubMed/NCBI
|
|
13
|
Kasper JS and Giovannucci E: A
meta-analysis of diabetes mellitus and the risk of prostate cancer.
Cancer Epidemiol Biomarkers Prev. 15:2056–2062. 2006. View Article : Google Scholar : PubMed/NCBI
|
|
14
|
Parker AS, Lohse CM, Cheville JC, Thiel
DD, Leibovich BC and Blute ML: Greater body mass index is
associated with better pathologic features and improved outcome
among patients treated surgically for clear cell renal cell
carcinoma. Urology. 68:741–746. 2006. View Article : Google Scholar : PubMed/NCBI
|
|
15
|
Awakura Y, Nakamura E, Ito N, Yamasaki T,
Kamba T, Kamoto T and Ogawa O: Influence of body mass index on
prognosis of Japanese patients with renal cell carcinoma. Urology.
70:50–54. 2007. View Article : Google Scholar : PubMed/NCBI
|
|
16
|
Schrader AJ, Rustemeier J, Rustemeier JC,
Timmesfeld N, Varga Z, Hegele A, Olbert PJ and Hofmann R:
Overweight is associated with improved cancer-specific survival in
patients with organ-confined renal cell carcinoma. J Cancer Res
Clin Oncol. 135:1693–1699. 2009. View Article : Google Scholar : PubMed/NCBI
|
|
17
|
Jeon HG, Jeong IG, Lee JH, Lee CJ, Kwak C,
Kim HH, Lee SE and Lee E: Prognostic value of body mass index in
Korean patients with renal cell carcinoma. J Urol. 183:448–454.
2010. View Article : Google Scholar : PubMed/NCBI
|
|
18
|
Waalkes S, Merseburger AS, Kramer MW,
Herrmann TR, Wegener G, Rustemeier J, Hofmann R, Schrader M, Kuczyk
MA and Schrader AJ: Obesity is associated with improved survival in
patients with organ-confined clear-cell kidney cancer. Cancer
Causes Control. 21:1905–1910. 2010. View Article : Google Scholar : PubMed/NCBI
|
|
19
|
Carnethon MR, De Chavez PJ, Biggs ML,
Lewis CE, Pankow JS, Bertoni AG, Golden SH, Liu K, Mukamal KJ,
Campbell-Jenkins B, et al: Association of weight status with
mortality in adults with incident diabetes. JAMA. 308:581–590.
2012. View Article : Google Scholar : PubMed/NCBI
|
|
20
|
Choi Y, Park B, Jeong BC, Seo SI, Jeon SS,
Choi HY, Adami HO, Lee JE and Lee HM: Body mass index and survival
in patients with renal cell carcinoma: A clinical-based cohort and
meta-analysis. Int J Cancer. 132:625–634. 2013. View Article : Google Scholar : PubMed/NCBI
|
|
21
|
Hakimi AA, Furberg H, Zabor EC, Jacobsen
A, Schultz N, Ciriello G, Mikklineni N, Fiegoli B, Kim PH, Voss MH,
et al: An epidemiologic and genomic investigation into the obesity
paradox in renal cell carcinoma. J Natl Cancer Inst. 105:1862–1870.
2013. View Article : Google Scholar : PubMed/NCBI
|
|
22
|
Freedland SJ, Aronson WJ, Kane CJ, Presti
JC Jr, Amling CL, Elashoff D and Terris MK: Impact of obesity on
biochemical control after radical prostatectomy for clinically
localized prostate cancer: A report by the Shared Equal Access
Regional Cancer Hospital database study group. J Clin Oncol.
22:446–453. 2004. View Article : Google Scholar : PubMed/NCBI
|
|
23
|
Ho T, Gerber L, Aronson WJ, Terris MK,
Presti JC, Kane CJ, Amling CL and Freedland SJ: Obesity,
prostate-specific antigen nadir, and biochemical recurrence after
radical prostatectomy: Biology or technique? Results from the
SEARCH database. Eur Urol. 62:910–916. 2012. View Article : Google Scholar : PubMed/NCBI
|
|
24
|
Bhindi B, Kulkarni GS, Finelli A, Alibhai
SM, Hamilton RJ, Toi A, van der Kwast TH, Evans A, Hersey K, Jewett
MA, et al: Obesity is associated with risk of progression for
low-risk prostate cancers managed expectantly. Eur Urol.
66:841–848. 2014. View Article : Google Scholar : PubMed/NCBI
|
|
25
|
Ladoire S, Dalban C, Roché H, Spielmann M,
Fumoleau P, Levy C, Martin AL, Ecarnot F, Bonnetain F and
Ghiringhelli F: Effect of obesity on disease-free and overall
survival in node-positive breast cancer patients in a large French
population: A pooled analysis of two randomised trials. Eur J
Cancer. 50:506–516. 2014. View Article : Google Scholar : PubMed/NCBI
|
|
26
|
Gennari A, Nanni O, Puntoni M, DeCensi A,
Scarpi E, Conte P, Antonucci G, Amadori D and Bruzzi P: Body mass
index and prognosis of metastatic breast cancer patients receiving
first-line chemotherapy. Cancer Epidemiol Biomarkers Prev.
22:1862–1867. 2013. View Article : Google Scholar : PubMed/NCBI
|
|
27
|
Psutka SP, Stewart SB, Boorjian SA, Lohse
CM, Tollefson MK, Cheville JC, Leibovich BC and Thompson RH:
Diabetes mellitus is independently associated with an increased
risk of mortality in patients with clear cell renal cell carcinoma.
J Urol. 192:1620–1627. 2014. View Article : Google Scholar : PubMed/NCBI
|
|
28
|
Antonelli A, Arrighi N, Corti S, Zanotelli
T, Cozzoli A, Cunico Cosciani S and Simeone C: Pre-existing type 2
diabetes is not an adverse prognostic factor in patients with renal
cell carcinoma: A single-center retrospective study. Urol Oncol.
31:1310–1315. 2013. View Article : Google Scholar : PubMed/NCBI
|
|
29
|
Kellerer M, von Eye Corleta H, Mühlhöfer
A, Capp E, Mosthaf L, Bock S, Petrides PE and Häring HU: Insulin-
and insulin-like growth-factor-I receptor tyrosine-kinase
activities in human renal carcinoma. Int J Cancer. 62:501–507.
1995. View Article : Google Scholar : PubMed/NCBI
|
|
30
|
Lkhagvadorj S, Oh SS, Lee MR, Jung JH,
Chung HC, Cha SK and Eom M: Insulin receptor expression in clear
cell renal cell carcinoma and its relation to prognosis. Yonsei Med
J. 55:861–870. 2014. View Article : Google Scholar : PubMed/NCBI
|
|
31
|
Law JH, Habibi G, Hu K, Masoudi H, Wang
MY, Stratford AL, Park E, Gee JM, Finlay P, Jones HE, et al:
Phosphorylated insulin-like growth factor-i/insulin receptor is
present in all breast cancer subtypes and is related to poor
survival. Cancer Res. 68:10238–10246. 2008. View Article : Google Scholar : PubMed/NCBI
|
|
32
|
Mulligan AM, O'Malley FP, Ennis M, Fantus
IG and Goodwin PJ: Insulin receptor is an independent predictor of
a favorable outcome in early stage breast cancer. Breast Cancer Res
Treat. 106:39–47. 2007. View Article : Google Scholar : PubMed/NCBI
|
|
33
|
Mathieu MC, Clark GM, Allred DC, Goldfine
ID and Vigneri R: Insulin receptor expression and clinical outcome
in node-negative breast cancer. Proc Assoc Am Physicians.
109:565–571. 1997.PubMed/NCBI
|
|
34
|
Goodwin PJ, Ennis M, Pritchard KI, Trudeau
ME, Koo J, Madarnas Y, Hartwick W, Hoffman B and Hood N: Fasting
insulin and outcome in early-stage breast cancer: Results of a
prospective cohort study. J Clin Oncol. 20:42–51. 2002. View Article : Google Scholar : PubMed/NCBI
|
|
35
|
Muti P, Quattrin T, Grant BJ, Krogh V,
Micheli A, Schünemann HJ, Ram M, Freudenheim JL, Sieri S, Trevisan
M, et al: Fasting glucose is a risk factor for breast cancer: A
prospective study. Cancer Epidemiol Biomarkers Prev. 11:1361–1368.
2002.PubMed/NCBI
|
|
36
|
Cox ME, Gleave ME, Zakikhani M, Bell RH,
Piura E, Vickers E, Cunningham M, Larsson O, Fazli L and Pollak M:
Insulin receptor expression by human prostate cancers. Prostate.
69:33–40. 2009. View Article : Google Scholar : PubMed/NCBI
|
|
37
|
Ma J, Li H, Giovannucci E, Mucci L, Qiu W,
Nguyen PL, Gaziano JM, Pollak M and Stampfer MJ: Prediagnostic
body-mass index, plasma C-peptide concentration, and prostate
cancer-specific mortality in men with prostate cancer: A long-term
survival analysis. Lancet Oncol. 9:1039–1047. 2008. View Article : Google Scholar : PubMed/NCBI
|
|
38
|
Venkateswaran V, Haddad AQ, Fleshner NE,
Fan R, Sugar LM, Nam R, Klotz LH and Pollak M: Association of
diet-induced hyperinsulinemia with accelerated growth of prostate
cancer (LNCaP) xenografts. J Natl Cancer Inst. 99:1793–1800. 2007.
View Article : Google Scholar : PubMed/NCBI
|
|
39
|
Allred DC, Harvey JM, Berardo M and Clark
GM: Prognostic and predictive factors in breast cancer by
immunohistochemical analysis. Mod Pathol. 11:155–168.
1998.PubMed/NCBI
|
|
40
|
Algire C, Zakikhani M, Blouin MJ, Shuai JH
and Pollak M: Metformin attenuates the stimulatory effect of a
high-energy diet on in vivo LLC1 carcinoma growth. Endocr Relat
Cancer. 15:833–839. 2008. View Article : Google Scholar : PubMed/NCBI
|
|
41
|
Goodyear LJ, Giorgino F, Sherman LA, Carey
J, Smith RJ and Dohm GL: Insulin receptor phosphorylation, insulin
receptor substrate-1 phosphorylation, and phosphatidylinositol
3-kinase activity are decreased in intact skeletal muscle strips
from obese subjects. J Clin Invest. 95:2195–2204. 1995. View Article : Google Scholar : PubMed/NCBI
|
|
42
|
Liu J, Li M, Song B, Jia C, Zhang L, Bai X
and Hu W: Metformin inhibits renal cell carcinoma in vitro and in
vivo xenograft. Urol Oncol. 31:264–270. 2013. View Article : Google Scholar : PubMed/NCBI
|
|
43
|
Othman EM, Hintzsche H and Stopper H:
Signaling steps in the induction of genomic damage by insulin in
colon and kidney cells. Free Radic Biol Med. 68:247–257. 2014.
View Article : Google Scholar : PubMed/NCBI
|