Introduction
Breast cancer is the second most common cause of
death for women around the world. Clinical decisions primarily rely
on the assessment of the expression of the endocrine receptors for
estrogen (ER), progesterone (PR) and the aberrant expression of
human epidermal growth factor receptor 2 (HER2). Triple-negative
breast cancer (TNBC) is a breast tumor that lacks the expression of
ER, PR and HER2 (1). Thus, TNBC is
not sensitive to endocrine therapy or target therapy such as
Herceptin against HER2. Patients with TNBC usually have a poorer
outcome compared with other cancer subtypes due to its aggressive
clinical behavior and a lack of recognized molecular therapy
targets (2,3). Therefore, there is clearly an urgent
need to better understand the molecular basis of TNBC.
G protein-coupled estrogen receptor (GPER, also
called GPR30), a novel estrogen receptor belonging to GPCR family,
is extensively expressed within organs such as breast, ovary,
uterus, brain and kidney. Sharing the same ligand as traditional
ER, estrogen binding with GPER can activate G protein and lead to
production of cAMP, calcium mobilization, ERK1/2 and Akt signaling
activation to promote cell growth and proliferation (4). GPER is expressed extensively in TNBC
clinical specimens and positively associated with high recurrence
of TNBCs (5). The study from Pandey
et al (6) indicated that
GPER activation by estrogen or hydroxytamoxifen, an ER antagonist
but GPER agonist, promoted proliferation of SKBR3 ER-negative
breast cancer cell line. Several studies reported that GPER
activation by estrogen induced proliferation in TNBC cell lines
(7–9). Treatment with 17β-estradiol, G-1 (GPER
specific agonist) and tamoxifen led to rapid activation of ERK
signaling and significantly promoted the viability and motility of
MDA-MB-468 and MDA-MB-436 TNBC cells (8). Therefore, overactivation of GPER has
been considered as a key feature during the development and
progression of TNBCs (5–7,10).
However, the molecular mechanisms of GPER regulation in TNBC are
still largely unknown. Better understanding of the mechanisms
involved in promoting cell proliferation in TNBC development and
progression may aid in the clarity of the pathogenesis of TNBC and
advancement of more effective therapy.
GPER contains a PDZ binding motif at its carboxyl
terminus. In our previous study, we found that
Na+/H+ exchanger regulatory factor 1 (NHERF1,
also identified as EBP50) interacts with GPER. NHERF1 is a PDZ
protein with two tandem PDZ domains and an ERM domain (11). The interaction of NHERF1 with GPER
is mediated by the PDZ2 domain of NHERF1 and the PDZ binding motif
of GPER (12). Increasing evidence
has shown that NHERF1 is involved in many tumor types such as
glioblastoma (13), colorectal
(14), and breast cancer (15). In ER-positive breast cancer, NHERF1
was upregulated and positively associated with activation of GPER
signaling (12). Conversely, NHERF1
is deficient in two-thirds of the more aggressive ER-negative
breast tumors (16,17). Stemmer-Rachamimov et al
(18) reported that NHERF1
expression was lower or absent in ER-negative breast carcinoma.
However, detailed mechanisms of PDZ proteins in regulating GPER
activation in TNBC remain elusive.
In the present study, we first analyzed the
expression levels of GPER in TCGA breast cancer dataset and found
relatively lower levels of GPER mRNA in TNBCs as compared with
normal breast tissues. Whereas, gene signatures of GPER activation
were enriched in TNBC samples in comparison with normal breast
tissue by Gene Set Enrichment Analysis (GSEA), indicating that GPER
was over activated in TNBC. Thus, we proposed a hypothesis that
GPER underwent some unknown mechanisms to facilitate GPER signaling
activation in TNBC. We then used a cell model in further
experiments and verified NHERF1/GPER interaction in MDA-MB-231
cells. We also found that NHERF1 overexpression inhibited
GPER-mediated proliferation of MDA-MB-231 cells via inhibition of
the phosphorylation of ERK1/2 and Akt. Furthermore, downregulation
of NHERF1 was detected in TNBC cell lines and stage I of TNBC
patients. Gene signatures of GPER activation, ERK1/2 and Akt
pathways, and cell proliferation were positively associated with
TNBC patients with lower NHERF1 expression. These results provide
the first direct evidence that NHERF1 plays a critical role in the
regulation of GPER signaling in TNBCs. NHERF1 downregulation in
early stage of TNBCs may trigger overactivation of GPER signaling,
leading to an enhancement of the proliferation and development of
TNBC cancer cells.
Materials and methods
Cell culture and transfection
HEK293, MCF-7 and HTB-126 cells were grown in
complete Dulbeccos modified Eagles medium (DMEM) with 10% fetal
bovine serum (FBS) and 1% penicillin/streptomycin. MDA-MB-231,
T47D, BT474 and SKBR3 cells were maintained in complete RPMI-1640
medium (RPMI-1640 with 10% FBS and 1% penicillin/streptomycin).
MDA-MB-231 and MCF-7 were obtained from the American Type Culture
Collection (ATCC; Manassas, VA, USA). HEK293, HTB-126, T47D, BT474
and SKBR3 were purchased from the Cell Resource Center of the
Institute of Basic Medical Sciences, Chinese Academy of Medical
Sciences. MDA-MB-231 cells that stably expressed HA-NHERF1 or
HA-vector were selected with the growth medium containing 400 µg/ml
of G418 and maintained in growth medium containing 200 µg/ml of
G418 (Calbiochem, San Diego, CA, USA). All cells were cultured in a
37°C/5% CO2 incubator. For stimulation of ERK and Akt
signaling, cells were maintained in phenol red-free medium (Life
Technologies, Inc., Carlsbad, CA, USA) for 24 h. The cells were
treated with E2 (Sigma-Aldrich, St. Louis, MO, USA) or G-1 (Tocris
Bioscience, Minneapolis, MN, USA) at 37°C for indicated times.
After the medium was removed, cells were harvested in sodium
dodecyl sulfate (SDS) sample buffer and analyzed via western
blotting. The cells were transfected by using Lipofectamine 2000
(Invitrogen, Carlsbad, CA, USA) according to the manufacturer's
instructions. The pBK-CMV-HA-vector and pBK-CMV-HA-NHERF1 plasmid
were kindly provided by Dr Randy Hall from Emory University.
Antibodies and reagents
Protein A/G PLUS agarose (#sc-2003) was purchased
from Santa Cruz Biotechnology (Santa Cruz, CA, USA). Anti-MAP
Kinase1/2 (Erk1/2) (#06-182) and anti-phospho-MAP Kinase1/2
(Erk1/2) (#05-481) antibodies were purchased from Millipore
(Bedford, MA, USA). Anti-Akt (#9272) and anti-phospho-Akt (Ser473)
(#4060s) antibodies were purchased from Cell Signaling Technology
(Danvers, MA, USA). The monoclonal rabbit anti-GPER (#sc-48525-R)
antibody was purchased from Santa Cruz Biotechnology. The
monoclonal mouse anti-NHERF1 IgG2b (#MA1-19292) was from Thermo
Fisher Scientific (Rockford, IL, USA). The polyclonal rabbit
anti-HA (#561) antibody was obtained from MBL (Nagoya, Japan).
Anti-GAPDH antibody was obtained from ZSGB-BIO (Beijing,
China).
Western blotting
Whole cell lysates or immunoprecipitated samples
were resolved using 10% SDS-PAGE gels and transferred to PVDF
membrane (Millipore). The membranes were blocked with 5% non-fat
dried milk for 1 h at room temperature, and the membranes were
incubated in primary antibody overnight at 4°C. After washed with
TBST, the membranes were incubated with horseradish peroxidase
(HRP)-conjugated (ZSGB-BIO) or infrared fluorescent dyes
(IRDye)-conjugated (LI-COR Biosciences, Lincoln, NE, USA) secondary
antibodies for 1 h. The membranes were washed four times and
detected by enhanced chemiluminescence (ECL) detection reagents
(Thermo Fisher Scientific) or Odyssey infrared imaging system
(LI-COR Biosciences), respectively.
Co-immunoprecipitation assay
Co-immunoprecipitation was performed as previously
described (12). The cell lysates
were incubated with IgG pre-bound to protein A/G-agarose beads in
the presence or absence of anti-GPER antibody at 4°C for 3 h, and
then the beads were washed with washing buffer at 4°C, 3,000 rpm
for 1 min, 5 times, respectively. Precipitated fractions were
resuspended in loading buffer and boiled for 5 min for eluting the
proteins from the beads followed by western blotting.
Immunofluorescence
Immunofluorescence was performed as previously
described (12). Cells on glass
coverslips were rinsed with phosphate-buffered saline (PBS) three
times. Cells were fixed in 4% paraformaldehyde for 20 min and
perforated with 0.1% Triton X-100 in PBS for 5 min at room
temperature. After washing three times with PBS, the cells on glass
coverslips were stained with primary antibodies diluted in the
blocking buffer (1% BSA in PBS) respectively for 1 h at room
temperature. After washing three times, coverslips were incubated
with Alexa-488/594-conjugated secondary antibodies (Life
Technology; 1:100) for 45 min. After washing three times, nuclei
were stained with DAPI. The coverslips were then mounted on glass
slide and then were placed at room temperature for 24 h. The slides
were visualized by a confocal microscope (Leica TCS SP8; Leica
Microsystems, Heidelberg, Germany) with a 63x oil immersion
objective.
Proliferation assay
Cell Counting kit-8 (CCK8) assay was performed to
detect the cell proliferation rate. MDA-MB-231 cells were seeded at
a density of 3,000 cells/well into 96-well plates with phenol
red-free RPMI-1640 medium with 2% charcoal stripped-FBS. Cells were
cultured overnight and then treated with 10 nM E2 or control with
2% charcoal stripped-FBS for continuous stimulation and the
proliferation rates were detected at 0, 48 and 96 h, respectively
(19). The absorbance was detected
at 450 nm.
The Cancer Genome Atlas (TCGA)
data
Gene expression profiles of breast cancer were
downloaded from The Cancer Genome Atlas (TCGA) database (http://cancergenome.nih.gov/). The mRNA levels of
NHERF1 and GPER were analyzed in the present study. Clinical data
were downloaded from cBioPortal database (www.cbioportal.org).
Gene set enrichment analysis
Correlation between the levels of NHERF1 and
biological processes was analyzed using Gene Set Enrichment
Analysis (GSEA v2.0, http://www.broad.mit.edu/gsea/). The gene sets of ERK,
Akt and proliferation were downloaded from GSEA website. The gene
set associated with GPER activation was obtained from GEO datasets
(GSE28645) and analyzed with GEO2R. GSEA calculates a pathway
Enrichment Score (ES) that evaluates whether genes from pre-defined
gene set were enriched among the highest- (or lowest-) ranked genes
or distributed randomly. Default settings were used. Thresholds for
significance were determined by permutation analysis (1000
permutations). False discovery rate (FDR) was calculated. A gene
set was considered significantly enriched when the FDR score was
<0.25 as described on the GSEA website.
Statistical analysis
Statistical analyses were performed using the SPSS
18.0 (SPSS, Inc., Chicago, IL, USA). Results are expressed as mean
± SD. Two-tailed unpaired Students t-test and Pearsons Chi-square
test was used to determine statistical significance. Statistical
significance was accepted at p<0.05.
Results
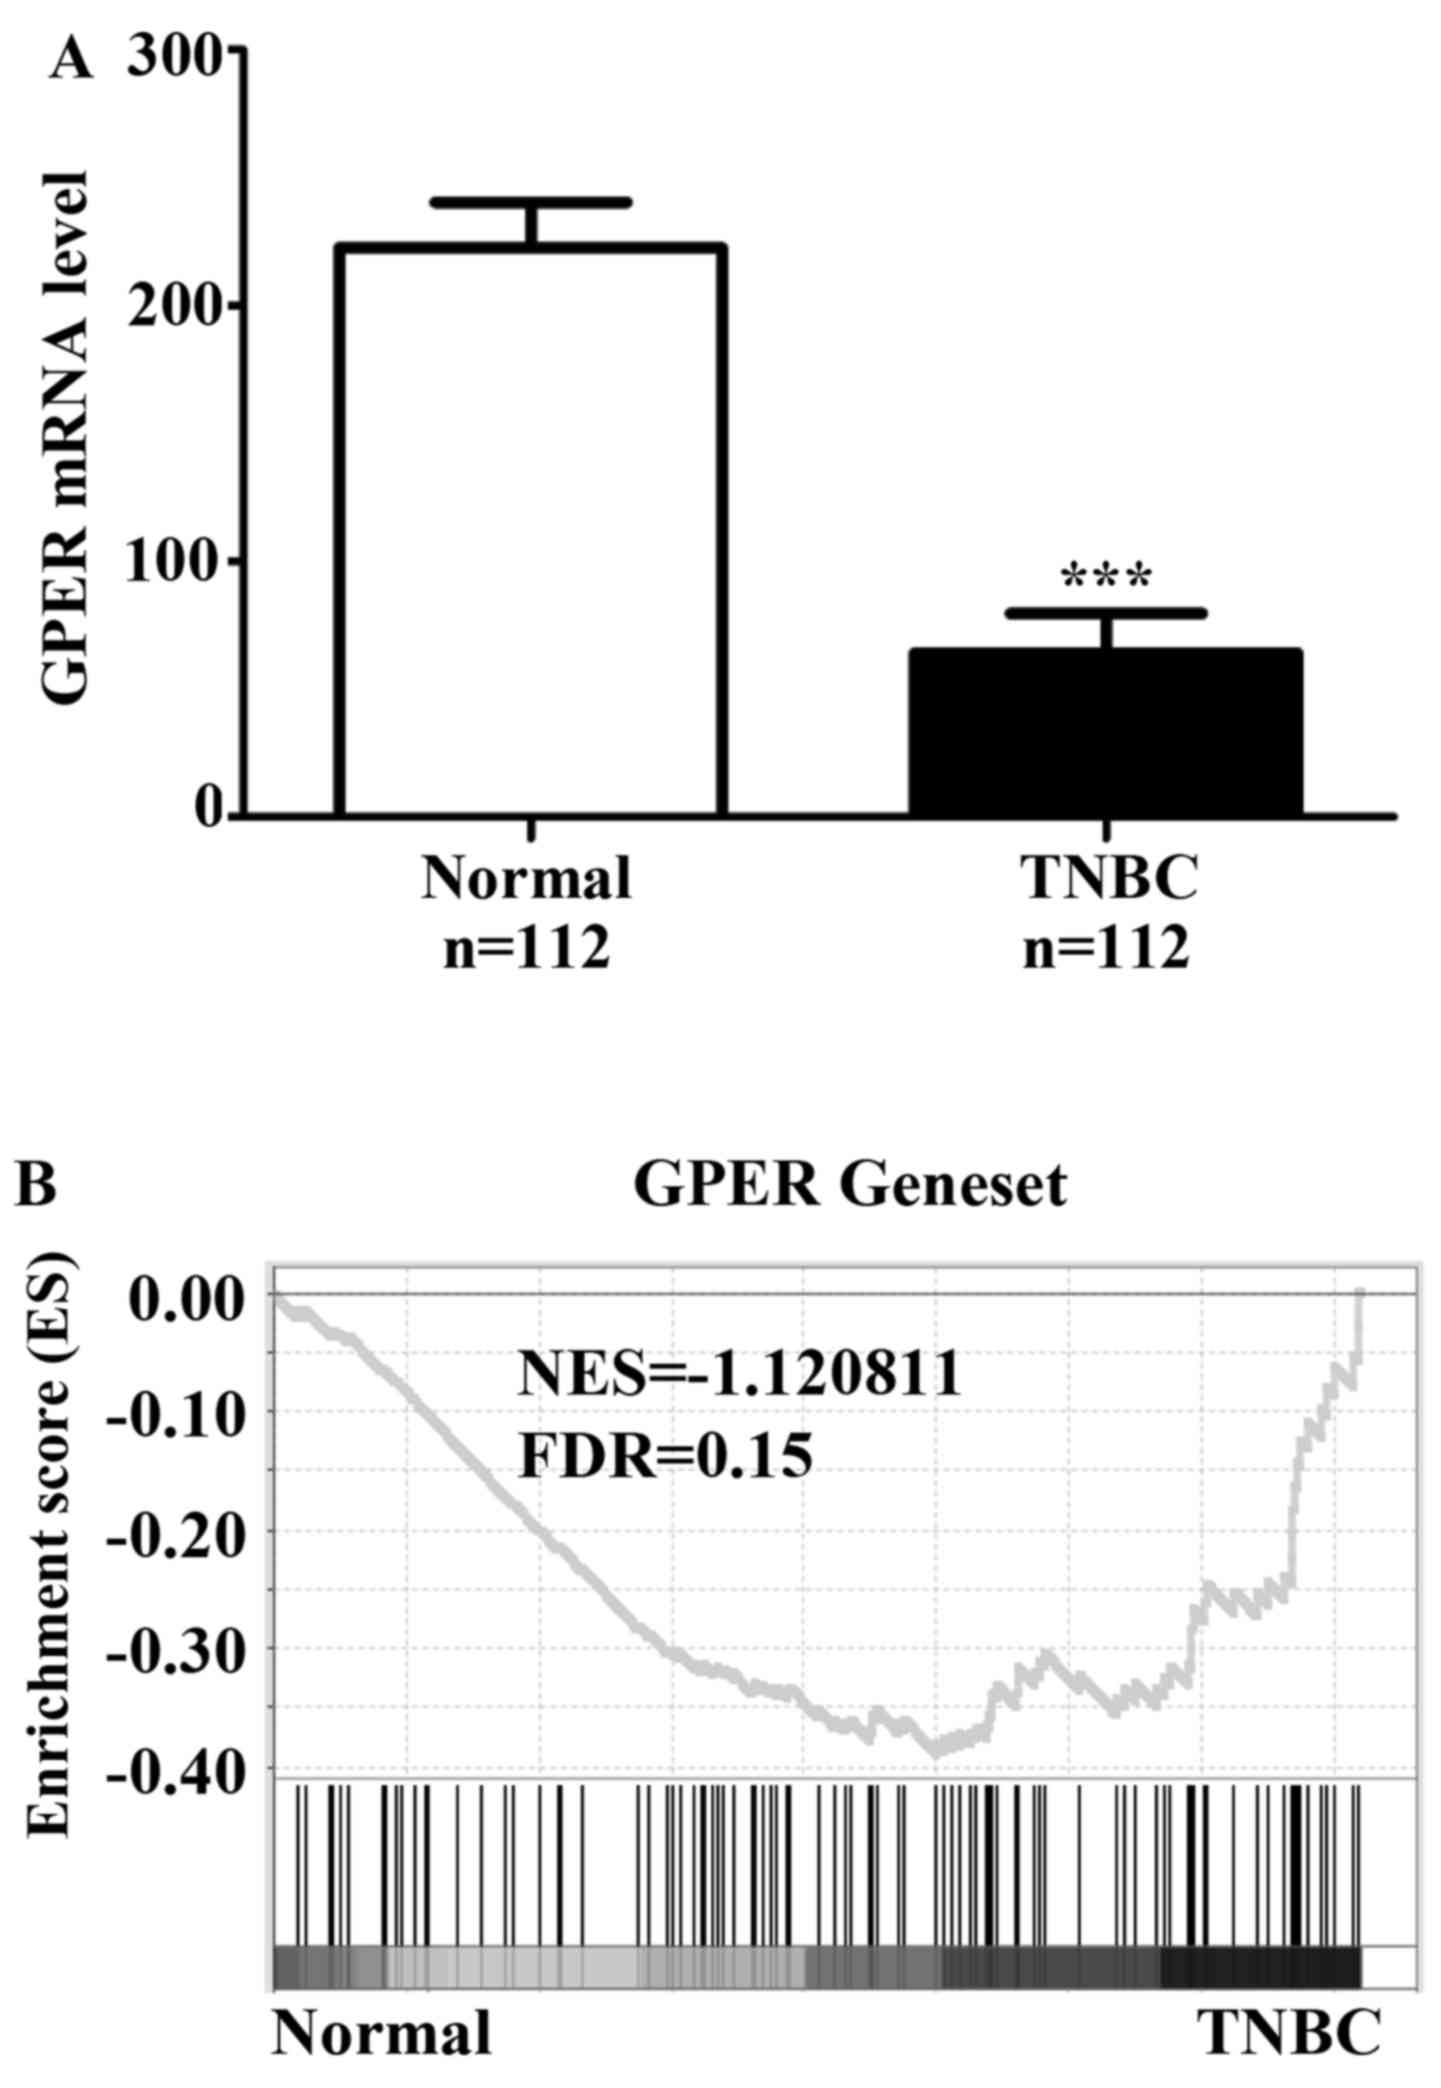
The levels of GPER are downregulated
and GPER signaling is activated in TNBC patients
Based on the reports from other groups which showed
that activation of GPER signaling was detected in TNBC (5–7), we
firstly analyzed the mRNA levels of GPER in TCGA data containing a
group of 112 normal breast tissues and another group of 112 TNBC
patients. Data showed that GPER mRNA levels were significantly
lower in TNBCs as compared with normal breast tissues (Fig. 1A), and there was no mutation or copy
number change of GPER in these specimens. As we analyzed the
activation of GPER signaling by GSEA, results showed that gene
signatures of GPER signaling were enriched in TNBCs in comparison
with normal breast tissues (Fig.
1B). These findings confirmed that the GPER signaling in TNBC
is activated in TNBCs.
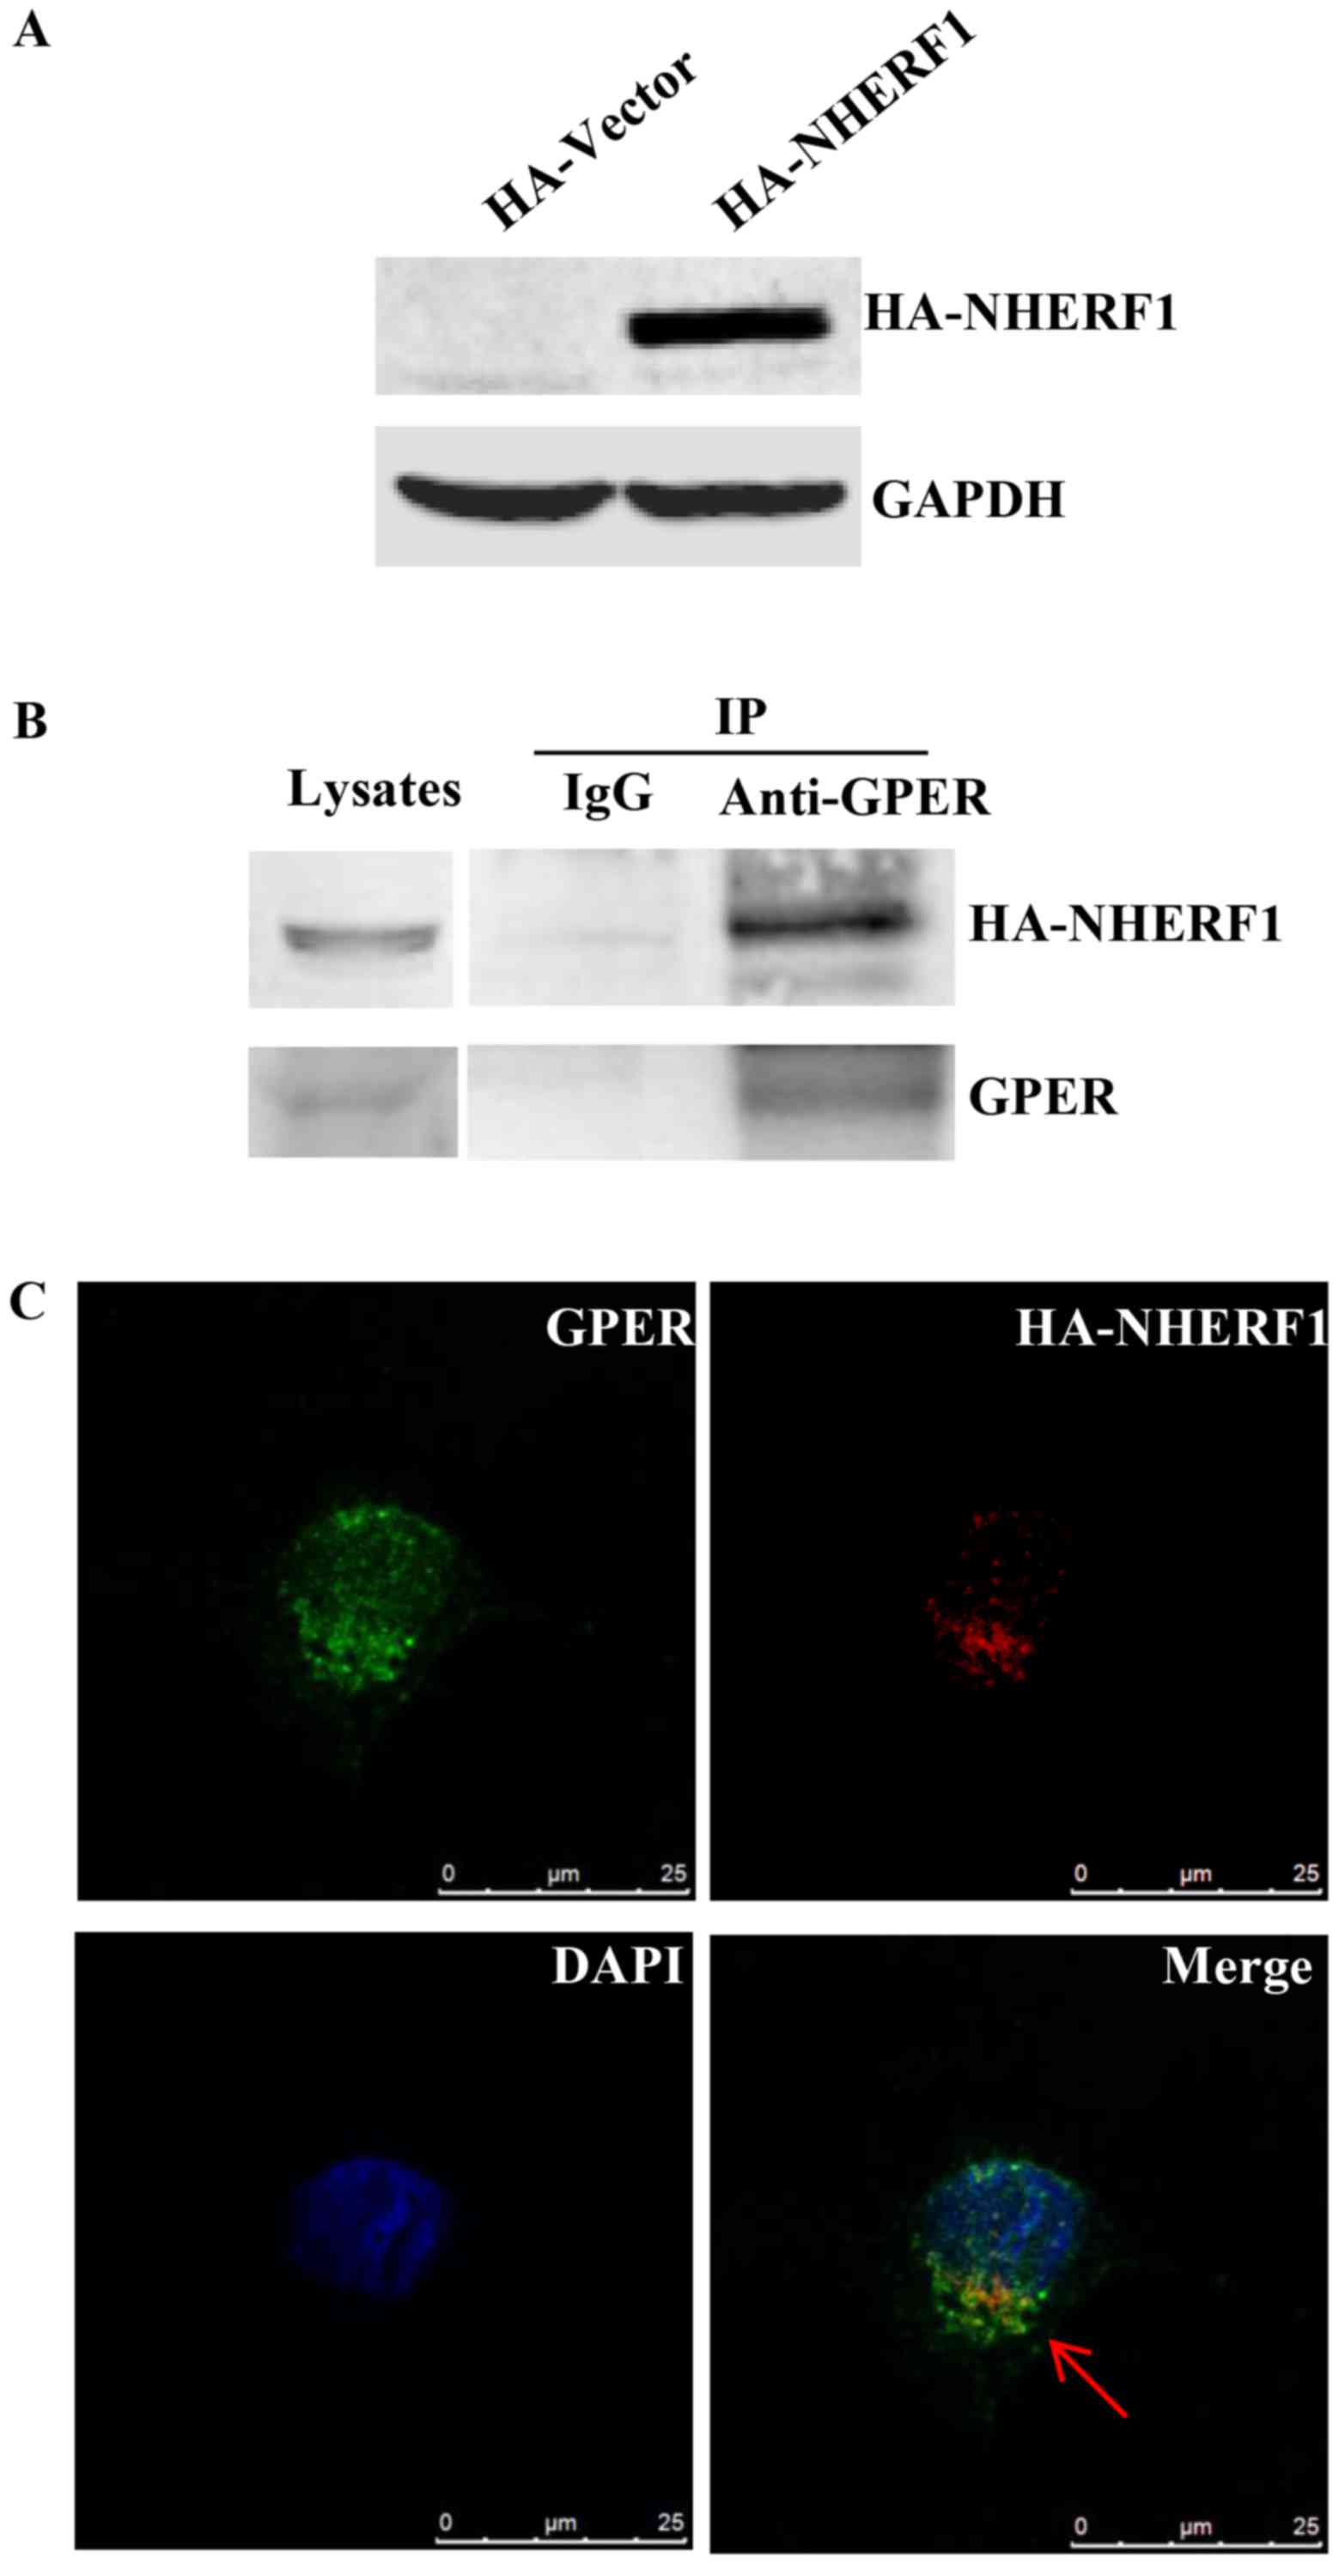
NHERF1 interacts with GPER in
MDA-MB-231 breast cancer cells
We previously found that NHERF1 interacts with GPER
in ER-positive breast cancer (12).
NHERF1 has been reported to regulate the biological function of
multiple receptors via protein-protein interaction (20). It is possible that NHERF1/GPER
interaction may be involved in regulating GPER-mediated signaling
in TNBCs. In order to confirm NHERF1/GPER interaction in
triple-negative breast cancer cells, MDA-MB-231 cells which express
low levels of NHERF1, were stably transfected with HA-NHERF1.
Ectopic HA-NHERF1 overexpression was confirmed by western blotting
(Fig. 2A). Lysates of MDA-MB-231
cells stably expressing HA-NHERF1 were immunoprecipitated (IP) with
anti-GPER followed by western blotting. A strong HA-NHERF1 signal
was detected in protein-A/G-GPER-IP complex, whereas no detectable
immunoreactivity was observed in the protein-A/G control IP complex
(Fig. 2B), indicating that GPER
interacts with HA-NHERF1 in MDA-MB-231 cells. The co-localization
of NHERF1/GPER was investigated by immunofluorescent staining.
Cells were immunostained with anti-NHERF1 and anti-GPER antibodies.
As shown in Fig. 2C, NHERF1 was
found to co-localize with GPER in MDA-MB-231 cells mostly in the
cytoplasm. Taken together, these data indicate that NHERF1
interacts with GPER in MDA-MB-231 cells.
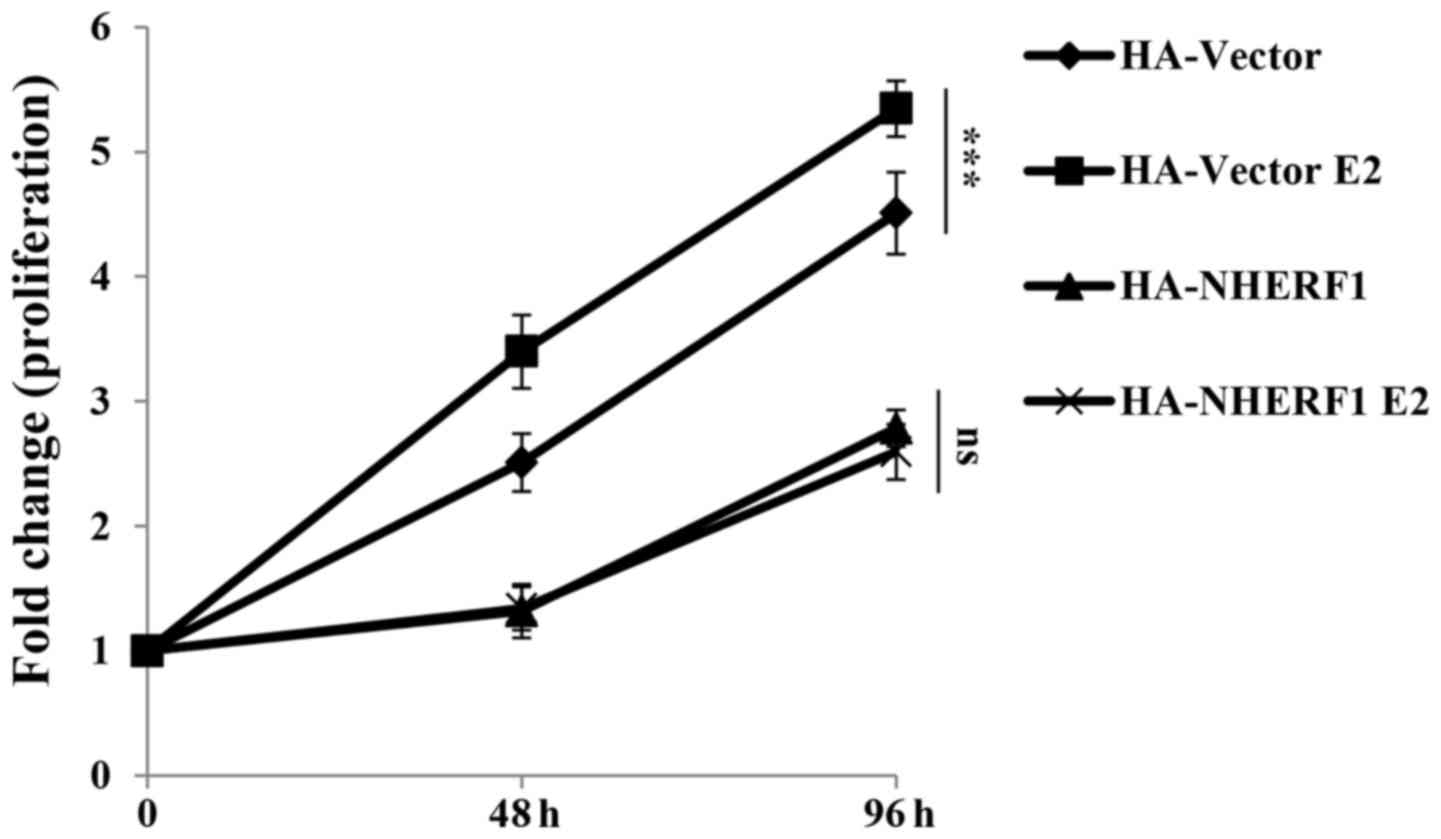
NHERF1 overexpression inhibits
GPER-mediated proliferation of MDA-MB-231 cells
GPER activation has been widely found to promote
proliferation of triple-negative breast cancer cells (5–7). In
order to understand the roles of NHERF1 in GPER-mediated
proliferation, cells were serum deprived overnight in phenol
red-free medium with 2% charcoal stripped-FBS and then cultured
with 17β-estradiol (E2, 10 nM) for 0, 48 or 96 h for CCK-8
proliferation assay. In ERα-negative MDA-MB-231 cells, E2 binds
with GPER to activate GPER signaling. As shown in Fig. 3, stimulation of E2 significantly
promoted the proliferation of MDA-MB-231-HA-vector cells as
compared with cells without E2 stimulation. This finding is
consistent with reports from other groups which showed GPER
stimulation by estrogen enhanced proliferation of TNBC cell lines
such as HCC1806 and MDA-MB-468 (7–9).
Stable overexpression of NHERF1 inhibited cell proliferation as
compared with control cells, which indicated that NHERF1
overexpression inhibited proliferation of MDA-MB-231 cells.
However, the proliferation rate of NHERF1 overexpressed cells in
groups treated with E2 was similar as compared with the same cells
without E2 stimulation. These findings suggested that NHERF1
overexpression inhibited GPER-mediated MDA-MB-231 cell
proliferation.
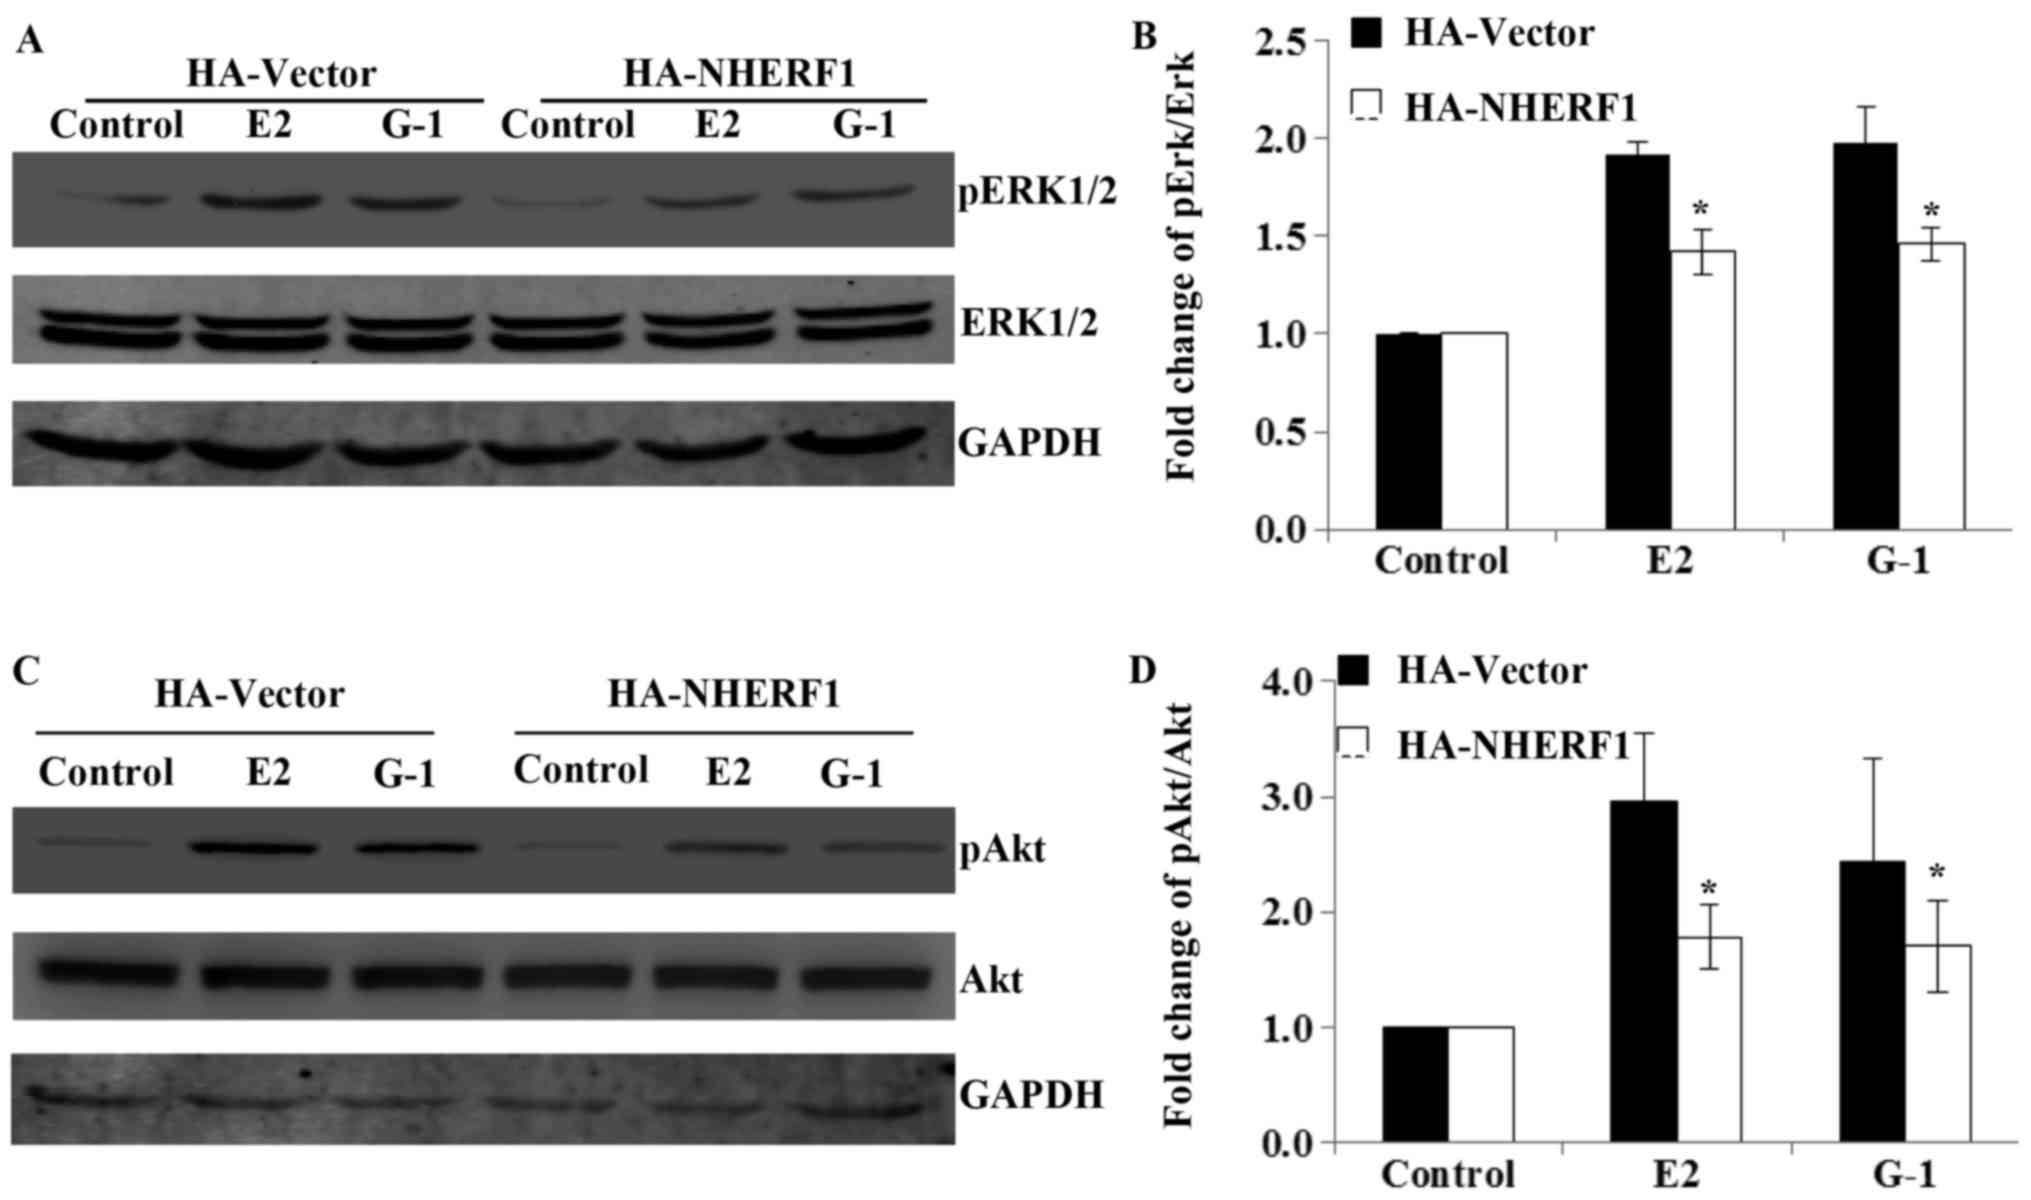
NHERF1 inhibits GPER-mediated ERK1/2
and Akt signaling in MDA-MB-231 cells
Next, we studied the molecular mechanisms underlying
NHERF1 inhibition of GPER-mediated proliferation. GPER has been
reported to promote cell proliferation via ERK1/2 and Akt signaling
(8), thus, we further investigated
the effects of NHERF1 overexpression in the activation of
GPER-mediated ERK1/2 and Akt signaling. MDA-MB-231 cells stably
expressed HA-NHERF1 or control vectors were serum deprived for 24 h
in phenol red-free medium and stimulated with E2 (10 nM) or G-1 (1
µM) for 10 min to detect the levels of phosphorylated ERK1/2
(pERK1/2), or 15 min for the phosphorylated Akt (pAkt). Results
showed that the levels of pERK1/2 and pAkt were robustly increased
upon E2 or G-1 stimulation in control MDA-MB-231 cells, whereas the
total levels of ERK1/2 or Akt had no detectable change (Fig. 4). However, when MDA-MB-231 cells
overexpressed NHERF1, the phosphorylation of ERK1/2 and Akt upon E2
or G-1 treatment was significantly attenuated as compared with
control cells (Fig. 4). These data
suggested that NHERF1 inhibited GPER-mediated ERK1/2 and Akt
activation in triple-negative breast cancer cells.
NHERF1 is downregulated in TNBC cell
lines and early stage of TNBC specimens
SLC9A3R1 (NHERF1) gene promoter contains
estrogen responsive elements and absence of NHERF1 expression has
been found in most of the more aggressive ER-negative breast tumors
(16,21). However, the expression levels and
roles of NHERF1 in subsets of breast tumors are still controversial
(18). In order to clarify the
expression levels of NHERF1 protein in TNBCs, we first analyzed the
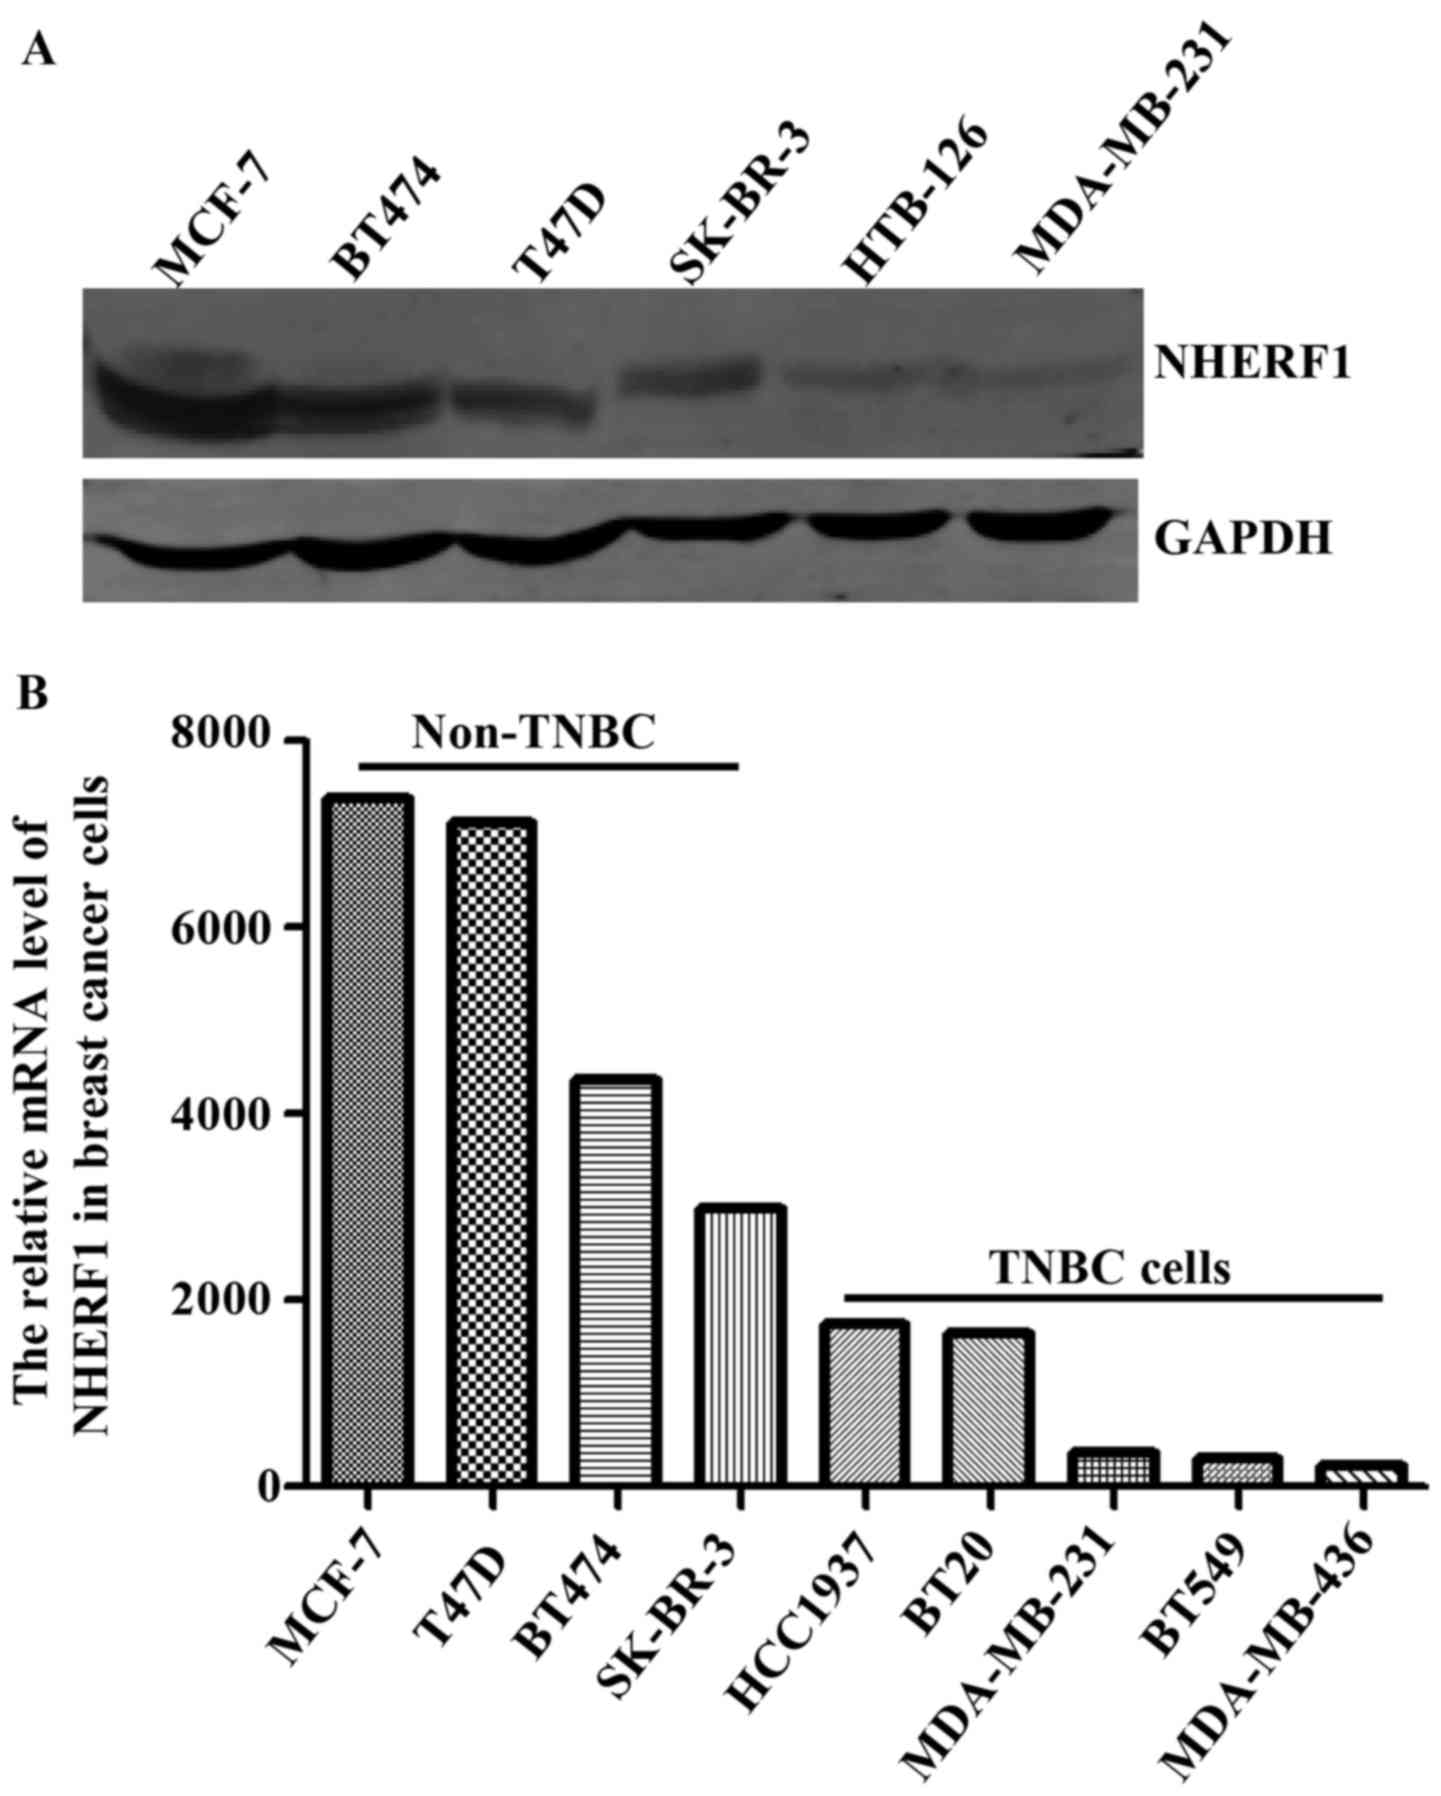
protein levels of NHERF1 in multiple TNBC cell lines. As shown in
Fig. 5A, the protein levels of
NHERF1 were relatively lower in HTB-126 and MDA-MB-231 TNBC cells
as compared with non-TNBC cell lines. We further analyzed the mRNA
levels of NHERF1 by using data of TNBC cell lines from The Cancer
Cell Line Encyclopedia (CCLE) database. Consistent with data from
our cell lines, results from CCLE showed relatively lower levels of
NHERF1 mRNA in TNBC cell lines (Fig.
5B).
To verify whether the levels of NHERF1
are also decreased in TNBC clinical specimens, we analyzed the mRNA
levels of NHERF1 in TCGA database
Totally 112 TNBC patients were stratified into 3
groups according to stage (Table
I). After removing cases with the outlier values of NHERF1
(mean ± SD) and cases lacking staging information, in total 92
cases of normal breast tissues and 91 cases of TNBC specimens were
included for analysis. The tissues from normal breast and different
stages (I, II and III) of TNBCs were divided into NHERF1 high/low
expression groups, respectively, and the case numbers from three
stages of TNBCs with NHERF1 high/low expression were compared with
that of normal group by Chi-square test. The mRNA levels of NHERF1
in stage I were significantly lower than that in the normal group
(Table II). There was no
statistical difference for the later stages of TNBCs. These data
indicated that decreased levels of NHERF1 may contribute to
development of early stage TNBCs.
 | Table I.Clinical information of TNBC patients
in TCGA data set. |
Table I.
Clinical information of TNBC patients
in TCGA data set.
| Variables | TNBC |
|---|
| Patient, n | 112 |
| Age, years, mean
(range) | 55 (29–90) |
| Stage, n (%) |
| I | 20 (18) |
| II | 70 (63) |
|
III/IV | 19 (17) |
|
Unknown | 3 (2) |
| Table II.Expression levels of NHERF1 in normal
and TNBC specimens. |
Table II.
Expression levels of NHERF1 in normal
and TNBC specimens.
|
|
| NHERF1 mRNA
expression |
|
|---|
|
|
|
|
|
|---|
| Variables | No. of
patients | High n (%) | Low n (%) | P-value |
|---|
| Normal | 92 | 47 (51) | 45 (49) | – |
| Stage I | 16 | 6
(7) | 10 (63) | 0.046a |
| Stage II | 59 | 34 (55) | 25 (45) | 0.571 |
| Stage III/IV | 16 | 7
(44) | 9
(56) | 0.322 |
NHERF1 level is negatively correlated
with GPER activation and cell proliferation in early stage of
TNBCs
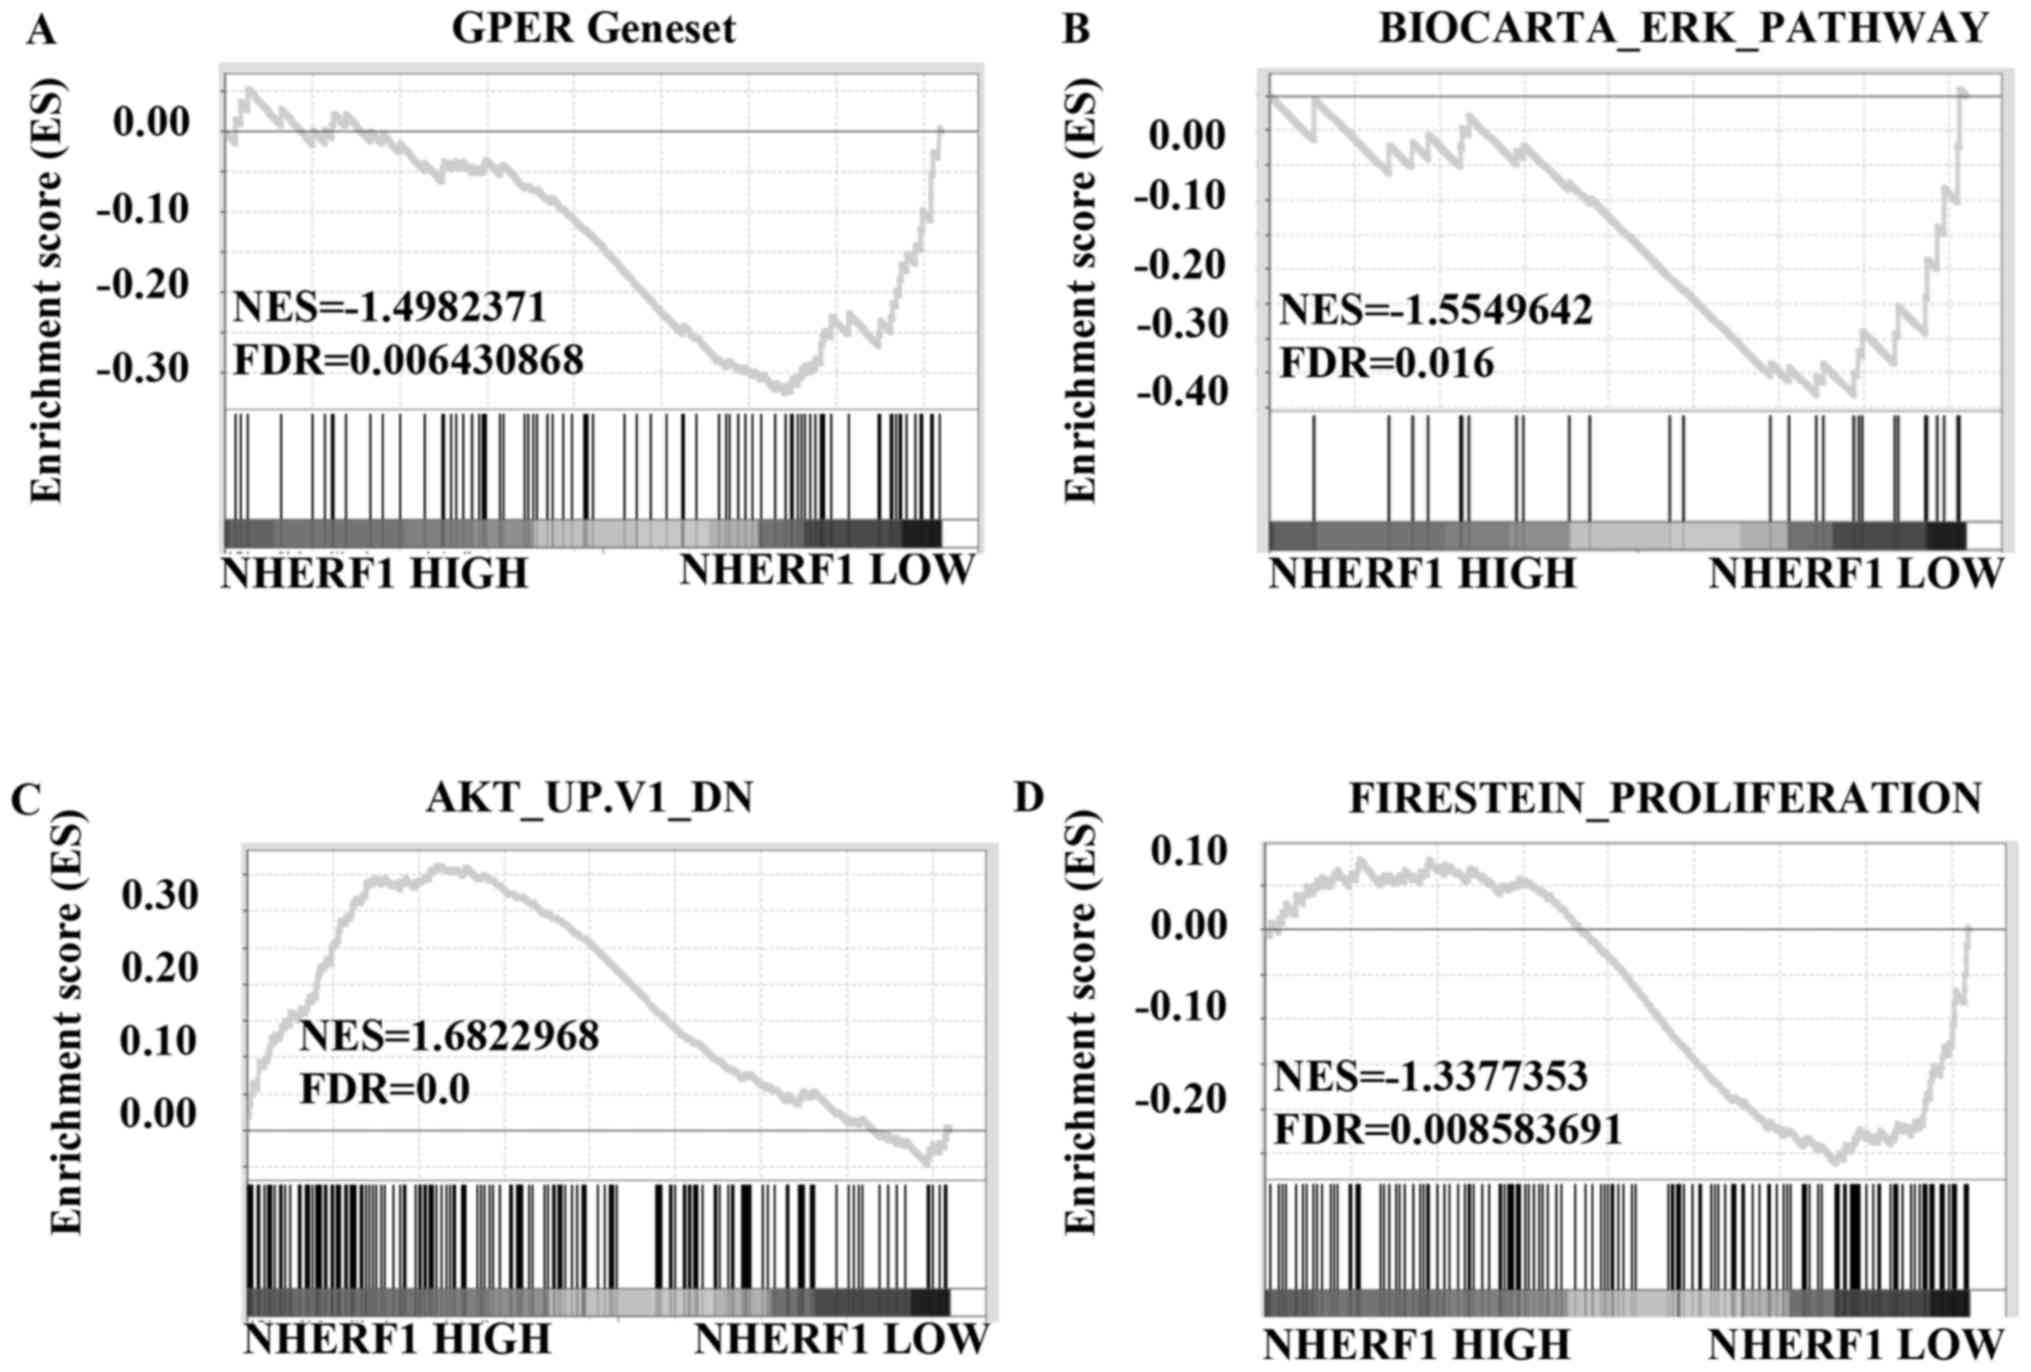
To further investigate the correlation between the
levels of NHERF1 and GPER-mediated signaling in TNBCs, data from
stage I TNBCs were divided into high/low NHERF1 expression groups
and further analyzed using GSEA method. The results showed that
gene signatures of GPER activation were enriched in stage I TNBC
patients with low levels of NHERF1 (Fig. 6A; FDR=0.006). We further analyzed
the correlation of NHERF1 levels with the gene signatures of ERK1/2
and Akt signaling activation. Results in Fig. 6B showed that gene signatures of
ERK1/2 pathway activation were enriched in stage I TNBC patients
with lower NHERF1 levels (FDR=0.016). Similarly, gene signatures of
inhibiting Akt pathway were enriched in stage I TNBC patients with
higher NHERF1 levels (Fig. 6C;
FDR=0.0). Data of GSEA further confirmed that gene signatures of
cell proliferation were enriched in stage I TNBC patients with
lower NHERF1 levels (Fig. 6D;
FDR=0.009), which was in accordance with data in Figs. 6A-C and 3. Taken together, NHERF1 level was
negatively correlated with activation of GPER-mediated signaling,
including ERK1/2 and Akt activation and proliferation in stage I
TNBCs, suggesting that NHERF1 inhibited GPER-mediated activation of
ERK and Akt and proliferation in the early stage of TNBCs.
Discussion
GPER has been implicated in the regulation of cancer
cell proliferation (22,23) and was considered as an oncogenic
receptor for carcinogenesis (10),
especially in ER-positive (24) and
triple-negative breast cancer (TNBC) (5). The roles of GPER in carcinogenesis are
well established and its signaling pathway has become an attractive
target for therapy (4,22,25).
In a previous study, we found that NHERF1 interacted with GPER and
regulated its signaling in ER-positive breast cancer (12). Therefore, it is interesting to know
whether NHERF1 also interacts with GPER in ER-negative breast
cancers including TNBCs. SLC9A3R1 (NHERF1) is an
estrogen-responsive gene and reports show that NHERF1 was
downregulated in ER-negative breast cancer including TNBCs. We
further confirmed downregulation of NHERF1 in TNBC cells lines in
our present study (Fig. 5 and
Table II). Several reports
(5–7) and our analysis showed that GPER
signaling was activated in TNBCs, thus we further investigated the
correlation of NHERF1 downregulation with the activation of GPER
signaling in TNBCs. The MDA-MB-231 cells, a TNBC cell line, were
used as a cell model to detect the interaction of NHERF1 with GPER.
As shown in Fig. 2, Co-IP result
showed that NHERF1 interacted with GPER and immunocytochemistry
study confirmed that NHERF1 was co-localized with GPER in
MDA-MB-231 cells.
Upon binding with estrogen, GPER activation induces
rapid cAMP signaling and calcium mobilization, as well as
activation of ERK and Akt signaling to promote cell growth and
proliferation. We observed that E2 treatment induced GPER-mediated
proliferation of TNBC cells, whereas overexpression of NHERF1
inhibited E2-induced proliferation of MDA-MB-231 cells (Fig. 3). This finding was further confirmed
by data in Fig. 4, in which NHERF1
overexpression inhibited E2- or G-1-induced activation of ERK1/2
and Akt in MDA-MB-231 cells. These data suggest that NHERF1
functions as a tumor suppressor in TNBCs by inhibition of
GPER-mediated proliferation. Our findings are consistent with
findings from other groups which demonstrated an oncogenic role of
GPER in TNBC cells (5–9). In these reports, the activation of
GPER was induced mostly by E2 or Tamoxifen. However, it seems that
there are contradictive reports from several groups which showed
that after stimulation by G-1, GPER had tumor suppressive activity
in ER-negative breast cancer cells, including TNBC cells such as
MDA-MB-231 and MDA-MB-468 cells (26,27).
In the present study, we found that stimulation by E2 or G-1
respectively led to activation of ERK1/2 and Akt (Fig. 4). Difference between E2 and G-1
property, cell lines and experimental conditions may be accountable
for the result discrepancy from different research groups.
As a downstream target effector of ER signaling,
NHERF1 was downregulated both in mRNA and protein levels in TNBC
cells in our laboratory and CCLE dataset (Fig. 5), which is consistent with other
reports using TNBC cells (21).
Data from TCGA further showed that NHERF1 was significantly
downregulated in early stage of TNBC (Table II). NHERF1 has been reported to
inhibit growth of ER-positive breast cancer cells such as MCF-7 and
T47D in culture and a xenograft model (28). In the present study, we also found
that NHERF1 elicited inhibitory effects of growth in MDA-MB-231
TNBC cells (Fig. 3). Therefore, it
is possible that decreased levels of NHERF1 may also contribute to
the growth of TNBCs. GSEA of TCGA data showed that NHERF1
expression levels were negatively correlated with the gene
signatures of GPER activation, ERK1/2 and Akt signaling, and cell
proliferation in early stage of TNBC tumors (Fig. 6). These findings provided clinical
evidence for a potential suppressive role of NHERF1 in TNBC. Why
there was no correlation of NHERF1 with GPER signaling in later
stages was elusive. It is possible that mechanisms other than
NHERF1 may be involved in promoting TNBCs development into later
stage. It is necessary to point out the limitation in Fig. 6A regarding to GPER gene set. To
date, there is no established GPER gene set available to verify the
activation of GPER downstream genes in TNBC. The GPER gene
signatures obtained via public GEO data in current study need
further verification.
NHERF1 has been reported to interact with several
GPCRs such as PTHR and β2AR by regulating G protein or cAMP
concentration to regulate downstream signaling (29), and NHERF1 is also found to interact
with GPER (12). In the present
study, NHERF1 was found to inhibit GPER-mediated Akt and ERK1/2
signaling in TNBC cells. How NHERF1 interacts with GPER to regulate
the receptor signaling needs further investigation. NHERF1 has been
reported to interact with epidermal growth factor receptor (EGFR)
and stabilize EGFR at the cell surface to regulate the receptor
downstream signaling (30). Since
activation of GPER can lead to trans-activation of EGFR (31), it is possible that in early stage of
TNBC development, multiple regulatory pathways of NHERF1 may
coexist.
In summary, the present study showed that GPER
levels were downregulated and GPER signaling was activated in the
early stage of TNBCs. By using TNBC cell model, it was demonstrated
that NHERF1 inhibited GPER-mediated proliferation via inhibition of
ERK1/2 and Akt signaling. Activation of GPER-mediated signaling was
correlated with lower NHERF1 expression in early stage of TNBCs.
These findings indicate that GPER-mediated proliferation in TNBCs
may be attributed to downregulation of NHERF1 levels.
Acknowledgements
The present study was supported by the National
Natural Science Foundation of the People's Republic of China (nos.
81272887 and 81302373), the Beijing Municipal Natural Science
Foundation (no. 7152014) and the Scientific Research Common Program
of Beijing Municipal Commission of Education (KM201410025001).
Glossary
Abbreviations
Abbreviations:
|
NHERF1
|
Na+/H+ exchanger
regulatory factor 1
|
|
EBP50
|
ERM binding phosphoprotein of 50
kDa
|
|
TNBC
|
triple- negative breast cancer
|
|
ER
|
estrogen receptor
|
|
HER2
|
human epidermal growth factor receptor
2
|
|
PR
|
progesterone receptor
|
|
GPER
|
G protein-coupled estrogen
receptor
|
|
GPR30
|
G protein-coupled receptor 30
|
|
TCGA
|
The Cancer Genome Atlas
|
|
GSEA
|
Gene Set Enrichment Analysis
|
|
CCLE
|
The Cancer Cell Line Encyclopedia
|
References
|
1
|
Bianchini G, Balko JM, Mayer IA, Sanders
ME and Gianni L: Triple-negative breast cancer: Challenges and
opportunities of a heterogeneous disease. Nat Rev Clin Oncol.
13:674–690. 2016. View Article : Google Scholar : PubMed/NCBI
|
|
2
|
Collignon J, Lousberg L, Schroeder H and
Jerusalem G: Triple-negative breast cancer: Treatment challenges
and solutions. Breast Cancer (Dove Med Press). 8:93–107.
2016.PubMed/NCBI
|
|
3
|
Kalimutho M, Parsons K, Mittal D, López
JA, Srihari S and Khanna KK: Targeted therapies for triple-negative
breast cancer: Combating a stubborn disease. Trends Pharmacol Sci.
36:822–846. 2015. View Article : Google Scholar : PubMed/NCBI
|
|
4
|
Prossnitz ER and Barton M: Estrogen
biology: New insights into GPER function and clinical
opportunities. Mol Cell Endocrinol. 389:71–83. 2014. View Article : Google Scholar : PubMed/NCBI
|
|
5
|
Steiman J, Peralta EA, Louis S and Kamel
O: Biology of the estrogen receptor, GPR30, in triple negative
breast cancer. Am J Surg. 206:698–703. 2013. View Article : Google Scholar : PubMed/NCBI
|
|
6
|
Pandey DP, Lappano R, Albanito L, Madeo A,
Maggiolini M and Picard D: Estrogenic GPR30 signalling induces
proliferation and migration of breast cancer cells through CTGF.
EMBO J. 28:523–532. 2009. View Article : Google Scholar : PubMed/NCBI
|
|
7
|
Girgert R, Emons G and Gründker C:
Inactivation of GPR30 reduces growth of triple-negative breast
cancer cells: Possible application in targeted therapy. Breast
Cancer Res Treat. 134:199–205. 2012. View Article : Google Scholar : PubMed/NCBI
|
|
8
|
Yu T, Liu M, Luo H, Wu C, Tang X, Tang S,
Hu P, Yan Y, Wang Z and Tu G: GPER mediates enhanced cell viability
and motility via non-genomic signaling induced by 17β-estradiol in
triple-negative breast cancer cells. J Steroid Biochem Mol Biol.
143:392–403. 2014. View Article : Google Scholar : PubMed/NCBI
|
|
9
|
Girgert R, Emons G and Gründker C:
Inhibition of GPR30 by estriol prevents growth stimulation of
triple-negative breast cancer cells by 17β-estradiol. BMC Cancer.
14:9352014. View Article : Google Scholar : PubMed/NCBI
|
|
10
|
Lappano R, Pisano A and Maggiolini M: GPER
function in breast cancer: An Overview. Front Endocrinol
(Lausanne). 5:662014.PubMed/NCBI
|
|
11
|
Hung AY and Sheng M: PDZ domains:
Structural modules for protein complex assembly. J Biol Chem.
277:5699–5702. 2002. View Article : Google Scholar : PubMed/NCBI
|
|
12
|
Meng R, Qin Q, Xiong Y, Wang Y, Zheng J,
Zhao Y, Tao T, Wang Q, Liu H, Wang S, et al: NHERF1, a novel GPER
associated protein, increases stability and activation of GPER in
ER-positive breast cancer. Oncotarget. 7:54983–54997.
2016.PubMed/NCBI
|
|
13
|
Molina JR, Agarwal NK, Morales FC, Hayashi
Y, Aldape KD, Cote G and Georgescu MM: PTEN, NHERF1 and PHLPP form
a tumor suppressor network that is disabled in glioblastoma.
Oncogene. 31:1264–1274. 2012. View Article : Google Scholar : PubMed/NCBI
|
|
14
|
Hayashi Y, Molina JR, Hamilton SR and
Georgescu MM: NHERF1/EBP50 is a new marker in colorectal cancer.
Neoplasia. 12:1013–1022. 2010. View Article : Google Scholar : PubMed/NCBI
|
|
15
|
Bellizzi A, Malfettone A, Cardone RA and
Mangia A: NHERF1/EBP50 in breast cancer: Clinical perspectives.
Breast Care (Basel). 5:86–90. 2010. View Article : Google Scholar : PubMed/NCBI
|
|
16
|
Song J, Bai J, Yang W, Gabrielson EW, Chan
DW and Zhang Z: Expression and clinicopathological significance of
oestrogen-responsive ezrin-radixin-moesin-binding phosphoprotein 50
in breast cancer. Histopathology. 51:40–53. 2007. View Article : Google Scholar : PubMed/NCBI
|
|
17
|
Ediger TR, Kraus WL, Weinman EJ and
Katzenellenbogen BS: Estrogen receptor regulation of the Na+/H+
exchange regulatory factor. Endocrinology. 140:2976–2982. 1999.
View Article : Google Scholar : PubMed/NCBI
|
|
18
|
Stemmer-Rachamimov AO, Wiederhold T,
Nielsen GP, James M, Pinney-Michalowski D, Roy JE, Cohen WA, Ramesh
V and Louis DN: NHE-RF, a merlin-interacting protein, is primarily
expressed in luminal epithelia, proliferative endometrium, and
estrogen receptor-positive breast carcinomas. Am J Pathol.
158:57–62. 2001. View Article : Google Scholar : PubMed/NCBI
|
|
19
|
Yao W, Feng D, Bian W, Yang L, Li Y, Yang
Z, Xiong Y, Zheng J, Zhai R and He J: EBP50 inhibits EGF-induced
breast cancer cell proliferation by blocking EGFR phosphorylation.
Amino Acids. 43:2027–2035. 2012. View Article : Google Scholar : PubMed/NCBI
|
|
20
|
Saponaro C, Malfettone A, DellEndice TS,
Brunetti AE, Achimas-Cadariu P, Paradiso A and Mangia A: The
prognostic value of the Na+/H+ exchanger regulatory factor 1
(NHERF1) protein in cancer. Cancer Biomark. 14:177–184. 2014.
View Article : Google Scholar : PubMed/NCBI
|
|
21
|
Dai JL, Wang L, Sahin AA, Broemeling LD,
Schutte M and Pan Y: NHERF (Na+/H+ exchanger regulatory factor)
gene mutations in human breast cancer. Oncogene. 23:8681–8687.
2004. View Article : Google Scholar : PubMed/NCBI
|
|
22
|
Barton M: Not lost in translation:
Emerging clinical importance of the G protein-coupled estrogen
receptor GPER. Steroids. 111:37–45. 2016. View Article : Google Scholar : PubMed/NCBI
|
|
23
|
Jacenik D, Cygankiewicz AI and Krajewska
WM: The G protein-coupled estrogen receptor as a modulator of
neoplastic transformation. Mol Cell Endocrinol. 429:10–18. 2016.
View Article : Google Scholar : PubMed/NCBI
|
|
24
|
Filardo EJ, Graeber CT, Quinn JA, Resnick
MB, Giri D, DeLellis RA, Steinhoff MM and Sabo E: Distribution of
GPR30, a seven membrane-spanning estrogen receptor, in primary
breast cancer and its association with clinicopathologic
determinants of tumor progression. Clin Cancer Res. 12:6359–6366.
2006. View Article : Google Scholar : PubMed/NCBI
|
|
25
|
Srivastava DP and Evans PD: G-protein
oestrogen receptor 1Trials and tribulations of a membrane oestrogen
receptor. J Neuroendocrinol. 25:1219–1230. 2013. View Article : Google Scholar : PubMed/NCBI
|
|
26
|
Weißenborn C, Ignatov T, Ochel HJ, Costa
SD, Zenclussen AC, Ignatova Z and Ignatov A: GPER functions as a
tumor suppressor in triple-negative breast cancer cells. J Cancer
Res Clin Oncol. 140:713–723. 2014. View Article : Google Scholar : PubMed/NCBI
|
|
27
|
Wei W, Chen ZJ, Zhang KS, Yang XL, Wu YM,
Chen XH, Huang HB, Liu HL, Cai SH, Du J, et al: The activation of G
protein-coupled receptor 30 (GPR30) inhibits proliferation of
estrogen receptor-negative breast cancer cells in vitro and in
vivo. Cell Death Dis. 5:e14282014. View Article : Google Scholar : PubMed/NCBI
|
|
28
|
Pan Y, Wang L and Dai JL: Suppression of
breast cancer cell growth by Na+/H+ exchanger regulatory factor 1
(NHERF1). Breast Cancer Res. 8:R632006. View Article : Google Scholar : PubMed/NCBI
|
|
29
|
Ardura JA and Friedman PA: Regulation of G
protein-coupled receptor function by Na+/H+ exchange regulatory
factors. Pharmacol Rev. 63:882–900. 2011. View Article : Google Scholar : PubMed/NCBI
|
|
30
|
Lazar CS, Cresson CM, Lauffenburger DA and
Gill GN: The Na+/H+ exchanger regulatory factor stabilizes
epidermal growth factor receptors at the cell surface. Mol Biol
Cell. 15:5470–5480. 2004. View Article : Google Scholar : PubMed/NCBI
|
|
31
|
Filardo EJ: Epidermal growth factor
receptor (EGFR) transactivation by estrogen via the
G-protein-coupled receptor, GPR30: A novel signaling pathway with
potential significance for breast cancer. J Steroid Biochem Mol
Biol. 80:231–238. 2002. View Article : Google Scholar : PubMed/NCBI
|