Introduction
NAD is an essential component in life, which plays a
vital role in major biological processes (1–3). In
cells, the NAD pool is composed of NAD, reduced nicotinamide
adenine dinucleotide (NADH), nicotinamide adenine dinucleotide
phosphate (NADP) and reduced nicotinamide adenine dinucleotide
phosphate (NADPH). NAD and NADP are coenzymes for dehydrogenase
(DH)-catalyzed reactions involved in biodegradation and
biosynthesis. The NAD/NADH ratio also regulates mitochondrial
functions (4–6). NADPH plays an important role in the
cell defense system. NAD homeostasis is maintained by NAD
synthesis, NAD catabolism, and non-redox NAD-dependent enzymatic
reactions. Tryptophan is the precursor for de novo NAD
synthesis.
In non-redox NAD-dependent reactions, NAD functions
as a substrate for ADP-ribosyltransferases such as poly(ADP-ribose)
polymerases (PARPs), mono(ADP-ribosyl)-transferases (ARTs),
NAD(+)-dependent deacetylases (sirtuins), tRNA
2′-phosphotransferases, and ADP-ribosyl cyclases. Sirtuins utilize
NAD to deacetylate acetyl-lysine residues in proteins (7–10).
Sirtuin-catalyzed NAD-dependent deacetylations of nuclear and
mitochondrial proteins are the basis for the broad range of
cellular functions (11–14). As the substrate for ADP-ribosylation
of nuclear proteins, NAD is essential for stress responses
(15,16). Recent studies have revealed that NAD
levels decline with age in different organisms (17–20).
On the other hand, repletion of NAD precursors increases the
cellular NAD levels against age-associated diseases and prolongs
lifespan extension (21–23). A recent study demonstrated that CD38
levels are increased in aged mice, causing age-related NAD decline
and mitochondrial dysfunction (24).
Furthermore, NAD is essential to tumor survival and
progression by regulating multiple cellular processes, including
metabolism, stress responses, and DNA integrity. Targeting NAD
metabolism has evolved to be a new concept in cancer therapy
(25,26). The cellular NAD levels are
maintained by the NAD scavenge pathway in which the formation of
nicotinamide mononucleotide is the rate-limiting step catalyzed by
nicotinamide phosphoribosyltransferase (NAMPT). It has been amply
documented that NAMPT expression is highly expressed in tumors,
making it a therapeutic target in cancer treatment (26,27).
Over the last two decades, extensive studies have identified that
FK866 efficiently inhibits NAMPT activity to decrease cellular NAD
levels (28,29). Studies show that FK866-induced cell
growth inhibition is regulated by p53, mTOR and autophagy pathways
(30–34). However, few studies have
systematically examined the effects of NAD decrease on
proteostasis, cell proliferation and stress responses.
Understanding the global impacts of the NAD levels on cellular
processes is important for treating cancer and age-associated
diseases. In the present study, we treated cells with FK866 and
conducted a comprehensive analysis to decipher the effects of the
decrease in NAD on proteostasis, cell growth, and cellular
responses to oxidative stress.
Materials and methods
Chemicals and reagents
Phosphate-buffered saline (PBS),
penicillin/streptomycin, Dulbecco's modified Eagle's medium (DMEM),
normal and dialyzed fetal bovine serum were all purchased from
Wisent (Montreal, QC, Canada). SILAC labeling reagents including
DMEM medium, isotope encoded L-13C6 lysine ·
HCl, standard L-lysine · HCl, and standard L-arginine · HCl were
purchased from Thermo Fisher (Waltham, MA, USA). Sequencing grade
trypsin was purchased from Promega (Fitchburg, WI, USA).
Iodoacetamide (IAA) and polybrene were purchased from Sigma (St.
Louis, MO, USA). Anti-PARP1 antibody, anti-PCNA antibody and
anti-β-actin antibody were purchased from Abmart (Shanghai, China).
Anti-p53 antibody, anti-mouse secondary antibody and anti-rabbit
secondary antibody were purchased from Cell Signaling Technology
(Boston, MA, USA). The Cell Counting Kit-8 (CCK-8) was purchased
from Dojindo (Kumamoto, Japan). Hydrogen peroxide was purchased
from Aladdin (Shanghai, China). BCA protein assay kit was purchased
from Solarbio (Beijing, China). The Total RNA isolation and reverse
transcription kit were purchased from Tiangen (Beijing, China).
Cell culture and SILAC labeling
Human 293T and A549 cell lines were purchased from
the Cell Bank of the Chinese Academy of Sciences (Shanghai, China).
The cells were grown in DMEM medium that was supplemented with 10%
fetal bovine serum (FBS) and 1% penicillin/streptomycin at 37°C in
a humidified incubator with 5% CO2. For SILAC labeling,
293T cells were washed twice with PBS prior to being cultured with
the SILAC culture medium, which was prepared by mixing SILAC DMEM
medium with 10% D-FBS, 1% penicillin/streptomycin, 146 mg/l isotope
labeling L-13C6 lysine · HCl and 84 mg/l
standard L-arginine · HCl. The cells were grown for 8 to 10
passages in SILAC medium and the full incorporation of
isotope-encoded amino acid into proteins was tested. Cells were
cultured for at least 12 h prior to FK866 treatment; cells were
treated with FK866 dissolved in DMSO for 12 or 24 h. After
treatments, the cells were then washed twice with ice-cold PBS and
lysed with RIPA lysis buffer which consisted of 25 mmol/l Tris-HCl
pH 7.6, 150 mmol/l NaCl, 0.1% SDS, 1% NP-40, 1% sodium
deoxycholate, 1 mmol/l PMSF, and Roche Complete Protease Inhibitor
Cocktail for 30 min on ice. Cell lysates were further clarified by
centrifugation at 14,000 × g for 20 min at 4°C. The protein
concentration in each sample was determined by using a BCA protein
assay kit.
Analysis of NAD and NADH content
The NAD and NADH contents were determined using a
NAD/NADH quantification kit according to the manufacturer's
instructions (http://www.sigmaaldrich.com/content/dam/sigma-aldrich/docs/Sigma/Bulletin/1/mak037bul.pdf).
Briefly, after cells were washed three times with cold PBS, cell
metabolites were extracted using the NADH/NAD extraction buffer for
3 freeze/thawing cycles. After centrifugation, the supernatant was
collected. For total NAD (NAD + NADH) detection, the supernatant
was mixed with the NAD cycling enzyme to convert NAD to NADH. For
NADH detection, the supernatant was heated to 60°C. Then, analytes
and NADH standards reacted with a NADH developer reagent. The
products were measured at the absorbance wavelength 450 nm (A450)
to quantify NAD and NADH concentrations.
NAD and NADH concentrations were also measured by
LC-MS analysis. Briefly, the cells were washed with ice-cold PBS
and the metabolites were extracted using 80% methanol (−80°C). The
metabolites were dried using a speedvac and re-dissolved in 80%
methanol and used for LC-MS. The metabolites were separated by a
Acquity UPLC BEH amide column (2.1×100 mm, 1.7-µm; Waters, Milford,
MA, USA) that was interfaced with the Q-Exactive Mass spectrometer.
Metabolites were characterized based on the retention time and the
accurate mass measurement with <5 ppm mass accuracy. Trace
Finder software was employed to identify the peaks and extract the
quantitative information.
Cell proliferation measurement with
CCK-8 kit
The cells were seeded in 96-well plates at 2,000
cells/well. The cell proliferation rate was measured with the CCK-8
kit according to the manufacturer's protocol (Dojindo
Laboratories). Briefly, CCK-8 reagents were added into each well
after cells grew for 0, 8, 16, 24, 32, 40, 48, 72, and 96 h,
respectively. The absorbance at 450 nm was measured 3 h after CCK-8
addition.
Susceptibility of FK866-treated and
untreated cells to hydrogen peroxide and cisplatin
Effects of hydrogen peroxide and cisplatin on cell
growth in the FK866-treated and untreated cells were analyzed with
the CCK-8 kit. Briefly, cells were seeded into 96-well cell culture
microplates and incubated with 10 nM FK866 for 6 h prior to
H2O2 or cisplatin treatment. Then, untreated
and FK866-treated cells were treated with
H2O2 (200, 400, and 600 µM) or cisplatin at
different concentrations (10, 25 and 50 µM) in triplicates for 12
h. Afterwards, CCK-8 reagents were added to the treated cells and
incubated for 3 h at 37°C. The optical density (OD) was measured at
450 nm with a microplate reader (Bio-Rad, Hercules, CA, USA). Cell
viability is represented as the percentage of viable cells compared
to that of the untreated cells. The experiment was repeated 3
times.
Identification of differentially
expressed proteins by proteomic analysis
Proteomic analysis was conducted as previously
described (35). Briefly, equal
amounts of proteins from the FK866-treated and the untreated cells
were mixed together and separated by 1D SDS-PAGE. The gel bands
were excised, reduced with 25 mM DTT and alkylated with 55 mM IAA,
followed by in-gel digestion with sequencing grade trypsin in 40 mM
ammonium bicarbonate at 37°C overnight. The peptides were extracted
twice and analyzed.
The digestion product was analyzed by LC-MS/MS, in
which peptides were separated by a 65-min gradient elution at a
flow rate 0.250 µl/min with an Dionex Ultimate integrated nano-HPLC
system which was directly interfaced with a Thermo Orbitrap
Q-Exactive mass spectrometer. The Q-Exactive mass spectrometer was
operated with the data-dependent acquisition method. A full-scan
followed by 20 data-dependent MS/MS scans were acquired with
normalized collision energy at 33%. Proteomic analysis was
conducted in biological triplicates. The SEQUEST searching
algorithm in the Proteome Discoverer software (version 1.4.1.14)
was used to generate the peak lists from LC-MS/MS analysis, which
were searched against the Uniprot Human database (release date of
November 20, 2015; 20,193 entries). The search criteria were the
following: full tryptic specificity was required; one missed
cleavage was allowed; carbamidomethylation (C) was set as the fixed
modifications; the oxidation (M) was set as the variable
modification; precursor ion mass tolerances were set at 10 ppm for
all MS acquired in an orbitrap mass analyzer; and the fragment ion
mass tolerance was set at 0.02 Da for all MS2 spectra acquired. The
peptide false discovery rate was evaluated using the Percolator
provided by Proteome Discoverer software. When the q-value was
smaller than 1%, the match was considered to be correct. False
discovery was evaluated based on peptide spectrum match when
searched against the decoy database. Peptides only assigned to a
given protein group were considered as unique. Protein quantitation
was also conducted with Proteome Discoverer Algorithm (version
1.4). Briefly, the ratio in relative protein expression for each
lysine-containing peptide was calculated using the peak area of
Lys6 divided by the peak area of Lys0. The protein ratio was then
averaged with all peptide ratios for that protein. Quantitative
precision was expressed as protein ratio variability.
Western blot analysis
FK866-treated and the untreated cells were harvested
and lysed on ice with RIPA lysis buffer. The supernatants were then
collected and the protein concentrations were measured with the BCA
protein assay kit. Proteins were separated on 1D SDS-PAGE gel and
transferred onto a PVDF membrane with electroblotting. The PVDF
membrane was blocked with 5% nonfat milk for 1 h at room
temperature and incubated with primary antibody overnight at 4°C,
washed three times with TBST buffer, and then incubated with
anti-mouse or anti-rabbit secondary antibody labeled with HRP. The
PVDF membrane was then washed three times with TBST buffer and
developed with ECL reagents (Engreen, China). β-actin was used as
an internal control and detected with the anti-β-actin
antibody.
Quantitative real-time PCR (qPCR)
Untreated and FK866-treated cells were cultured.
Total RNA was extracted with the Total RNA isolation kit. cDNA was
synthesized from 3 µg total RNA using the Reverse Transcription
kit. All qPCR experiments were performed with the Roche
LightCycler® 480II detection system with SYBR-Green
incorporation according to the manufacturer's instructions and
β-actin was used as an internal control. The primers were designed
and acquired from the Primer Bank (http://pga.mgh.harvard.edu/primerbank/).
Statistical method
Statistical analysis was performed by using GraphPad
Prism 5.0 software. Significant differences were determined by the
Student's t-test. p-values of <0.05 were considered to be
significant.
Results
FK866 treatment decreases cellular NAD
levels and growth rate but increases cell susceptibility to
oxidative stress
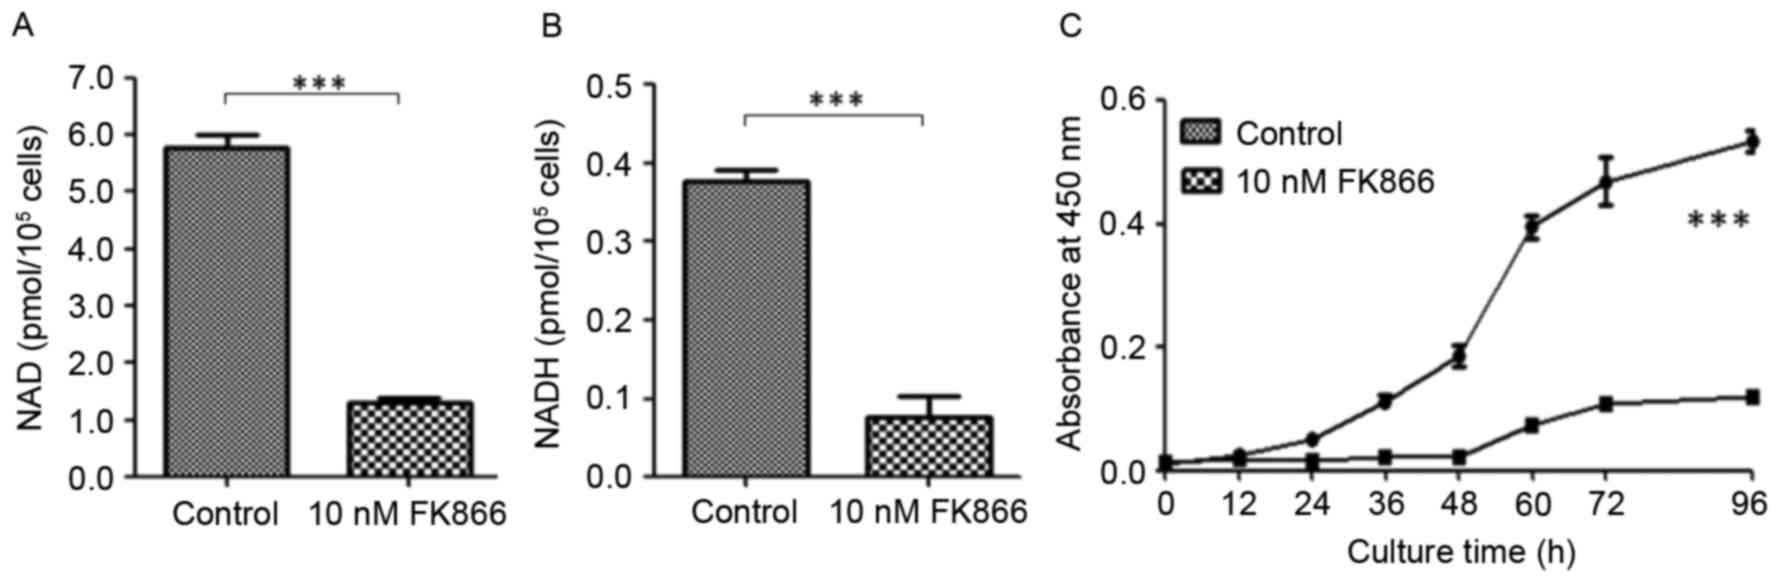
To examine the effects of FK866 on cellular NAD
levels, 293T and A549 cells were treated with FK866 at different
concentrations for different periods of time. After FK866
treatment, cells were lysed and cellular metabolites were extracted
followed by enzymatic assay or LC-MS analysis. The cellular NAD and
NADH levels were determined, showing that the NAD level in the
FK866-treated cells was ~5 times lower than that in the 293T cells.
Similarly, the level of NADH was found to be 4 times lower in the
FK866-treated cells than that in the 293T cells (Fig. 1A and B). Similar results were
obtained by LC-MS analysis using the extracted ion currents from
mass spectrometric analysis (data not shown). Cell proliferation
rates for 293T and FK866-treated cells were determined using the
CCK-8 assay (Fig. 1C) which is a
colorimetric assay for analysis of viable cells. The FK866-treated
cells grew more slowly than 293T cells. At 96 h, the number of 293T
cells was ~5 times more than that of the FK866-treated cells.
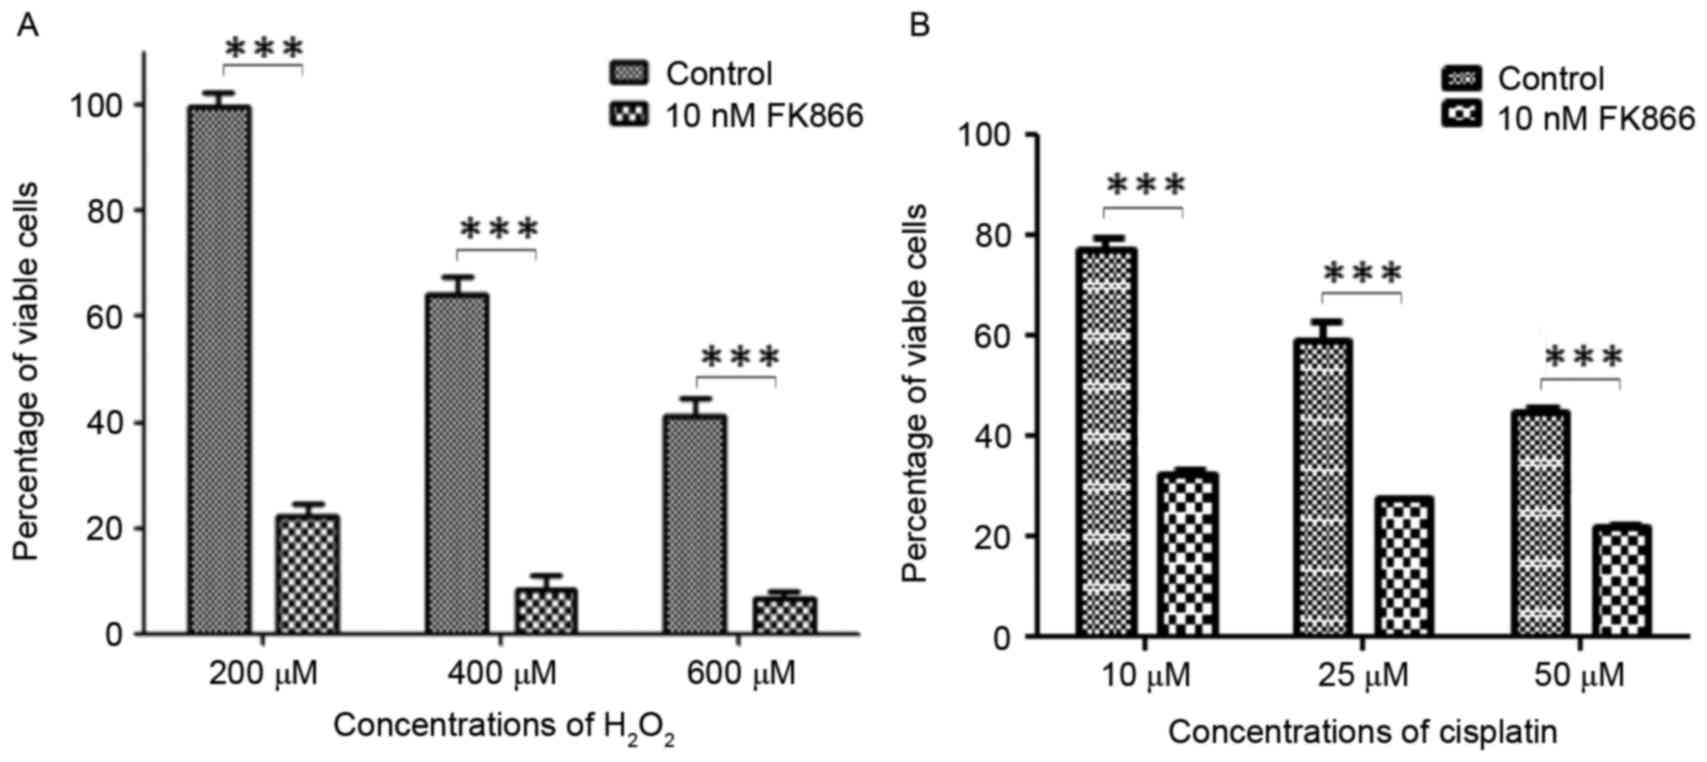
To determine the susceptibility of 293T and
FK866-treated cells to hydrogen peroxide and cisplatin, cells were
pretreated with DMSO or FK866 followed by incubation with different
concentrations of hydrogen peroxide or cisplatin for 12 h. The cell
viability was determined by the CCK-8 assay. The effects of
hydrogen peroxide or cisplatin on the cell viability are
represented as the percentage of viable cells after a 12 h
treatment (Fig. 2). When cells were
treated with 200 µM H2O2 for 12 h, the
percentages of viable cells were 20 and 95% for the FK866-treated
and untreated cells, respectively. The percentage of viable cells
decreased to 10% when FK866-treated cells were treated with 400 µM
H2O2 for 12 h, indicating that FK866
treatment made 293T cells extremely sensitive to
H2O2 treatment. When cells were treated with
50 µM cisplatin for 12 h, the percentages of viable cells were 20
and 50% for FK866-treated and the untreated cells, respectively.
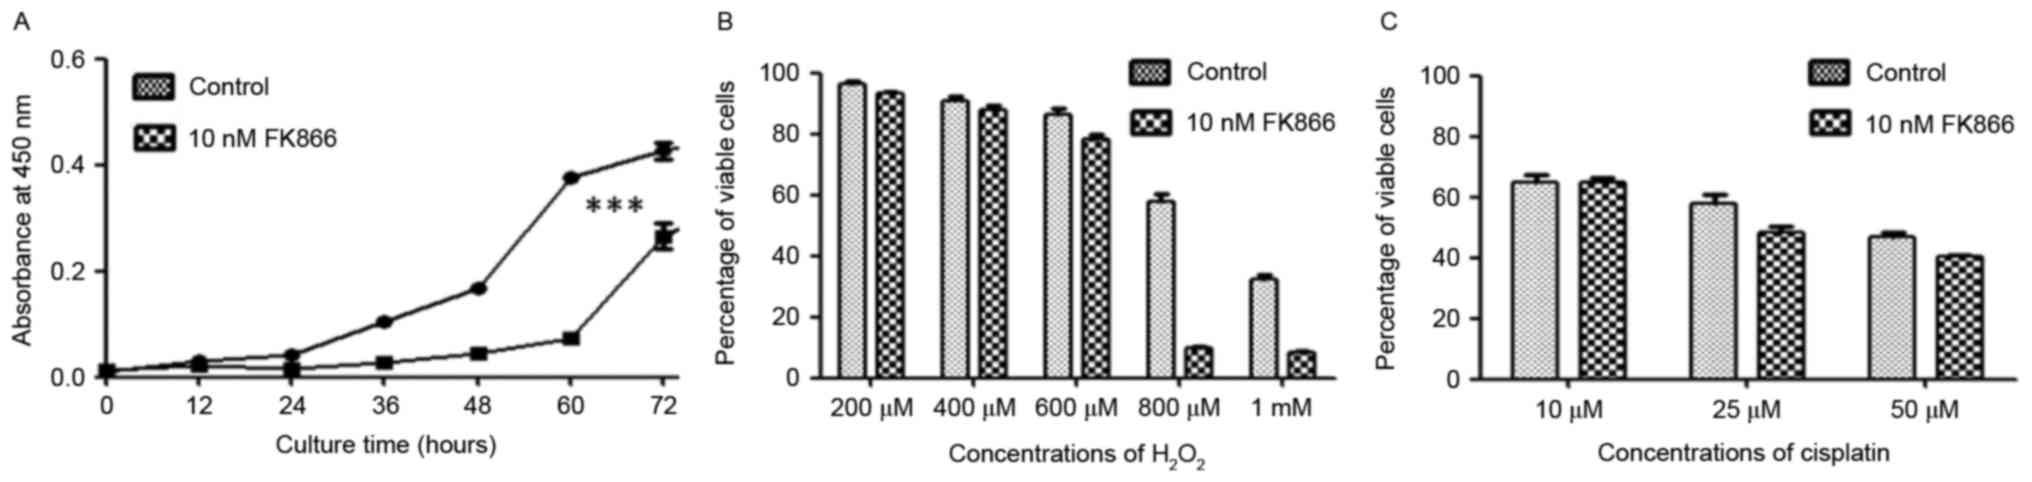
Similar results were also obtained for FK866-treated A549 cells, in
which FK866 treatment inhibited the growth of A549 cells while
increased cell susceptibility to oxidative stress (Fig. 3).
Identification of differentially
expressed proteins between 293T and FK866-treated cells
We then carried out proteomic analysis to identify
differentially expressed proteins between 293T and FK866-treated
cells. Equal amounts of proteins from 293T and FK866-treated cells
were pooled and separated by 1D SDS-PAGE. SILAC-based quantitation
was used to determine the differentially expressed proteins. The
experiments were repeated three times and ~4,200 proteins were
identified in each experiment. The false-positive rate was
estimated to be <1%. Based on SILAC ratios (>1.5 or
<0.67), 384 proteins were found to be differentially expressed
between 293T and FK866-treated cells, in which 325 proteins were
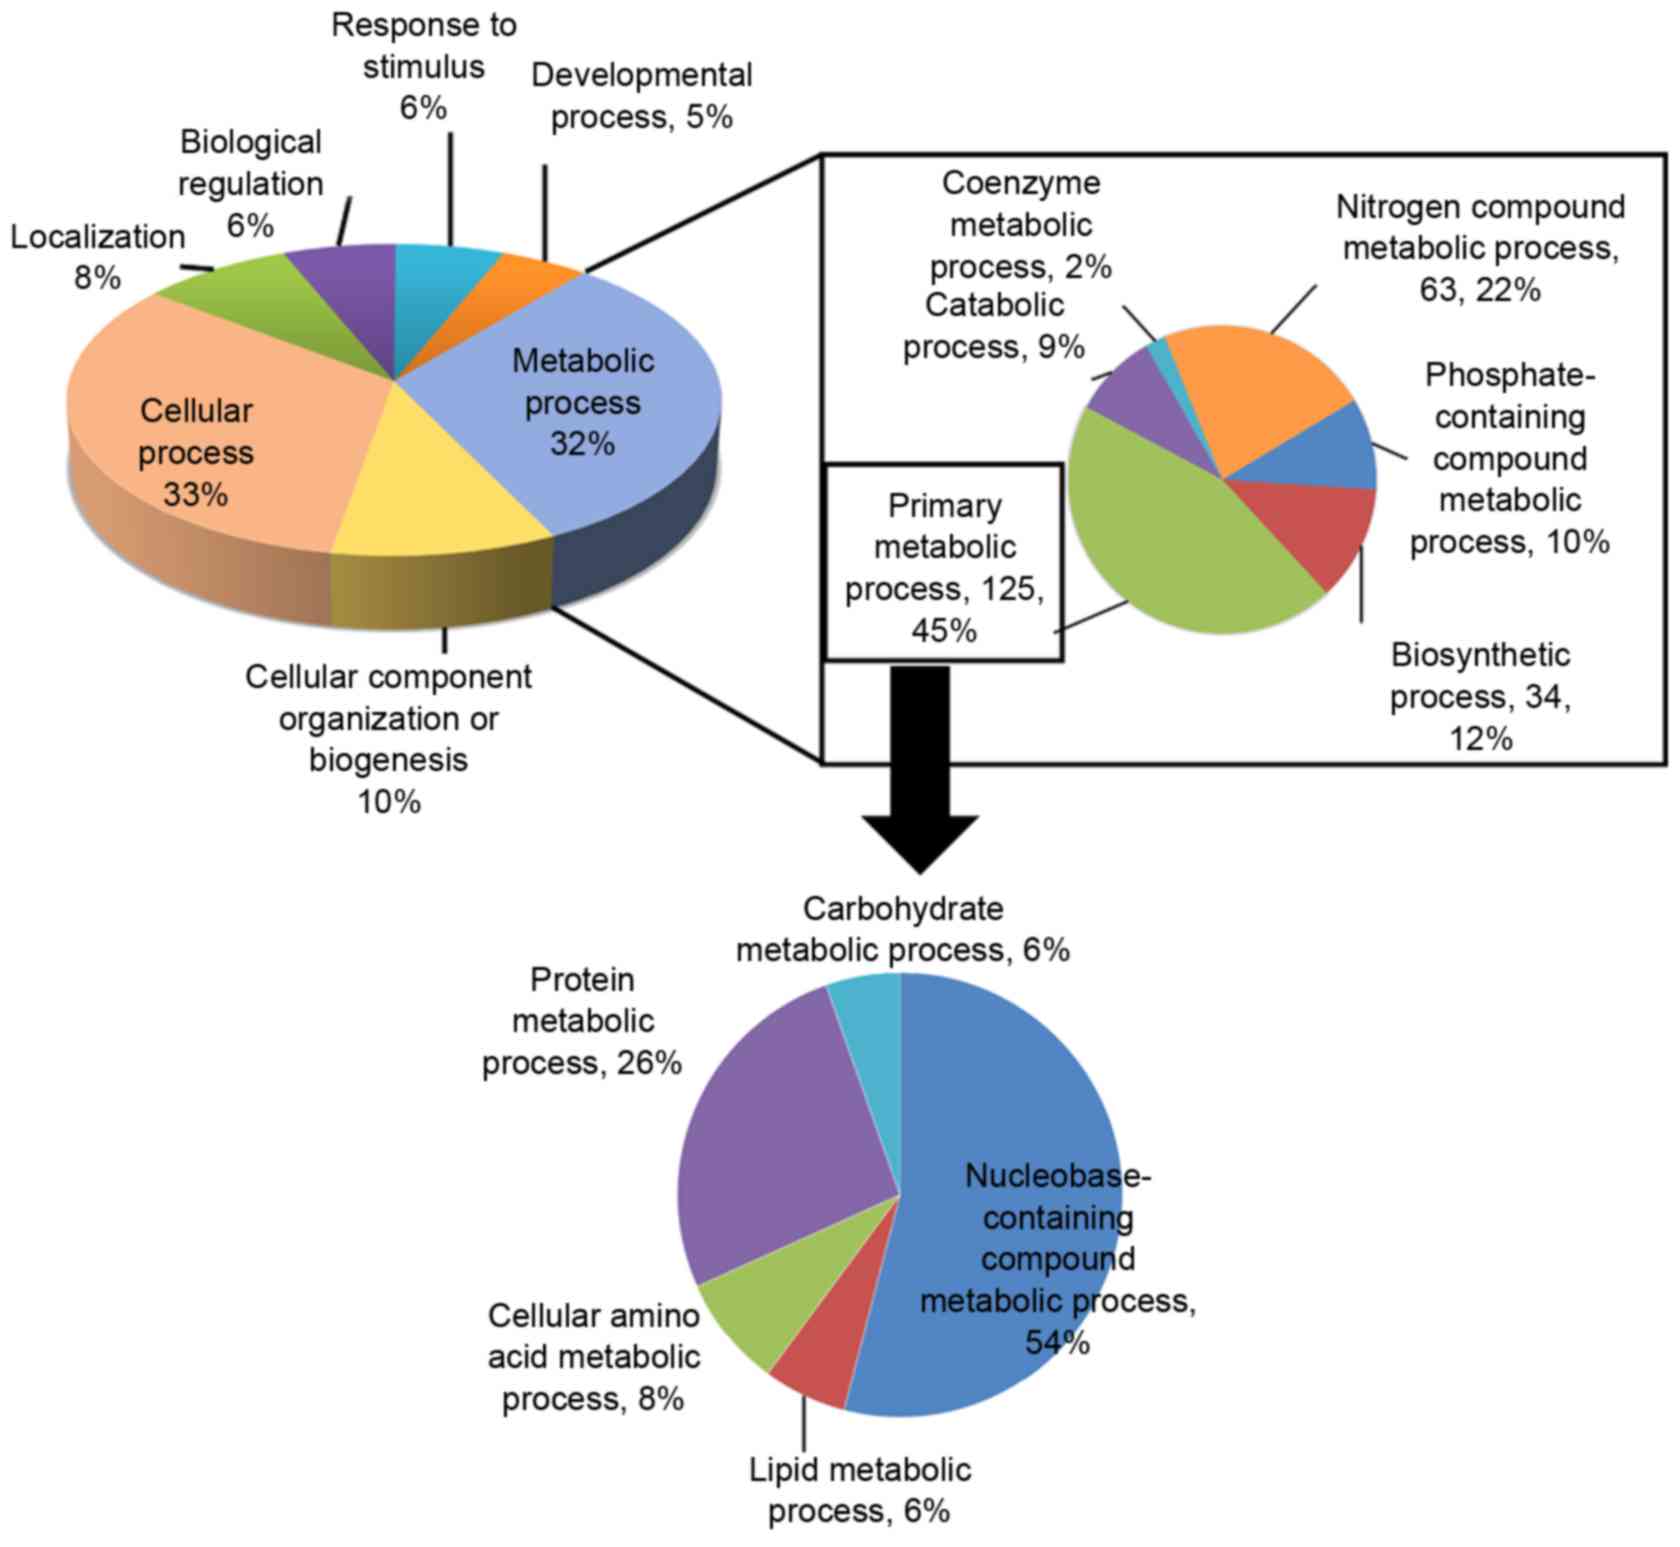
downregulated and 59 were upregulated (data not shown). In order to
understand the biological relevance of the identified proteins,
Gene Ontology (GO) was employed to cluster the downregulated
proteins according to their biological processes which are
summarized via a pie plot using the PANTHER bioinformatics platform
(http://www.pantherdb.org/) (Fig. 4). Three hundred and twenty-five
proteins were classified into several significant groups of
biological processes according to their molecular functions
including primary metabolism, amino acid metabolism, DNA repair,
and cell cycle regulation.
Verification of differentially
expressed proteins by western blotting and qPCR
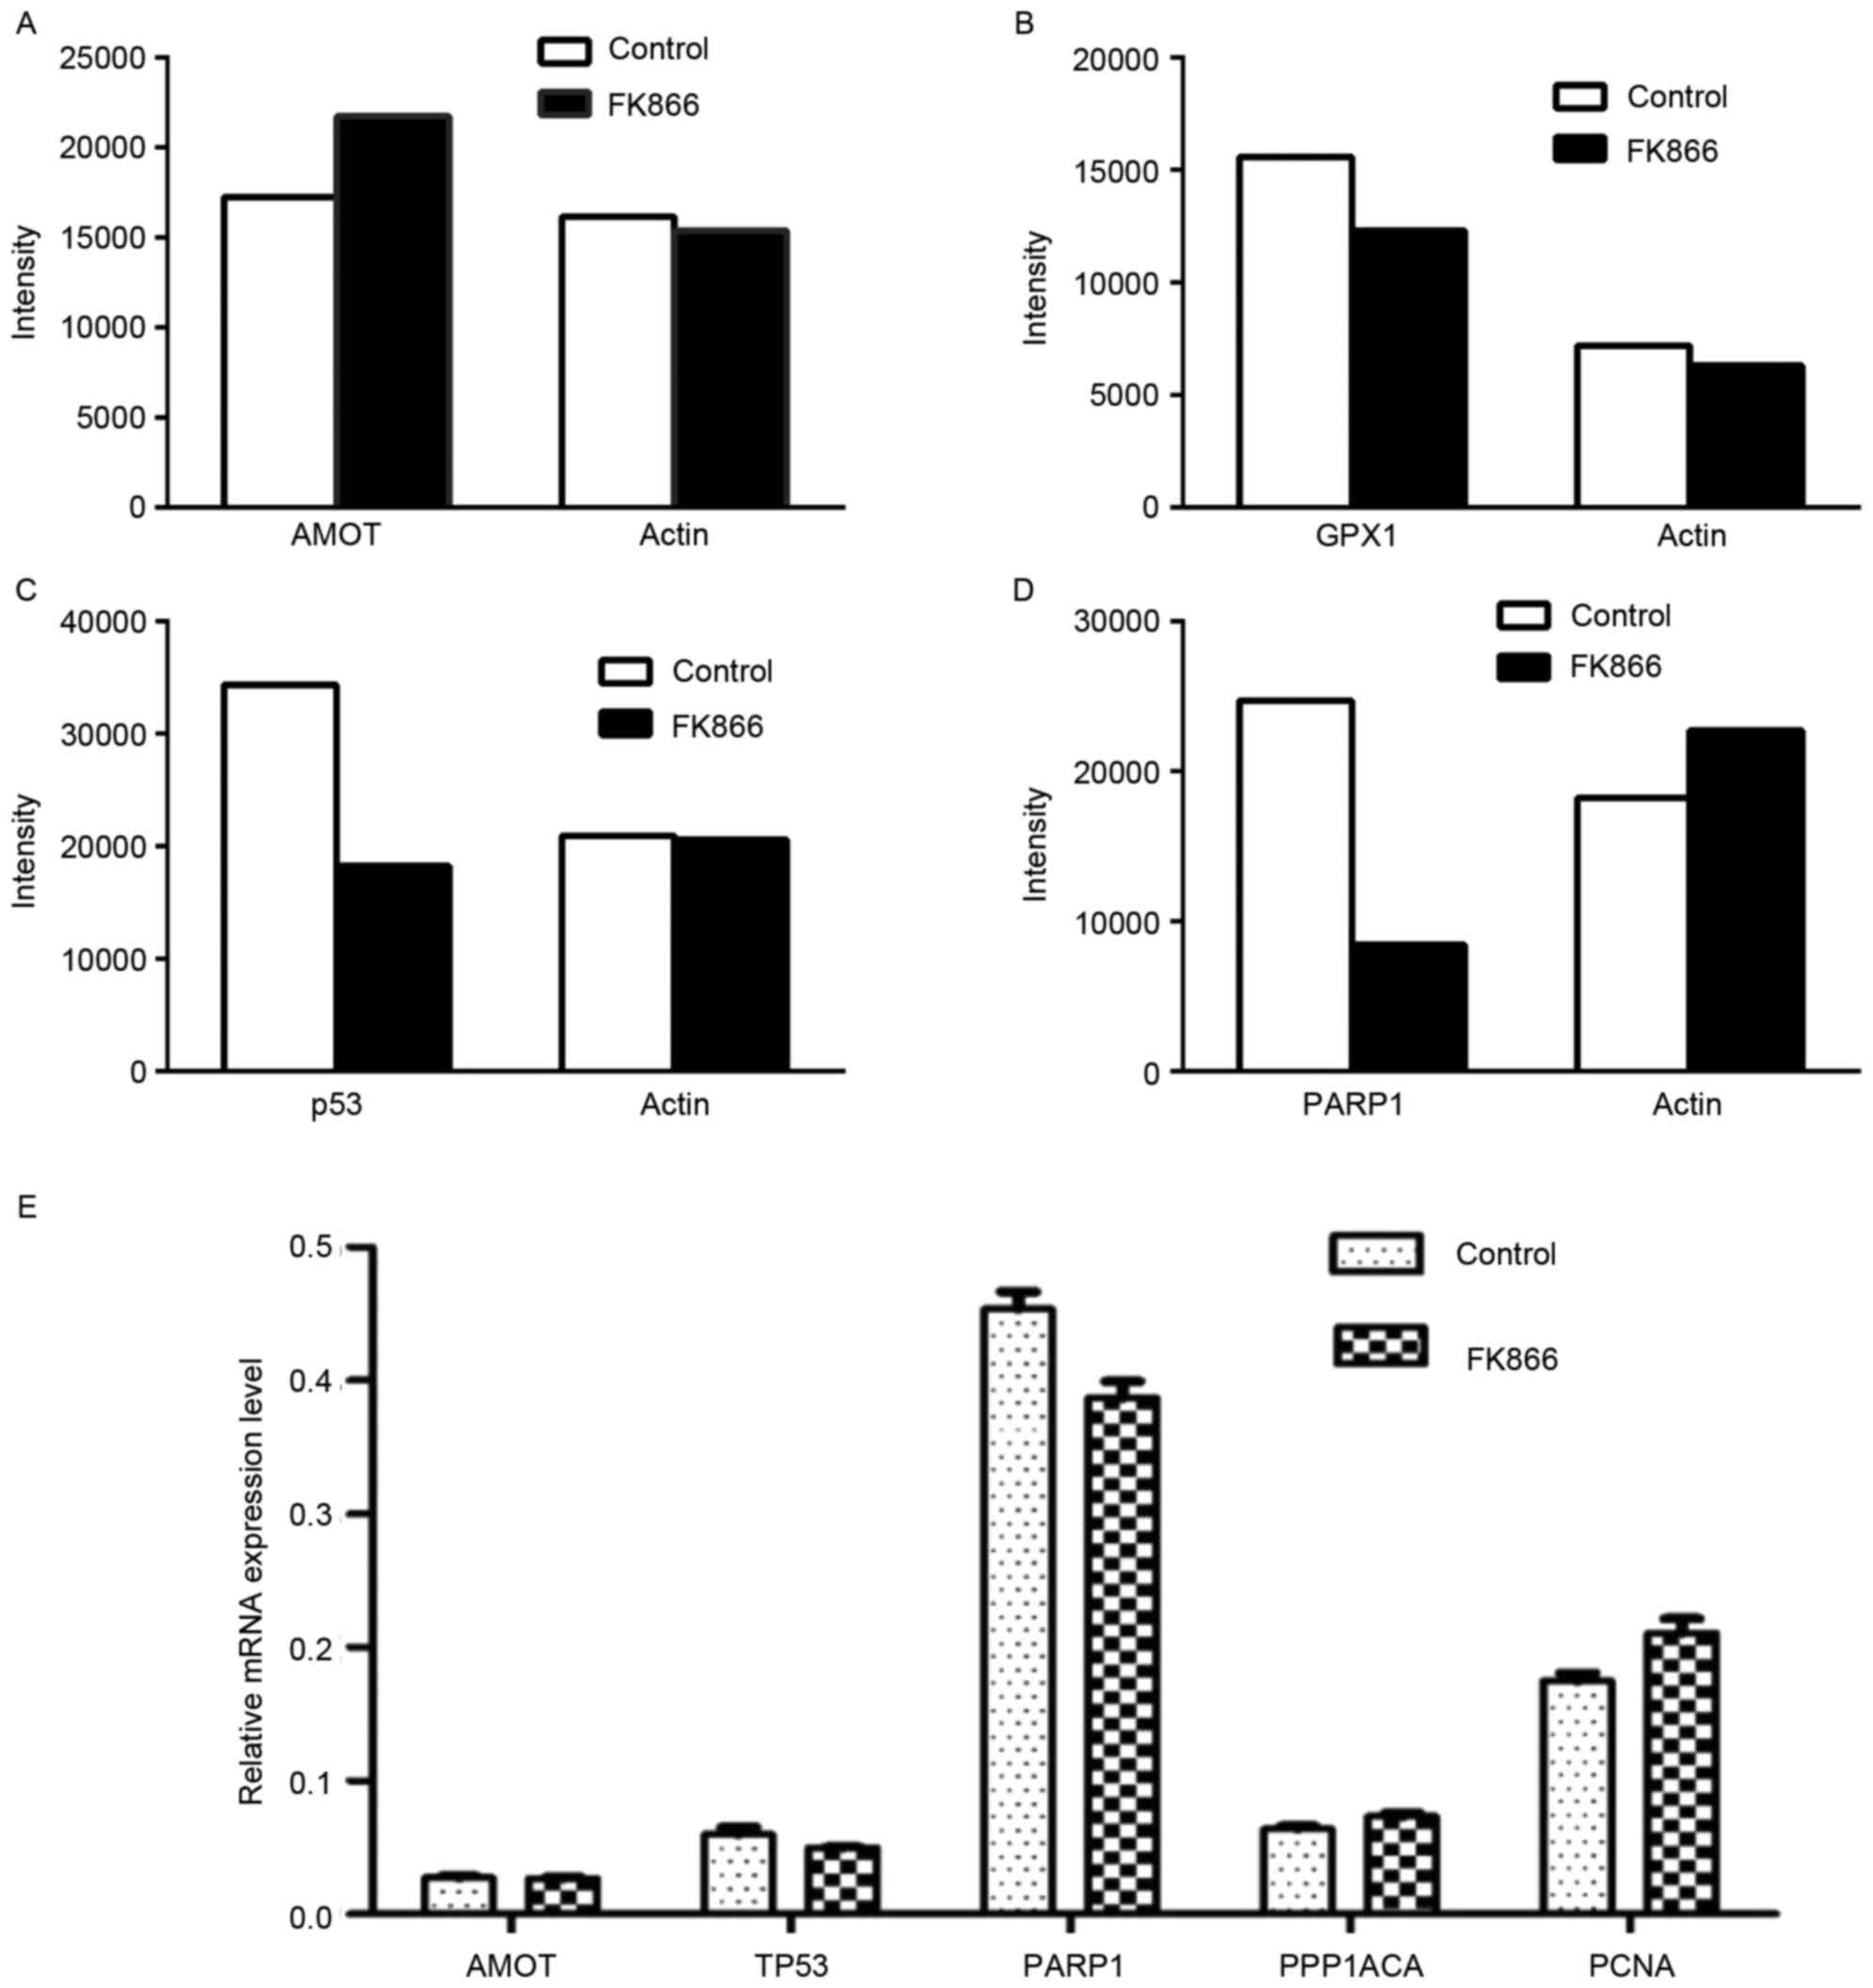
Among the differentially expressed proteins, protein
expression levels of PARP1, p53 and GRX1 were lower in the
FK866-treated cells than those in the untreated cells, whereas
angiomotin expression was higher. Western blot analysis confirmed
that the FK866 treatment induced downregulation of PARP1, p53, and
GRX1, and angiomotin upregulation (data not shown). Band
intensities in western blot images were quantified using Image Lab
4.0.1 software (Fig. 5A-D). The
changes in the band intensities from western blotting were
comparable to the SILAC ratios. Moreover, qPCR analysis was
employed to quantify changes in mRNA levels of the selected genes.
Results showed that the mRNA expression levels of p53 and PARP1
genes were lower in the FK866-treated cells than those in the
untreated cells (Fig. 5E). However,
downregulation of mRNA expressions of p53 and PARP1 genes was less
significant than the corresponding changes in protein
expression.
Discussion
NAD plays an important role in all aspects of
biological processes and its cellular levels are regulated by both
NAD synthesis and consumption. To characterize the effects of the
NAD decrease on cell proliferation, cell responses to oxidative
stress, and protein homeostasis, we treated cells with FK866, an
NAMPT inhibitor. FK866 treatment led to an 80% decrease in the
cellular NAD level. Similarly, the level of NADH was also
significantly decreased in the FK866-treated cells as compared to
the untreated cells (Fig. 1B). By
measuring the proliferation rates of the untreated and
FK866-treated cells (Fig. 1C), we
observed that FK866-treated cells grew slower than that observed in
the untreated cells, indicating that the lower cellular NAD and
NADH levels in the FK866-treated cells slowed down cell
proliferation. We measured the cell survival rates after treating
the untreated and FK866-treated cells with hydrogen peroxide and
cisplatin, and found that FK866-treated cells were extremely
sensitive to oxidative stress induced by hydrogen peroxide and
cisplatin. This indicates that the cellular NAD levels directly
affect the responses to oxidative stress.
To identify factors leading to cell growth
inhibition and enhanced cell susceptibility to oxidative stress in
the FK866-treated cells, we used the SILAC method to quantify
proteins differentially expressed between the untreated and
FK866-treated cells. We identified approximately 4,000 proteins in
three repeated experiments. Among them, 384 proteins were
differentially expressed between the untreated and FK866-treated
cells, and these were found to participate in a variety of cellular
processes, including RNA process, cell metabolism, stress
responses, and cell cycle control and DNA repair. Based on GO
analysis, 47 downregulated proteins were associated with
carbohydrate metabolisms, nucleobase-containing compound metabolic
process, and protein metabolism, suggesting that the cellular NAD
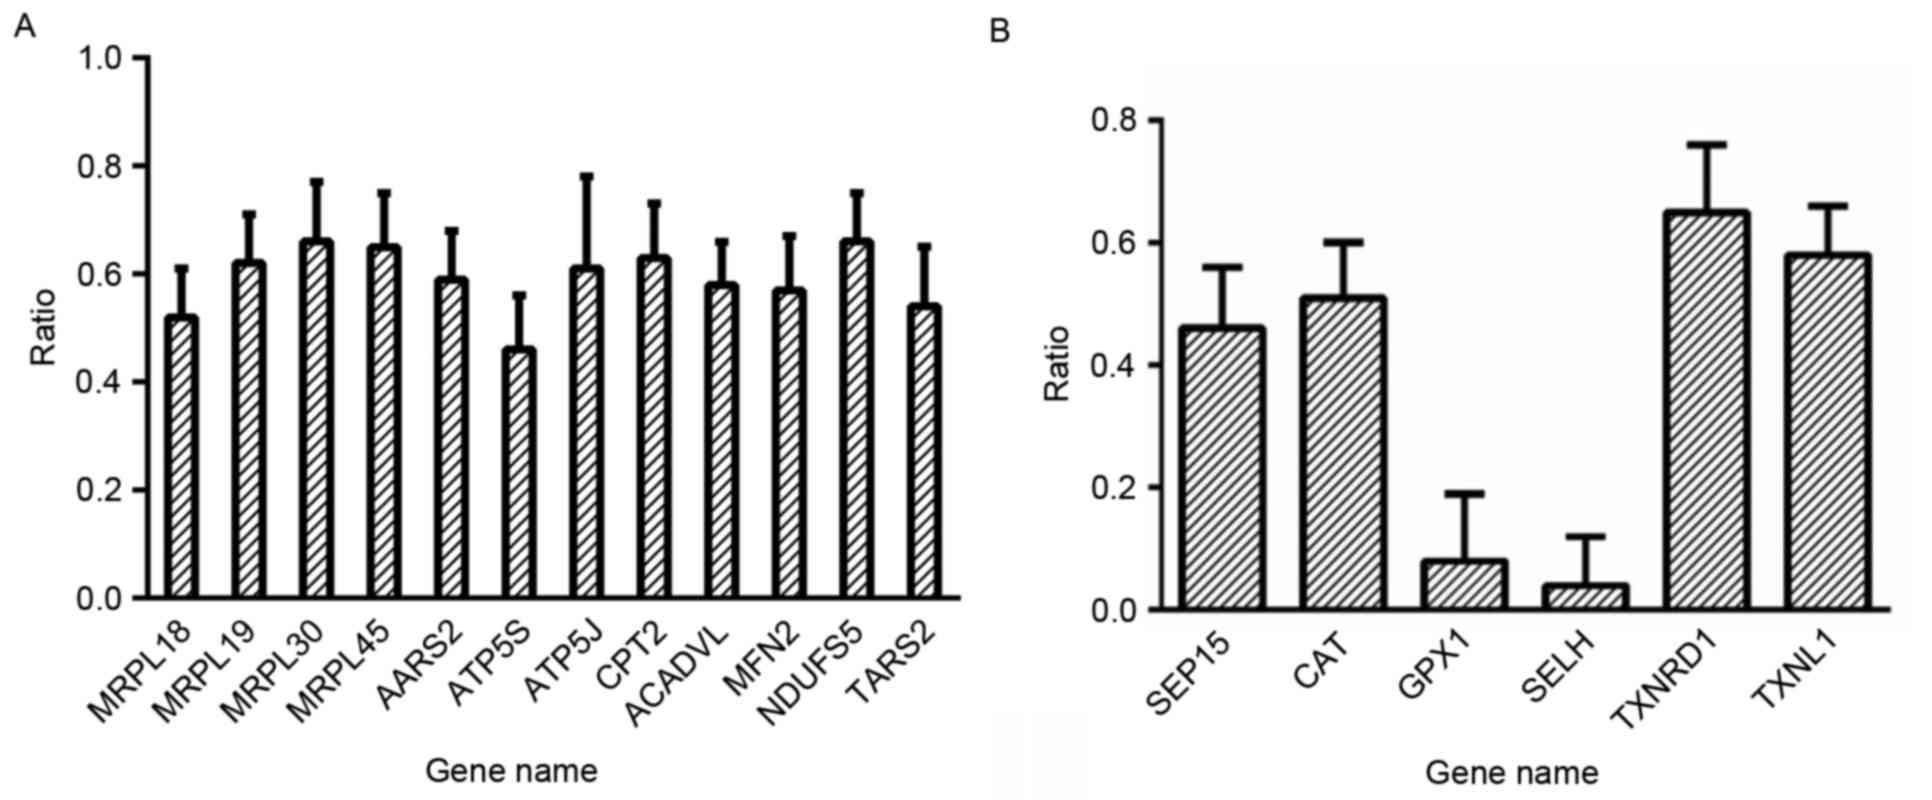
level adversely affected cellular metabolic process. Quantitative
proteomics also showed that proteins associated with mitochondrial
mRNA translation were downregulated in the FK866-treated cells,
including mitochondrial ribosome subunits, alanine-tRNA ligase,
threonine-tRNA ligase and ATP synthase subunits (Fig. 6A), indicating that mitochondrial
protein translation was impaired in the FK866-treated cells. These
results suggest that downregulation of proteins associated with
primary metabolic process and mitochondrial protein synthesis
contributes to the FK866-mediated growth inhibition.
Quantitative proteomics also showed that six
antioxidant proteins 15 kDa selenoprotein (Sep15), thioredoxin
reductase 1 (TXNRD1), selenoprotein H (SELH), catalase (CAT),
glutathione peroxidase 1 (GPX1) and thioredoxin-like protein 1
(TXNL1) were downregulated in the FK866-treated cells (Fig. 6B). These proteins are parts of the
cellular defense system against oxidative stress: GPX1 catalyzes
the reduction of H2O2 and other
hydroperoxides and protects cells from reactive oxygen metabolites;
and SELH is a novel nucleolar oxidoreductase that protects cells
from oxidative damage (36–38). Downregulation of antioxidant
proteins in the FK866-treated cells confirmed that the treated
cells were more sensitive to oxidative stress. It is worth noting
that FK866-mediated PARP1 downregulation was identified by both
proteomics and western blotting. PARP1 plays an important role in
regulating the cellular NAD level. PARP1 interacts with nuclear NAD
synthase to increase the local NAD concentration that regulates
PARP1-dependent gene expression, and PARP1 knockdown can increase
the cellular NAD level (39,40).
Our results revealed that a decrease in NAD induced autonomous
PARP1 downregulation. Furthermore, downregulation of PARP1 and
other DNA repair proteins, including RAD51, ALKBH1, and HMGB2
evidently led to the increased susceptibility to oxidative stress
in the FK866-treated cells.
In conclusion, the present study investigated the
effects of the cellular NAD content on cellular responses by
quantitative proteomics. The cellular NAD level was decreased by
80% in the FK866-treated cells, which significantly altered the
protein homeostasis. Our data indicated that the low cellular NAD
level impairs the primary metabolic process and mitochondrial
protein translational machinery, leading to the growth inhibition
in FK866-treated cells. Downregulation of antioxidant proteins and
DNA-repairing proteins contributed to the enhanced susceptibility
of the FK866-treated cells to oxidative stress.
Acknowledgements
We thank the Proteomics Facility at Tsinghua
University for providing proteomic analysis. This study was
supported by Projects of the Natural Science Foundation of Shandong
Province (ZR2016CL08, to RH.X.), Medical and Health Technology
Development Program of Shandong Province (2016WS0013, to RH.X.),
and the National Natural Science Foundation of China (81670064, to
CJ.L.).
References
|
1
|
Yang Y and Sauve AA: NAD(+) metabolism:
Bioenergetics, signaling and manipulation for therapy. Biochim
Biophys Acta. 1864:1787–1800. 2016. View Article : Google Scholar : PubMed/NCBI
|
|
2
|
Verdin E: NAD+ in aging,
metabolism, and neurodegeneration. Science. 350:1208–1213. 2015.
View Article : Google Scholar : PubMed/NCBI
|
|
3
|
Imai S and Guarente L: NAD+ and
sirtuins in aging and disease. Trends Cell Biol. 24:464–471. 2014.
View Article : Google Scholar : PubMed/NCBI
|
|
4
|
Viña J, Saez GT, Gambini J, Gomez-Cabrera
MC and Borrás C: Role of NAD(+)/NADH redox ratio in cell
metabolism: A tribute to Helmut Sies and Theodor Bücher and Hans A.
Krebs. Arch Biochem Biophys. 595:176–180. 2016. View Article : Google Scholar : PubMed/NCBI
|
|
5
|
Ying W: NAD+/NADH and
NADP+/NADPH in cellular functions and cell death:
Regulation and biological consequences. Antioxid Redox Signal.
10:179–206. 2008. View Article : Google Scholar : PubMed/NCBI
|
|
6
|
Xia W, Wang Z, Wang Q, Han J, Zhao C, Hong
Y, Zeng L, Tang L and Ying W: Roles of NAD(+)/NADH and
NADP(+)/NADPH in cell death. Curr Pharm Des. 15:12–19. 2009.
View Article : Google Scholar : PubMed/NCBI
|
|
7
|
Blander G and Guarente L: The Sir2 family
of protein deacetylases. Annu Rev Biochem. 73:417–435. 2004.
View Article : Google Scholar : PubMed/NCBI
|
|
8
|
Moazed D: Enzymatic activities of Sir2 and
chromatin silencing. Curr Opin Cell Biol. 13:232–238. 2001.
View Article : Google Scholar : PubMed/NCBI
|
|
9
|
Denu JM: The Sir 2 family of protein
deacetylases. Curr Opin Chem Biol. 9:431–440. 2005. View Article : Google Scholar : PubMed/NCBI
|
|
10
|
Guarente L: Sirtuins and calorie
restriction. Nat Rev Mol Cell Biol. 13:2072012.PubMed/NCBI
|
|
11
|
Verdin E, Hirschey MD, Finley LW and
Haigis MC: Sirtuin regulation of mitochondria: Energy production,
apoptosis, and signaling. Trends Biochem Sci. 35:669–675. 2010.
View Article : Google Scholar : PubMed/NCBI
|
|
12
|
Brooks CL and Gu W: How does SIRT1 affect
metabolism, senescence and cancer? Nat Rev Cancer. 9:123–128. 2009.
View Article : Google Scholar : PubMed/NCBI
|
|
13
|
Yang H, Yang T, Baur JA, Perez E, Matsui
T, Carmona JJ, Lamming DW, Souza-Pinto NC, Bohr VA, Rosenzweig A,
et al: Nutrient-sensitive mitochondrial NAD+ levels
dictate cell survival. Cell. 130:1095–1107. 2007. View Article : Google Scholar : PubMed/NCBI
|
|
14
|
Chang HC and Guarente L: SIRT1 mediates
central circadian control in the SCN by a mechanism that decays
with aging. Cell. 153:1448–1460. 2013. View Article : Google Scholar : PubMed/NCBI
|
|
15
|
Luo X and Kraus WL: On PAR with PARP:
Cellular stress signaling through poly(ADP-ribose) and PARP-1.
Genes Dev. 26:417–432. 2012. View Article : Google Scholar : PubMed/NCBI
|
|
16
|
Schreiber V, Dantzer F, Ame JC and de
Murcia G: Poly(ADP-ribose): Novel functions for an old molecule.
Nat Rev Mol Cell Biol. 7:517–528. 2006. View Article : Google Scholar : PubMed/NCBI
|
|
17
|
Braidy N, Guillemin GJ, Mansour H,
Chan-Ling T, Poljak A and Grant R: Age related changes in
NAD+ metabolism oxidative stress and Sirt1 activity in
wistar rats. PLoS One. 6:e191942011. View Article : Google Scholar : PubMed/NCBI
|
|
18
|
Prolla TA and Denu JM: NAD+
deficiency in age-related mitochondrial dysfunction. Cell Metab.
19:178–180. 2014. View Article : Google Scholar : PubMed/NCBI
|
|
19
|
Mouchiroud L, Houtkooper RH, Moullan N,
Katsyuba E, Ryu D, Cantó C, Mottis A, Jo YS, Viswanathan M,
Schoonjans K, et al: The NAD(+)/sirtuin pathway modulates longevity
through activation of mitochondrial UPR and FOXO signaling. Cell.
154:430–441. 2013. View Article : Google Scholar : PubMed/NCBI
|
|
20
|
Mills KF, Yoshida S, Stein LR, Grozio A,
Kubota S, Sasaki Y, Redpath P, Migaud ME, Apte RS, Uchida K, et al:
Long-term administration of nicotinamide mononucleotide mitigates
age-associated physiological decline in mice. Cell Metab.
24:795–806. 2016. View Article : Google Scholar : PubMed/NCBI
|
|
21
|
Zhang H, Ryu D, Wu Y, Gariani K, Wang X,
Luan P, D'Amico D, Ropelle ER, Lutolf MP, Aebersold R, et al:
NAD+ repletion improves mitochondrial and stem cell
function and enhances life span in mice. Science. 352:1436–1443.
2016. View Article : Google Scholar : PubMed/NCBI
|
|
22
|
Fang EF, Kassahun H, Croteau DL,
Scheibye-Knudsen M, Marosi K, Lu H, Shamanna RA, Kalyanasundaram S,
Bollineni RC, Wilson MA, et al: NAD(+) replenishment improves
lifespan and healthspan in ataxia telangiectasia models via
mitophagy and DNA repair. Cell Metab. 24:566–581. 2016. View Article : Google Scholar : PubMed/NCBI
|
|
23
|
Camacho-Pereira J, Tarragó MG, Chini CC,
Nin V, Escande C, Warner GM, Puranik AS, Schoon RA, Reid JM, Galina
A, et al: CD38 dictates age-related NAD decline and mitochondrial
dysfunction through an SIRT3-dependent mechanism. Cell Metab.
23:1127–1139. 2016. View Article : Google Scholar : PubMed/NCBI
|
|
24
|
Mei SC and Brenner C: NAD as a
genotype-specific drug target. Chem Biol. 20:1307–1308. 2013.
View Article : Google Scholar : PubMed/NCBI
|
|
25
|
Chiarugi A, Dölle C, Felici R and Ziegler
M: The NAD metabolome - a key determinant of cancer cell biology.
Nat Rev Cancer. 12:741–752. 2012. View
Article : Google Scholar : PubMed/NCBI
|
|
26
|
Gallí M, Van Gool F, Rongvaux A, Andris F
and Leo O: The nicotinamide phosphoribosyltransferase: A molecular
link between metabolism, inflammation, and cancer. Cancer Res.
70:8–11. 2010. View Article : Google Scholar : PubMed/NCBI
|
|
27
|
Garten A, Petzold S, Körner A, Imai S and
Kiess W: Nampt: Linking NAD biology, metabolism and cancer. Trends
Endocrinol Metab. 20:130–138. 2009. View Article : Google Scholar : PubMed/NCBI
|
|
28
|
Hasmann M and Schemainda I: FK866, a
highly specific noncompetitive inhibitor of nicotinamide
phosphoribosyltransferase, represents a novel mechanism for
induction of tumor cell apoptosis. Cancer Res. 63:7436–7442.
2003.PubMed/NCBI
|
|
29
|
Khan JA, Tao X and Tong L: Molecular basis
for the inhibition of human NMPRTase, a novel target for anticancer
agents. Nat Struct Mol Biol. 13:582–588. 2006. View Article : Google Scholar : PubMed/NCBI
|
|
30
|
Thakur BK, Dittrich T, Chandra P, Becker
A, Kuehnau W, Klusmann JH, Reinhardt D and Welte K: Involvement of
p53 in the cytotoxic activity of the NAMPT inhibitor FK866 in
myeloid leukemic cells. Int J Cancer. 132:766–774. 2013. View Article : Google Scholar : PubMed/NCBI
|
|
31
|
Thakur BK, Dittrich T, Chandra P, Becker
A, Lippka Y, Selvakumar D, Klusmann JH, Reinhardt D and Welte K:
Inhibition of NAMPT pathway by FK866 activates the function of p53
in HEK293T cells. Biochem Biophys Res Commun. 424:371–377. 2012.
View Article : Google Scholar : PubMed/NCBI
|
|
32
|
Schuster S, Penke M, Gorski T, Gebhardt R,
Weiss TS, Kiess W and Garten A: FK866-induced NAMPT inhibition
activates AMPK and downregulates mTOR signaling in hepatocarcinoma
cells. Biochem Biophys Res Commun. 458:334–340. 2015. View Article : Google Scholar : PubMed/NCBI
|
|
33
|
Cea M, Cagnetta A, Fulciniti M, Tai YT,
Hideshima T, Chauhan D, Roccaro A, Sacco A, Calimeri T, Cottini F,
et al: Targeting NAD+ salvage pathway induces autophagy
in multiple myeloma cells via mTORC1 and extracellular
signal-regulated kinase (ERK1/2) inhibition. Blood. 120:3519–3529.
2012. View Article : Google Scholar : PubMed/NCBI
|
|
34
|
Billington RA, Genazzani AA, Travelli C
and Condorelli F: NAD depletion by FK866 induces autophagy.
Autophagy. 4:385–387. 2008. View Article : Google Scholar : PubMed/NCBI
|
|
35
|
Xu R, Tian E, Tang H, Liu C and Wang Q:
Proteomic analysis of gossypol induces necrosis in multiple myeloma
cells. Biomed Res Int. 2014:8392322014. View Article : Google Scholar : PubMed/NCBI
|
|
36
|
Brigelius-Flohé R and Maiorino M:
Glutathione peroxidases. Biochim Biophys Acta. 1830:3289–3303.
2013. View Article : Google Scholar : PubMed/NCBI
|
|
37
|
Brigelius-Flohé R and Kipp A: Glutathione
peroxidases in different stages of carcinogenesis. Biochim Biophys
Acta. 1790:1555–1568. 2009. View Article : Google Scholar : PubMed/NCBI
|
|
38
|
Novoselov SV, Kryukov GV, Xu XM, Carlson
BA, Hatfield DL and Gladyshev VN: Selenoprotein H is a nucleolar
thioredoxin-like protein with a unique expression pattern. J Biol
Chem. 282:11960–11968. 2007. View Article : Google Scholar : PubMed/NCBI
|
|
39
|
Zhang T, Berrocal JG, Yao J, DuMond ME,
Krishnakumar R, Ruhl DD, Ryu KW, Gamble MJ and Kraus WL: Regulation
of poly(ADP-ribose) polymerase-1-dependent gene expression through
promoter-directed recruitment of a nuclear NAD+
synthase. J Biol Chem. 287:12405–12416. 2012. View Article : Google Scholar : PubMed/NCBI
|
|
40
|
Bai P, Cantó C, Oudart H, Brunyánszki A,
Cen Y, Thomas C, Yamamoto H, Huber A, Kiss B, Houtkooper RH, et al:
PARP-1 inhibition increases mitochondrial metabolism through SIRT1
activation. Cell Metab. 13:461–468. 2011. View Article : Google Scholar : PubMed/NCBI
|