Introduction
Estrogen receptor α (ER) is a ligand-activated
transcription factor that is activated by the hormone estrogen
(17β-estradiol) to regulate processes in the reproductive tract,
the mammary gland as well as the skeletal and cardiovascular
system. ER is also important in tumorigenesis, especially in breast
carcinomas where it is involved in a wide range of critical
signaling pathways such as cell growth and differentiation.
Clinically, the ER status is one of the most
important molecular classification schemes in breast cancer. About
two-thirds of all breast cancer patients overproduce ER
(ER-positive, ER+) at the time of diagnosis and 60–70%
of them respond well to anti-hormone agents such as tamoxifen and
anastrazole (1). These patients
often have a good prognosis when concomitantly treated with other
chemotherapeutic agents (2,3).
However, some ER+ breast cancer patients
receiving anti-hormone and/or chemotherapy lose function or
expression of the ER during the clinical evolution of the disease
(4–6). With a low or absent ER expression
(ER-negative, ER−) and a lack of ER-dependent cancer
cell growth, the tumors are associated with a non-differentiated
phenotype, a high cell-proliferation index and high aggressiveness,
which in turn lead to a high rate of poor responses to a second
round of therapy and a worse prognosis than the ER−
group diagnosed before any treatment (7,8).
Therefore, breast cancer cells that transform from ER+
to ER− may display unique gene expression patterns that
are associated with high malignancy, including aggressiveness and
drug resistance. Clarifying these patterns may provide a way to
identify a more malignant subgroup of cells among the total
ER− population.
Microarray and next-generation sequencing
technologies provide a window into the global gene expression
changes in cancer cells. Previously, numerous studies have sought
for gene-expression patterns that distinguish between
ER+ and the ER− breast cancer cells which
were either collected from ER+ and ER− breast
cancer patients (9,10), or from ER-silenced breast cancer
cells (11,12). However, no study has analyzed the
differences in gene expression between anti-hormone or
chemotherapy-induced ER− cells and their parental
ER+ cells.
Therefore, in order to understand the changes in
gene expression and cell signaling during treatment-induced loss of
ER and aiming to develop an indicator for the more malignant
subgroup of ER− cells, an ER-modified signature (EMS)
was developed from the expression profile of a chemoresistant MCF-7
breast cancer cell line that lost ER during long-term treatment
with a chemotherapeutic agent. The EMS not only discriminated the
ER− from ER+ breast cancer cells, but it was
also sensitive in indicating the chemoresponse of the
ER− patients.
Materials and methods
Cell lines
ER− MCF-7 cells (MCF-7/ADM) that are
chemoresistant (13), highly
aggressive (13–16) and exhibit properties of
epithelial-mesenchymal transition (17) were derived by treating normal MCF-7
cells [(MCF-7/wild-type (WT)] (American Type Culture Collection,
Manassas, VA, USA) with stepwise increasing concentrations of
Adriamycin (ADM, from 0.01 to 250 µM) over 8 months as we
previously described (13). Both
the MCF-7/WT and the MCF-7/ADM cells were cultured in RPMI-1640
medium (Gibco; Thermo Fisher Scientific, Inc., Waltham, MA, USA)
supplemented with 10% (vol/vol) fetal bovine serum (FBS), 100 µg/ml
penicillin and 100 U/ml streptomycin. The half maximal inhibitory
concentrations (IC50s) of ADM were 5.2±4.8 and 67±17.7
µM in the MCF-7/WT and the MCF-7/ADM cells, respectively (13,15–17).
Western blot analysis
The total proteins of the MCF-7/ADM and the MCF-7/WT
cells were extracted using the CytoBuster™ Protein Extraction
Reagent (Novagen, Madison, WI, USA) at 4°C. Subsequently, the
proteins were resolved by 10% SDS-PAGE and transferred
electrophoretically (at 100 V, for 1 h) onto polyvinylidene
difluoride membranes, which were blocked (for 1 h, at 20°C) with 3%
bovine serum albumin (BSA). The membranes were then incubated with
the primary antibody, anti-human estrogen receptor alpha (ab75635,
1:2,000 dilution; Abcam, Cambridge, MA, USA) overnight at 4°C.
Anti-GAPDH (ab9483, 1:1,000 dilution; Abcam) was used as a loading
control. After incubation with the proper secondary antibodies,
antibody binding was detected with an Odyssey Imaging system
(LI-COR Biosciences, Lincoln, NE, USA).
RNA sequencing and data
deposition
The total RNA of the MCF-7/ADM and the MCF-7/WT
cells was extracted with TRIzol reagent (Invitrogen Life
Technologies, Carlsbad, CA, USA) according to the manufacturer's
protocol. The quality of RNA was determined by rRNA ratio (28S/18S)
and the RNA integrity number (RIN) was assessed with Agilent 2100
Bioanalyzer (Agilent Technologies, Inc., Santa Clara, CA, USA).
RNAs with 28S/18S=2 and RIN=9 were sequenced on an Illumina
HiSeq2000 (Illumina, Inc., San Diego, CA, USA). The raw data and
the RNA-sequencing of the MCF-7 cells were deposited in the Gene
Expression Omnibus (GEO) database (GSE68815): http://www.ncbi.nlm.nih.gov/geo/query/acc.cgi?acc=GSE68815.
Summary of public datasets
We collected publicly available datasets of breast
cancer cells and clinical breast cancer samples from GEO. The gene
expression of these cells and samples was produced by whole-genome
microarrays (Table I).
 | Table I.Publicly available gene expression
data analyzed in the present study. |
Table I.
Publicly available gene expression
data analyzed in the present study.
Statistical analysis
Hierarchical clustering was performed with Cluster
3.0 (University of Tokyo, Human Genome Center, Tokyo, Japan) and
TreeView software (Stanford University, Stanford, CA, USA). The
Bayesian binary regression analysis using leave-one-out
cross-validation in SPSS was used to assess the validity and
robustness of the EMS in distinguishing the two phenotypic states
(27–32). The performance of EMS was evaluated
by the area under the receiver operating characteristic (ROC) curve
(AUC, Matlab; MathWorks, Inc., Natick, MA, USA). The distant
relapse-free survival (DRFS) and the relapse-free survival (RFS)
were analyzed by the Kaplan-Meier method and compared with the
log-rank method (GraphPad Prism software; GraphPad Software, Inc.,
La Jolla, CA, USA). Odds ratios (ORs) for death events were
calculated using the Review Manager software (The Cochrane
Collaboration, Copenhagen, Denmark) to yield forest plots. The
Kyoto Encyclopedia of Genes and Genomes (KEGG) and the Gene
Ontology (GO) analysis were processed in the WebGestalt website
(http://www.webgestalt.org/option.php).
Results
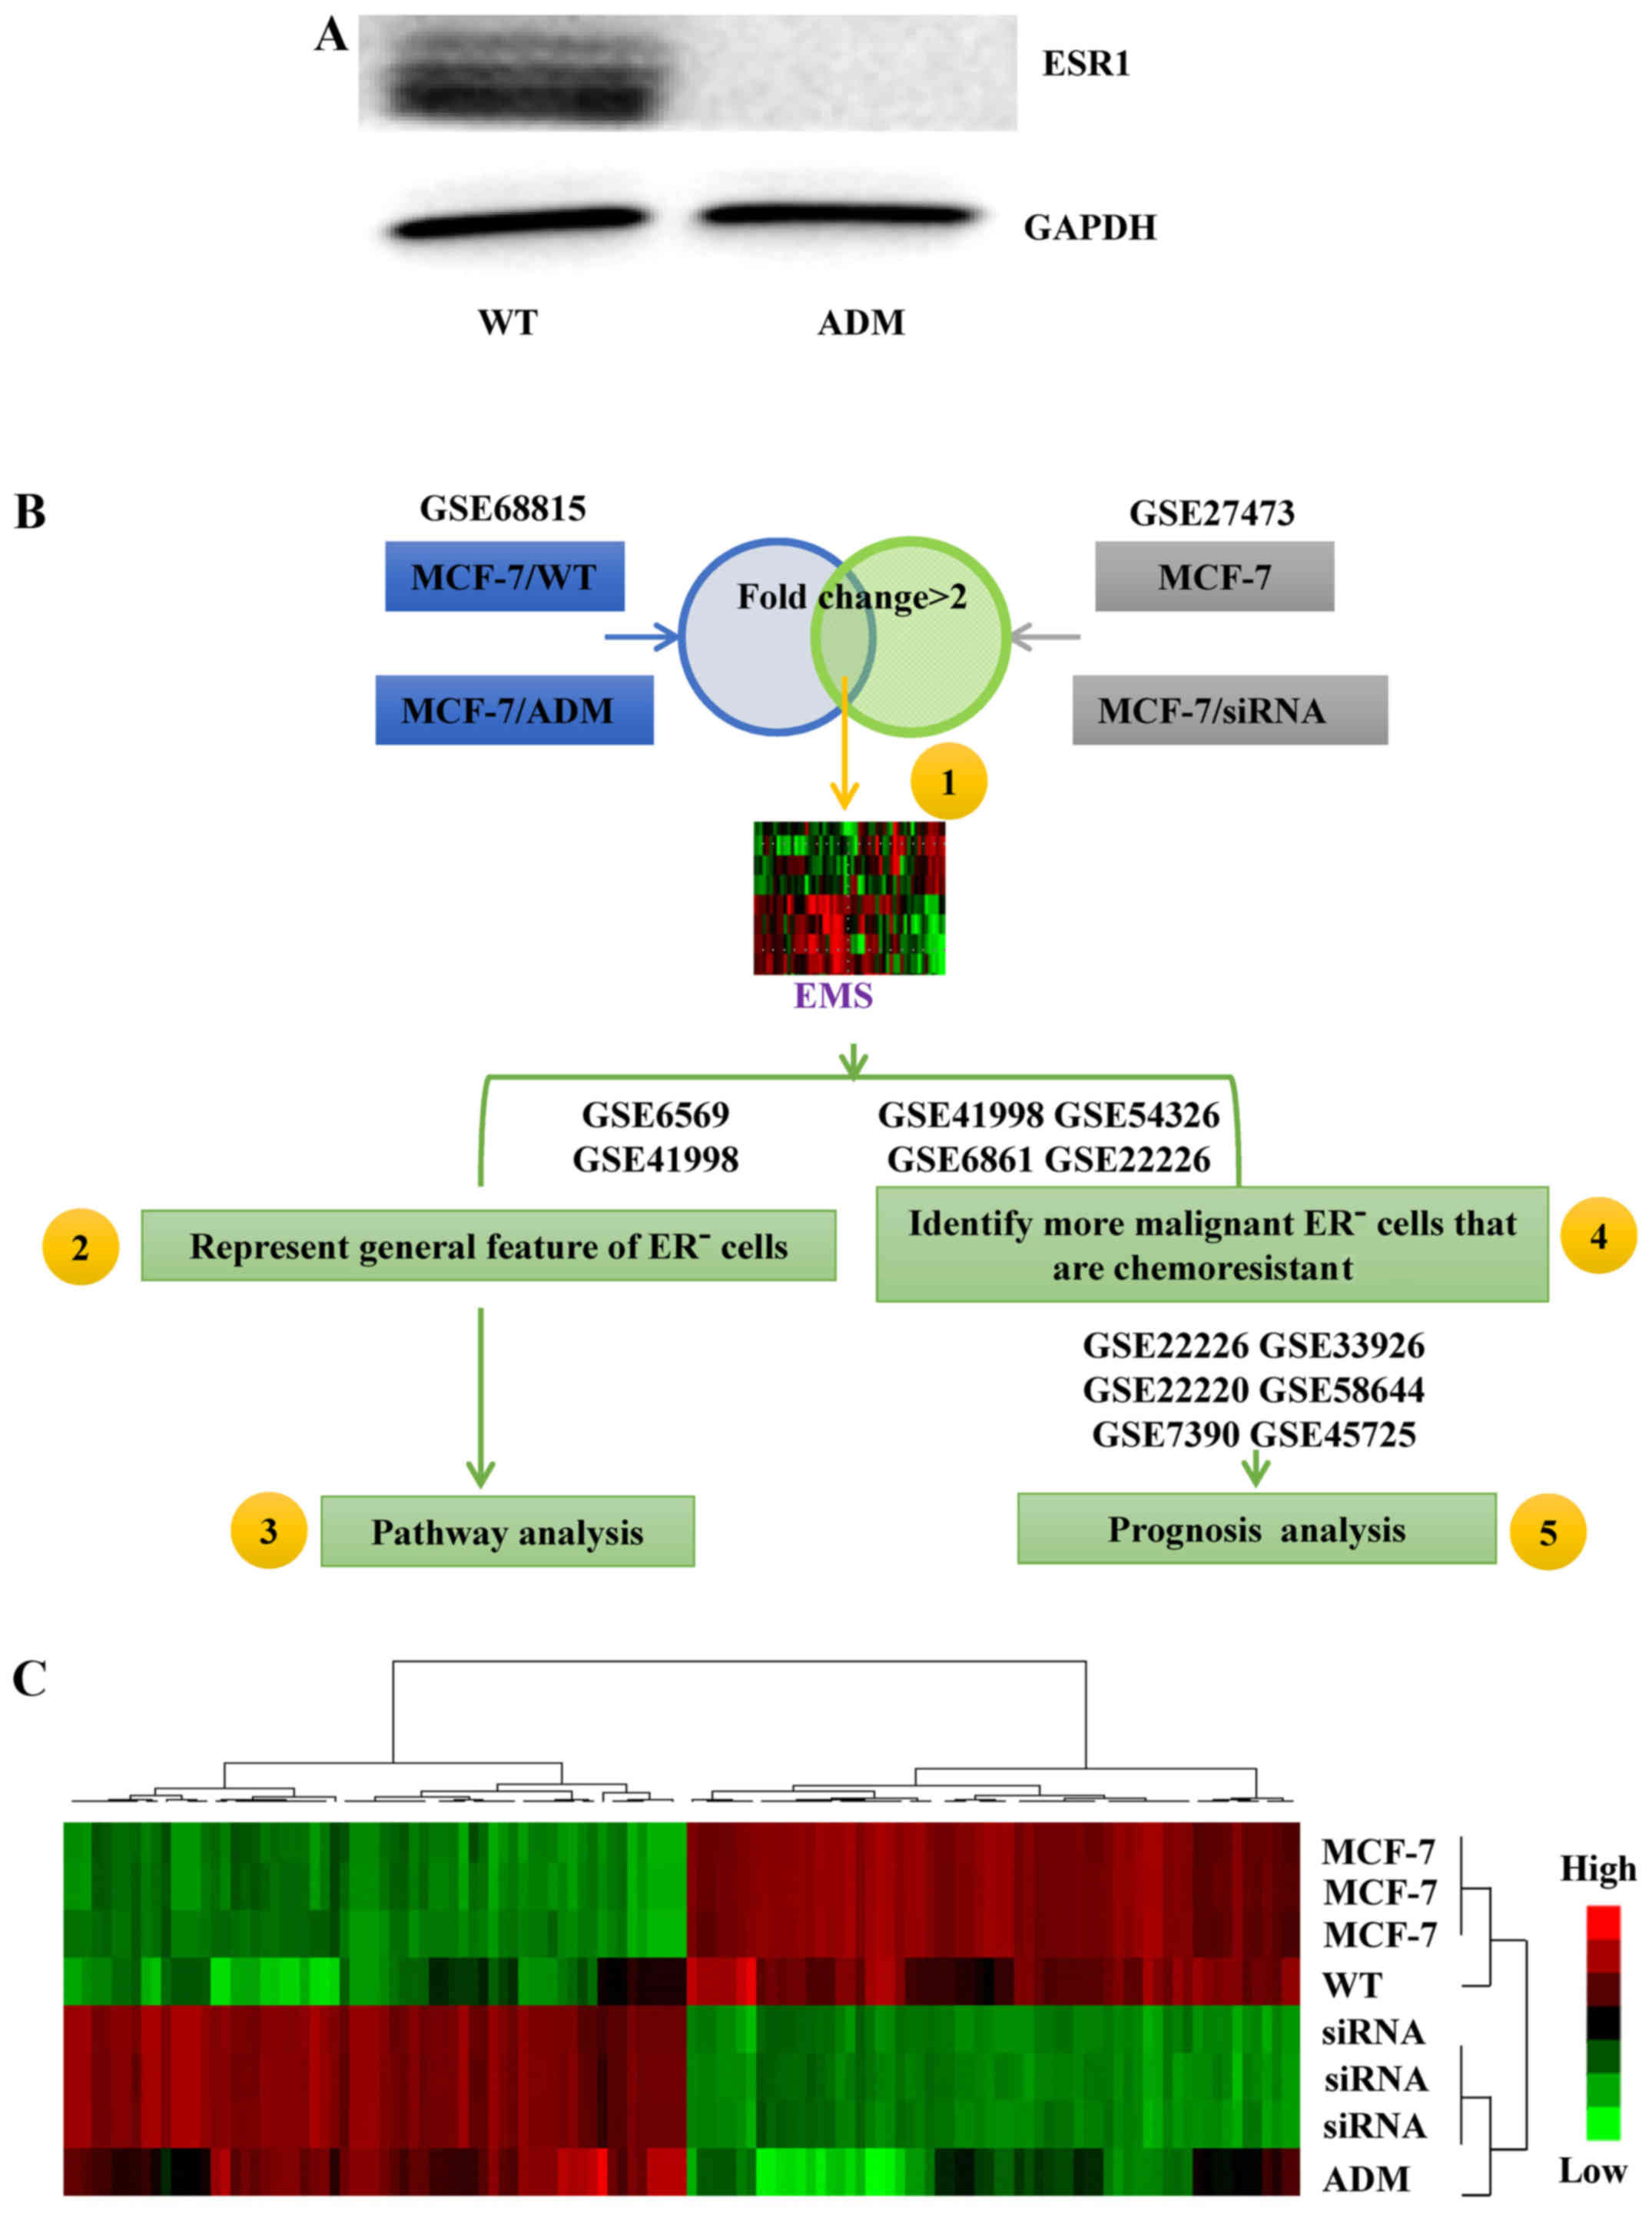
Generating the EMS
We used a previously developed MCF-7 cell line
(MCF-7/ADM) and its parental control line (MCF-7/WT) as the basis
of the signature development. The MCF-7/ADM cells were
ER− (Fig. 1A) and much
more resistant to ADM than the MCF-7/WT cells (13). Therefore, the gene-expression
profile of the MCF-7/ADM cells contained information about
chemoresistance in ER− breast cancer cells (NCBI
database: GSE68815). When the gene-expression profile of the
ER− and chemoresistant MCF-7/ADM cells was compared with
that of the ER+ and chemosensitive MCF-7/WT cells,
>5,000 genes were found with fold changes >2.
Subsequently, GSE27473 (11) was used to refine the list of genes.
The ERs in the MCF-7 cells in this dataset were silenced by siRNA,
so the silenced cells may present features typical of ER-related
signals. Within GSE27473, >300 genes were found with a fold
change >2 in the ER-silenced MCF-7 cells compared with the
control cells. Subsequently, the selected genes from GSE68815 and
GSE27473 were integrated to generate the 105-gene EMS (Fig. 1B, step 1; Fig. 1C, the list of genes is not shown in
the present study).
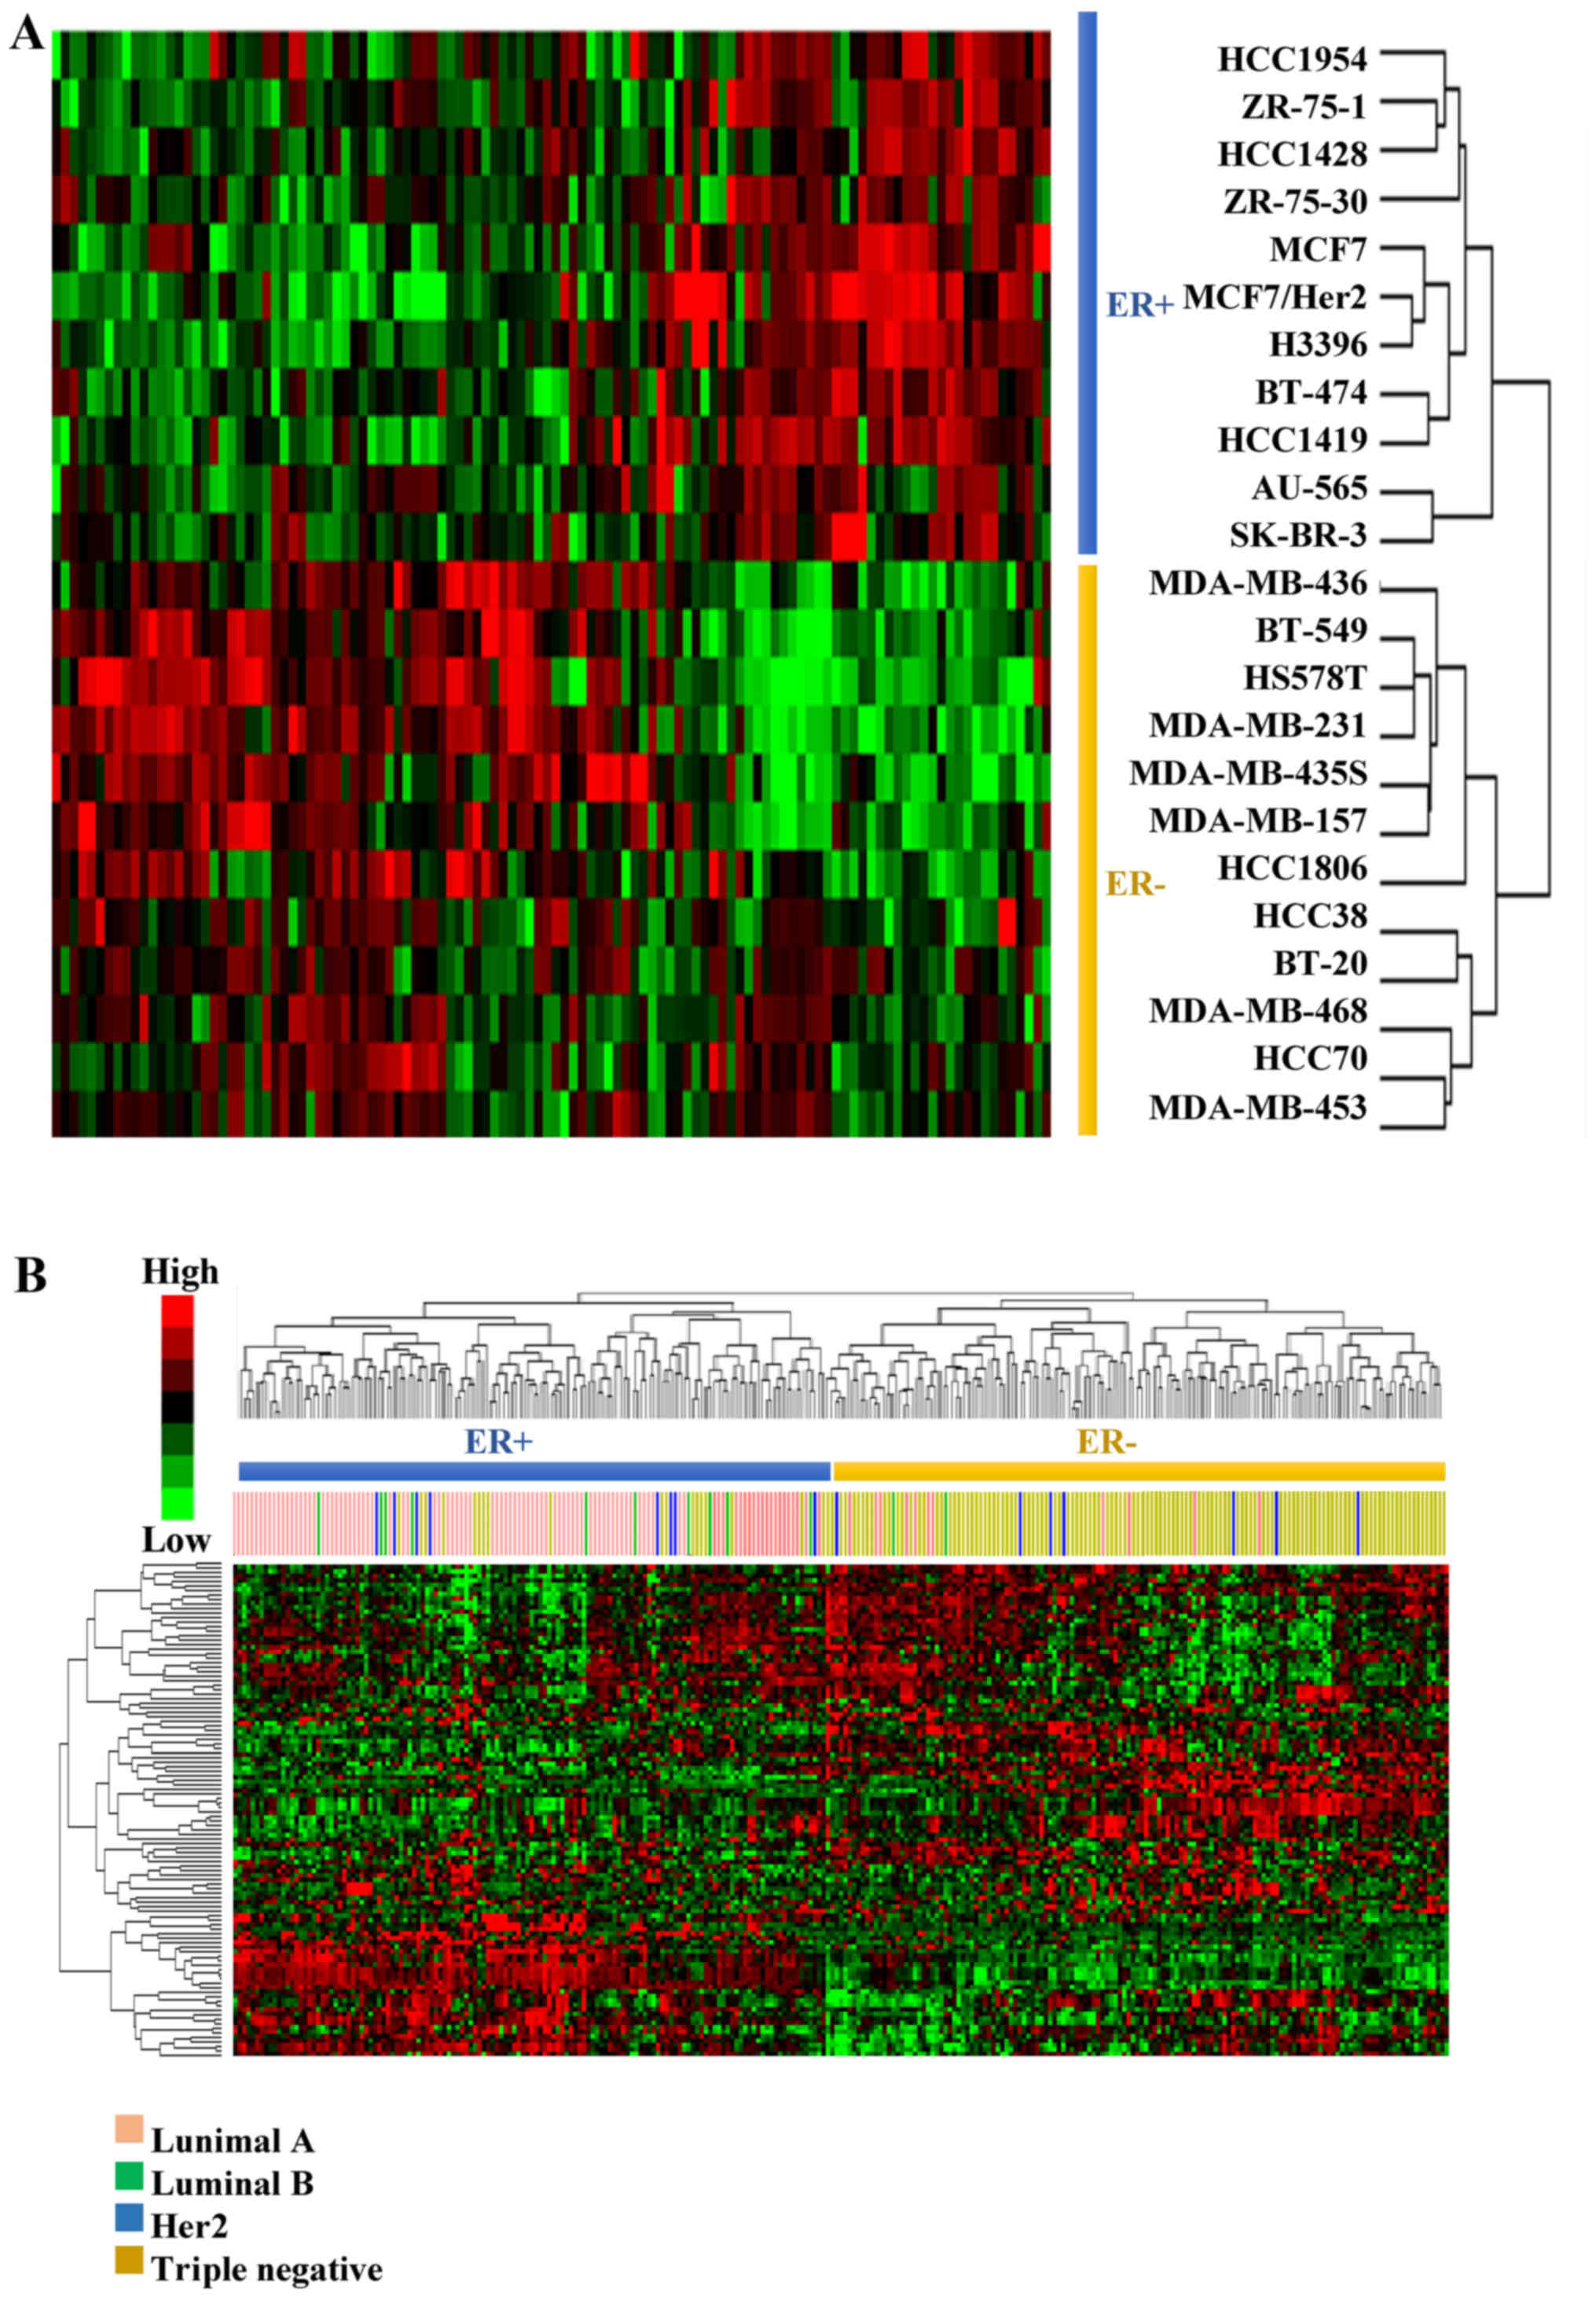
EMS discriminates between the
ER− and ER+ breast cancer cells
In order to validate the postulate that the EMS
represents the basic features of ER− breast cancer cells
(Fig. 1B, step 2), the ability of
EMS to discriminate the ER+ from the ER−
breast cancer cells was assessed by hierarchical clustering with
dataset GSE6569 (18), which
contains gene expression profiles of different breast cancer cell
lines. As a result, all the breast cancer cells were correctly
grouped according to their ER status (Fig. 2A).
The discriminative power of EMS was then validated
in 279 clinical samples from GSE41998 (19), which recorded the ER, the
progesterone receptor (PR) and the human epidermal growth factor
receptor 2 (Her2) status of each patient. The subtypes of breast
cancer patients were analyzed based on their ER, PR and Her2 status
(Table II).
| Table II.Molecular subtypes of breast cancer
patients in GSE41998. |
Table II.
Molecular subtypes of breast cancer
patients in GSE41998.
|
| Summary of
GSE41998 |
| Classification by
EMS |
|---|
|
|
|
|
|
|---|
| Subtypes | Molecular
status | No. | ER+ | ER− |
|---|
| Luminal A | ER+,
PR+, Her2− | n=78 | 72 | 6 |
| (n=111) | ER+,
PR−, Her2− | n=22 | 19 | 3 |
|
| ER−,
PR+, Her2− | n=11 | 5 | 6 |
| Luminal B | ER+,
PR+, Her2+ | n=7 | 7 | 0 |
| (n=12) | ER+,
PR−, Her2+ | n=1 | 1 | 0 |
|
| ER−,
PR+, Her2+ | n=4 | 2 | 2 |
| Her2 (n=15) | ER−,
PR−, Her2+ | n=15 | 8 | 7 |
| TN (n=141) | ER−,
PR−, Her2− | n=141 | 20 | 121 |
The patients were hierarchically clustered based on
their expression of EMS and the results revealed that the EMS
exhibited an ability to discriminate the ER+ patients
(luminal A and B subtypes) from the ER− patients (Her2
and triple-negative subtypes) in the two clusters (Fig. 2B). The accuracy was 91.6% for
ER+ and 79.5% for ER− patients (Table II).
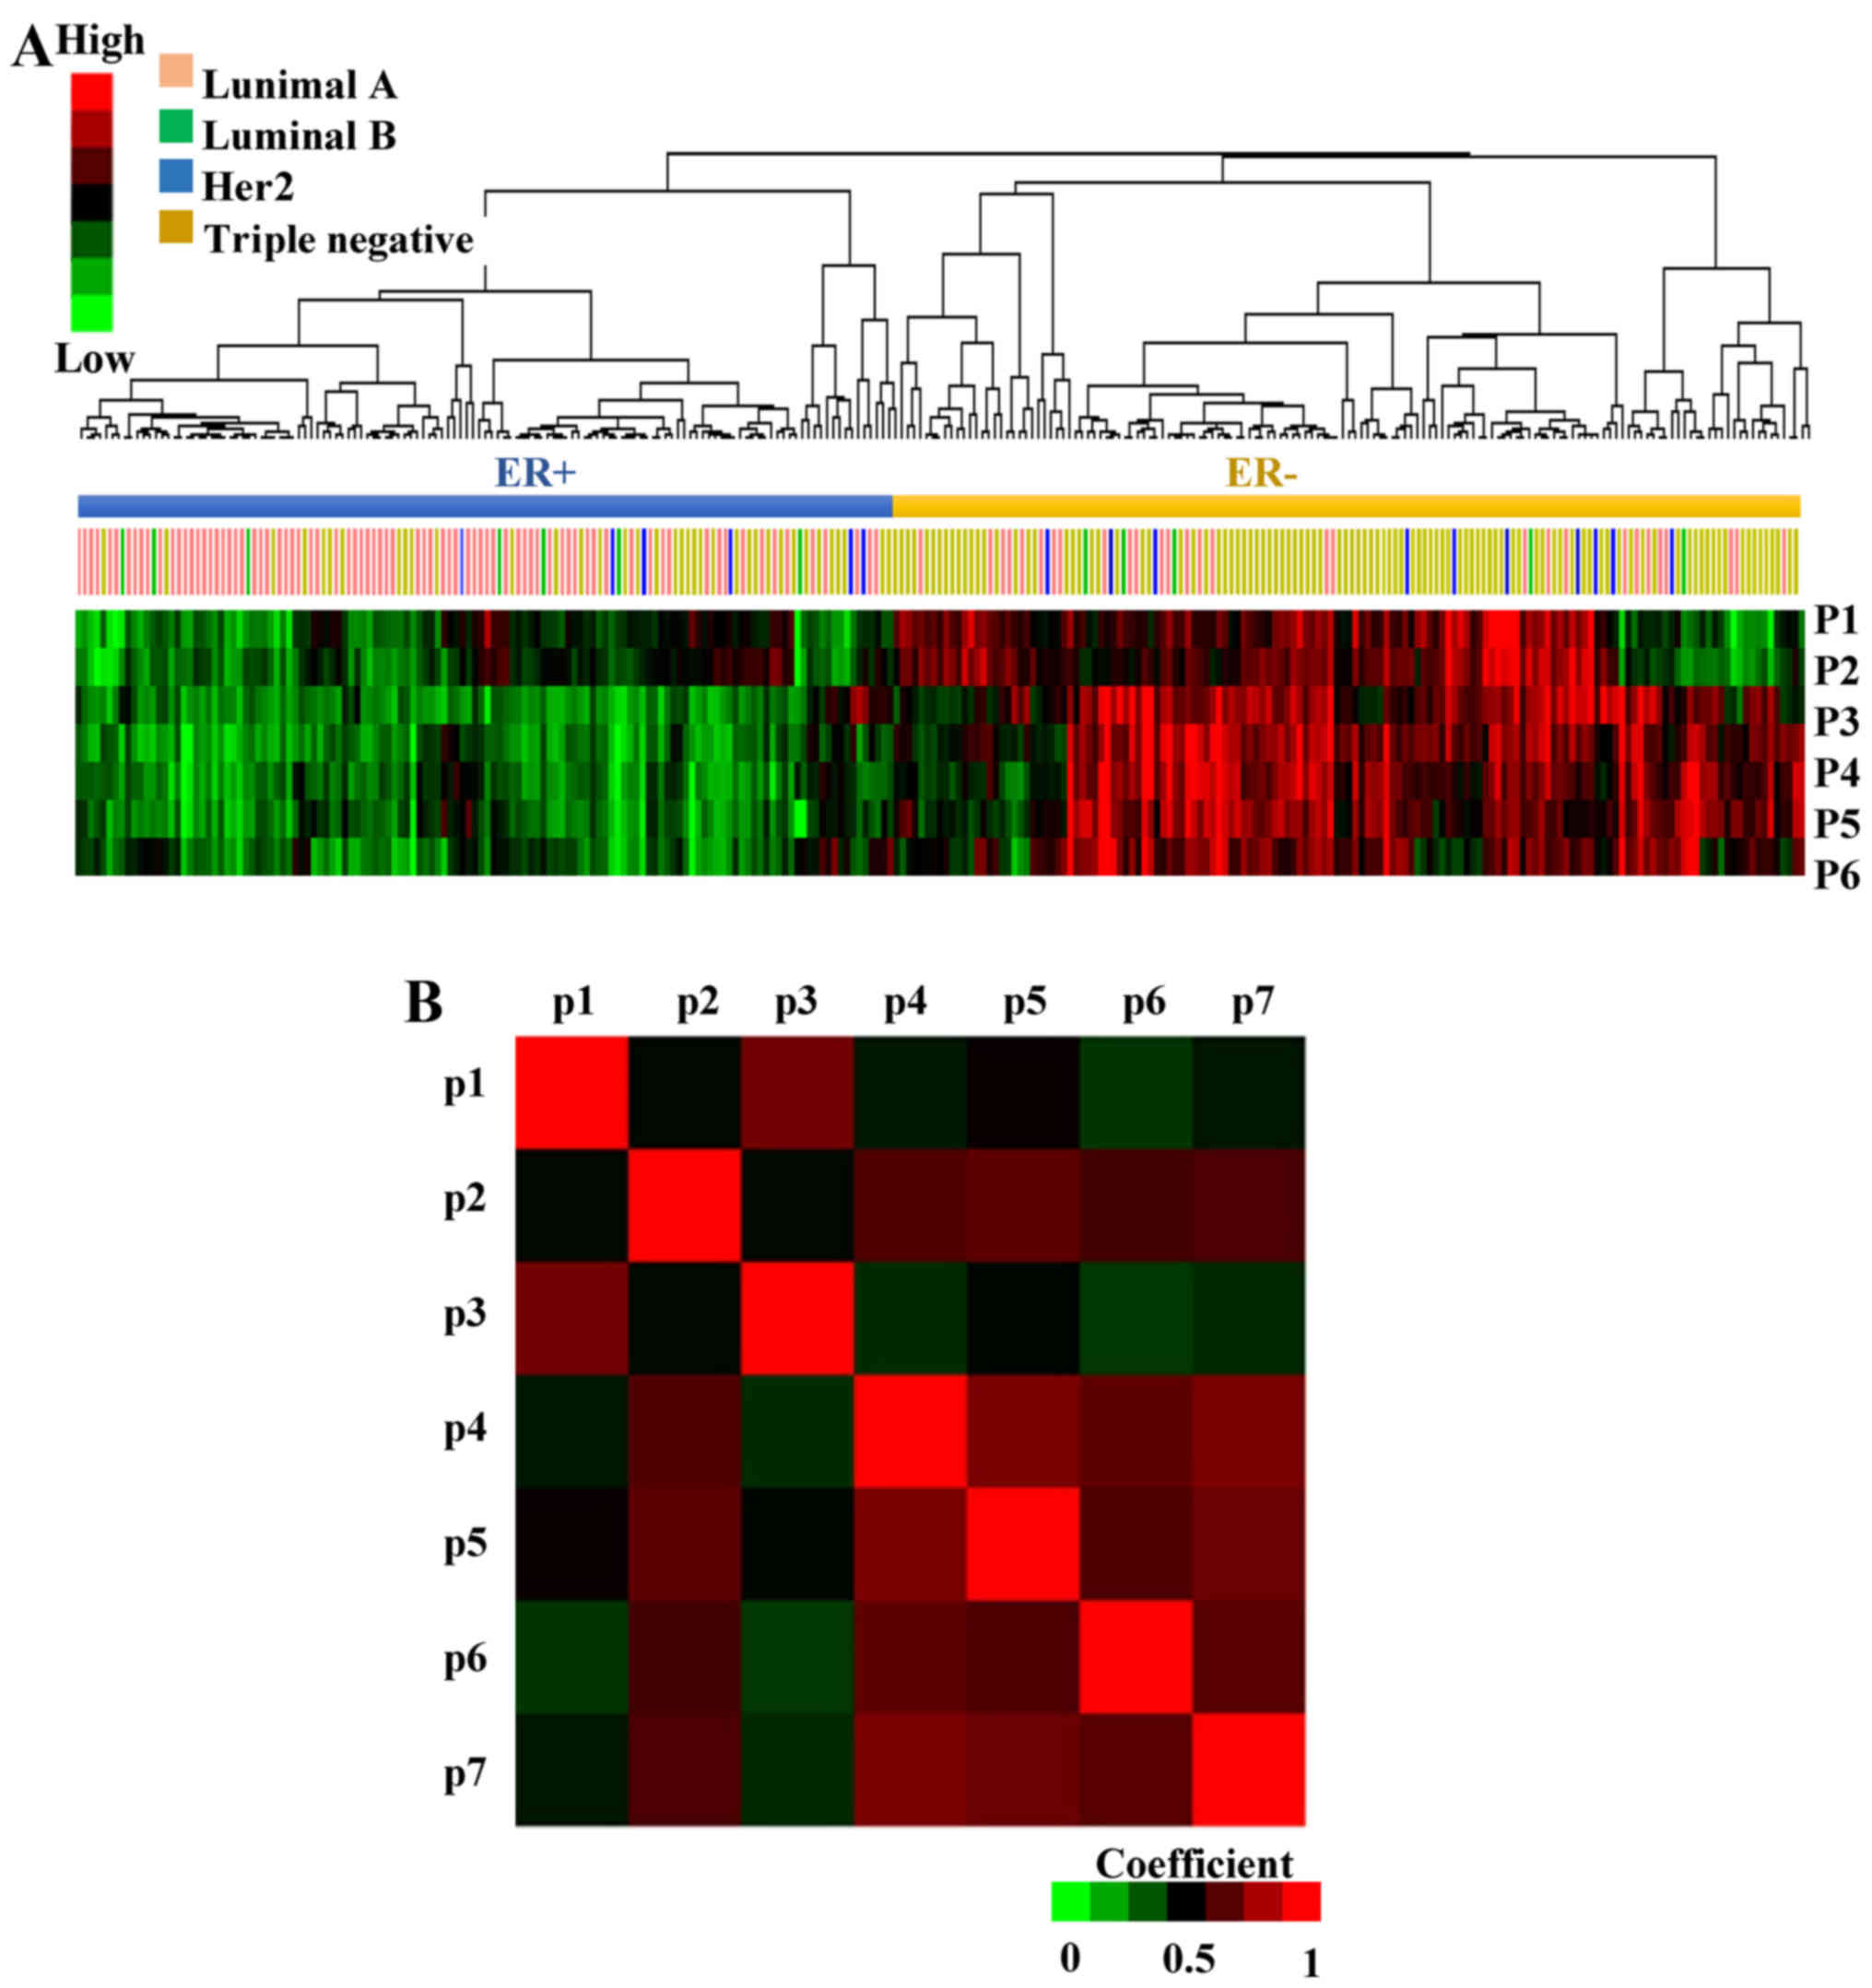
Patterns of pathway activity
characterize ER+ and ER− breast cancers
To interpret the underlying biological significance
of the EMS, its genes were analyzed in KEGG and GO (Fig. 1B, step 3, full list of pathways is
not shown in the present study). Seven pathways that were enriched
in at least three genes were selected: focal adhesion, metabolic
pathways, extracellular matrix (ECM)-receptor interaction, response
to steroid hormone stimulus, cell proliferation, response to
reactive oxygen species and calcium ion binding pathways. Then the
probability of the pathway activity in each patient from GSE41998
was analyzed by multivariate logistic regression, where high
pathway probability correlates with high pathway activity and vice
versa (31). The hierarchical
clustering of the pathway activity in each patient revealed that
most of the ER+ and ER− patients exhibited an
opposite probability of pathway activity (Fig. 3A). The response to steroid hormone
stimulus (p1), metabolic pathways (p2), ECM-receptor interaction
(p3), focal adhesion (p4), cell proliferation (p5), response to
reactive oxygen species (p6) and calcium ion binding pathways (p7)
exhibited higher activity in ER− breast cancer
patients.
In addition to the clusters of samples, patterns of
pathway co-regulation were identified using Pearson's correlation
(Fig. 3B); focal adhesion vs. cell
proliferation (r=0.926), focal adhesion vs. calcium ion binding
pathways (r=0.927) and cell proliferation vs. calcium ion binding
pathways (r=0.876) were highly correlated.
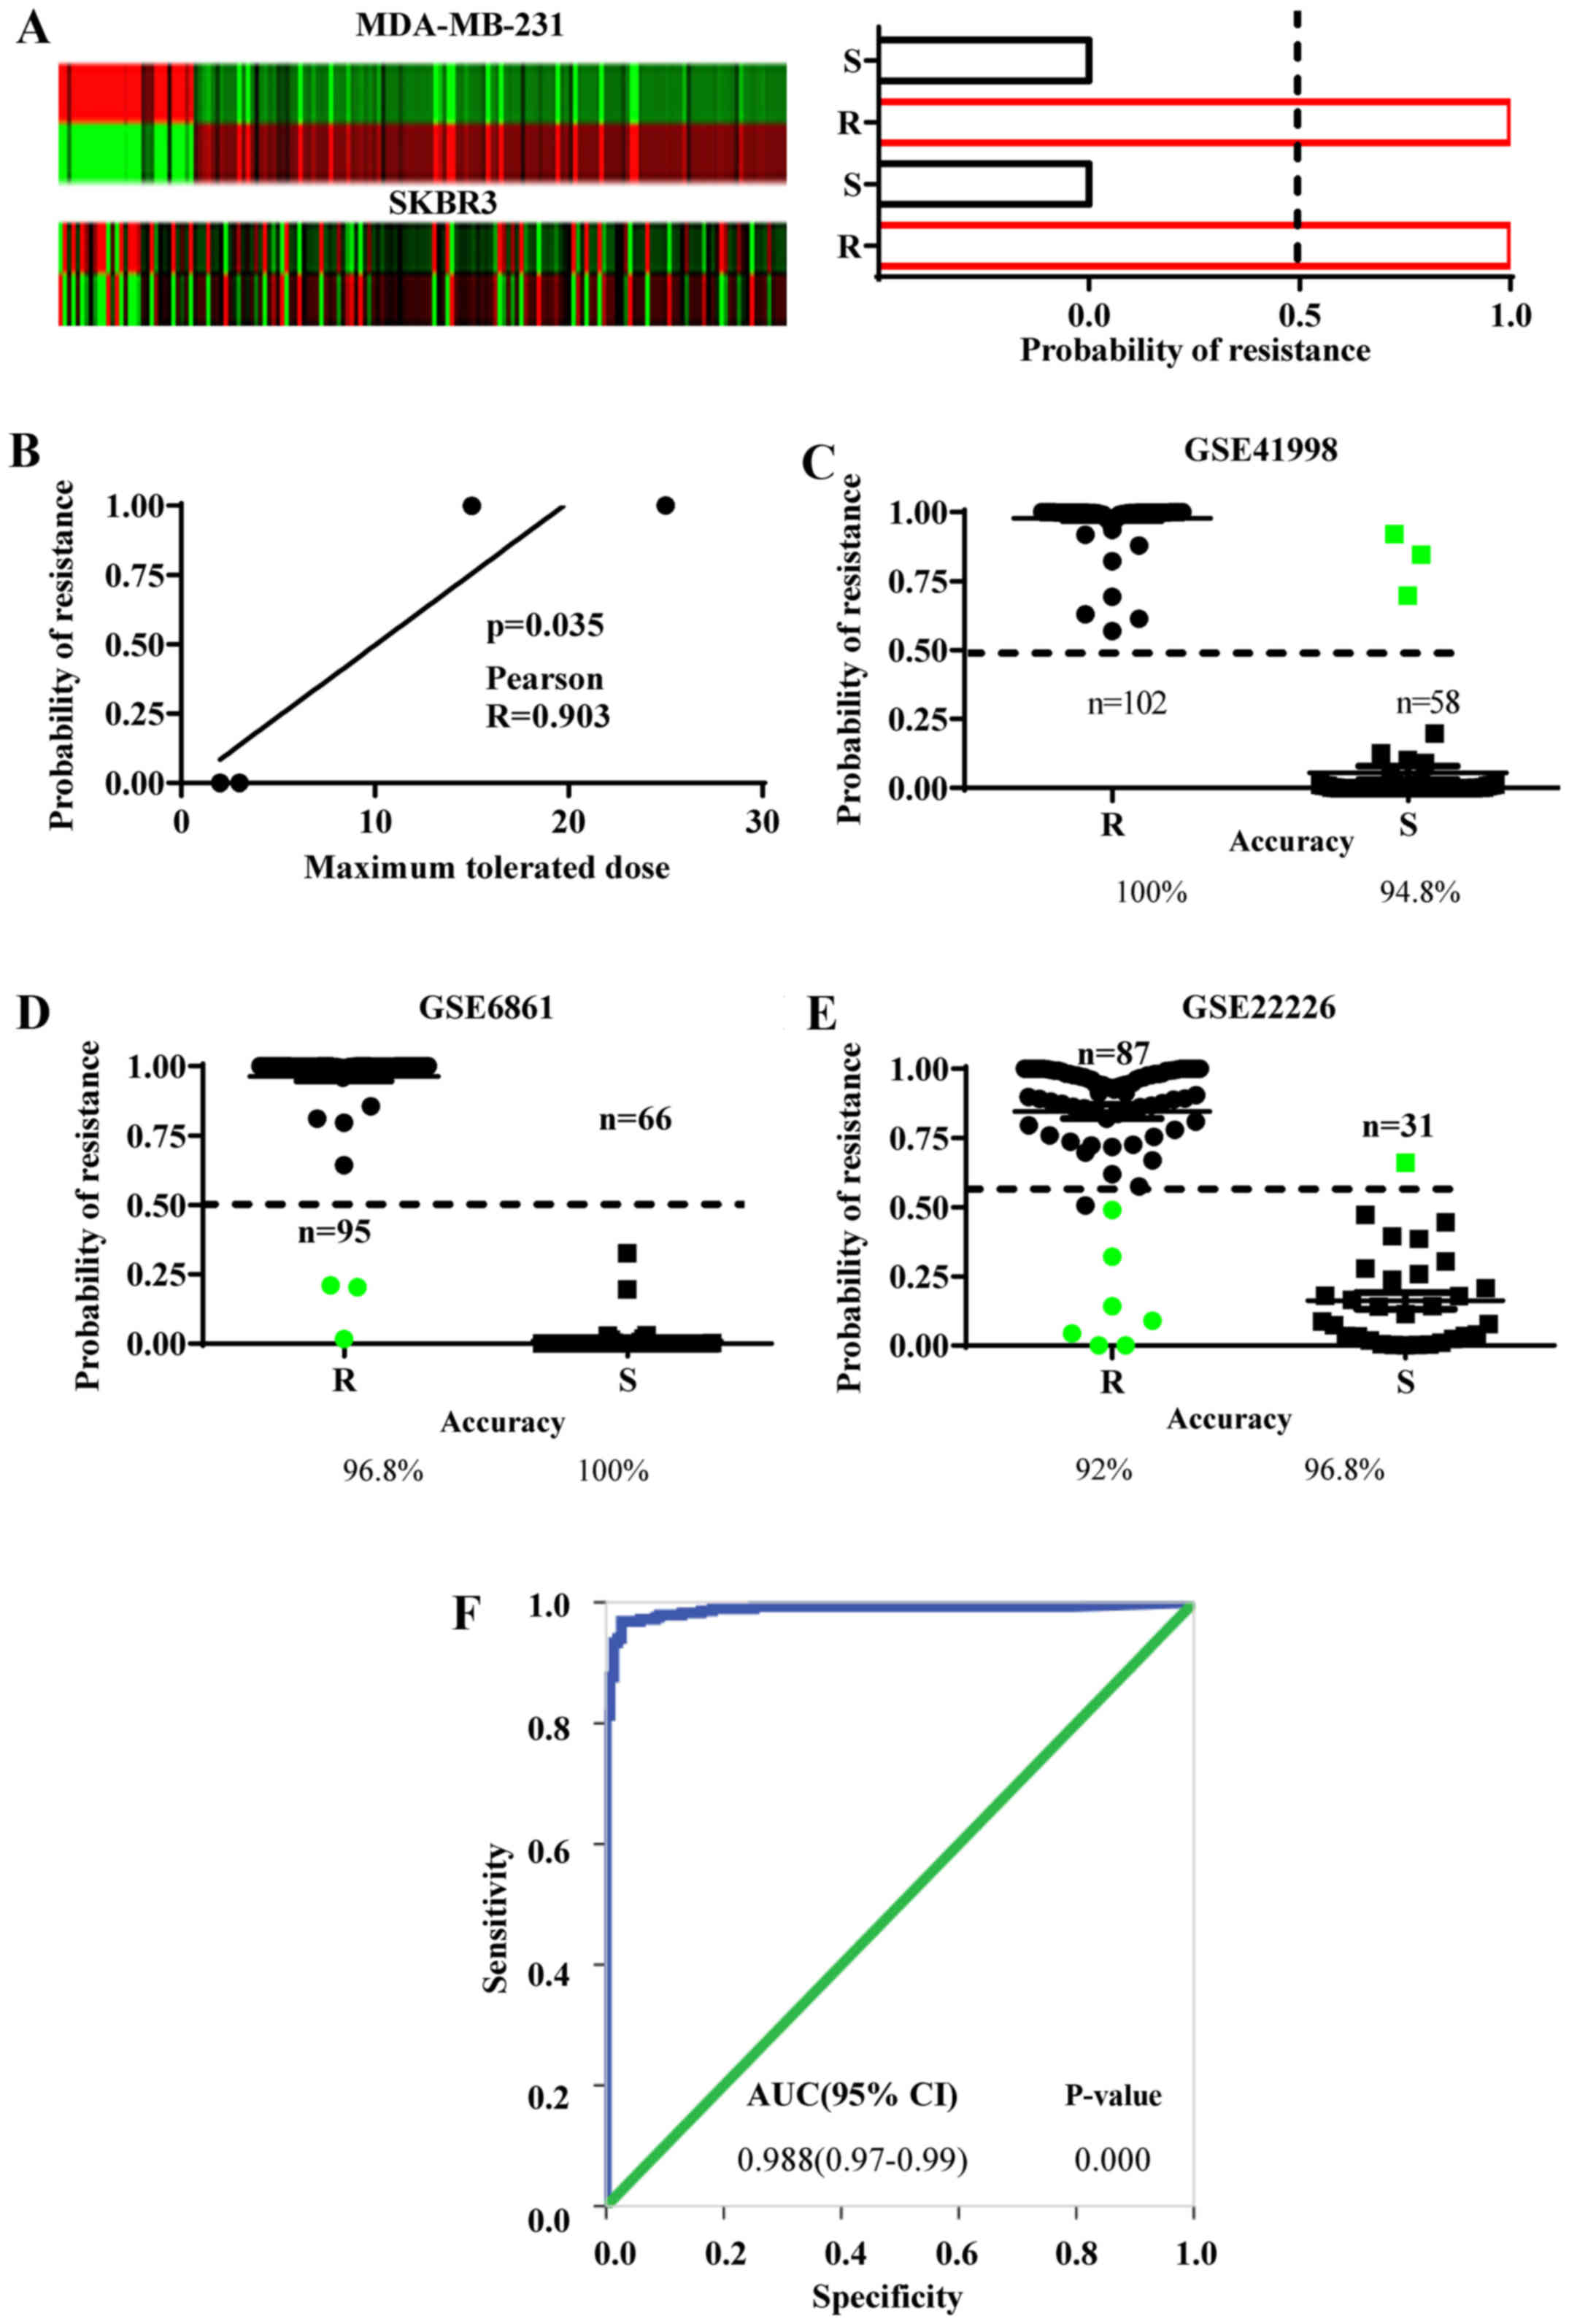
EMS predicts chemoresistant features
in ER− cells
As above-mentioned, we postulated that the EMS
derived from the MCF-7/ADM cells may embed the gene-expression
features of chemoresistance in ER− breast cancer cells
(Fig. 1B, step 4). To examine this
hypothesis, the EMS expression was analyzed in two chemoresistant
ER− cell lines and compared with their chemosensitive
controls (MDA-MB-231 and SKBR3 from GSE54326). This exhibited a
>1.5-fold change in 67.8% of the EMS genes in the MDA-MB-231
cells and 62.5% in the SKBR3 cells (Fig. 4A). Then the EMS gene-expression
values were used to calculate the probability of resistance and
sensitivity in these cells by Bayesian binary regression analysis.
As a result, both chemoresistant lines yielded 100% probability of
chemoresistance, while both chemosensitive lines showed 0%
probability of chemoresistance (Fig.
4A). Furthermore, the accuracy of probability of
chemoresistance in these cells was evaluated with the maximum
tolerated doses provided by the GSE54326 regardless of the cell
types. The results revealed that the higher probabilities of
chemoresistance were positively correlated with the maximum
tolerated doses for the cells that were analyzed by Pearson's
correlation assay (Fig. 4B).
However, we need to point out that the sample size used in this
study is small and although the probability of chemoresistance
demonstrates a correlation with the tolerable doses of the cell
lines, further studies with more chemoresistant or sensitive cell
lines are required to calculate more accurately the Pearson's
correlation coefficience. Collectively, these results strongly
indicate that EMS can efficiently discriminate chemoresistant and
sensitive ER− breast cancer cell lines.
To identify the chemoresistant cases among the
ER− breast cancer population, the EMS was validated in
clinical samples from the NCT00455533 phase II trial (GSE41998)
(19), the EORTC 10994 phase III
trial (GSE6861) (20) and the I-SPY
1 trial (GSE22226) (21). Biopsy
specimens from these datasets were collected before any systematic
treatment. Subsequently, the patients underwent anthracycline-based
chemotherapy. A pathologically complete response to chemotherapy
was defined as chemosensitive and residual disease was defined as
chemoresistant. The Bayesian binary regression was used to develop
a model that differentiates a pattern of anthracycline sensitivity
from that of resistance based on the EMS expression. In all three
datasets, the EMS demonstrated the ability to discriminate the
chemoresistant from the chemosensitive patients. The overall
accuracy in predicting chemoresistance was 96.27% (EMS sensitivity)
and chemosensitivity was 97.2% (EMS specificity) (Fig. 4C-E).
The discriminative ability of EMS was also reflected
in the ROC curve, which is an important index of the accuracy of a
clinical test. The resistant and sensitive cases defined by the EMS
in all three groups were analyzed by ROC curves and the
corresponding AUC was 0.988 (Fig.
4F), suggesting that the EMS is good at discriminating both
chemoresistant and chemosensitive patients.
Prognosis can be estimated by EMS
Since chemoresponse is important for determining the
survival status of a patient, the EMS may also predict the
prognosis of ER− breast cancer patients receiving
chemotherapy (Fig. 1B, step 5).
Therefore, the ability of EMS to estimate prognosis was assessed in
four independent datasets containing both ER+ and
ER− breast cancer patients, from which ER−
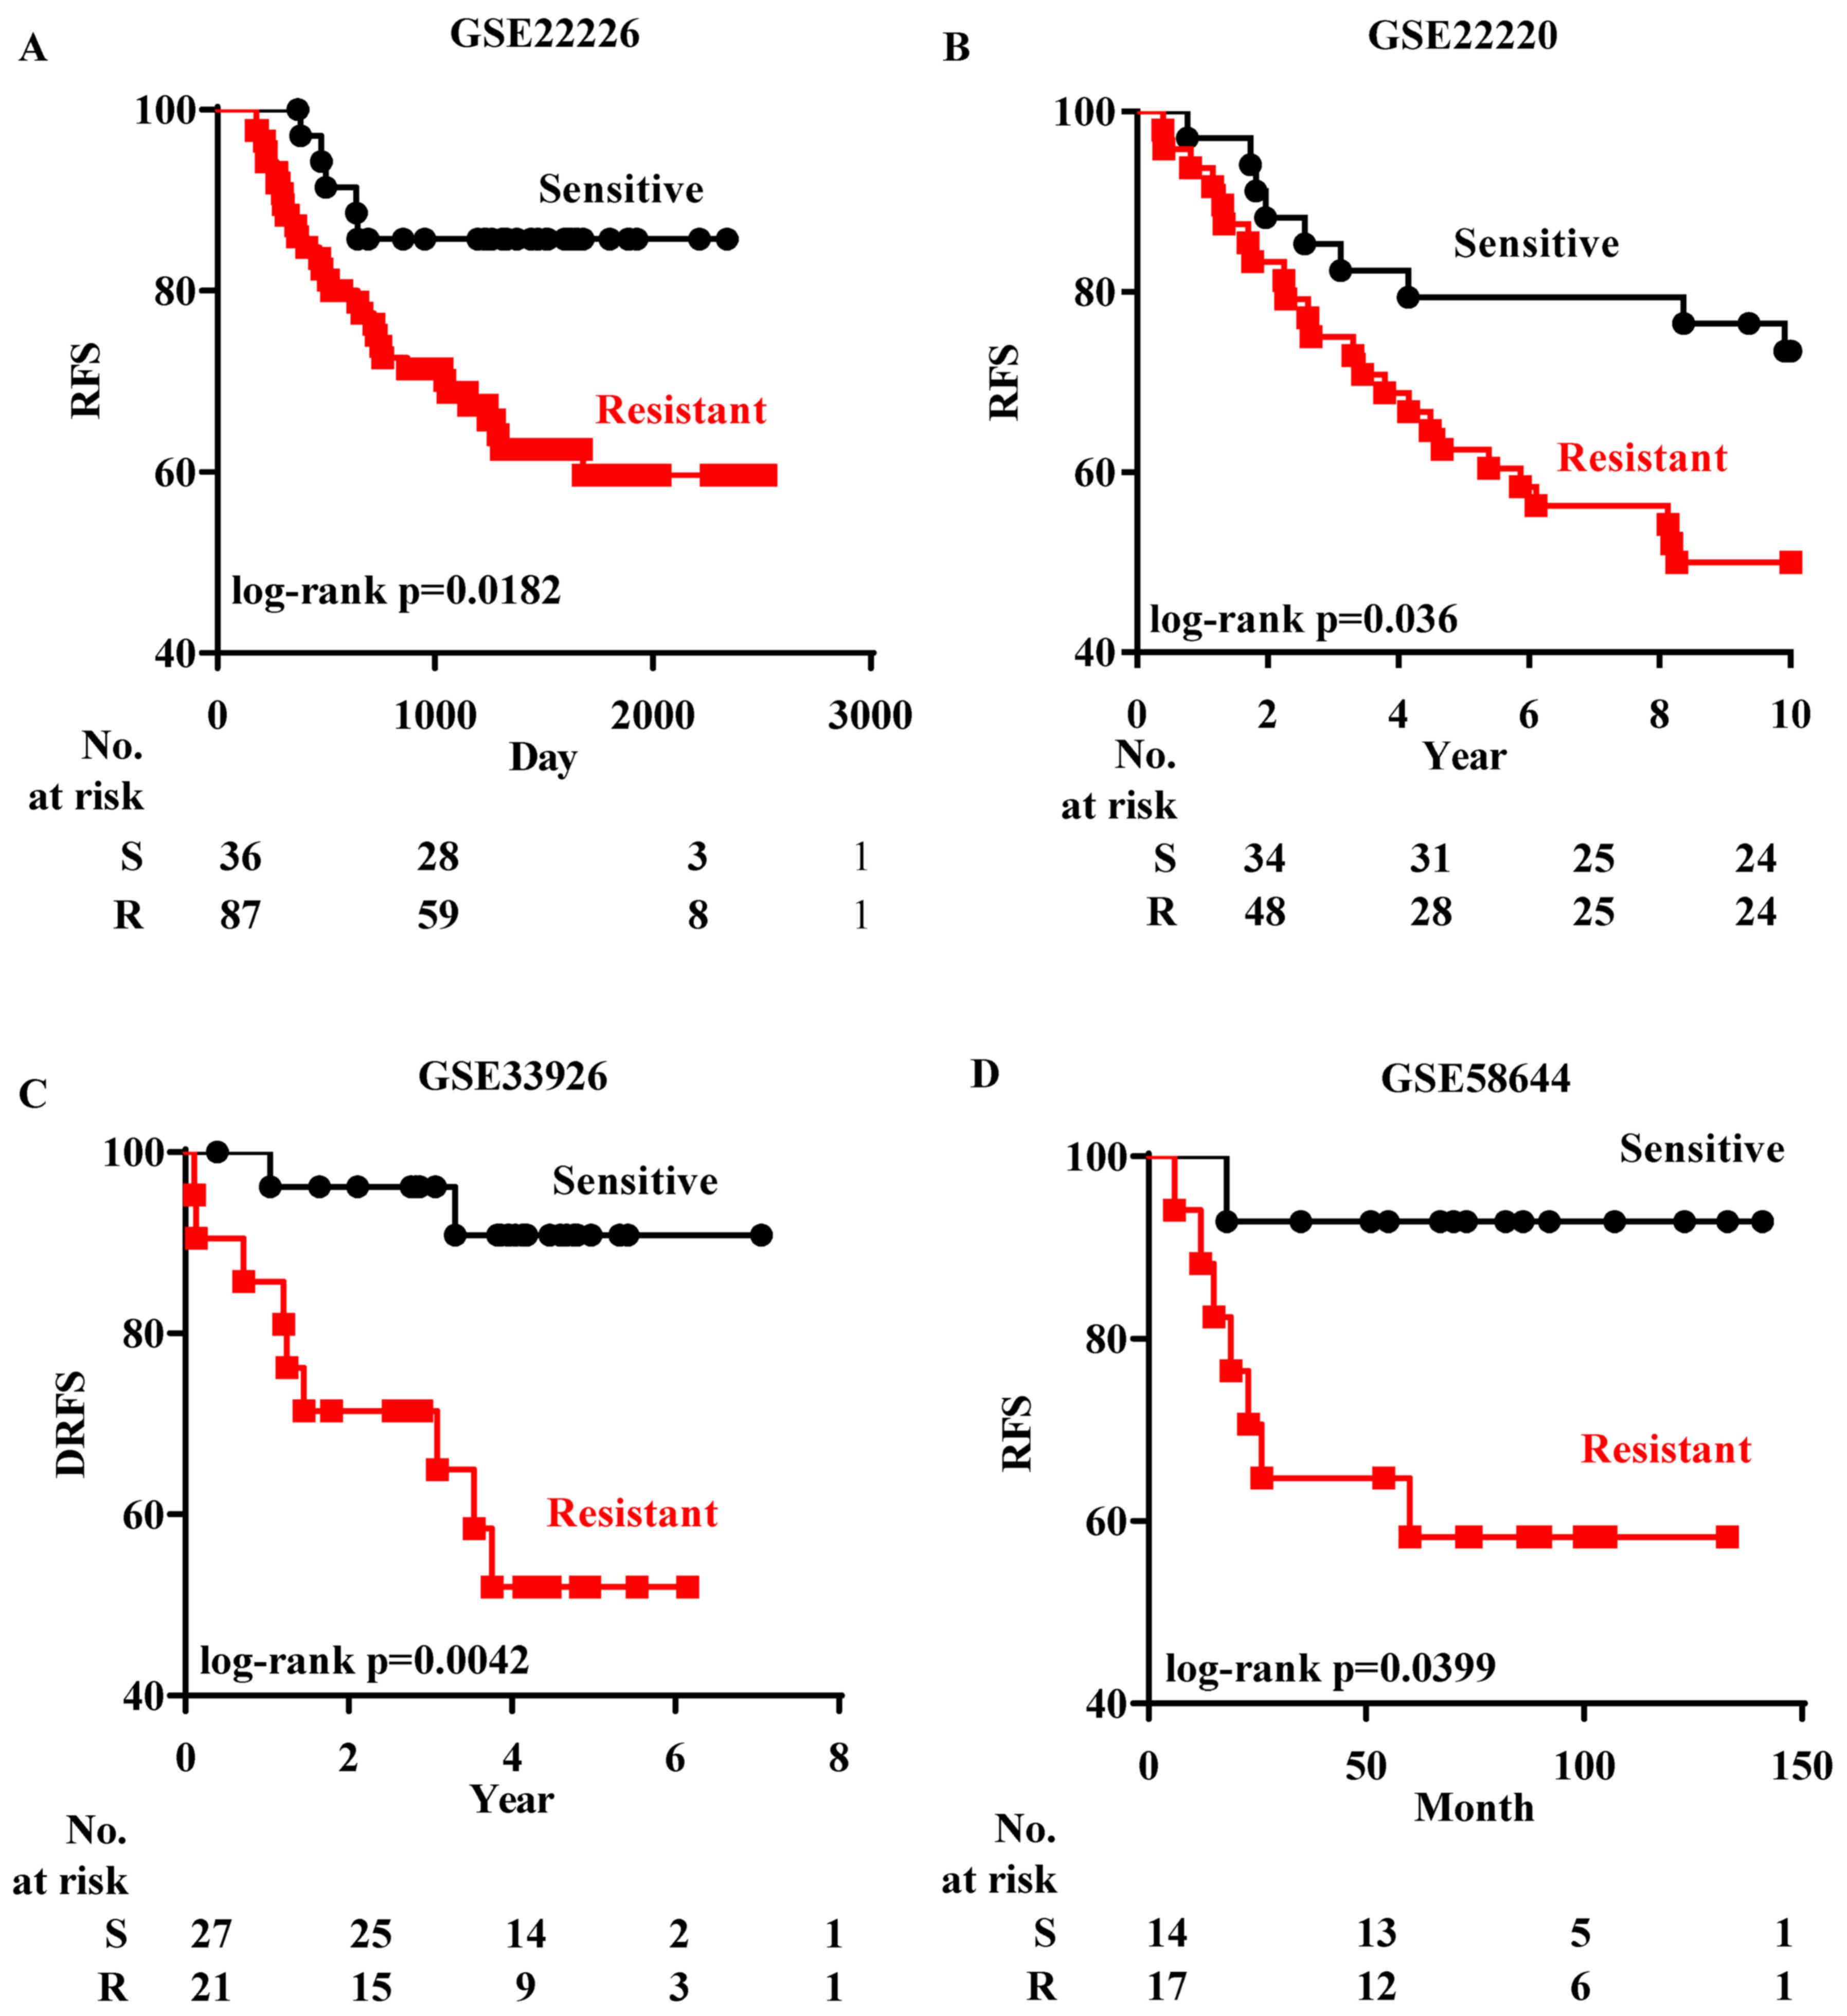
patients were chosen for analysis. Firstly we analyzed GSE22226
(21), which records both the
chemoresponse and the RFS status of each ER− patient.
After the patients in GSE22226 were grouped according to their
chemoresponse predicted by EMS, the Kaplan-Meier analysis revealed
that those ER− patients who were predicted to be
chemoresistant had a lower rate of RFS than the patients predicted
to be chemosensitive (Fig. 5A).
Subsequently the prognostic test of EMS in
ER− patients was performed in three datasets [GSE22220
(22), GSE33926 (23) and GSE58644 (24)]. ER− patients in these
datasets received different regimes of chemotherapy and their DRFS
or RFS were recorded. Since there was no information on the
chemoresponse in these patients, the Bayesian assay could not be
performed without predetermined data to train the regression
process. Instead, based on the EMS expression, patients were
firstly classified into two groups by k-means clustering and their
chemoresponse was determined by calculating the correlation with
chemoresistant ER− cells in GSE54326. ER−
patients who were predicted to be chemoresistant also had a lower
RFS rate (Fig. 5B-D).
Subsequenlty a meta-analysis was performed to
combine the results from prognosis analysis in the above-mentioned
datasets. The ORs for death events were calculated and the forest
plots revealed that the average ORs for ER− patients
predicted to be chemoresistant were >1 in each dataset (Fig. 5E). In addition, the overall OR for
ER− patients predicted to be chemoresistant was 3.22,
indicating that these EMS-defined chemoresistant ER−
patients had a significantly lower probability of survival.
Finally, the prognostic ability of EMS was validated
in two cohorts, in which the patients did not receive chemotherapy
after surgery [GSE7390 (25) and
GSE45725 (26)]. Although the
EMS-predicted chemoresistant patients exhibited lower RFS and DRFS
ratios, the differences were not significant in GSE7390 (Fig. 5F).
Discussion
Switching from ER+ to ER−
status is a way for cancer cells to cope with cytotoxic stress.
However the subsequent ER− cells are not simply the same
as primary ER− cells and may be more aggressive in the
process of adapting to severe circumstances. Therefore,
investigating the changes in gene expression patterns may provide a
list of genes associated with a more malignant phenotype in
ER− cancer cells. In the present study, we aimed to
identify gene expression changes during both ER-loss and
chemoresistance-gain in breast cancer cells.
Firstly we found 105 genes in EMS by cross-matching
two pairs of breast cancer cell lines with ER-loss (GSE68815 and
GSE27473). By comparison with ER+ breast cancer cells,
the EMS reflected the basic features of ER− cells both
in different breast cancer cell lines and clinical samples because
they significantly changed during the disappearance of ER. The
expression of 51 genes among the 105 genes, was significantly
increased and these genes may be activated to complement the ER
function and may be important for inducing new features of
ER− cells, such as chemoresistance. Therefore, they
provide new targets for treating breast cancer after ER-loss. For
example, BCAT1 was one of the most markedly increased genes in
ER− cells from both GSE68815 and GSE27473. BCAT1
promotes the proliferation and metastasis of cancer cells (32,33),
therefore inhibiting it may decrease the malignant features of
ER− cancer cells. On the other hand, the expression of
54 genes was significantly decreased, suggesting that ER may depend
on these genes to mediate breast cancer signaling in ER+
breast cancers. For example, PBX1 was one of the most markedly
decreased genes in ER− cells. PBX1 is essential for the
ERα-mediated transcriptional response and promotes aggressiveness
in breast cancers (34). Therefore,
PBX1 and other genes in the 54-gene list provide new targets for
treating ER+ breast cancers.
ER− breast cancers are more frequently
high grade and have worse prognosis compared with ER+
breast cancers, although there is still a group of ER−
patients who have good clinical outcome within the ER−
population. The EMS was enriched in the KEGG and GO pathways,
therefore giving a summary of the signaling pathways both essential
in the ER+/ER− transition and the
ER− cell malignant transition, which included
development of chemoresistance. Changes in focal adhesion and
ECM-receptor interaction pathways enable cancer cells to
communicate with ECM and gain high motility, thus ER−
cells are more aggressive and metastasize more easily, enabling
them to escape from toxic niches (35). Changes in the response to reactive
oxygen species also induce cancer progression, metastasis and
changes in drug metabolism (36).
In addition the cell proliferation and calcium ion binding pathways
could not only promote cancer cells to adapt to new signaling
pathways to survive during ER loss, but also help the malignant
ER− cells to endure cytotoxic therapies and become
highly metastatic (37,38). Therefore, in the present study we
provided a link between the predicted pathway activity and the ER
transition-induced genomic changes and emphasized several essential
pathways that can form the basis for the rational design of
therapeutic regimes for breast cancer patients with ER-loss after a
first-round failure of therapy.
Subsequently the Pearson's correlation between each
pathway during the ER transition was calculated and the focal
adhesion, the calcium ion binding pathways and the cell
proliferation revealed significantly high correlations with each
other. This result highlighted a network that, during ER-loss and
the malignant transition of breast cancer cells, endows them with
high motility and invasiveness by changing the focal adhesion
pathway, however they must preserve high viability via the calcium
ion binding and the cell proliferation pathways to avoid such
factors as anoikis, immune surveillance and chemotherapeutic
toxicity. In addition, in the absence of ER-related cell survival
signaling (39) to maintain
proliferation, cancer cells need high motility in order to escape
from the disadvantageous microenvironment during therapies such as
anti-hormone and chemotherapeutic regimes.
Furthermore, since the EMS was developed based on
chemoresistant ER− breast cancer MCF-7/ADM cells, the
genes in the EMS are likely to be required for the development of
chemoresistance. We revealed that the EMS discriminated the
chemoresistant from the chemosensitive ER− breast cancer
cell lines MDA-MB-231 and SKBR3 and we expect further studies to
elucidate the discriminative power of EMS in more ER−
breast cancer cell lines. These studies will not only help to
determine the chemoresponse of one ER− breast cancer
cell line with its gene expression profile, but also provide
information about the tolerable doses of the cells, if the accurate
correlation coefficience between probabilities of chemoresistance
and maximum tolerated dose is calculated. Subsequently, we
demonstrated the ability of EMS to predict chemoresistance in
patients treated with anthracycline-based chemotherapies, which is
one of the most widely used regimes for ER− breast
cancer patients (40). We selected
these datasets as the MCF-7/ADM cells confronted the challenge from
an anthracycline agent (ADM) to develop chemoresistance, thus
anthracycline-treated patients may share similar chemoresistant
signaling pathways. Furthermore, the biopsy specimens in these
datasets were collected before any systematic treatment and their
gene expression profiles were analyzed by microarray, thus if the
EMS is validated in a larger sample size in the future, it may help
in the clinical choice of chemotherapeutic regimes. In addition,
the Her2 and TNBC are two distinct subgroups in ER−
breast cancers and show different chemoresponses and clinical
outcomes. In the present study, we lacked an efficient number of
Her2 patients and could not conclude whether the EMS-related
chemoresistance correlates with these two subgroups. However, in
future studies, more clinical samples can be collected to
demonstrate this correlation.
In addition, related to the ability of EMS to
predict the chemoresponse, the prognosis of anthracycline-treated
ER− patients could be estimated by the EMS. We also
examined the prognostic power of EMS in ER− breast
cancer patients treated with different chemotherapeutic regimes but
without anthracycline agents and observed that it is effective in
estimating the prognosis of these ER− patients. Such
good discriminative capacity of the signature to different
chemotherapeutic regimes in ER− patients may be due to
the MCF-7/ADM cells exhibiting features of resistance to different
types of chemotherapeutic agents (13), therefore the EMS derived from them
may involve mechanisms of resistance common to other agents.
Indeed, in the enriched GO and KEGG of EMS, pathways shared by
chemoresistance of different types of chemotherapeutic agents were
significantly enriched, including mechanisms such as overexpression
of p-glycoprotein (41,42) and glutathione S-transferase P1
(44) and activation of the
epithelial-mesenchymal transition pathway (44,45).
Therefore, the genes in EMS may also provide a basis for finding
important mechanisms of chemoresistance and related factors that
affect prognosis.
Finally, to assess whether EMS could estimate the
prognosis for ER− breast cancers that are intrinsically
more aggressive, regardless of therapy, we examined the impact of
EMS on RFS and DRFS in two datasets where the patients did not
receive either chemotherapy or hormonal therapy. The EMS could not
separate a good from a bad prognosis at a significant level,
indicating that it is predictive of treatment response rather than
prognostic of survival.
In conclusion, in the present study we developed a
gene expression signature that can identify subgroups of
ER− breast cancer cells that are chemoresistant.
Acknowledgements
The present study was supported by grants from the
National Natural Science Foundation of China (no. 31200126), the
Natural Science Foundation of Jiangsu Province (BK20141109) and the
Natural Science Foundation for Distinguished Young Scholars of
Jiangsu Province (BK20140004). We would like to thank Dr I.C. Bruce
for reading the manuscript.
References
|
1
|
Berry DA, Cronin KA, Plevritis SK, Fryback
DG, Clarke L, Zelen M, Mandelblatt JS, Yakovlev AY, Habbema JD and
Feuer EJ: Cancer Intervention and Surveillance Modeling Network
(CISNET) Collaborators: Effect of screening and adjuvant therapy on
mortality from breast cancer. N Engl J Med. 353:1784–1792. 2005.
View Article : Google Scholar : PubMed/NCBI
|
|
2
|
Johnston SR: New strategies in estrogen
receptor-positive breast cancer. Clinical Cancer Res. 16:1979–1987.
2010. View Article : Google Scholar
|
|
3
|
Lo S and Johnston SR: Novel systemic
therapies for breast cancer. Surg Oncol. 12:277–287. 2003.
View Article : Google Scholar : PubMed/NCBI
|
|
4
|
Gutierrez MC, Detre S, Johnston S, Mohsin
SK, Shou J, Allred DC, Schiff R, Osborne CK and Dowsett M:
Molecular changes in tamoxifen-resistant breast cancer:
Relationship between estrogen receptor, HER-2, and p38
mitogen-activated protein kinase. J Clin Oncol. 23:2469–2476. 2005.
View Article : Google Scholar : PubMed/NCBI
|
|
5
|
Lee SH, Chung MA, Quddus MR, Steinhoff MM
and Cady B: The effect of neoadjuvant chemotherapy on estrogen and
progesterone receptor expression and hormone receptor status in
breast cancer. Am J Surg. 186:348–350. 2003. View Article : Google Scholar : PubMed/NCBI
|
|
6
|
Yang X, Phillips DL, Ferguson AT, Nelson
WG, Herman JG and Davidson NE: Synergistic activation of functional
estrogen receptor (ER)-alpha by DNA methyltransferase and histone
deacetylase inhibition in human ER-alpha-negative breast cancer
cells. Cancer Res. 61:7025–7029. 2001.PubMed/NCBI
|
|
7
|
Kuukasjärvi T, Kononen J, Helin H, Holli K
and Isola J: Loss of estrogen receptor in recurrent breast cancer
is associated with poor response to endocrine therapy. J Clin
Oncol. 14:2584–2589. 1996. View Article : Google Scholar : PubMed/NCBI
|
|
8
|
Won HY, Lee JY, Shin DH, Park JH, Nam JS,
Kim HC and Kong G: Loss of Mel-18 enhances breast cancer stem cell
activity and tumorigenicity through activating Notch signaling
mediated by the Wnt/TCF pathway. FASEB J. 26:5002–5013. 2012.
View Article : Google Scholar : PubMed/NCBI
|
|
9
|
Gruvberger S, Ringnér M, Chen Y, Panavally
S, Saal LH, Borg A, Fernö M, Peterson C and Meltzer PS: Estrogen
receptor status in breast cancer is associated with remarkably
distinct gene expression patterns. Cancer Res. 61:5979–5984.
2001.PubMed/NCBI
|
|
10
|
Niemeier LA, Dabbs DJ, Beriwal S, Striebel
JM and Bhargava R: Androgen receptor in breast cancer: Expression
in estrogen receptor-positive tumors and in estrogen
receptor-negative tumors with apocrine differentiation. Mod Pathol.
23:205–212. 2010. View Article : Google Scholar : PubMed/NCBI
|
|
11
|
Al Saleh S, Al Mulla F and Luqmani YA:
Estrogen receptor silencing induces epithelial to mesenchymal
transition in human breast cancer cells. PLoS One. 6:e206102011.
View Article : Google Scholar : PubMed/NCBI
|
|
12
|
Luqmani YA, Al Azmi A, Al Bader M, Abraham
G and El Zawahri M: Modification of gene expression induced by
siRNA targeting of estrogen receptor alpha in MCF7 human breast
cancer cells. Int J Oncol. 34:231–242. 2009.PubMed/NCBI
|
|
13
|
Ma X, Cai Y, He D, Zou C, Zhang P, Lo CY,
Xu Z, Chan FL, Yu S, Chen Y, et al: Transient receptor potential
channel TRPC5 is essential for P-glycoprotein induction in
drug-resistant cancer cells. Proc Natl Acad Sci USA.
109:16282–16287. 2012. View Article : Google Scholar : PubMed/NCBI
|
|
14
|
Ma X, Chen Z, Hua D, He D, Wang L, Zhang
P, Wang J, Cai Y, Gao C, Zhang X, et al: Essential role for
TrpC5-containing extracellular vesicles in breast cancer with
chemotherapeutic resistance. Proc Natl Acad Sci USA. 111:6389–6394.
2014. View Article : Google Scholar : PubMed/NCBI
|
|
15
|
He DX, Gu XT, Jiang L, Jin J and Ma X: A
methylation-based regulatory network for microRNA 320a in
chemoresistant breast cancer. Mol Pharmacol. 86:536–547. 2014.
View Article : Google Scholar : PubMed/NCBI
|
|
16
|
He DX, Gu XT, Li YR, Jiang L, Jin J and Ma
X: Methylation-regulated miRNA-149 modulates chemoresistance by
targeting NDST1 in human breast cancer. FEBS J. 281:4718–4730.
2014. View Article : Google Scholar : PubMed/NCBI
|
|
17
|
Jiang L, He D, Yang D, Chen Z, Pan Q, Mao
A, Cai Y, Li X, Xing H, Shi M, et al: MiR-489 regulates
chemoresistance in breast cancer via epithelial mesenchymal
transition pathway. FEBS Lett. 588:200920152014. View Article : Google Scholar : PubMed/NCBI
|
|
18
|
Huang F, Reeves K, Han X, Fairchild C,
Platero S, Wong TW, Lee F, Shaw P and Clark E: Identification of
candidate molecular markers predicting sensitivity in solid tumors
to dasatinib: Rationale for patient selection. Cancer Res.
67:2226–2238. 2007. View Article : Google Scholar : PubMed/NCBI
|
|
19
|
Horak CE, Pusztai L, Xing G, Trifan OC,
Saura C, Tseng LM, Chan S, Welcher R and Liu D: Biomarker analysis
of neoadjuvant doxorubicin/cyclophosphamide followed by ixabepilone
or Paclitaxel in early-stage breast cancer. Clin Cancer Res.
19:1587–1595. 2013. View Article : Google Scholar : PubMed/NCBI
|
|
20
|
Bonnefoi H, Potti A, Delorenzi M, Mauriac
L, Campone M, Tubiana-Hulin M, Petit T, Rouanet P, Jassem J, Blot
E, et al: Retraction - Validation of gene signatures that predict
the response of breast cancer to neoadjuvant chemotherapy: A
substudy of the EORTC 10994/BIG 00–01 clinical trial. Lancet Oncol.
12:1162011. View Article : Google Scholar : PubMed/NCBI
|
|
21
|
Esserman LJ, Berry DA, Cheang MC, Yau C,
Perou CM, Carey L, DeMichele A, Gray JW, Conway-Dorsey K, Lenburg
ME, et al: I-SPY 1 TRIAL Investigators: Chemotherapy response and
recurrence-free survival in neoadjuvant breast cancer depends on
biomarker profiles: Results from the I-SPY 1 TRIAL (CALGB
150007/150012; ACRIN 6657). Breast Cancer Res Treat. 132:1049–1062.
2012. View Article : Google Scholar : PubMed/NCBI
|
|
22
|
Buffa FM, Camps C, Winchester L, Snell CE,
Gee HE, Sheldon H, Taylor M, Harris AL and Ragoussis J:
microRNA-associated progression pathways and potential therapeutic
targets identified by integrated mRNA and microRNA expression
profiling in breast cancer. Cancer Res. 71:5635–5645. 2011.
View Article : Google Scholar : PubMed/NCBI
|
|
23
|
Kuo WH, Chang YY, Lai LC, Tsai MH, Hsiao
CK, Chang KJ and Chuang EY: Molecular characteristics and
metastasis predictor genes of triple-negative breast cancer: A
clinical study of triple-negative breast carcinomas. PLoS One.
7:e458312012. View Article : Google Scholar : PubMed/NCBI
|
|
24
|
Tofigh A, Suderman M, Paquet ER,
Livingstone J, Bertos N, Saleh SM, Zhao H, Souleimanova M, Cory S,
Lesurf R, et al: The prognostic ease and difficulty of invasive
breast carcinoma. Cell Rep. 9:129–142. 2014. View Article : Google Scholar : PubMed/NCBI
|
|
25
|
Desmedt C, Piette F, Loi S, Wang Y,
Lallemand F, Haibe-Kains B, Viale G, Delorenzi M, Zhang Y,
d'Assignies MS, et al: TRANSBIG Consortium: Strong time dependence
of the 76-gene prognostic signature for node-negative breast cancer
patients in the TRANSBIG multicenter independent validation series.
Clin Cancer Res. 13:3207–3214. 2007. View Article : Google Scholar : PubMed/NCBI
|
|
26
|
Wang DY, Done SJ, Mc Cready DR and Leong
WL: Validation of the prognostic gene portfolio, ClinicoMolecular
Triad Classification, using an independent prospective breast
cancer cohort and external patient populations. Breast Cancer Res.
16:R712014. View Article : Google Scholar : PubMed/NCBI
|
|
27
|
He DX, Xia YD, Gu XT, Jin J and Ma X: A
transcription/translation-based gene signature predicts resistance
to chemotherapy in breast cancer. J Pharm Biomed Anal. 102:500–508.
2015. View Article : Google Scholar : PubMed/NCBI
|
|
28
|
Hastie T, Sleeper L and Tibshirani R:
Flexible covariate effects in the proportional hazards model.
Breast Cancer Res Treat. 22:241–250. 1992. View Article : Google Scholar : PubMed/NCBI
|
|
29
|
Lachenbruch PA: Discriminant diagnostics.
Biometrics. 53:1284–1292. 1997. View Article : Google Scholar : PubMed/NCBI
|
|
30
|
He DX, Xia YD, Gu XT, Jin J and Ma X: A
20-gene signature in predicting the chemoresistance of breast
cancer to taxane-based chemotherapy. Mol Biosyst. 10:3111–3119.
2014. View Article : Google Scholar : PubMed/NCBI
|
|
31
|
Gatza ML, Lucas JE, Barry WT, Kim JW, Wang
Q, Crawford MD, Datto MB, Kelley M, Mathey-Prevot B, Potti A, et
al: A pathway-based classification of human breast cancer. Proc
Natl Acad Sci U S A. 107:6994–6999. 2010. View Article : Google Scholar : PubMed/NCBI
|
|
32
|
Tönjes M, Barbus S, Park YJ, Wang W,
Schlotter M, Lindroth AM, Pleier SV, Bai AHC, Karra D, Piro RM, et
al: BCAT1 promotes cell proliferation through amino acid catabolism
in gliomas carrying wild-type IDH1. Nat Med. 19:901–908. 2013.
View Article : Google Scholar : PubMed/NCBI
|
|
33
|
Zhou W, Feng X, Ren C, Jiang X, Liu W,
Huang W, Liu Z, Li Z, Zeng L, Wang L, et al: Over-expression of
BCAT1, a c-Myc target gene, induces cell proliferation, migration
and invasion in nasopharyngeal carcinoma. Mol Cancer. 12:532013.
View Article : Google Scholar : PubMed/NCBI
|
|
34
|
Magnani L, Ballantyne EB, Zhang X and
Lupien M: PBX1 genomic pioneer function drives ERα signaling
underlying progression in breast cancer. PLoS Genet.
7:e10023682011. View Article : Google Scholar : PubMed/NCBI
|
|
35
|
Emery LA, Tripathi A, King C, Kavanah M,
Mendez J, Stone MD, de las Morenas A, Sebastiani P and Rosenberg
CL: Early dysregulation of cell adhesion and extracellular matrix
pathways in breast cancer progression. Am J Pathol. 175:1292–1302.
2009. View Article : Google Scholar : PubMed/NCBI
|
|
36
|
Schumacker PT: Reactive oxygen species in
cancer: a dance with the devil. Cancer Cell. 27:156–157. 2015.
View Article : Google Scholar : PubMed/NCBI
|
|
37
|
Yang H, Zhang Q, He J and Lu W: Regulation
of calcium signaling in lung cancer. J Thorac Dis. 2:52–56.
2010.PubMed/NCBI
|
|
38
|
Monteith GR, McAndrew D, Faddy HM and
Roberts-Thomson SJ: Calcium and cancer: Targeting Ca2+
transport. Nat Rev Cancer. 7:519–530. 2007. View Article : Google Scholar : PubMed/NCBI
|
|
39
|
Sommer S and Fuqua SA: Estrogen receptor
and breast cancer. Semin Cancer Biol. 11:339–352. 2001. View Article : Google Scholar : PubMed/NCBI
|
|
40
|
Isakoff SJ: Triple-negative breast cancer:
Role of specific chemotherapy agents. Cancer J. 16:53–61. 2010.
View Article : Google Scholar : PubMed/NCBI
|
|
41
|
Bell DR, Gerlach JH, Kartner N, Buick RN
and Ling V: Detection of P-glycoprotein in ovarian cancer: A
molecular marker associated with multidrug resistance. J Clin
Oncol. 3:311–315. 1985. View Article : Google Scholar : PubMed/NCBI
|
|
42
|
Li X, Li JP, Yuan HY, Gao X, Qu XJ, Xu WF
and Tang W: Recent advances in P-glycoprotein-mediated multidrug
resistance reversal mechanisms. Methods Find Exp Clin Pharmacol.
29:607–617. 2007. View Article : Google Scholar : PubMed/NCBI
|
|
43
|
Townsend DM and Tew KD: The role of
glutathione-S-transferase in anti-cancer drug resistance. Oncogene.
22:7369–7375. 2003. View Article : Google Scholar : PubMed/NCBI
|
|
44
|
Lee JM, Dedhar S, Kalluri R and Thompson
EW: The epithelial-mesenchymal transition: New insights in
signaling, development, and disease. J Cell Biol. 172:973–981.
2006. View Article : Google Scholar : PubMed/NCBI
|
|
45
|
Polyak K and Weinberg RA: Transitions
between epithelial and mesenchymal states: Acquisition of malignant
and stem cell traits. Nat Rev Cancer. 9:265–273. 2009. View Article : Google Scholar : PubMed/NCBI
|