Introduction
Renal cancer is one of the ten most common cancers,
with an annual incidence of 2–4%. Approximately 90% of renal
cancers are renal cell carcinoma (RCC), most of which (70–85%) are
clear cells subtype (ccRCC) (1).
Localized renal cell carcinoma can be cured by
surgery. However, the survival rate of patients sharply declines
once the disease become metastatic. ccRCC is usually resistant to
chemotherapy, targeted therapies have been exploited for their
target specificity and low toxicity, so they can be the best choice
of non-surgical treatments (2).
Many of them have been approved for clinical use such as
multi-kinase inhibitors, anti-VEGF antibodies and mTOR (3).
Survival of patients indeed have been improved by
the new therapies, however, median progression-free and overall
survival are nearly 2 years, most patients eventually become
resistance and surrender (2).
Therefore, more effective biomarkers and therapeutic targets are
urgently needed.
At present, with the development of high-throughput
microarray technology, gene expression profiles have been used to
identify genes associated with progression of renal cancer
(4–6). However, most studies focused on the
screening of differentially expressed genes and ignored the high
degree of interconnection between genes, although genes with
similar expression patterns may be functionally related (7).
We attempted to construct a co-expression network of
relationships between genes through a systematic biology method
based on a weighted genome expression network (WGCNA) and to
identify network-centric genes associated with different stages of
disease progression of renal cancer (8–10).
Materials and methods
Ethical statement for human kidney
tissues
The Ethics Committee at Zhongnan Hospital of Wuhan
University approved the experiments using human ccRCC and
paracancerous tissues for RNA isolation and qRT-PCR (approval no.
2015029). All methods used for human ccRCC tissue samples were
performed in accordance with the approved guidelines and
regulations. Informed consent was obtained from all individual
participants included in the study.
Study design and data collection
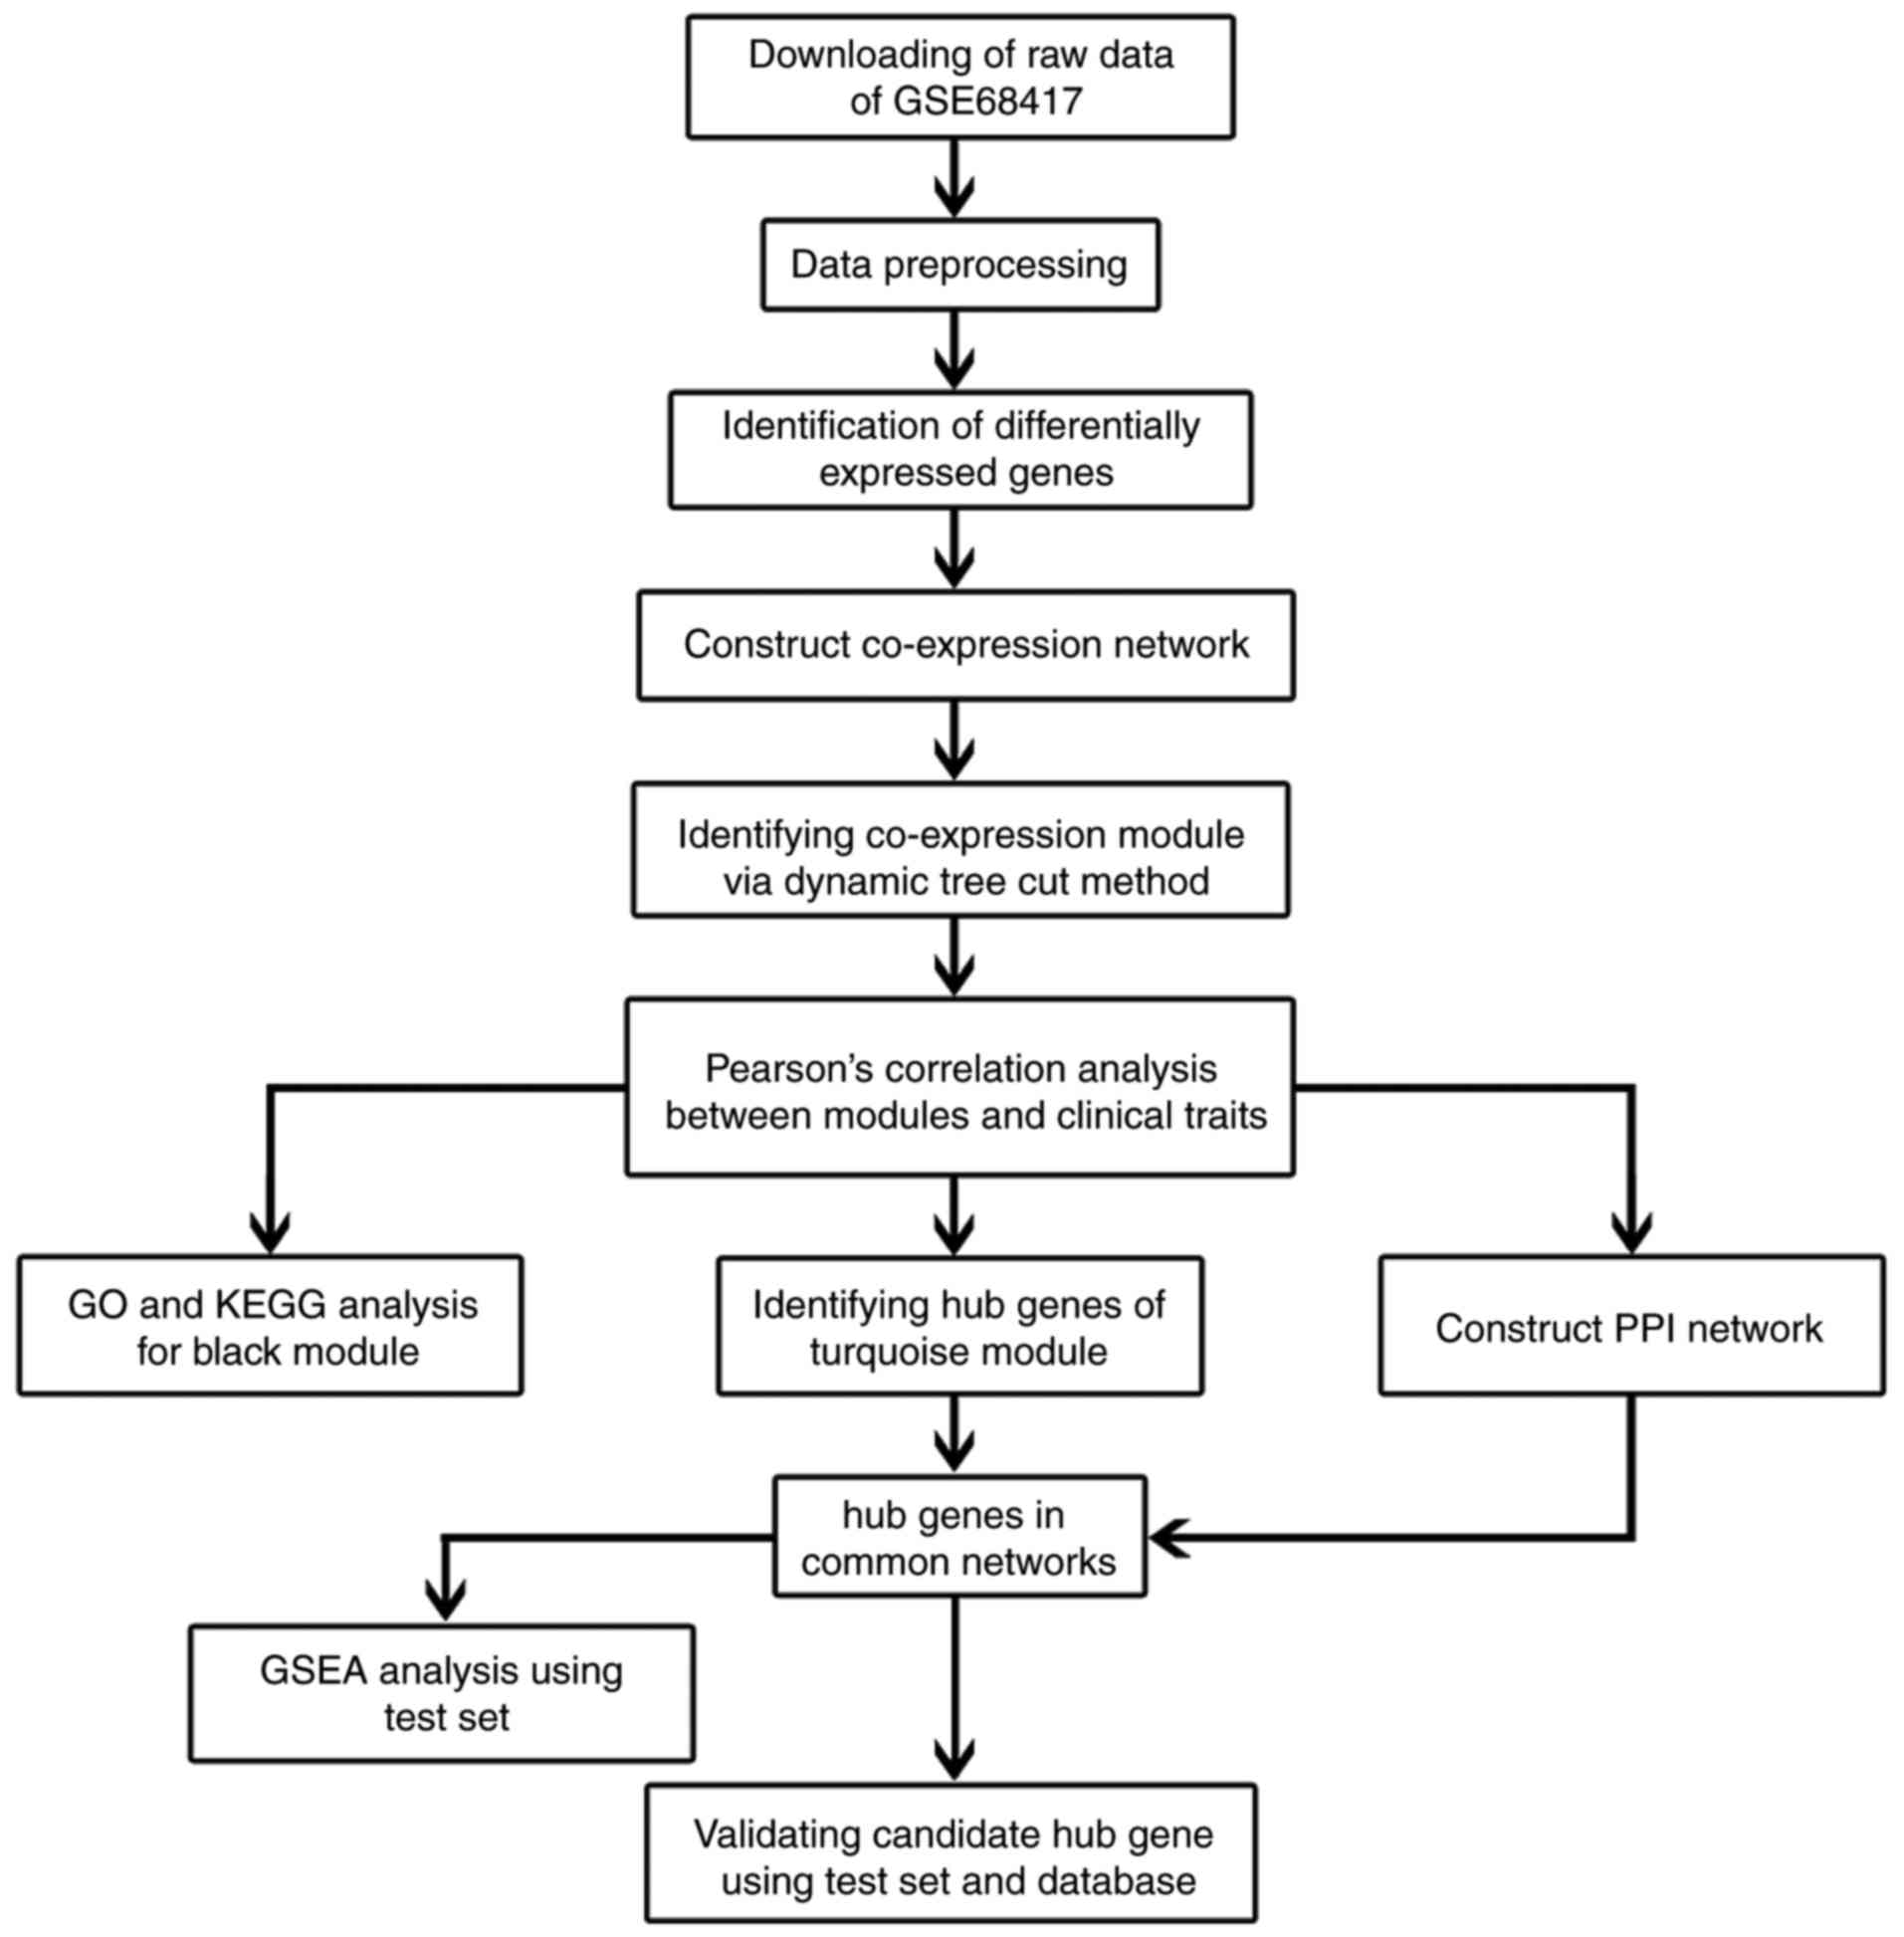
In order to clarify our study, we designed a flow
diagram to demonstrate the data preparation, preprocessing,
analysis and validation (Fig. 1).
Firstly, expression profiles of mRNA of clear cell renal cell
carcinoma were downloaded from Gene Expression Omnibus (GEO)
database (http://www.ncbi.nlm.nih.gov/geo/). Dataset GSE68417
performed on Affymetrix Human Gene 1.0 ST Array [transcript (gene)
version] (Affymetrix, Santa Clara, CA, USA) was used to construct
co-expression networks and identify hub genes in this study. This
dataset included 14 normal kidney tissues (controls), 6 kidney
samples from patients with benign, 13 samples from patients with
low grade ccRCC (Fuhrman grades 1 and 2), and 16 samples from
patients with high grade (Fuhrman grades 3 and 4). Another
independent dataset of GSE40435 was downloaded from GEO and used as
a test set to verify our results. This dataset included clear cell
renal carcinoma patients from Czech patients (including ccRCC of
Fuhrman grades 1, 2, 3 and 4).
Data preprocessing
For the analyses, the raw expression data were
firstly performed RMA background correction, and the processed
signals were log2 transformed and normalized by quantile
normalization. Then median-polish probesets were summarized by
using the ‘affy’ R package. Probes were annotated by the Affymetrix
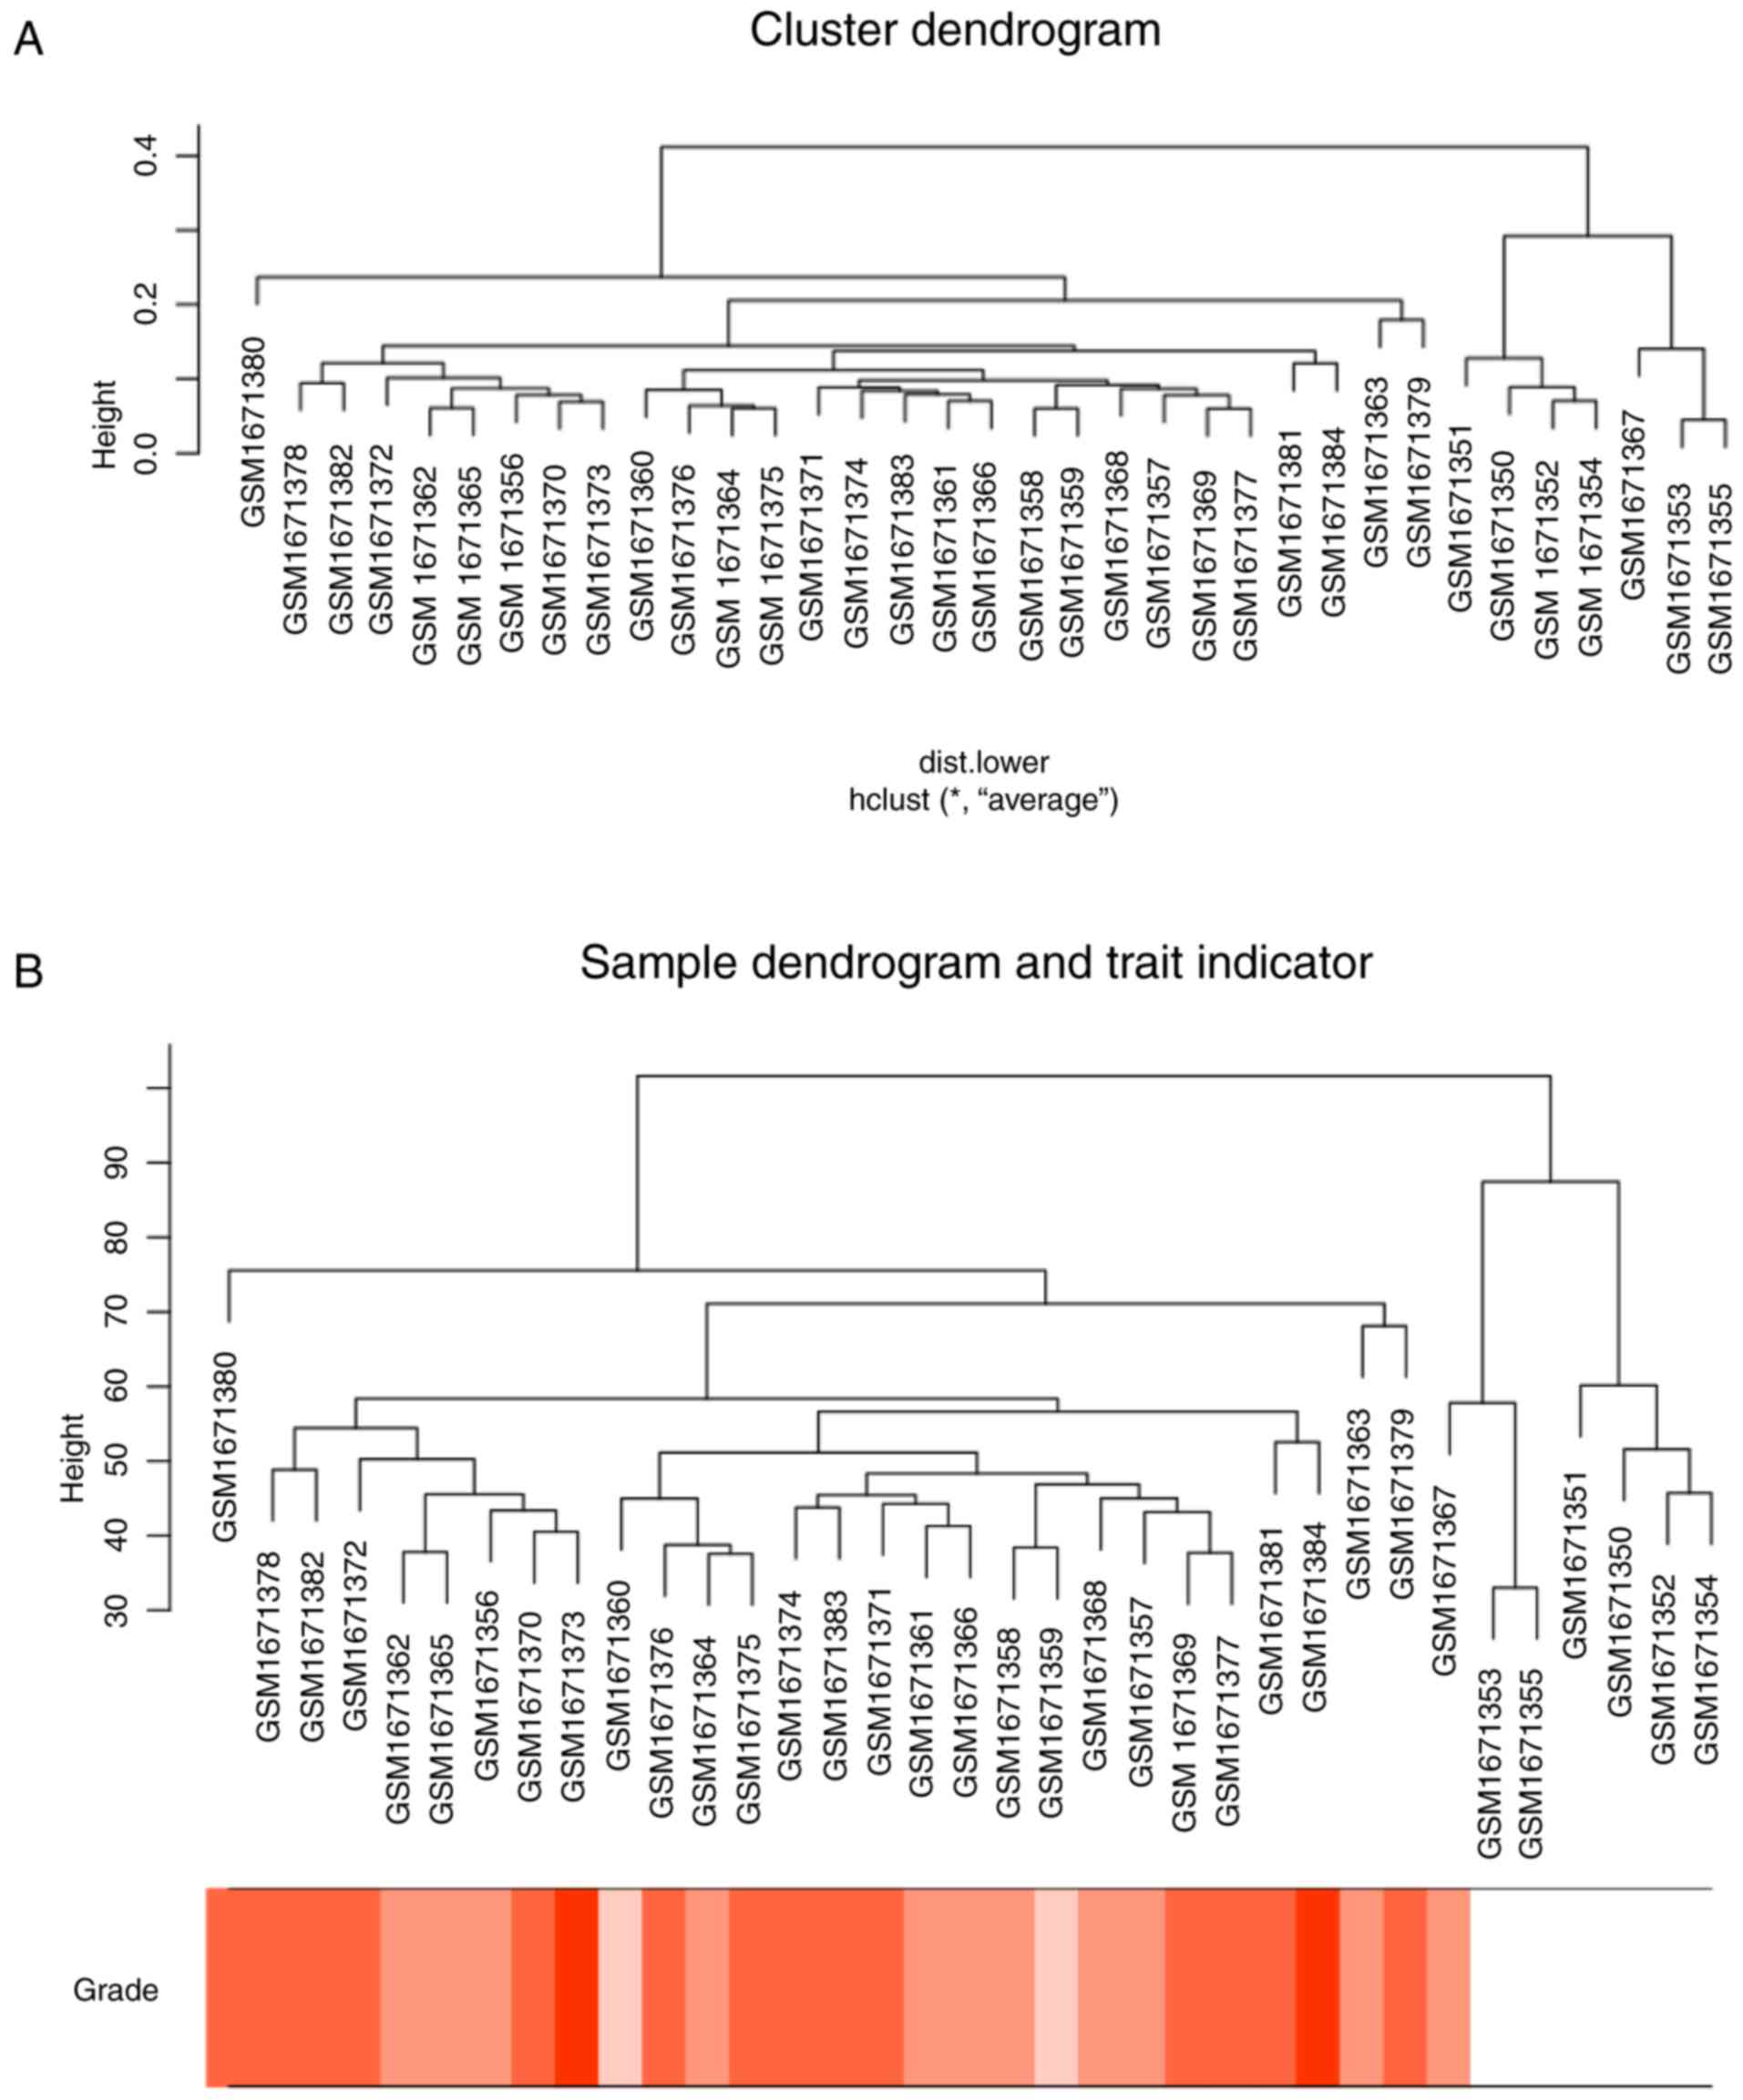
annotation files. Microarray quality was assessed by sample
clustering according to the distance between different samples in
Pearson's correlation matrices and average linkage, and no samples
were removed from subsequent analysis in GSE68417 (Fig. 2).
Screening of differentially expressed
genes (DEGs)
The ‘limma’ R package was used to screen the DEGs
between normal kidney and ccRCC tissues in the expression data. The
SAM (significance analysis of microarrays) with FDR (false
discovery rate) <0.05 and |log2 fold change (FC)|
>0.585 were applied to select genes further considered in the
network construction.
Co-expression network
construction
Firstly, expression data profile of DEGs was tested
to check if they were good samples and good genes. Then, we used
the ‘WGCNA’ package in R to construct co-expression network for the
DEGs (11,12). First, the Pearson's correlation
matrices were both performed for all pair-wise genes. A weighted
adjacency matrix was constructed using a power function
amn=|cmn|β
(cmn=Pearson's correlation between gene m and gene n;
amn=adjacency between gene m and gene n). β was a
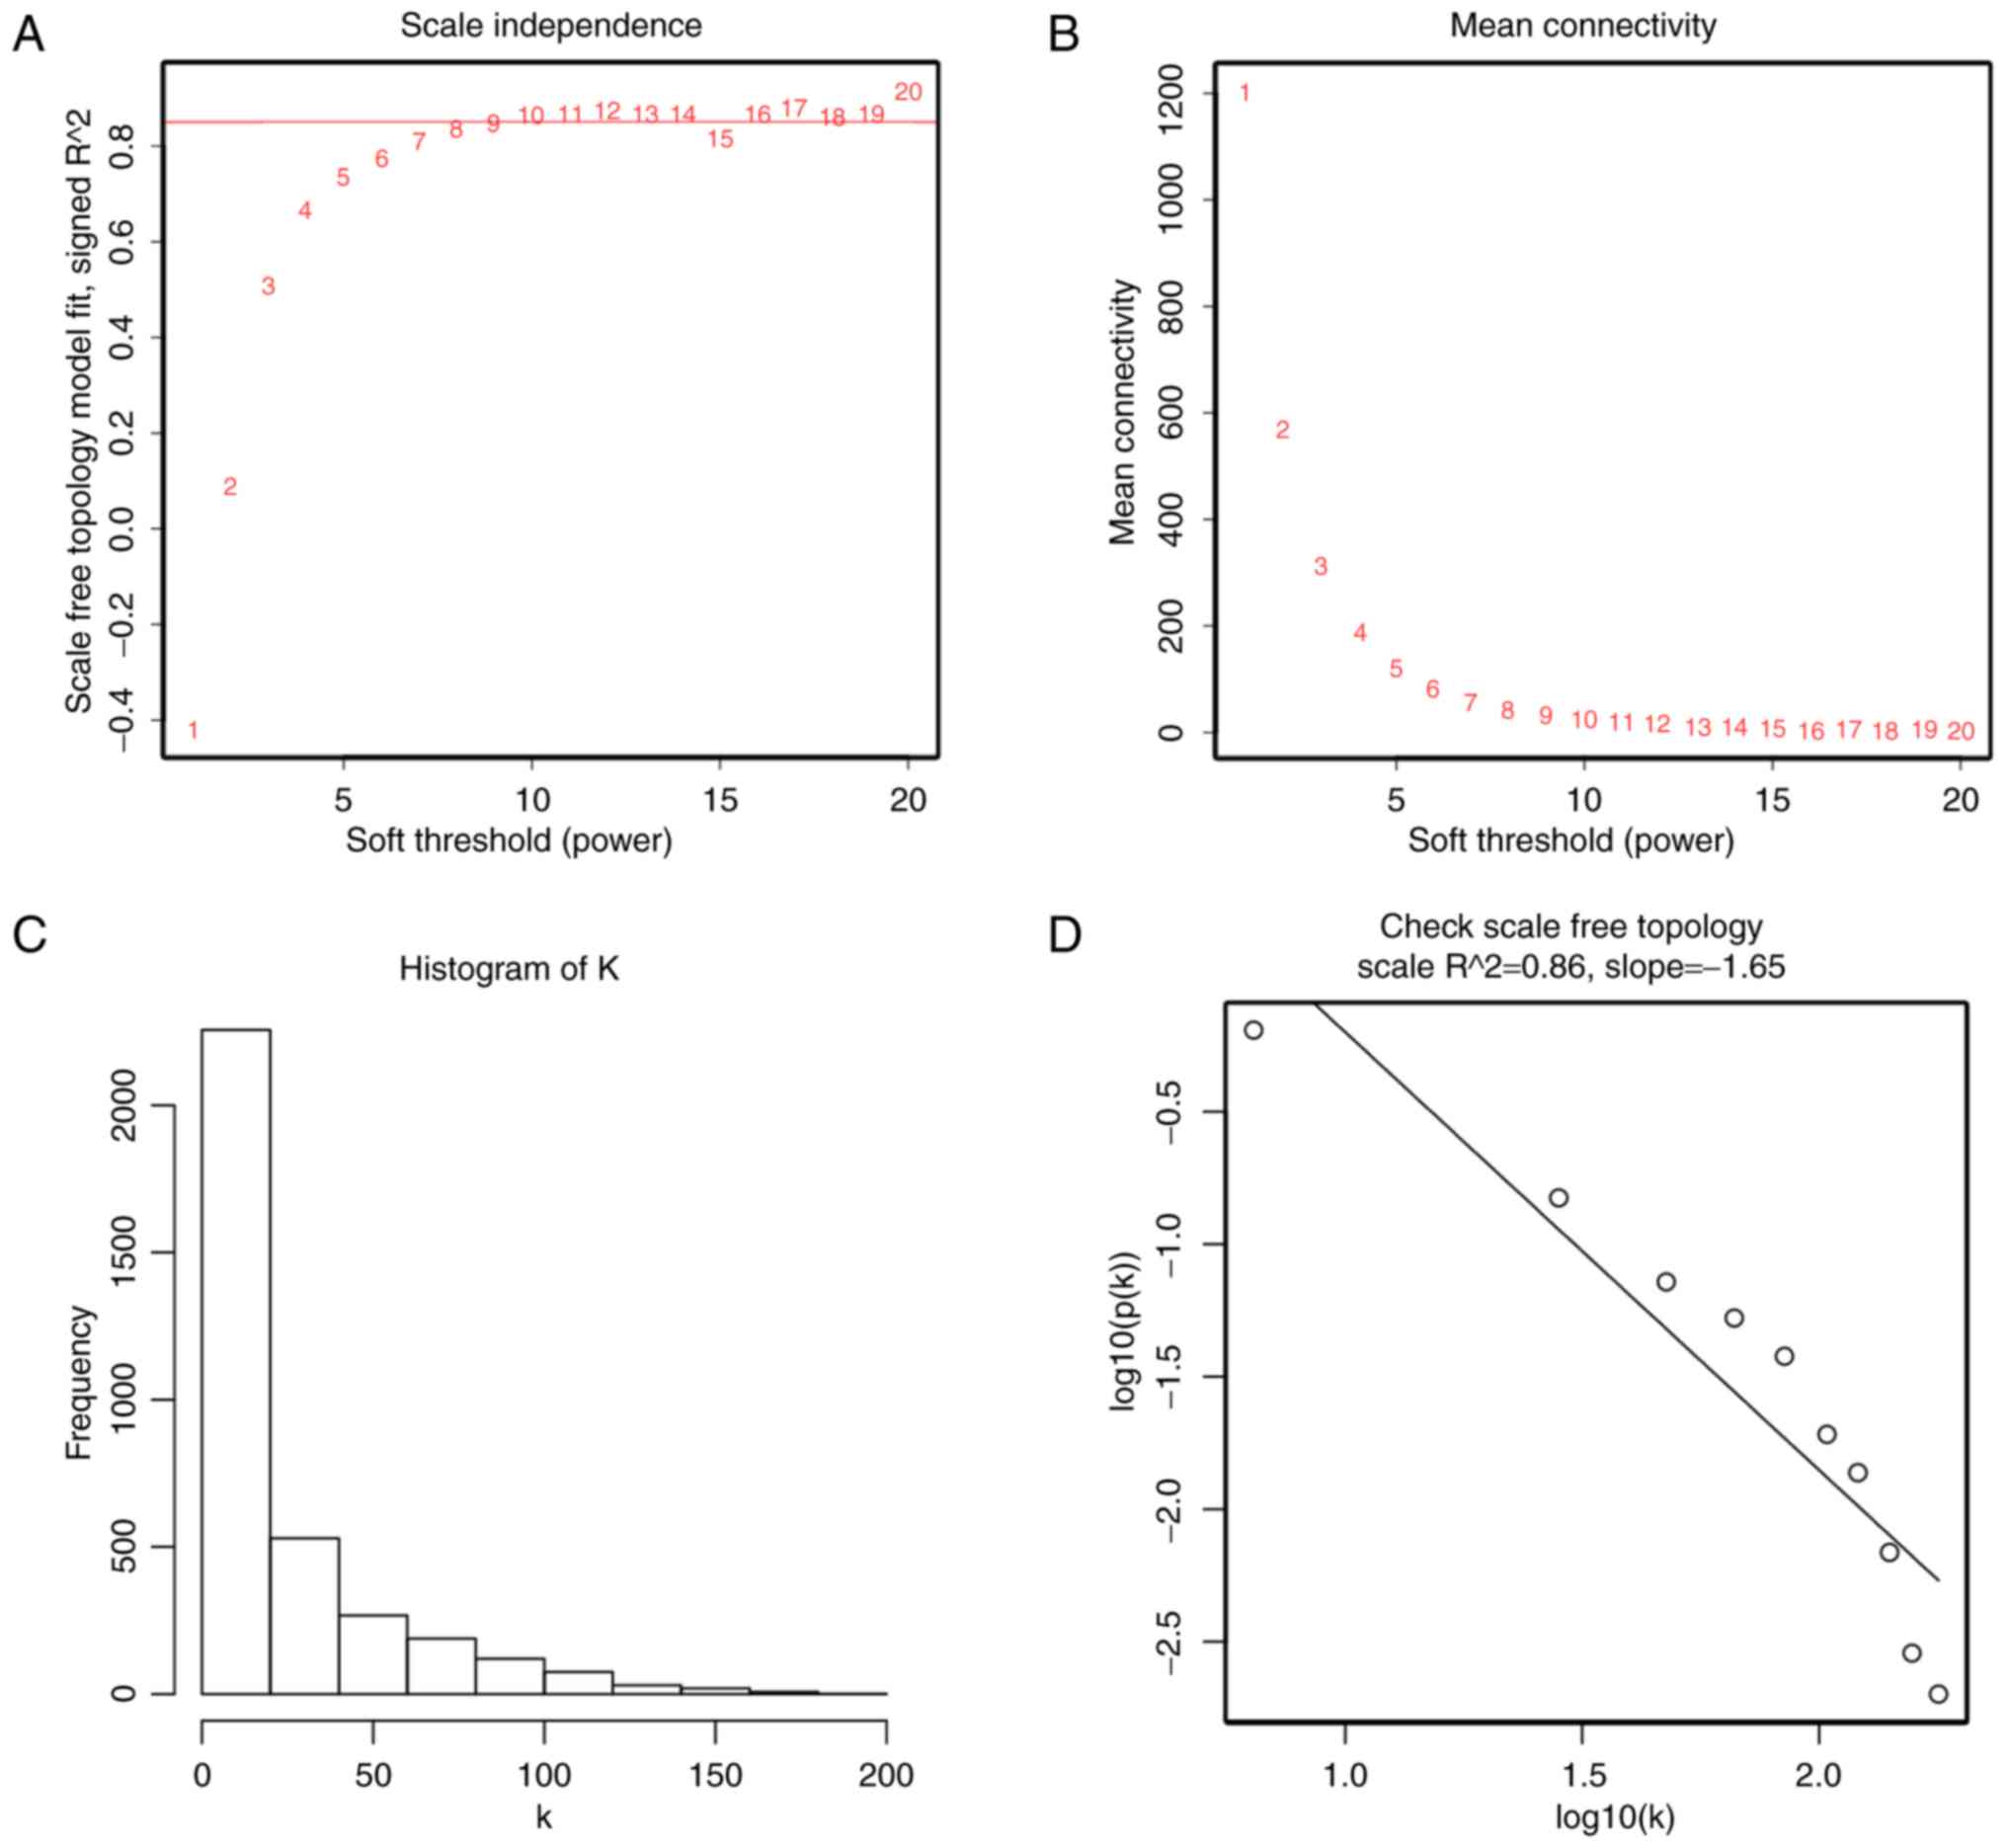
soft-thresholding parameter that could emphasize strong
correlations between genes and penalize weak correlations. Here,
the power of β = 10 (scale free R2 = 0.86) was selected
to ensure a scale-free network (Fig.
3). Next, the adjacency was transformed into topological
overlap matrix (TOM), which could measure the network connectivity
of a gene defined as the sum of its adjacency with all other genes
for network generation (13). To
classify genes with similar expression profiles into gene modules,
average linkage hierarchical clustering was conducted according to
the TOM-based dissimilarity measure with a minimum size (gene
group) of 50 for the gene dendrogram (14). To further analyze the module, we
calculated the dissimilarity of module eigengenes, chose a cut line
for module dendrogram and merged some modules.
Identification of clinical significant
modules
Two approaches were used to identify modules related
with the progression of ccRCC. First, gene significance (GS) was
defined as the log10 transformation of the P-value (GS =
lgP) in the linear regression between gene expression and Furhman
grade. In addition, module significance (MS) was defined as the
average GS for all the genes in a module. In general, the module
with the absolute MS ranked first or second among all the selected
modules was considered as the one related with clinical trait.
Module eigengenes (MEs) were considered as the major component in
the principal component analysis for each gene module and the
expression patterns of all genes could be summarized into a single
characteristic expression profile within a given module. In
addition, we calculated the correlation between MEs and clinical
trait to identify the relevant module.
Hub gene analysis and validation
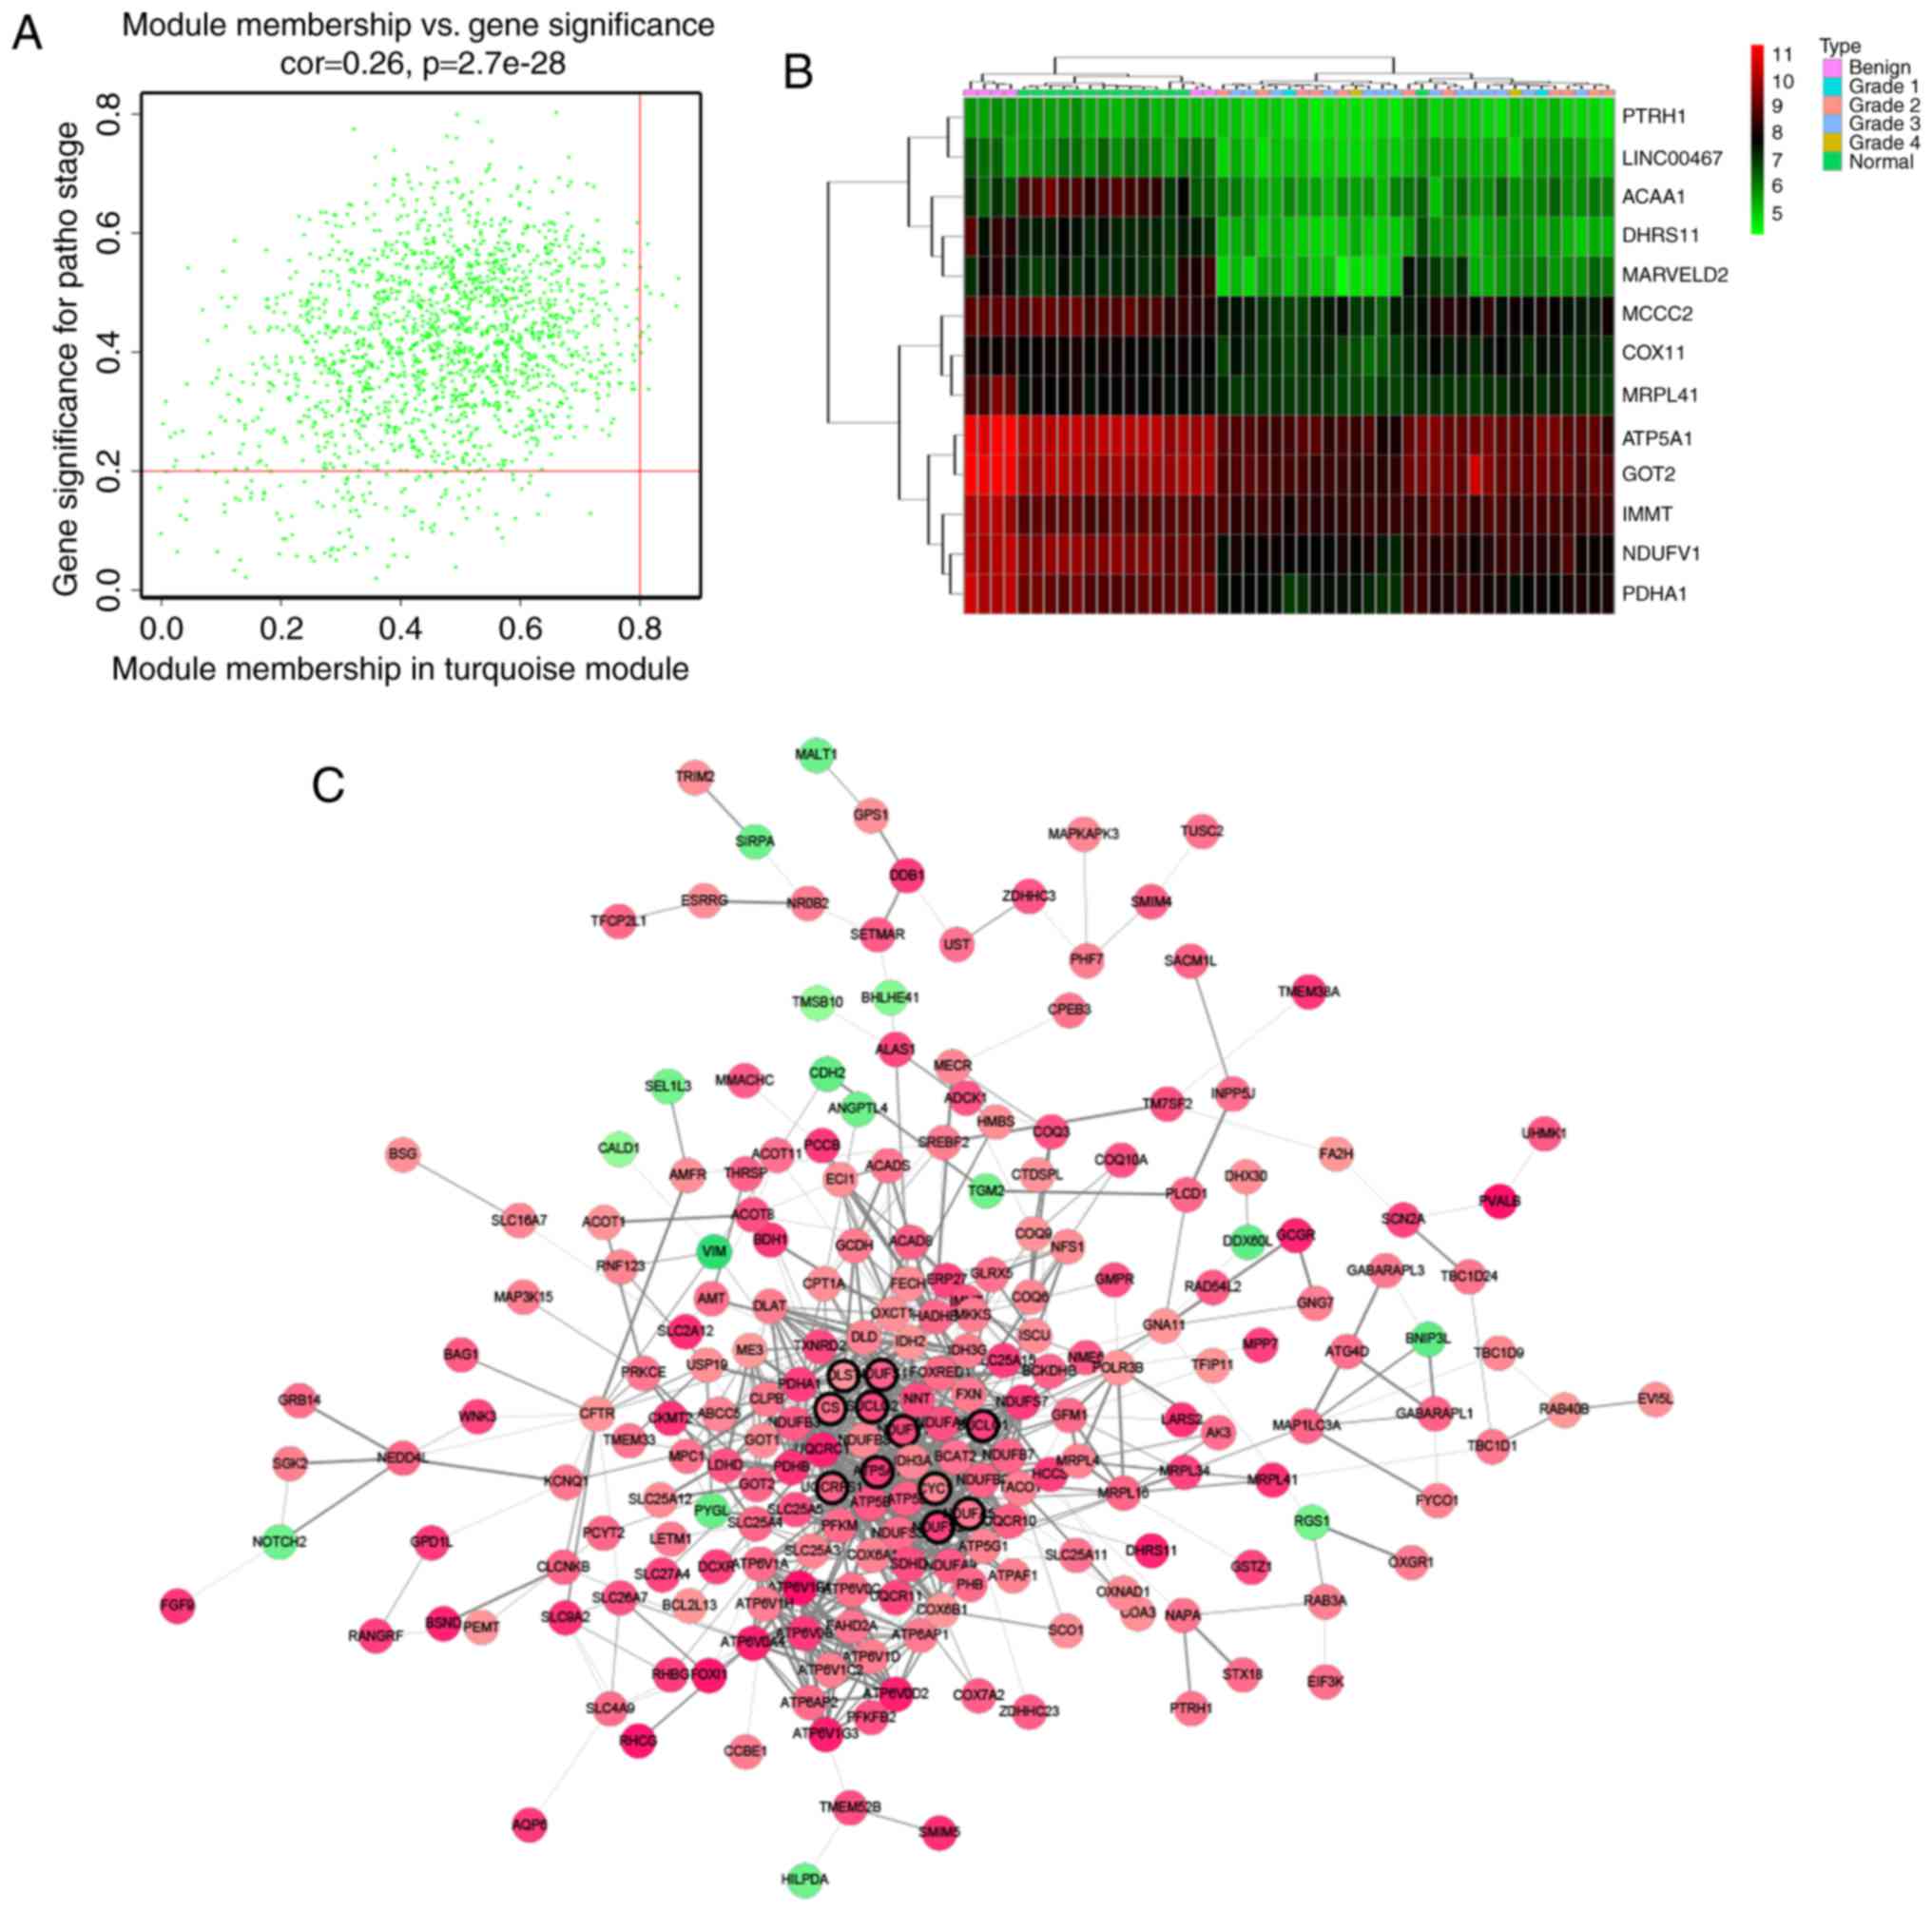
Hub genes, highly interconnected with nodes in a
module, have been shown to be functionally significant. In our
study, we chose an interesting module, and hub genes were defined
by module connectivity, measured by absolute value of the Pearson's
correlation (cor.geneModuleMembership >0.8) and clinical trait
relationship, measured by absolute value of the Pearson's
correlation (cor.geneTraitSignificance >0.2) (Fig. 4). In order to screen a key candidate
among the hub genes, a linear regression analysis was performed to
calculate the relationship between the hub gene expressions and the
Furhman grades of ccRCC and R2 was defined as the
relationship between them. Furthermore, we uploaded all genes in
the hub module to the STRING (Search Tool for the Retrieval of
Interacting Genes) database (http://www.string-db.org/) to construct
protein-protein interaction (PPI), choosing confidence score
>0.40 as the cut-off to screen hub nodes in PPI network
(15,16).
In the test set of GSE40435, downloaded before
background correcting, normalizing and expression calculating, the
expression values of the candidate hub gene in normal kidney and 4
grades ccRCC were collected to perform t-test, and P<0.05 were
considered statistically significant. Moreover, we used additional
3 databases: Oncomine (http://www.oncomine.org), The Human Protein Atlas
(http://www.proteinatlas.org) and Gene
Expression Profiling Interactive Analysis (GEPIA) database
(http://www.gepia.cancer-pku.cn) to
perform validation of expression, immunohistochemistry (IHC) and
prognosis of the candidate hub gene (17). Oncomine is a database consisting of
microarray data of various tumors; in our study, we used the data
of the expression of the candidate hub gene in 5 subtypes of renal
carcinoma. Human Protein Atlas is a database providing
immunohistochemistry staining of common cancers, normal tissues and
cell lines; in our study, we used the IHC of hub gene in normal and
tumor tissues. GEPIA database is based on TCGA data; in our study,
we used it to perform survival analysis and assessment of the hub
gene expression levels in different pathological stages.
Functional and pathway enrichment
analysis
The Database for Annotation, Visualization and
Integrated Discovery (DAVID) database (http://david.abcc.ncifcrf.gov/) is an online program
providing a comprehensive set of functional annotation tools for
investigators to understand biological meaning behind large list of
genes (18). Enriched biological
themes of DEGs in hub module, particularly GO terms and
visualization of those on KEGG pathway maps were performed using
DAVID database. P<0.05 was set as the cut-off criterion.
Gene set enrichment analysis
(GSEA)
In the test set of GSE40435, 101 samples of ccRCC
were divided into two groups according to the expression level of
valid hub gene. To identify potential function of the hub gene,
GSEA was conducted to detect whether a series of a priori
defined biological processes were enriched in the gene rank derived
from DEGs between the two groups. P-value <0.05 was chosen as
the cut-off criteria.
Preparation for human ccRCC
samples
The ccRCC and paracancerous tissues samples were
collected from patients after surgery at Zhongnan Hospital of Wuhan
University. The histology diagnosis was confirmed by two
pathologists independently. The ccRCC and paracancerous tissues
were immediately frozen and stored in liquid nitrogen or fixed in
4% PFA after collection. The study using ccRCC and paracancerous
tissue samples for total RNA isolation and qRT-PCR analysis was
approved by the Ethics Committee at Zhongnan Hospital of Wuhan
University (approval no. 2015029). Informed consent was obtained
from all subjects.
Total RNA isolation
Total RNA from ccRcc tissues were isolated using
RNeasy Mini kit (cat. no. 74101, Qiagen, Hilden, Germany) according
to the manufacturer's instructions. DNase I digestion (cat. no.
79254) was used in each RNA preparation to remove genomic DNA.
After that, total RNA quantity was measured using NanoPhotometer
(cat. no. N60, Implen, München, Germany).
Quantitative real-time PCR
(qRT-PCR)
The cDNA was synthesized using 1 µg of total RNA
isolated from PCa cells by ReverTra Ace qPCR RT kit (Toyobo,
Shanghai, China) and qRT-PCR was performed using 400 ng cDNA per 25
µl reaction. Each reaction was conducted with iQ™ SYBR®
Green Supermix (Bio-Rad, China) using 400 or 500 ng of cDNA in a
final volume of 25 µl. Primers used for ATP5A1:
5′-ATGACGACTTATCCAAACAGGC-3′ (forward),
5′-CGGGAGTGTAGGTAGAACACAT-3′ (reverse), annealing temperature was
60°C. Primers used for GAPDH (loading control):
5′-TGCACCACCAACTGCTTAG-3′ (forward), 5′-GATGCAGGGATGATGTTC-3′
(reverse), annealing temperature was 60°C.
Results
DEGs screening
After data preprocessing and quality assessment, the
expression matrices were obtained from the 49 samples in training
set GSE68417. Under the threshold of FDR <0.05 and
|log2FC| >0.585, a total of 3,495 DEGs (1,549
upregulated or 1,946 downregulated) were selected for subsequent
analysis.
Sample cluster and quality
assessment
In Fig. 2, sample
cluster of GSE68417 was performed, using average linkage method and
Pearson's correlation method to compare sample cluster in order to
screen outlier samples. Moreover, no samples were deleted. The
color intensity was proportional to stage of ccRCC. In Fig. 3, the quality assessment for
expression data matrix was performed. In addition, when we chose
the correct β = 10, the expression data matrix could construct
scale-free network to perform further analysis.
Weighted co-expression network
construction and identification of key modules
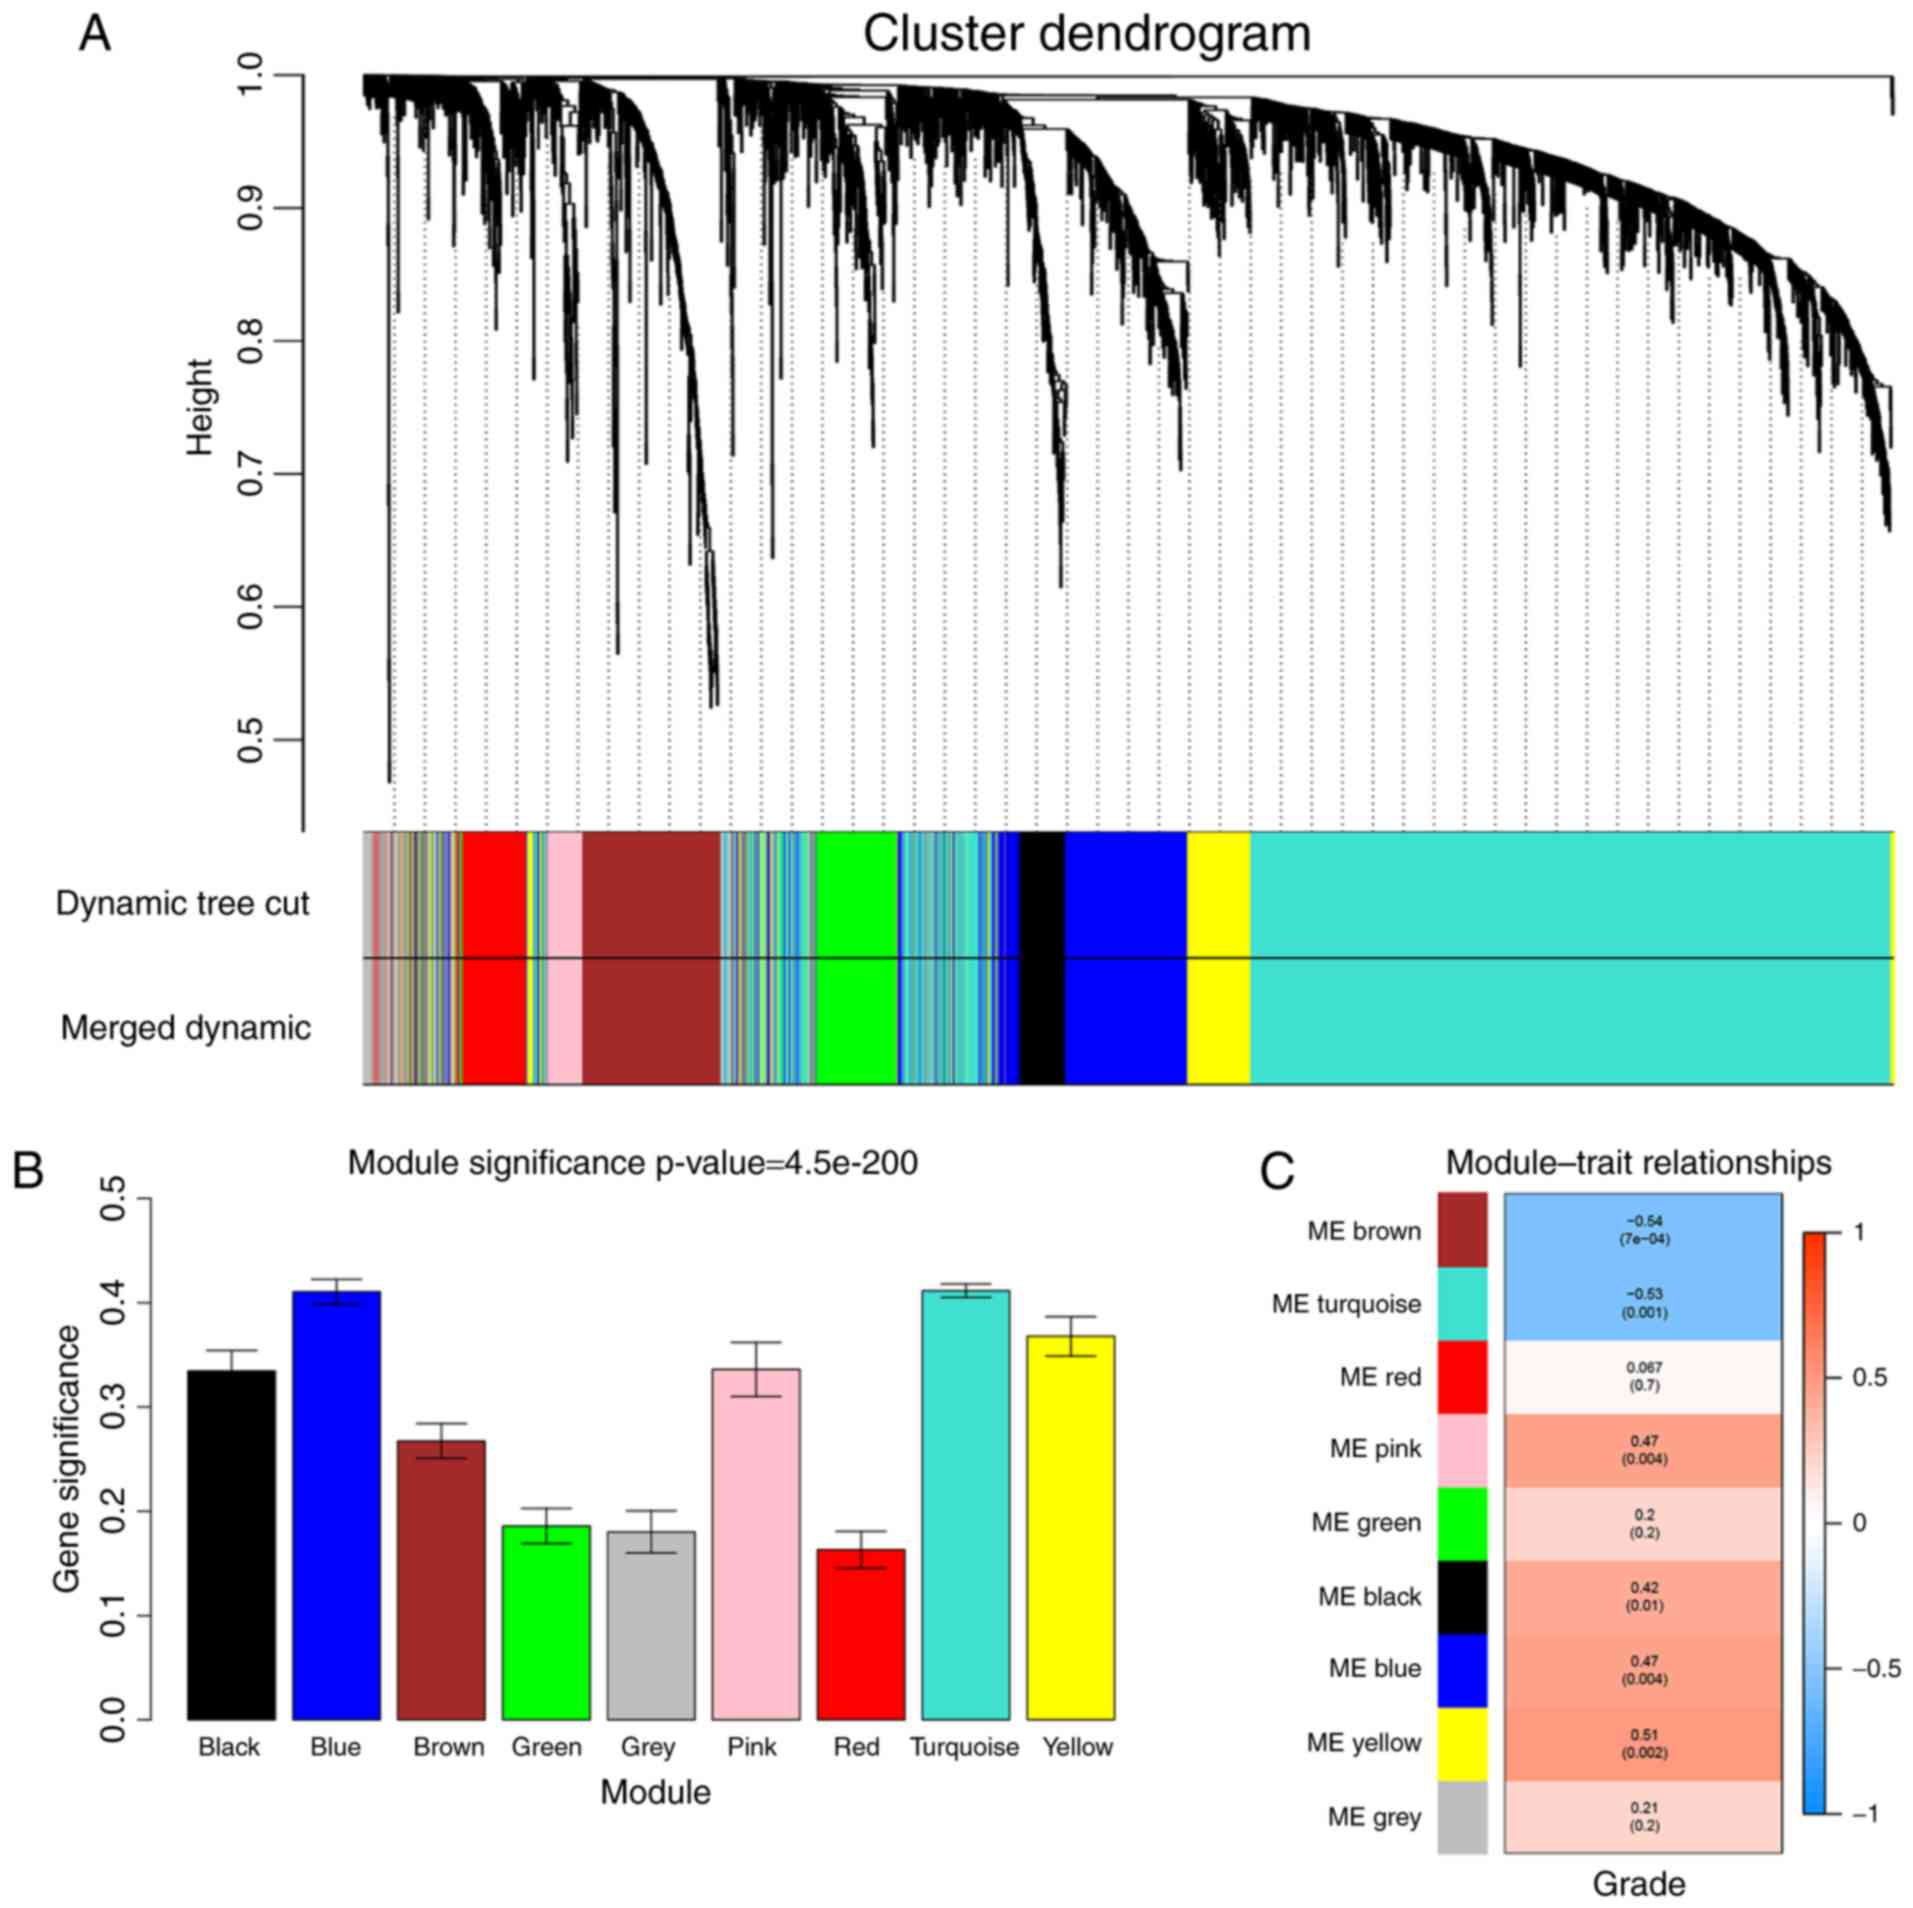
We used ‘WGCNA’ package in R to put the DEGs with
similar expression patterns into modules by average linkage
clustering, and a total of 9 modules were identified (Fig. 5A). Two methods were used to test the
relevance between each module and the ccRCC progression. Firstly,
modules with greater MS were considered to have more connection
with the disease progression, and we found that the MS of turquoise
module and blue module were higher than those of any other MS
(Fig. 5B). Afterwards, the ME in
the turquoise module and brown module showed a higher correlation
with disease progression than the other modules (Fig. 5C). Based on the two methods, we
identified the turquoise module was the module most relevant to the
disease progression of ccRCC.
Hub gene identification
Defined by module connectivity, measured by absolute
value of the Pearson's correlation (cor.geneModuleMembership
>0.8) and clinical trait relationship, measured by absolute
value of the Pearson's correlation (cor.geneTraitSignificance
>0.2), 13 genes with the high connectivity in turquoise module
were taken as hub genes (DHRS11, NDUFV1, ATP5A1, PDHA1, PTRH1,
ACAA1, LINC00467, MCCC2, MARVELD2, GOT2, COX11, MRPL41, IMMT)
(Fig. 4A and B). Moreover, we also
constructed a network of protein-protein interaction (PPI) for all
genes in turquoise module by Cytoscape according to the STRING
database, and genes connected with >15 nodes were identified as
hub nodes in the PPI network (ATP5A1, CS, CYC1, DLST, NDUFA5,
NDUFS1, NDUFS2, NDUFV1, SUCLG1, SUCLG2, UQCRFS1) (Fig. 4C) (19).
Hub gene validation
Among all genes in two networks, ATP5A1 and
NDUFV1 were genes in both networks. Here, concerning genes
with the most relevance to ccRCC stage, we chose ATP5A1
which had the top 1 relevance to the clinical feature in the hub
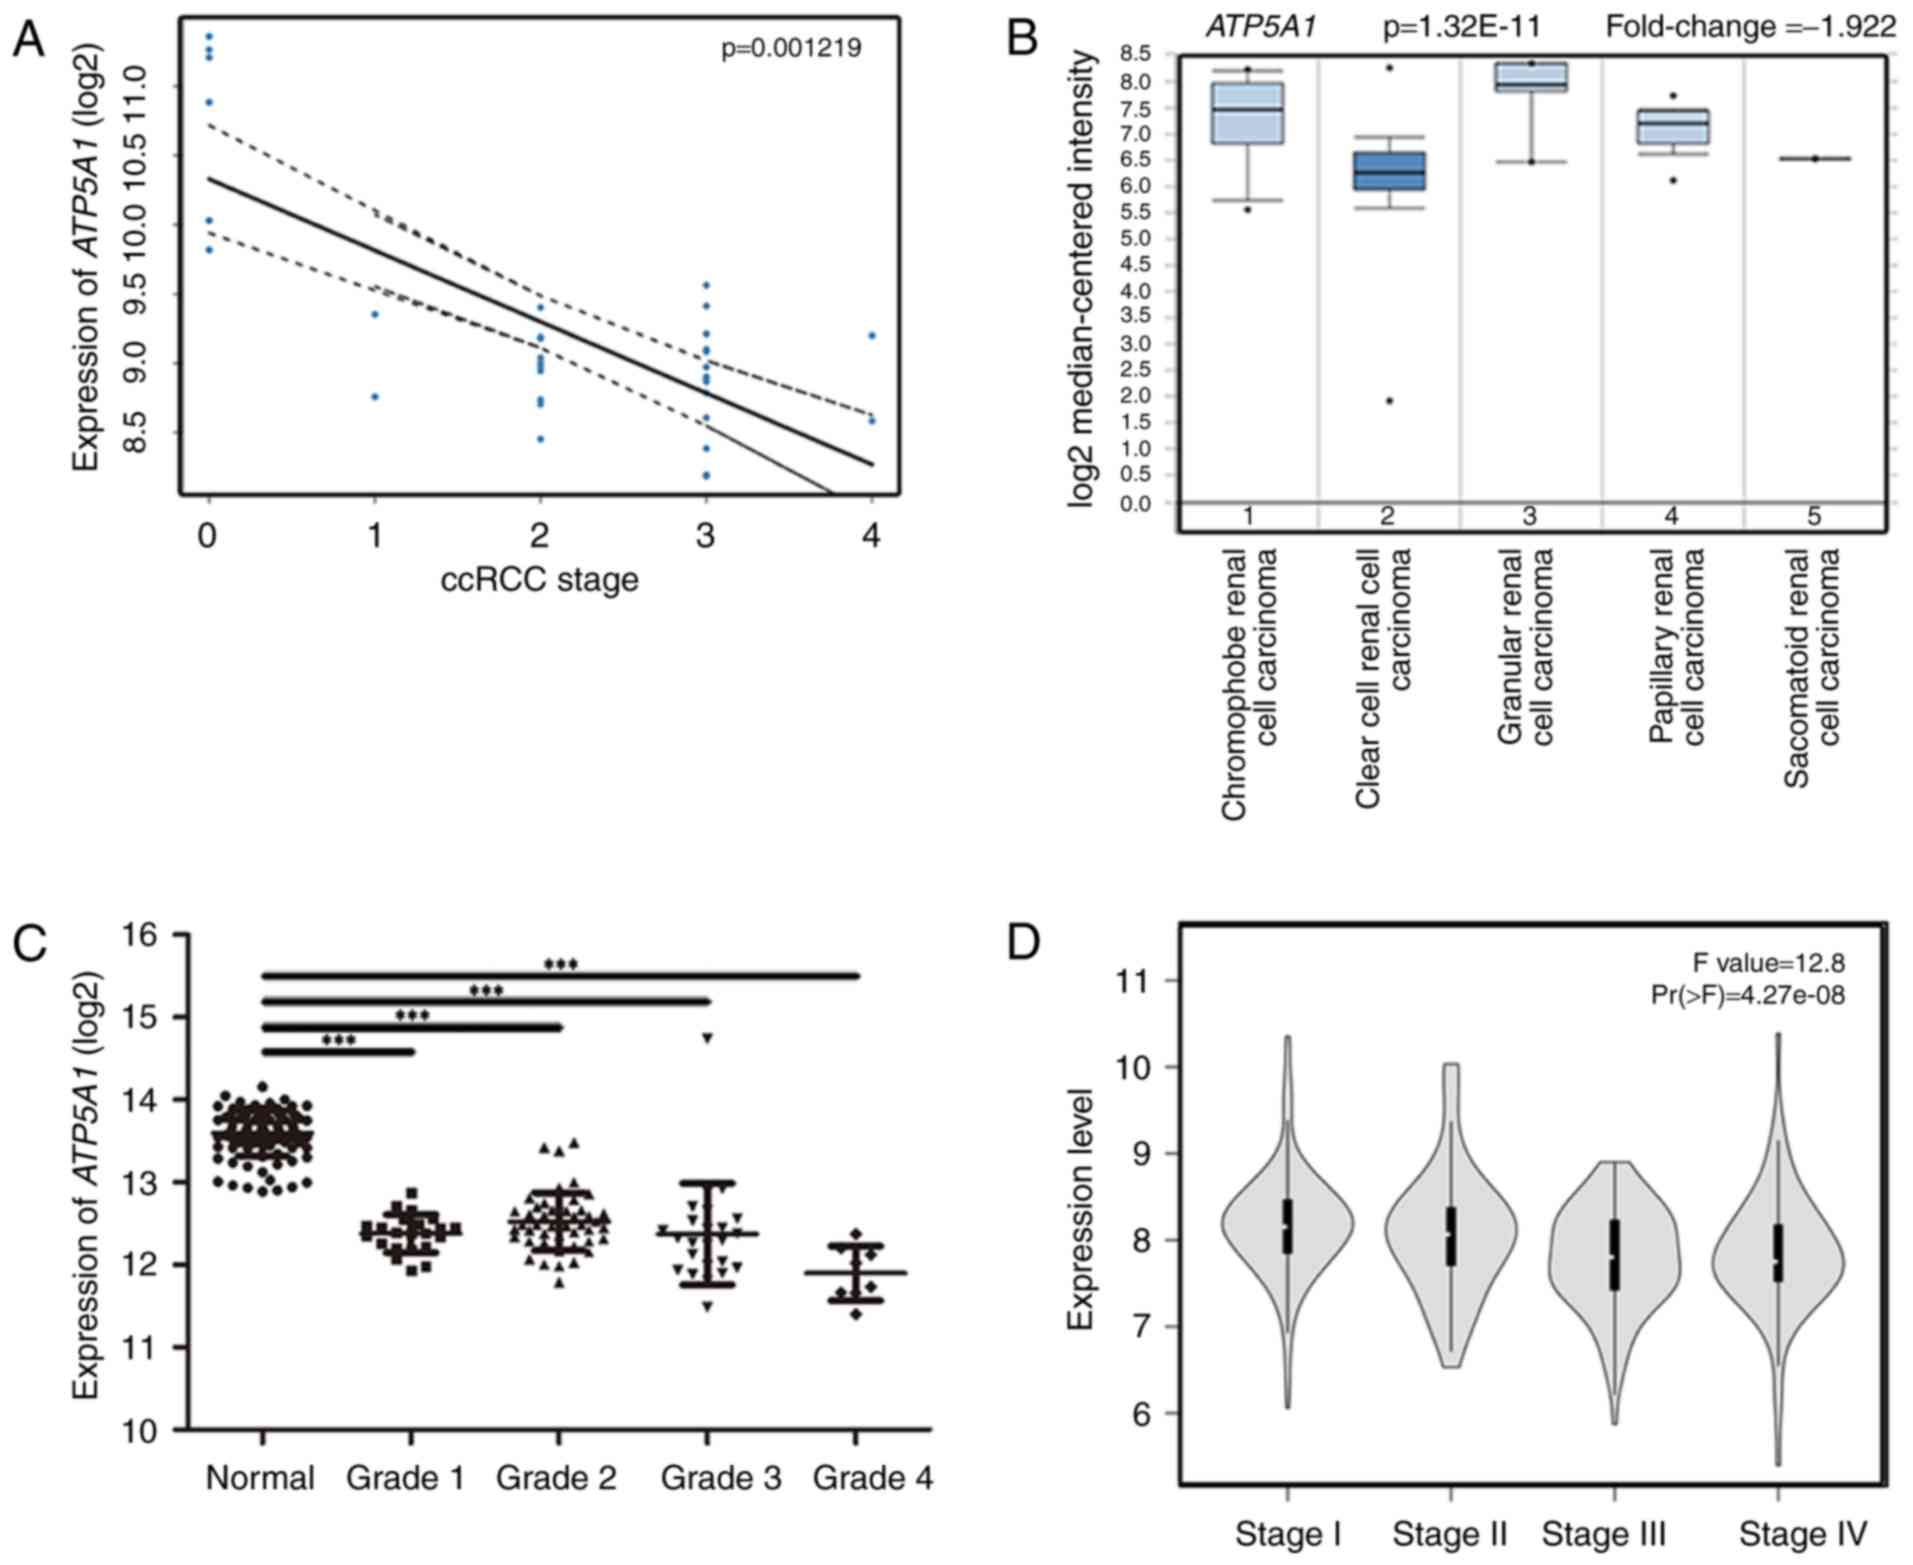
module. Moreover, linear regression analyses were conducted to
validate hub genes in the training set. Most genes showed a
moderate correlation with the disease progression, and only
ATP5A1 had a higher correlation than other genes
(P=0.001219) (Fig. 6A). Therefore,
ATP5A1 was chosen as the candidate gene for further
validation. In the test set, ATP5A1 expression was
significantly higher in normal kidney tissues than that in ccRCC
tissue of any grade (Fig. 4B). In
the dataset of GSE40435, ATP5A1 also showed its high
expression in normal kidney tissues and low expression in ccRCC
tissues of any grade (Fig. 6C).
Based on Oncomine database, interestingly, we found that the
expression of ATP5A1 was not only highly-expressed in normal
kidney, but also had a strong relation with malignancy with
pathological grade and differentiation (Fig. 6B). In GEPIA database, we found that
the expression of ATP5A1 was decreased with the progression
of ccRCC (Fig. 6D). More
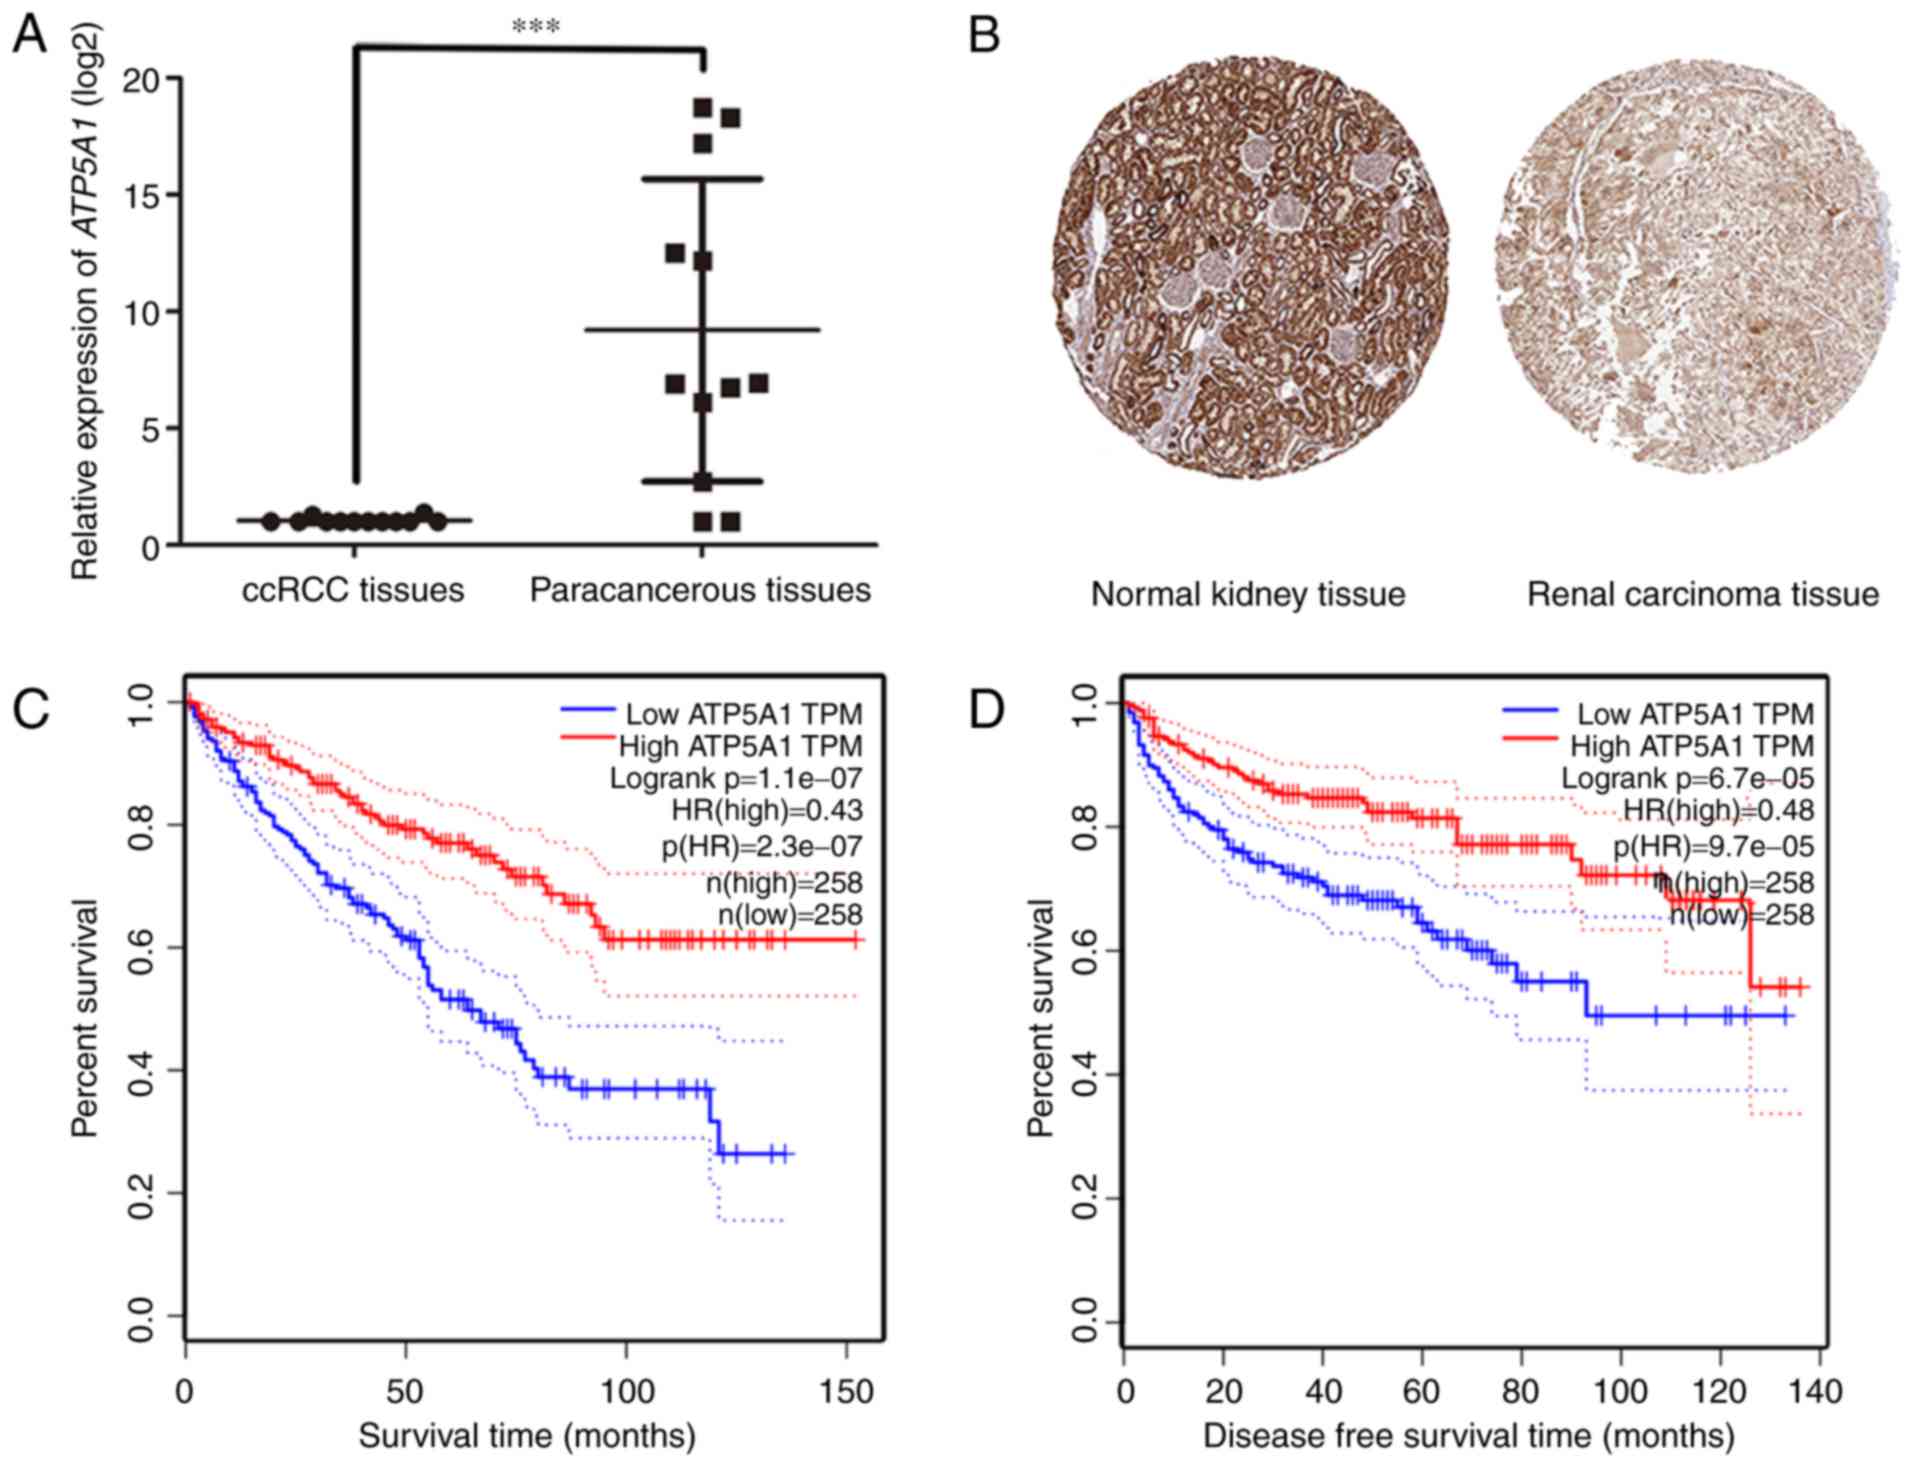
convincingly, the result of qRT-PCR using 11 ccRCC tissues and
matched paracancerous tissues exhibited a significant
downregulation in ccRCC compared to paracancerous tissues
(P<0.001) (Fig. 7A). In
addition, immunohistochemistry staining obtained from The Human
Protein Atlas database, revealed strong decrease of ATP5A1
protein in ccRCC tissues, compared with normal kidneys (Fig. 7B). In addition, we discovered that
patients with lower expression of ATP5A1 had a significantly
shorter overall survival and disease-free survival time (Fig. 7C and D).
Functional and pathway enrichment
analysis
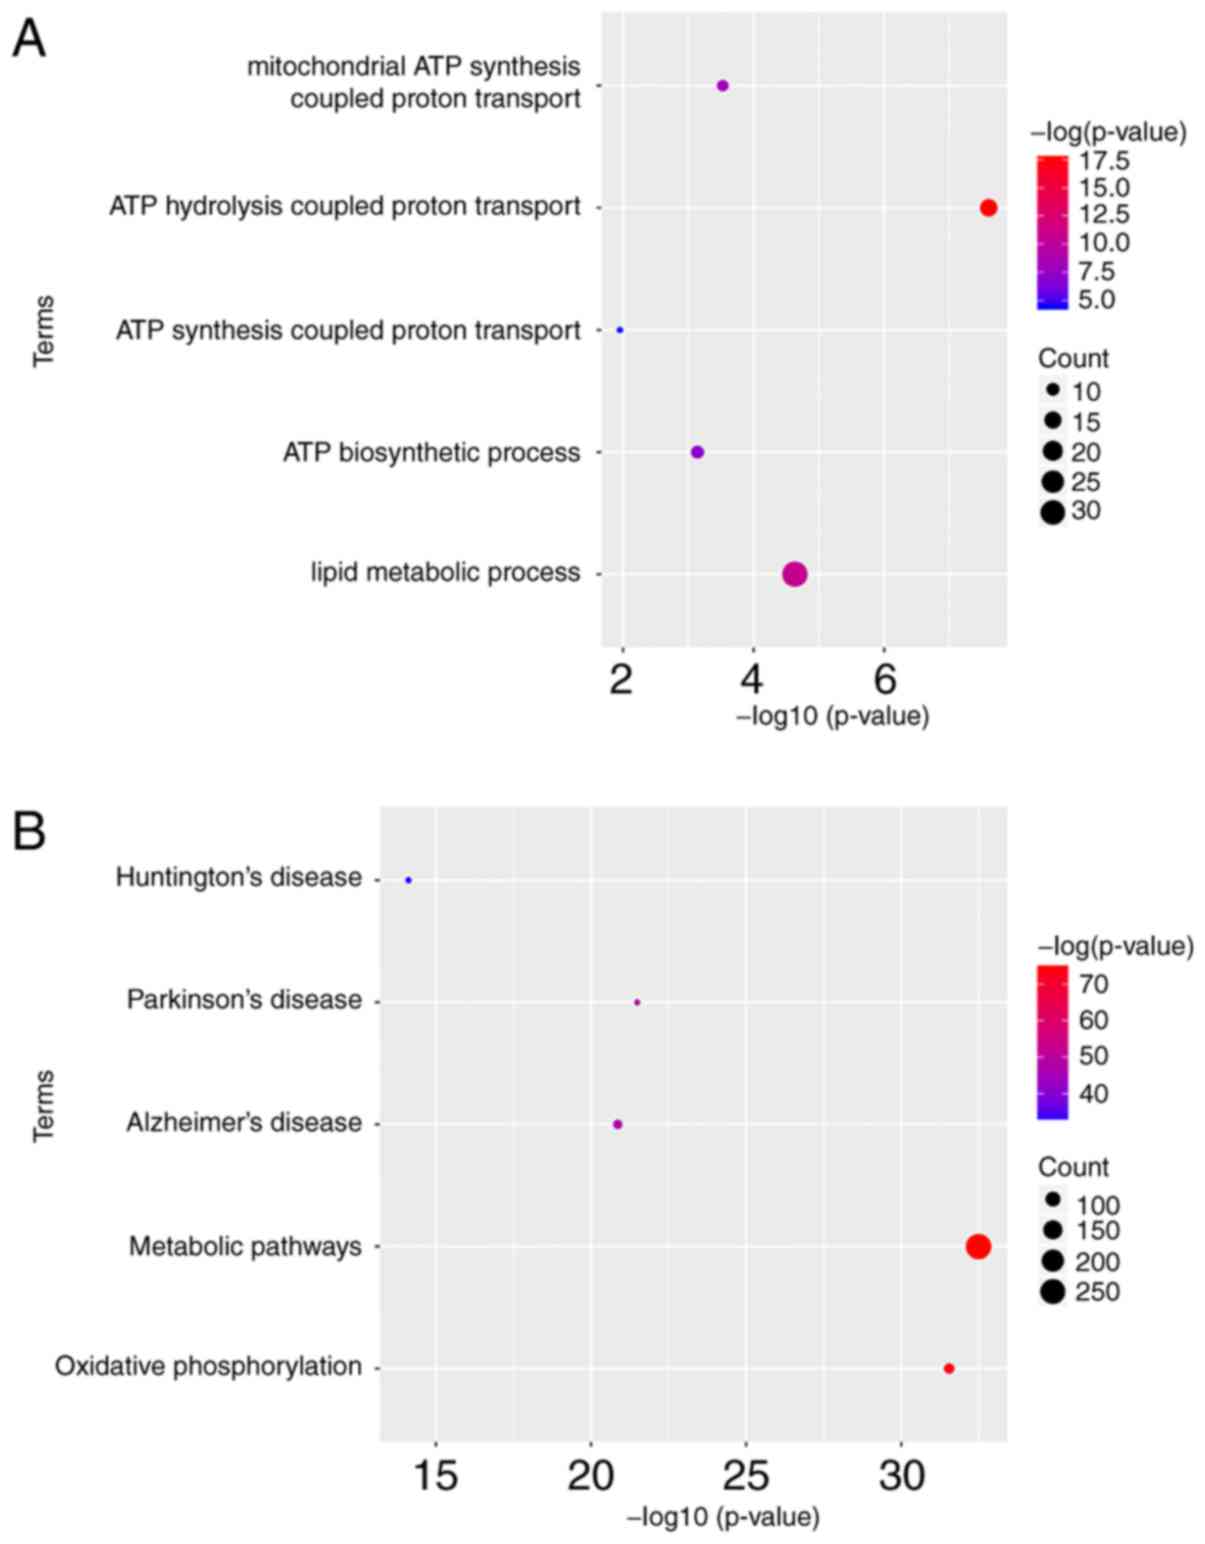
To obtain further insight into the function of DEGs
in hub module, they were uploaded to the DAVID database. GO
analysis results showed that ATP5A1 was significantly
enriched in biological process (BP), including ATP hydrolysis
coupled proton transport, lipid metabolic process, mitochondrial
ATP synthesis coupled proton transport and ATP biosynthetic
process. Moreover, ATP5A1 was overrepresented in five KEGG
pathways, including metabolic pathways, oxidative phosphorylation,
Parkinson's disease, Alzheimer's disease and Huntington's disease
(Fig. 8).
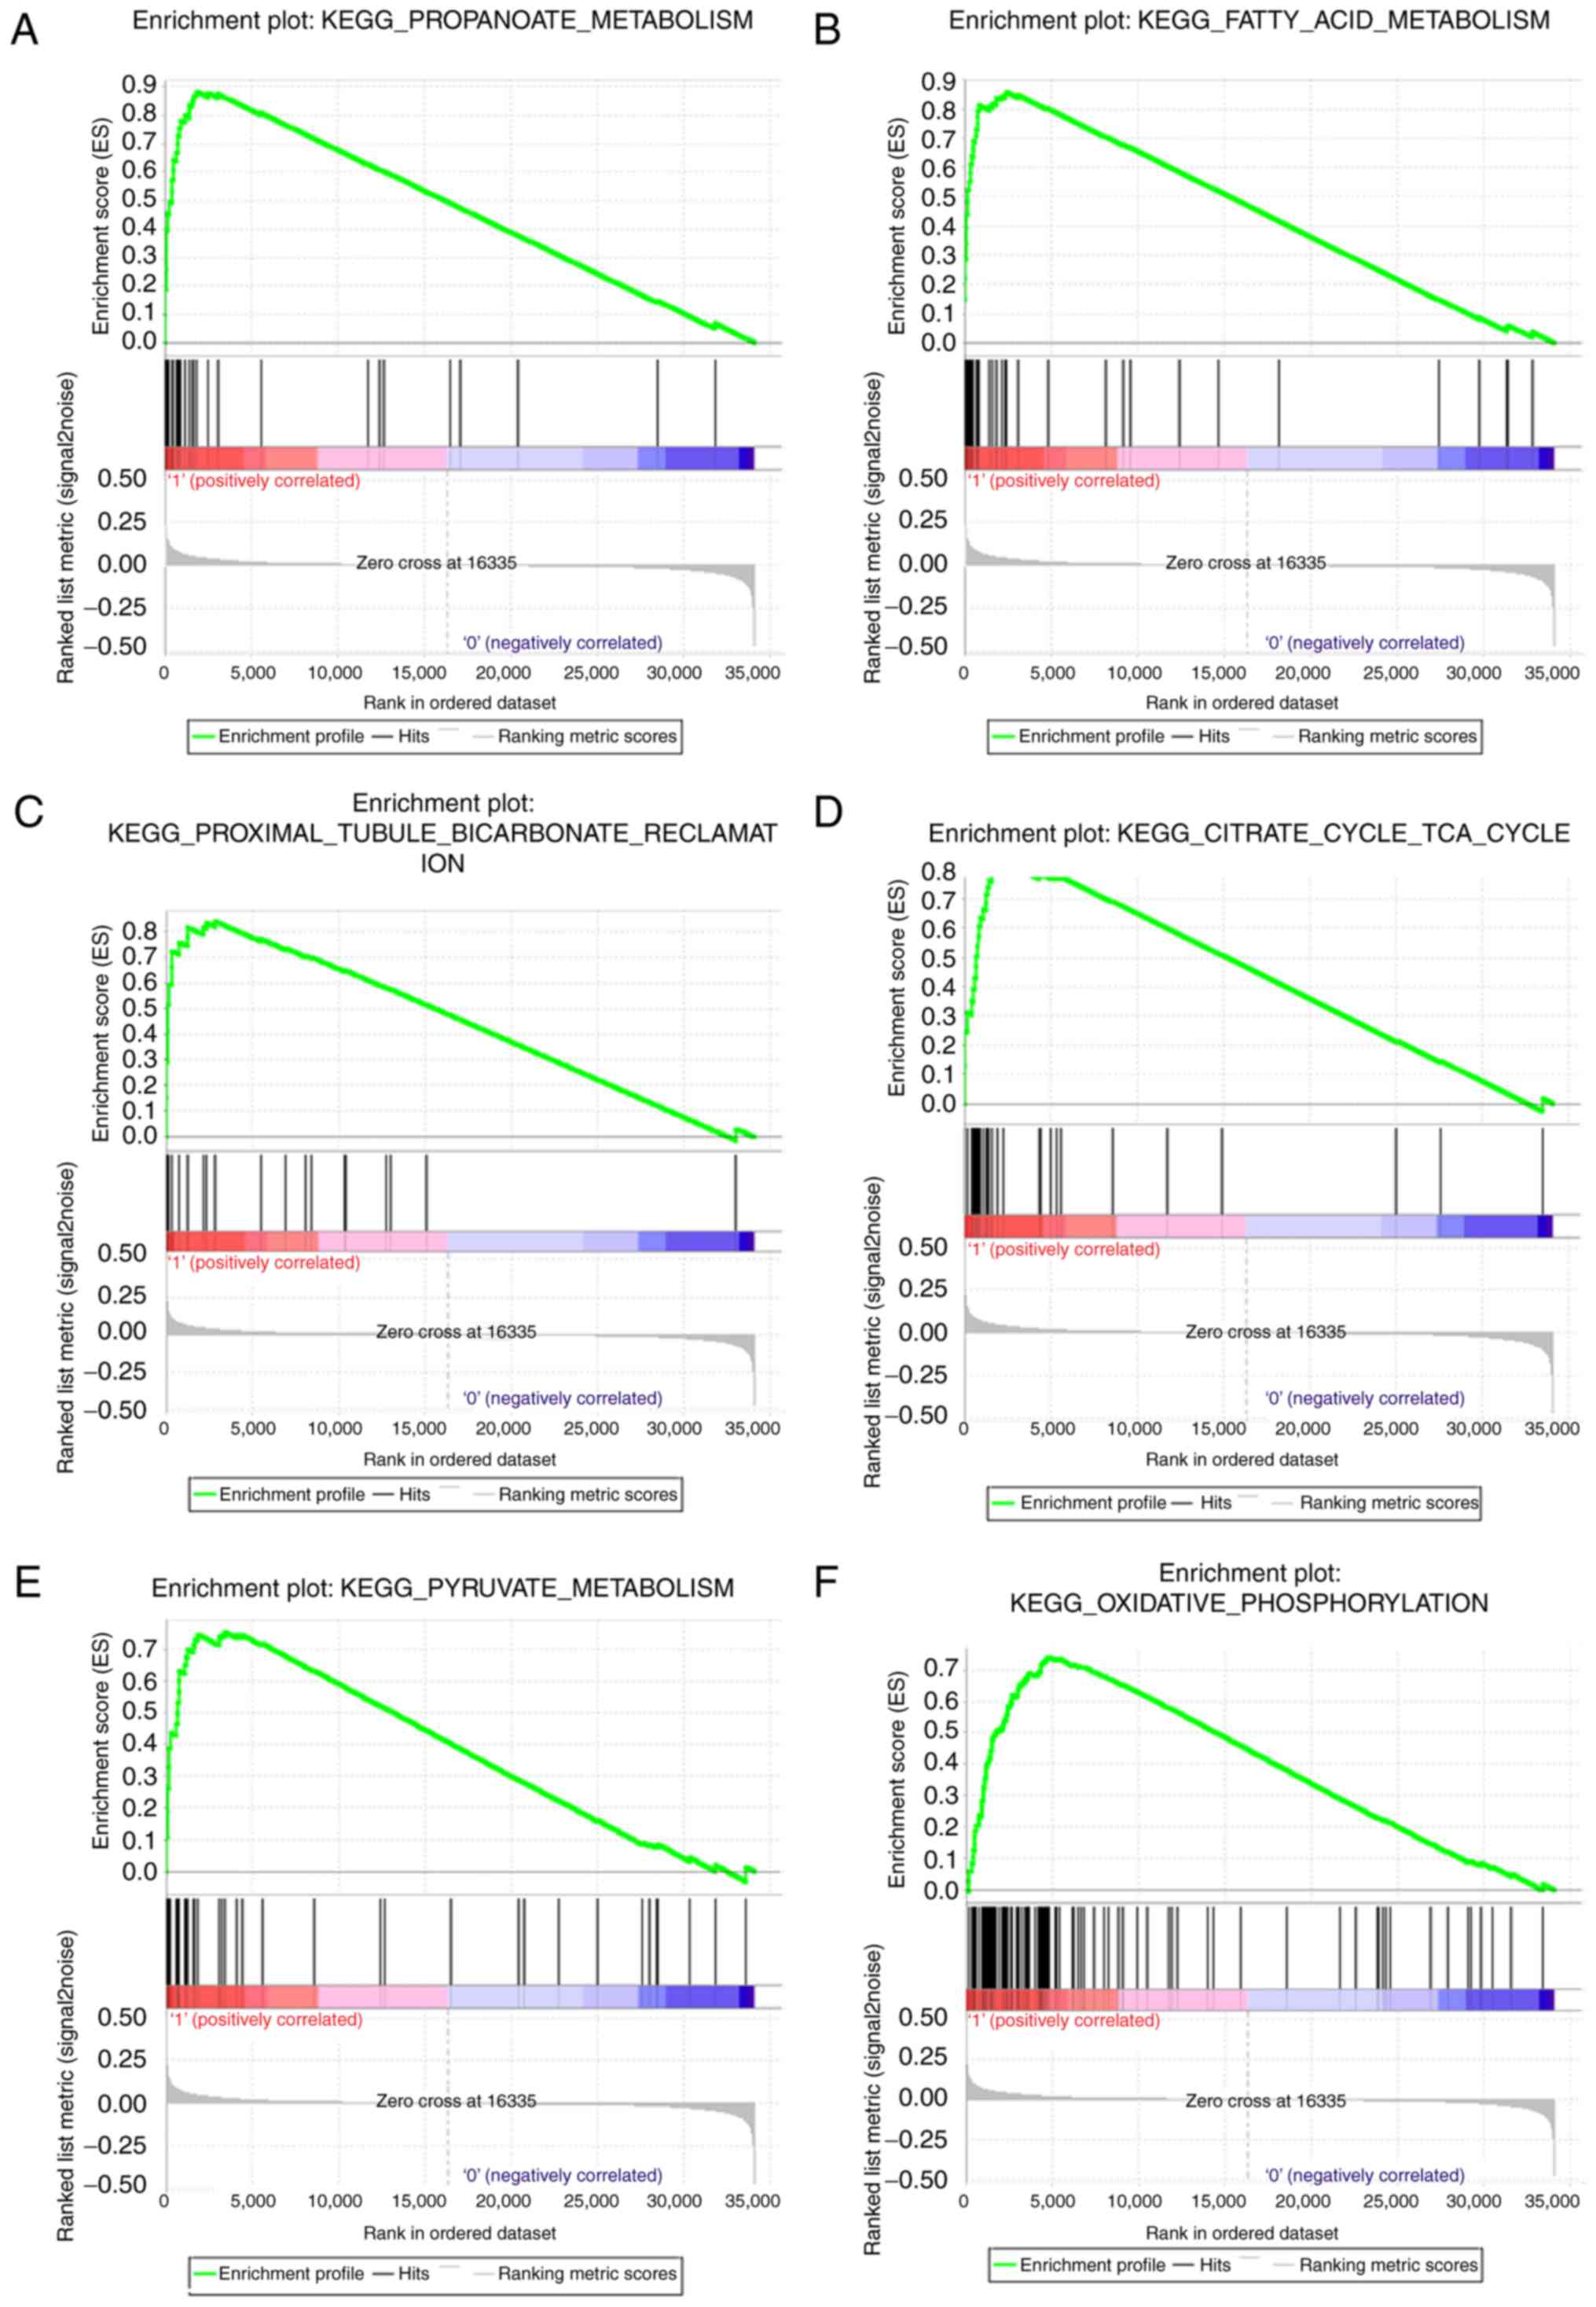
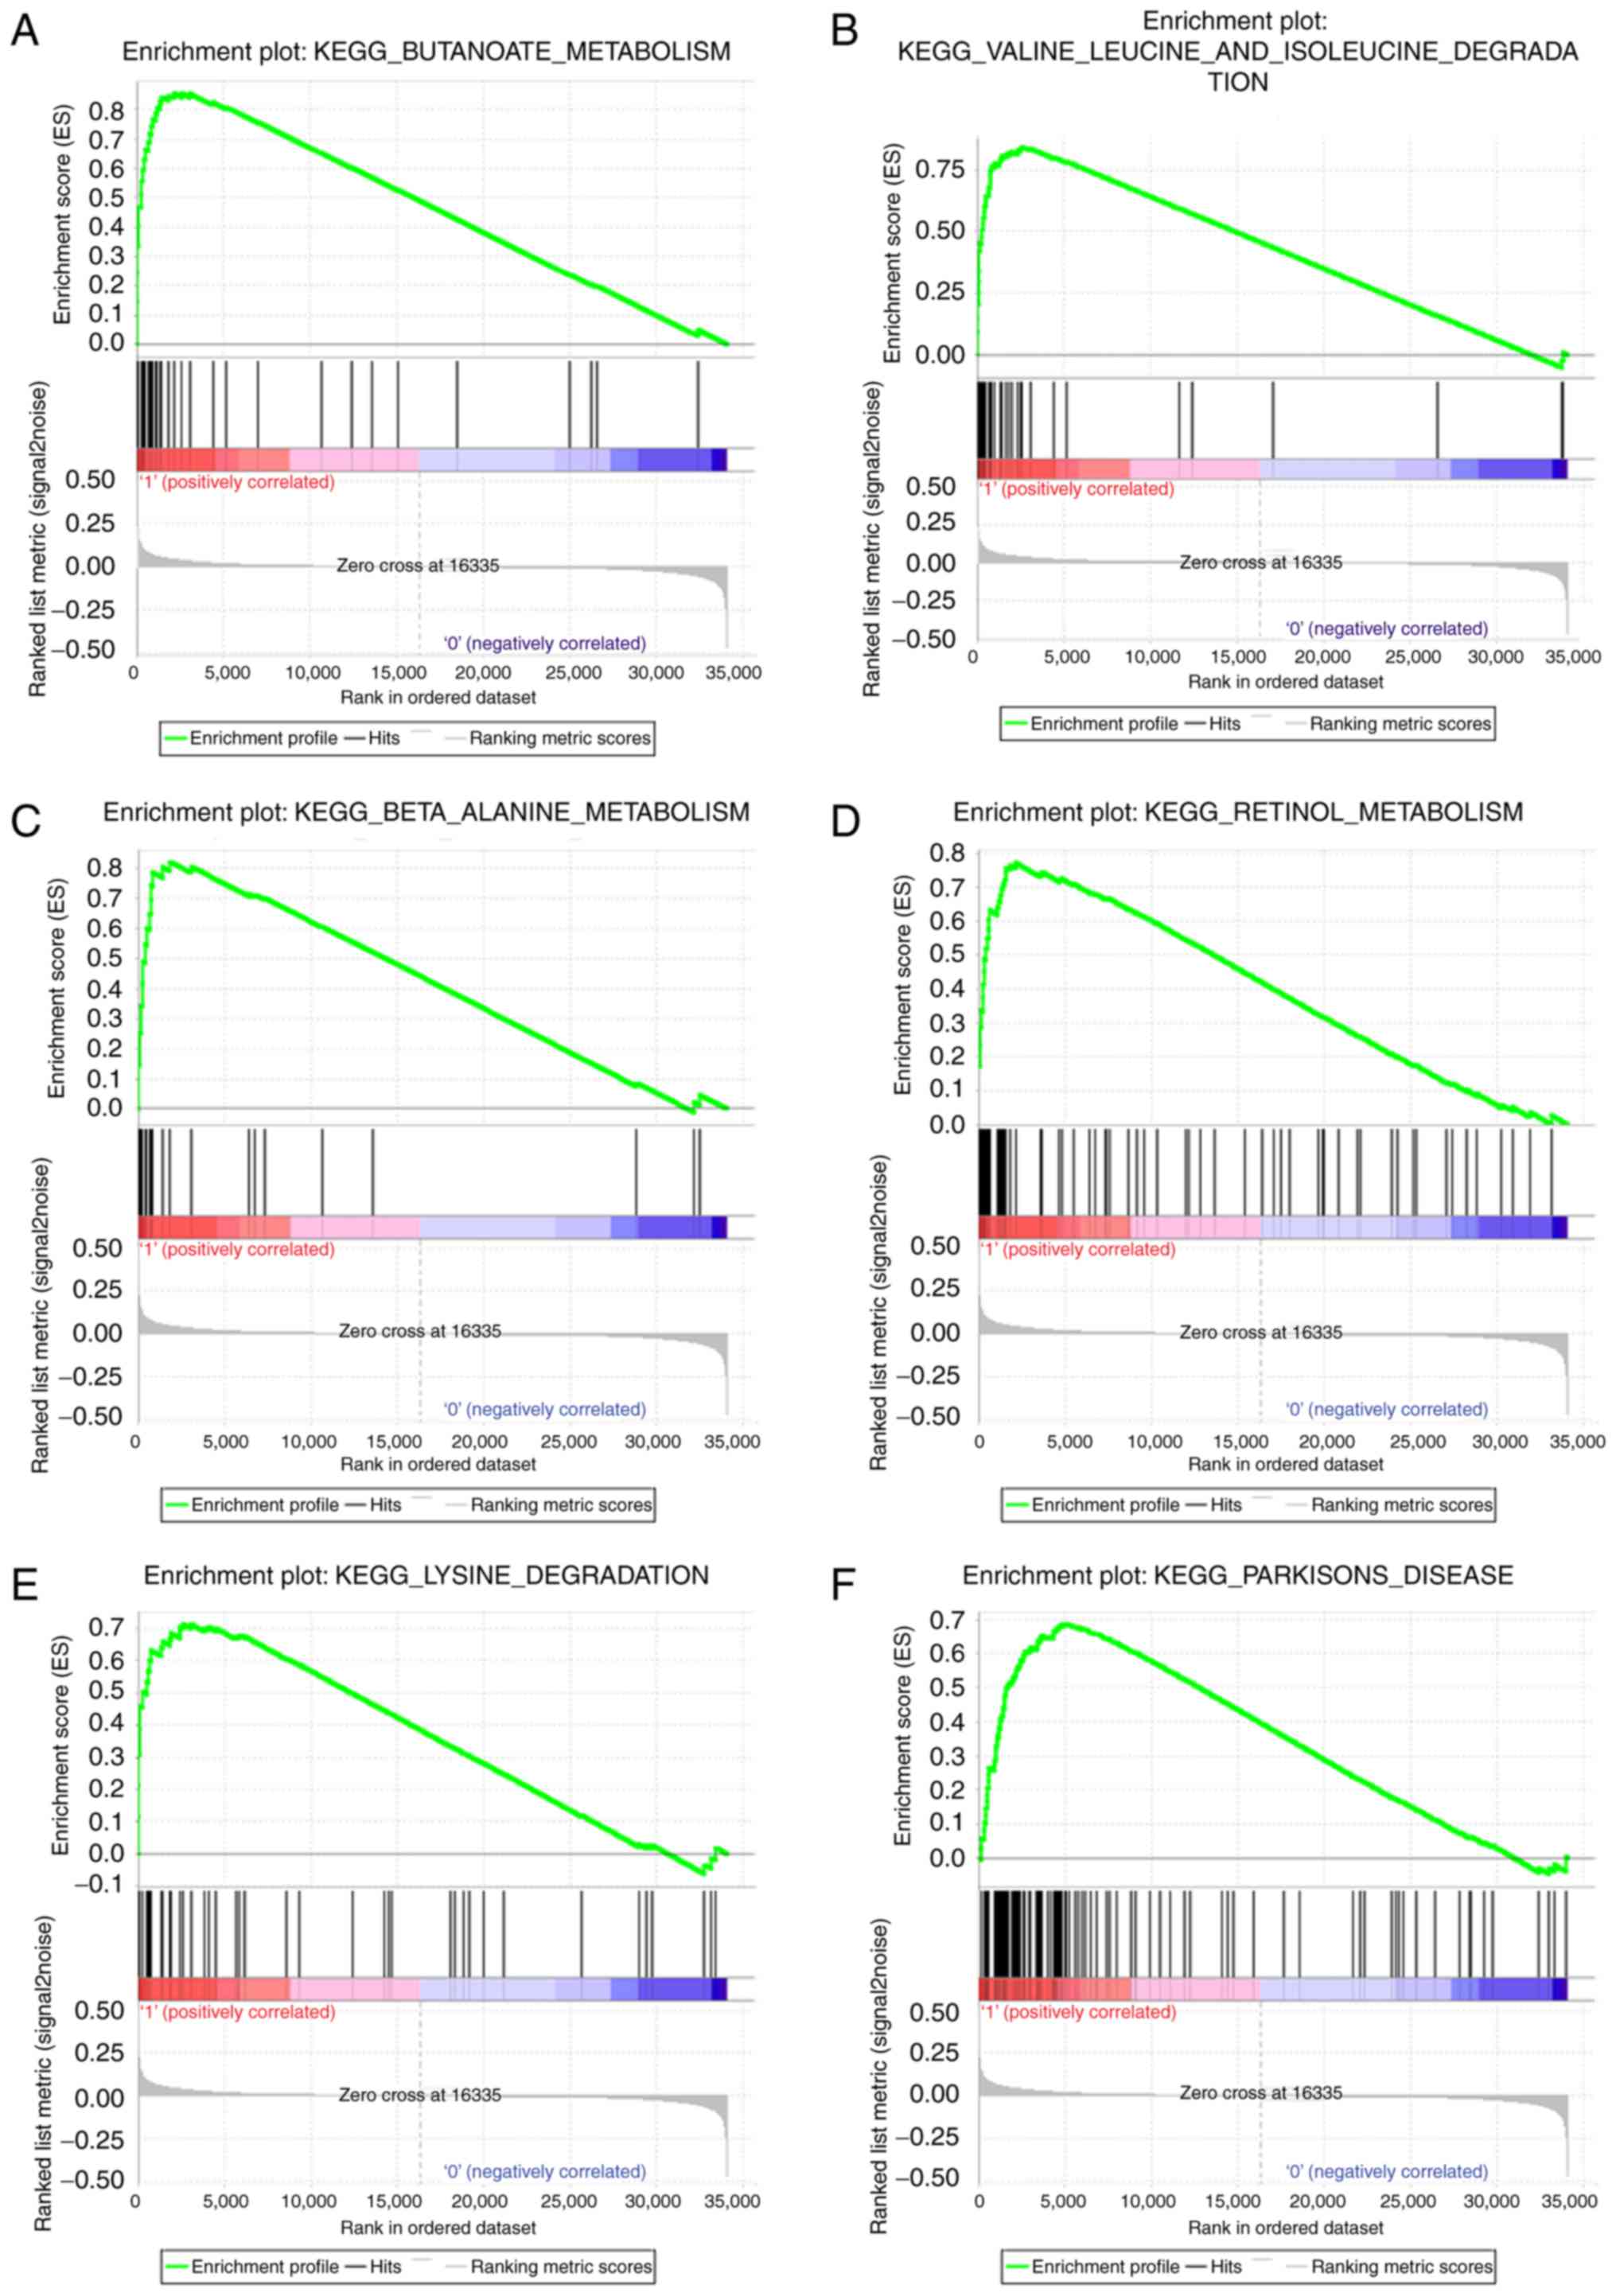
Gene set enrichment analysis
The pathway enrichment analysis of DAVID just used
differentially expressed genes, whereas, GSEA analysis used all
genes or probes in the chips regardless the genes were
differentially expressed or not, which could supplement other
evidence in pathway enrichment. Therefore, GSEA was performed using
a test set. To identify the potential function of ATP5A1 in ccRCC,
GSEA was conducted to search biological processes enriched in
ATP5A1 highly-expressed samples (Table
I). Twelve gene sets were enriched, including
‘PROPANOATE_METABOLISM’, ‘FATTY_ACID_METABOLISM’,
‘PROXIMAL_TUBULE_BICARBONATE_RECLAMATION’,
‘CITRATE_CYCLE_TCA_CYCLE’, ‘PYRUVATE_METABOLISM’,
‘OXIDATIVE_PHOSPHORYLATION’ in Fig.
9, and ‘BUTANOATE_METABOLISM’,
‘VALINE_LEUCINE_AND_ISOLEUCINE_DEGRADATION’,
‘BETA_ALANINE_METABOLISM’, ‘RETINOL_METABOLISM’,
‘LYSINE_DEGRADATION’, ‘PARKINSONS_DISEASE’ in Fig. 10.
 | Table I.GSEA report for biological processes
enriched in ATP5A1 highly-expressed samples. |
Table I.
GSEA report for biological processes
enriched in ATP5A1 highly-expressed samples.
| Name | Size | ES | P-value | Leading edge |
|---|
|
KEGG_PROPANOATE_METABOLISM | 33 | 0.881814 | 0 | tags=67%, list=5%,
signal=70% |
|
KEGG_FATTY_ACID_METABOLISM | 40 | 0.857978 | 0.004048583 | tags=68%, list=7%,
signal=72% |
|
KEGG_BUTANOATE_METABOLISM | 34 | 0.857119 | 0.008281574 | tags=62%, list=8%,
signal=67% |
|
KEGG_VALINE_LEUCINE_AND_ISOLEUCINE_DEGRADATION | 44 | 0.842412 | 0.004081633 | tags=80%, list=8%,
signal=86% |
|
KEGG_PROXIMAL_TUBULE_BICARBONATE_RECLAMATION | 23 | 0.839088 | 0.003831418 | tags=57%, list=8%,
signal=62% |
|
KEGG_CITRATE_CYCLE_TCA_CYCLE | 32 | 0.828914 | 0.010351967 | tags=66%, list=7%,
signal=70% |
|
KEGG_BETA_ALANINE_METABOLISM | 22 | 0.821555 | 0.004158004 | tags=59%, list=5%,
signal=62% |
|
KEGG_RETINOL_METABOLISM | 64 | 0.772034 | 0.008350731 | tags=36%, list=6%,
signal=38% |
|
KEGG_PYRUVATE_METABOLISM | 40 | 0.753944 | 0.019354839 | tags=55%, list=10%,
signal=61% |
|
KEGG_OXIDATIVE_PHOSPHORYLATION | 118 | 0.7403 | 0.03950104 | tags=66%, list=14%,
signal=77% |
|
KEGG_LYSINE_DEGRADATION | 44 | 0.713206 | 0.008130081 | tags=39%, list=8%,
signal=42% |
|
KEGG_PARKINSONS_DISEASE | 116 | 0.686723 | 0.020920502 | tags=63%, list=15%,
signal=74% |
|
KEGG_PEROXISOME | 76 | 0.685736 | 0.036734693 | tags=61%, list=14%,
signal=70% |
Discussion
ATP5A1 (ATP synthase, H+
transporting, mitochondrial F1 complex, α subunit 1, cardiac
muscle) encoding a subunit of mitochondrial ATP synthase plays a
critical role in catalyzing ATP synthesis. Only a few studies have
reported the function of ATP5A1. Xu and Li reported that
ATP5A1 and ATP5B, which plays an important role in
pathogenesis of glioblastoma, are highly expressed in glioblastoma
tumor cells and endothelial cells of microvascular proliferation
(20). Seth et al supposed
that higher levels of ATP5A1 were associated with certain
SNPs and with TP53 mutation. Moreover, highly-expressed
ATP5A1 occurs in chromosomal instability and may facilitate
tumor development along this pathway. Conversely, low levels of
ATP5A1 may facilitate development of tumors with
microsatellite instability (21).
As mitochondrial dysfunction often occurs in encephalopathy,
Jonckheere et al discovered a complex V ATP5A1 which
could cause fatal neonatal mitochondrial encephalopathy (22).
In this study, WGCNA was performed to identify gene
co-expression modules related with the progression of ccRCC. The
turquoise module was identified, and 13 hub genes were derived from
the module. Furthermore, relating the results of PPI network, only
ATP5A1 and NDUFV1 were hub nodes in both the co-expression module
and PPI network, indicating that the two hub genes had high
connection with clinical trait as well as vital biological
processes. In validation, ATP5A1 was more highly-correlated with
the clinical trait estimated by log rank test than any other genes
in the hub module.
As a tumor suppressor, ATP5A1 was correlated
with the pathological malignant of renal cell carcinoma (Fig. 6A and B). Ranking by pathological
malignancy and differentiation, clear cell renal cell carcinoma and
sacomatoid renal cell carcinoma were highly malignant, papillary
renal cell carcinoma and granular renal cell carcinoma were
moderately malignant and chromophobe renal cell carcinoma had low
malignancy (23). Thus, we found a
significant difference of the expression of ATP5A1 in
different pathological type of renal cell carcinoma. Also, through
the Oncomine database, we found a significant difference of the
expression of ATP5A1 in renal cortex and renal tissues
comparing with ccRCC tissues. Moreover, in the test set, we found a
trend that the expression of ATP5A1 decreased with the
increasing Furhman grade, but there is no statistic difference
between the 4 grades of ccRCC. However, the expression of
ATP5A1 of each grade was significantly upregulated compared
with normal kidneys (P<0.001), which also illustrated the
critical role of ATP5A1 in the progression of ccRCC.
Interestingly, we found that based on TCGA data, the expression of
ATP5A1 was significantly decreased with the progression of
ccRCC. To verify the results of the expression of ATP5A1 at
the transcriptional level, we used 12 pairs of ccRCC tissues and
paracancerous tissues to perform real-time PCR, and the results
showed that the expression of ccRCC tissues was significantly
downregulated comparing with the paracancerous tissues
(P<0.001). As shown in Figs. 6
and 7, the fold changes of
ATP5A1 were significant, indicating the differential
expression of ATP5A1 in transcriptional level. To obtain
further insight of translational level of the expression of
ATP5A1, we observed the immunohistochemistry staining of
ATP5A1 in both normal kidney and renal carcinoma in the
Human Protein Atlas database. We discovered that compared with
renal carcinoma tissue, the expression of ATP5A1 was
significantly upregulated in normal kidney tissue. Interestingly,
we found that the expression of ATP5A1 in glomeruli was
lower than renal tubules, representing that the function of
ATP5A1 might correlate with transmembrane and
transportation. As to the prognostic value, according to the GEPIA
database, we found that lower expression of ATP5A1 causes
lower survival rate and shorter overall survival time and
disease-free survival time, on the contrary, higher expression of
ATP5A1, as a protective tumor suppressor, causes higher
survival rate and longer survival time.
Considering the functional and pathway enrichment
analysis as well as GSEA, ATP5A1 was overrepresented in
metabolic pathways and oxidative phosphorylation. Many studies had
reported that mitochondrial DNA mutations leading to changes in
enzymes, may affect the process of oxidative phosphorylation, and
ultimately cause the occurrence of tumors (24–28).
Combing the subcellular location that ATP5A1 was mostly in
mitochondrion inner membrane and cell membrane and the gene
function in biological process, we could speculate the potential
role of ATP5A1 in the progression of ccRCC by regulating
important proteins of signaling pathways regarding oxidative
phosphorylation (29,30).
In conclusion, this study used systems of
biology-based WGCNA to construct a gene co-expression network, to
identify and validate network hub genes associated with the
progression of ccRCC. ATP5A1 was identified and validated in
association with the progression of human ccRCC probably by
regulating tumor-related phosphorylation.
Acknowledgements
The excellent technical assistance of Yuan Zhu,
Shanshan Zhang and Danni Shan is gratefully acknowledged. This
study was supported in part by grants from Zhongnan Hospital of
Wuhan University Science, Technology and Innovation Seed Fund
(grant nos. cxpy20160049 and cxpy20160010) and Natural Sciences
Foundation of Hubei Province (2014CFA006).
References
|
1
|
Cairns P: Renal cell carcinoma. Cancer
Biomark. 9:461–473. 2010. View Article : Google Scholar : PubMed/NCBI
|
|
2
|
Vera-Badillo FE, Templeton AJ, Duran I,
Ocana A, de Gouveia P, Aneja P, Knox JJ, Tannock IF, Escudier B and
Amir E: Systemic therapy for non-clear cell renal cell carcinomas:
A systematic review and meta-analysis. Eur Urol. 67:740–749. 2015.
View Article : Google Scholar : PubMed/NCBI
|
|
3
|
Heng DY, Mackenzie MJ, Vaishampayan UN,
Bjarnason GA, Knox JJ, Tan MH, Wood L, Wang Y, Kollmannsberger C,
North S, et al: Primary anti-vascular endothelial growth factor
(VEGF)-refractory metastatic renal cell carcinoma: Clinical
characteristics, risk factors, and subsequent therapy. Ann Oncol.
23:1549–1555. 2012. View Article : Google Scholar : PubMed/NCBI
|
|
4
|
Dahinden C, Ingold B, Wild P, Boysen G,
Luu VD, Montani M, Kristiansen G, Sulser T, Bühlmann P, Moch H, et
al: Mining tissue microarray data to uncover combinations of
biomarker expression patterns that improve intermediate staging and
grading of clear cell renal cell cancer. Clin Cancer Res. 16:88–98.
2010. View Article : Google Scholar : PubMed/NCBI
|
|
5
|
Gerlinger M, Horswell S, Larkin J, Rowan
AJ, Salm MP, Varela I, Fisher R, McGranahan N, Matthews N, Santos
CR, et al: Genomic architecture and evolution of clear cell renal
cell carcinomas defined by multiregion sequencing. Nat Genet.
46:225–233. 2014. View
Article : Google Scholar : PubMed/NCBI
|
|
6
|
Eckl J, Buchner A, Prinz PU, Riesenberg R,
Siegert SI, Kammerer R, Nelson PJ and Noessner E: Transcript
signature predicts tissue NK cell content and defines renal cell
carcinoma subgroups independent of TNM staging. J Mol Med (Berl).
90:55–66. 2012. View Article : Google Scholar : PubMed/NCBI
|
|
7
|
Tavazoie S, Hughes JD, Campbell MJ, Cho RJ
and Church GM: Systematic determination of genetic network
architecture. Nat Genet. 22:281–285. 1999. View Article : Google Scholar : PubMed/NCBI
|
|
8
|
Chou WC, Cheng AL, Brotto M and Chuang CY:
Visual gene-network analysis reveals the cancer gene co-expression
in human endometrial cancer. BMC Genomics. 15:3002014. View Article : Google Scholar : PubMed/NCBI
|
|
9
|
Wang F, Chang Y, Li J, Wang H, Zhou R, Qi
J, Liu J and Zhao Q: Strong correlation between ASPM gene
expression and HCV cirrhosis progression identified by
co-expression analysis. Dig Liver Dis. 49:70–76. 2017. View Article : Google Scholar : PubMed/NCBI
|
|
10
|
Clarke C, Madden SF, Doolan P, Aherne ST,
Joyce H, O'Driscoll L, Gallagher WM, Hennessy BT, Moriarty M, Crown
J, et al: Correlating transcriptional networks to breast cancer
survival: A large-scale coexpression analysis. Carcinogenesis.
34:2300–2308. 2013. View Article : Google Scholar : PubMed/NCBI
|
|
11
|
Horvath S and Dong J: Geometric
interpretation of gene coexpression network analysis. PLOS Comput
Biol. 4:e10001172008. View Article : Google Scholar : PubMed/NCBI
|
|
12
|
Mason MJ, Fan G, Plath K, Zhou Q and
Horvath S: Signed weighted gene co-expression network analysis of
transcriptional regulation in murine embryonic stem cells. BMC
Genomics. 10:3272009. View Article : Google Scholar : PubMed/NCBI
|
|
13
|
Yip AM and Horvath S: Gene network
interconnectedness and the generalized topological overlap measure.
BMC Bioinformatics. 8:222007. View Article : Google Scholar : PubMed/NCBI
|
|
14
|
Ravasz E, Somera AL, Mongru DA, Oltvai ZN
and Barabási AL: Hierarchical organization of modularity in
metabolic networks. Science. 297:1551–1555. 2002. View Article : Google Scholar : PubMed/NCBI
|
|
15
|
Szklarczyk D, Franceschini A, Wyder S,
Forslund K, Heller D, Huerta-Cepas J, Simonovic M, Roth A, Santos
A, Tsafou KP, et al: STRING v10: Protein-protein interaction
networks, integrated over the tree of life. Nucleic Acids Res.
43(D1): D447–D452. 2015. View Article : Google Scholar : PubMed/NCBI
|
|
16
|
Franceschini A, Lin J, von Mering C and
Jensen LJ: SVD-phy: Improved prediction of protein functional
associations through singular value decomposition of phylogenetic
profiles. Bioinformatics. 32:1085–1087. 2016. View Article : Google Scholar : PubMed/NCBI
|
|
17
|
Uhlén M, Fagerberg L, Hallström BM,
Lindskog C, Oksvold P, Mardinoglu A, Sivertsson Å, Kampf C,
Sjöstedt E, Asplund A, et al: Proteomics. Tissue-based map of the
human proteome. Science. 347:12604192015. View Article : Google Scholar : PubMed/NCBI
|
|
18
|
Dennis G Jr, Sherman BT, Hosack DA, Yang
J, Gao W, Lane HC and Lempicki RA: DAVID: Database for Annotation,
Visualization, and Integrated Discovery. Genome Biol. 4:32003.
View Article : Google Scholar
|
|
19
|
Shannon P, Markiel A, Ozier O, Baliga NS,
Wang JT, Ramage D, Amin N, Schwikowski B and Ideker T: Cytoscape: A
software environment for integrated models of biomolecular
interaction networks. Genome Res. 13:2498–2504. 2003. View Article : Google Scholar : PubMed/NCBI
|
|
20
|
Xu G and Li JY: ATP5A1 and ATP5B are
highly expressed in glioblastoma tumor cells and endothelial cells
of microvascular proliferation. J Neurooncol. 126:405–413. 2016.
View Article : Google Scholar : PubMed/NCBI
|
|
21
|
Seth R, Keeley J, Abu-Ali G, Crook S,
Jackson D and Ilyas M: The putative tumour modifier gene ATP5A1 is
not mutated in human colorectal cancer cell lines but expression
levels correlate with TP53 mutations and chromosomal instability. J
Clin Pathol. 62:598–603. 2009. View Article : Google Scholar : PubMed/NCBI
|
|
22
|
Jonckheere AI, Renkema GH, Bras M, Van den
Heuvel LP, Hoischen A, Gilissen C, Nabuurs SB, Huynen MA, de Vries
MC, Smeitink JA, et al: A complex V ATP5A1 defect causes fatal
neonatal mitochondrial encephalopathy. Brain. 136:1544–1554. 2013.
View Article : Google Scholar : PubMed/NCBI
|
|
23
|
Bata P, Gyebnar J, Tarnoki DL, Tarnoki AD,
Kekesi D, Szendroi A, Fejer B, Szasz AM, Nyirady P, Karlinger K, et
al: Clear cell renal cell carcinoma and papillary renal cell
carcinoma: Differentiation of distinct histological types with
multiphase CT. Diagn Interv Radiol. 19:387–392. 2013.PubMed/NCBI
|
|
24
|
Arnold RS, Fedewa SA, Goodman M, Osunkoya
AO, Kissick HT, Morrissey C, True LD and Petros JA: Bone metastasis
in prostate cancer: Recurring mitochondrial DNA mutation reveals
selective pressure exerted by the bone microenvironment. Bone.
78:81–86. 2015. View Article : Google Scholar : PubMed/NCBI
|
|
25
|
Fang Y, Huang J, Zhang J, Wang J, Qiao F,
Chen HM and Hong ZP: Detecting the somatic mutations spectrum of
Chinese lung cancer by analyzing the whole mitochondrial DNA
genomes. Mitochondrial DNA. 26:56–60. 2015. View Article : Google Scholar : PubMed/NCBI
|
|
26
|
Li LH, Kang T, Chen L, Zhang W, Liao Y,
Chen J and Shi Y: Detection of mitochondrial DNA mutations by
high-throughput sequencing in the blood of breast cancer patients.
Int J Mol Med. 33:77–82. 2014. View Article : Google Scholar : PubMed/NCBI
|
|
27
|
Hashimoto M, Bacman SR, Peralta S, Falk
MJ, Chomyn A, Chan DC, Williams SL and Moraes CT: MitoTALEN: A
general approach to reduce mutant mtDNA loads and restore oxidative
phosphorylation function in mitochondrial dseases. Mol Ther.
23:1592–1599. 2015. View Article : Google Scholar : PubMed/NCBI
|
|
28
|
Bonora E, Porcelli AM, Gasparre G, Biondi
A, Ghelli A, Carelli V, Baracca A, Tallini G, Martinuzzi A, Lenaz
G, et al: Defective oxidative phosphorylation in thyroid oncocytic
carcinoma is associated with pathogenic mitochondrial DNA mutations
affecting complexes I and III. Cancer Res. 66:6087–6096. 2006.
View Article : Google Scholar : PubMed/NCBI
|
|
29
|
Cheng L, Lin H, Hu Y, Wang J and Yang Z:
Gene function prediction based on the Gene Ontology hierarchical
structure. PLoS One. 9:e1071872014. View Article : Google Scholar : PubMed/NCBI
|
|
30
|
Du J, Yuan Z, Ma Z, Song J, Xie X and Chen
Y: KEGG-PATH: Kyoto encyclopedia of genes and genomes-based pathway
analysis using a path analysis model. Mol Biosyst. 10:2441–2447.
2014. View Article : Google Scholar : PubMed/NCBI
|