Introduction
Esophageal carcinoma is the sixth most malignant
tumor worldwide, and esophageal squamous cell carcinoma (ESCC) is a
major pathological subtype in China (1). Despite improvements in comprehensive
therapeutics, the prognosis for ESCC remains poor, with a 5-year
survival rate of less than 40% (2).
Previous studies have suggested that 30 to 90% of ESCC patients
exhibited a high epidermal growth factor receptor (EGFR) expression
level (3,4). However, whether EGFR expression can
predict benefits from EGFR TKIs in ESCC is still controversial.
Hara et al explored the anticancer effects of gefitinib in
ESCC cell lines, and their results suggested that some cell lines
with high EGFR level exhibited obvious sensitivity and cell growth
inhibition both in vivo and in vitro towards
gefitinib (5). However, a phase III
multicenter double-blind placebo-controlled randomized trial
revealed that the use of gefitinib as a second-line treatment in
ESCC in unselected patients did not improve overall survival
(6). There was also no clear
evidence that patients with ESCC benefit from blocking EGFR with
monoclonal antibodies. Altogether, the use of EGFR TKI in ESCC is
discouraged at present.
Recently, genomics research of ESCC revealed many
copy number variations (CNVs) in genes, such as SOX2, PI3KCA,
CCND1, FGFR. The CNVs in these genes may prompt new therapeutic
targets for ESCC treatment (7).
Fibroblast growth factor receptor (FGFR) pathway activation was
revealed to be one of the mechanisms that contribute to resistance
to various targeted therapeutics including EGFR TKIs in a variety
of solid tumors. Zhang et al reported that a
cetuximab-sensitive ESCC xenograft model developed resistance to
cetuximab due to FGFR2 gene amplification and
overexpression. Inhibition of FGFR2 signaling restored its
sensitivity to cetuximab. The antitumor effect may be attributed to
inhibition of AKT phosphorylation (8). Although FGFR amplification, mutation,
and fusion are the main mechanisms mediating FGFR activation and
promoting solid tumor development (9,10),
tyrosine phosphorylation of FGFR plays a key role in enhancing the
activity of the protein. The activation of fibroblast growth factor
receptor 1 (FGFR1) can be enhanced by phosphorylation of Y653/654
in the activation loop (11). Thus,
inhibiting FGFR phosphorylation would be a promising approach for
cancer therapy; and AZD4547, a pan-FGFR inhibitor, can strongly
inhibit FGFR phosphorylation and downstream signaling at the
cellular level (12).
Epithelial-mesenchymal transition (EMT) is an
essential mechanism during development and tissue repair (13). EMT also contributes to primary and
acquired resistance to various anticancer drugs. Previous studies
have suggested that FGFR signaling pathways can induce EMT in head
and neck squamous cell carcinomas, and maintain the EMT phenotype
in breast cancer cells (14,15).
In the present study, we revealed that p-FGFR1 was predominantly
expressed in cells with a mesenchymal phenotype. AZD4547 enhanced
the sensitivity of ESCC cells with mesenchymal phenotype to
gefitinib. Thus, p-FGFR1 not only serves as an EMT marker, but it
can also be used as an efficient biomarker to aptly combine AZD4547
and gefitinib in ESCC treatment.
Materials and methods
Patients
Patients diagnosed with ESCC who underwent
esophagectomy from December 2008 to Novomber 2014 were enrolled.
The cohort included a total of 87 cases, with 73 males and 14
females. The median age was 60. Participants who smoked >1
pack/day for >1 year were considered smokers. A total of 54
participants were smokers and the rest were non-smokers. The
clinical stage and pathological grade of differentiation were based
on the eighth edition of the AJCC esophageal cancer staging
criteria. The number of patients with poor, moderate, and good
differentiation were 21, 36, and 16, respectively. All patients
provided written informed consent for biomarker analysis.
Cell lines and antibodies
Human ESCC cell lines TE10 and EC9706 were purchased
from the American Type Culture Collection and cultured in
Dulbecco's modified Eagle's medium (HyClone; Thermo Fisher
Scientific, Logan, UT, USA) supplemented with 10% fetal bovine
serum (FBS), 100 µg/ml of penicillin, and 100 mg/ml of streptomycin
in a humidified incubator at 37°C, with 5% CO2.
Exponentially growing cells were trypsinized for subculture or
further experiments. CCK-8 kits were purchased from Dojindo
Molecular Techologies, Inc. (Kumamoto, Japan). The following
primary antibodies were obtained from Cell Signaling Technology
(Danvers, MA, USA): p-EGF (Tyr1068) (1:1,000 dilution; cat. no.
3777); p-p44/42 MAPK (Erk1/2) (Thr202/Tyr204) (1:2,000 dilution;
cat. no. 4370); p-Akt (Ser473) (1:1,000 dilution; cat. no. 9271);
horseradish peroxidase (HRP)-conjugated anti-rabbit (1:5,000
dilution; cat. no. 7074); and HRP-conjugated anti-mouse (1:5,000
dilution; cat. no. 7076). The primary antibody against p-FGFR1Y654
(1:500 dilution; cat. no. ab59194) and β-actin (1:5,000 dilution;
cat. no. ab8226) were purchased from Abcam (Cambridge, UK). TGF-β
was obtained from Prospect Inc. (Lebanon, TN, USA). Both AZD457 and
gefitinib were purchased from AstraZeneca (Cambridge, UK).
Immunohistochemistry
Tissues were fixed overnight in 4% paraformaldehyde
and embedded in paraffin. Sections (3 µM) were deparaffinized and
hydrated before peroxide blocking with 3%
H2O2 in methanol at 4°C for 20 min. The
rabbit polyclonal antibody against p-FGFR1Y654 was applied at a
final concentration of 1.5 g/ml and incubated for 90 min at 37°C.
After incubation with the biotin-labeled goat anti-rabbit IgG
pre-diluted by the supplier (Biotin-Streptavidin HRP Detection
Systems; cat. no. SP-9001; Beijing Zhongshan Golden Bridge
Biological Technology, Co., Ltd., Beijing, China) at room
temperature for 1 h and subsequent application of a streptavidin
horseradish peroxidase enzyme complex for 30 min, the sections were
stained with diaminobenzidine for 15 min. The specimens were
evaluated by two skilled microscopists who had no knowledge of the
clinical details of the cases. Only clear staining of the cytoplasm
and/or nuclei was considered positive. The expression score of
p-FGFR1Y654 was represented as the percentage of positive tumor
cells irrespective of staining intensities/slide (0–100%).
CCK-8 assay. Exponentially growing TE10 and EC9706
cells were seeded into 96-well plates (3,000 cells/well). After
incubation overnight, the cells were treated with gefitinib at
concentrations ranging from 0.125-8 µM with or without the FGFR
inhibitor AZD4547 (500 nM) for 6 days. Cell viability was assessed
using the colorimetric readings obtained at 450 nm after incubation
with CCK-8 for 2 h (Bio-Rad Laboratories, Inc., Hercules, CA, USA).
All assays were performed independently at least three times. The
IC50 values were calculated using the median-effect
equation proposed by Chou-Talalay (16).
Colony formation assays
Cells were treated with gefitinib with or without
AZD4547 for 48 h before being seeded in 60 mm petri dishes
(3×10³ cells/petri dish). After 14 days, all petri
dishes were washed with PBS, fixed with 4% formaldehyde, and
stained with 0.1% crystal violet. The colonies that contained
>50 cells were counted.
Gene expression analysis of 26
esophageal carcinoma cell lines
Gene expression data from esophageal carcinoma cell
lines were obtained from the CCLE database
(CCLE_Expression_Entrez_2012-09-29.gct; http://www.broadinstitute.org/ccle/home). Unsupervised
hierarchical clustering based on eight mesenchymal markers was
performed on 26 esophageal carcinoma cell lines using the Cluster
3.0 program in the Biopython package (http://www.biopython.org) (17) based on eight mesenchymal markers and
was visualized using JAVA TreeView program (http://jtreeview.sourceforge.net/) (18). Ten cell lines including TE10 were
classified as mesenchymal-like cell lines. The Kruskall-Wallis test
was used to determine the mRNA expression difference of four
subtypes of FGFR and ERBB3 between epithelial and mesenchymal like
cell lines.
Quantitative RT-PCR
Total RNA was isolated with TRIzol and cDNA was
synthesized using TaqMan reverse transcription reagents. Real-time
PCR was performed in duplicate in three independent experiments
using SYBR Green PCR Master Mix on the CFX96™ Real-Time
System (Bio-Rad Laboratories, Inc.). GAPDH was used as an
endogenous normalization control. The primers used are listed in
Table I.
 | Table I.The list of primers used in real-time
quantitative PCR. |
Table I.
The list of primers used in real-time
quantitative PCR.
| Gene | Sequence
(5′-3′) | Tm | PrimerBankID |
|---|
| hGAPDH |
5′-GGAGCGAGATCCCTCCAAAAT | 61.6 | 378404907c1 |
| hGAPDH |
5′-GGCTGTTGTCATACTTCTCATGG | 60.9 |
|
|
Vimentin |
5′-AGTCCACTGAGTACCGGAGAC | 62.4 | 240849334c2 |
|
Vimentin |
5′-CATTTCACGCATCTGGCGTTC | 62.5 |
|
|
E-cadherin |
5′-ATTTTTCCCTCGACACCCGAT | 61.5 | 169790842c2 |
|
E-cadherin |
5′-TCCCAGGCGTAGACCAAGA | 61.9 |
|
| Twist1 |
5′-GTCCGCAGTCTTACGAGGAG | 61.7 | 4507741a1 |
| Twist1 |
5′-GCTTGAGGGTCTGAATCTTGCT | 62.3 |
|
| Slug |
5′-CGAACTGGACACACATACAGTG | 60.9 | 324072669c1 |
| Slug |
5′-CTGAGGATCTCTGGTTGTGGT | 60.9 |
|
Flow cytometric analysis
Cells were left to adhere overnight before being
treated with the indicated drugs for 24 h. Cells were then washed
twice with phosphate-buffered saline and suspended in pre-chilled
70% alcohol for immobilization overnight. After digestion with 100
µg/ml of RNase A at 37°C for 30 min, 50 µg/ml of propidium iodide
was added to the cells for 30 min in the dark. The fluorescence
intensity of each cell was then assessed using the
MoFlo™ XDP cell sorter (Beckman Coulter, Inc., Brea, CA,
USA).
Western blotting assays
Cells were lysed in RIPA buffer (Beyotime Institute
of Biotechnology, Jiangsu, China; cat. no. 2010ES60) on ice for 10
min. Protein supernatant was isolated from whole cell lysates by
centrifugation at 12,000 × g at 4°C. A total of 50 µg of protein
from each sample was separated using 10% SDS-PAGE and electrically
transferred to a PVDF membrane (EMD Millipore, Billerica, MA, USA).
Non-specific binding was blocked with 5% bovine serum albumin (BSA)
at 37°C before blotting with the indicated antibodies, and
subsequent detection via Pierce™ ECL Western Blotting
Substrate (Thermo Fisher Scientific, Rockford, IL, USA; cat. no.
32106). β-actin was used as the loading control. Signal intensity
with background correction was quantified using the Quantity One
software (Bio-Rad Laboratories, Inc.).
Statistical analysis
A Chi-square test was used to determine the
association between the expression of p-FGFR1 and
clinicopathological characteristics. All data are represented as
the mean ± standard deviation. Each experiment was repeated at
least three times. Significance was determined using two-tailed
unpaired Student's t-tests. One-way ANOVA was used for comparisons
between groups in cases of >2 groups and Bonferroni correction
was performed for multiple comparisons. P-values <0.05 were
considered to be statistically significant.
Results
Phosphorylation level of FGFR1 in ESCC
cell lines and tissues
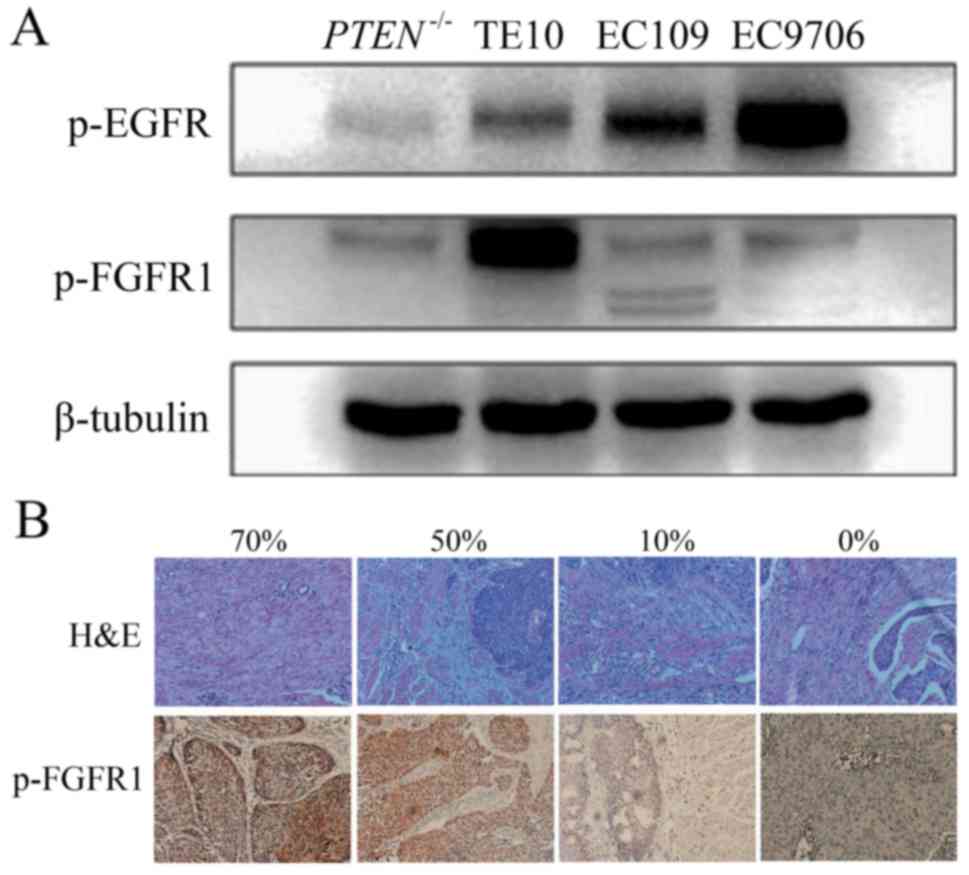
To determine if p-FGFR1 is distributed in ESCC, we
first examined the phosphorylation level of FGFR1 in ESCC tissue
samples from patients and four human ESCC cell lines, namely TE10,
Eca109, EC9706 and PTEN-/-(PTEN knockout Eca109). A high level of
p-FGFR1 was observed in TE10 cells, and a low expression was
observed in the other cell lines (Fig.
1A). In addition, the level of p-FGFR1 in tissue samples was
detected by IHC staining in 87 cases with ESCC (Fig. 1B). The 75% quantile of p-FGFR1
expression level was 30%. The patients with p-FGFR1Y654 expression
>30% were categorized as the high-expression group which was
comprised of 26 cases, and the rest were categorized as the
low-expression group containing 61 cases. Among all tested
clinicopathological characteristics, the p-FGFR1 expression level
was only related to tumor location. The proportion of lesions
located in the lower segment of the esophagus was significantly
higher in the high-expression group compared to the low-expression
group (26.9 vs. 8.2%, P=0.003) (Table
II).
| Table II.Baseline characteristics of the ESCC
patients and associations with p-FGFR1 expression. |
Table II.
Baseline characteristics of the ESCC
patients and associations with p-FGFR1 expression.
|
| p-FGFR1
expression |
|
|---|
|
|
|
|
|---|
| Factors | <30% | ≥30% | P-value |
|---|
| Sex |
|
| 0.450 |
|
Female | 11 (18.0) | 3 (11.5) |
|
|
Male | 50 (82.0) | 23 (88.5) |
|
| Age (years) |
|
| 0.251 |
|
<60 | 27 (44.3) | 15 (57.7) |
|
|
≥60 | 34 (55.7) | 11 (42.3) |
|
| Smoking |
|
| 0.062 |
|
Non-smoker | 27 (44.3) | 6 (23.1) |
|
|
Smoker | 34 (55.7) | 20 (76.9) |
|
| Drinking |
|
| 0.232 |
|
Non-drinker | 32 (52.5) | 10 (38.5) |
|
|
Drinker | 29 (47.5) | 16 (61.5) |
|
| Anatomical
site |
|
| 0.003a |
|
Upper | 9 (14.8) | 9 (34.6) |
|
|
Middle | 47 (77.0) | 10 (38.5) |
|
|
Distal | 5 (8.2) | 7 (26.9) |
|
| T |
|
| 0.665a |
| T2 | 6 (9.8) | 3 (11.5) |
|
| T3 | 40 (65.6) | 19 (73.1) |
|
| T4 | 15 (24.6) | 4 (15.4) |
|
| N |
|
| 0.880 |
| N0 | 15 (24.6) | 6 (23.1) |
|
|
N1-N3 | 46 (75.4) | 20 (76.9) |
|
| Stage |
|
| 0.320 |
|
I–II | 18 (29.5) | 5 (19.2) |
|
|
III–IV | 43 (70.5) | 21 (80.8) |
|
| Complications after
surgery |
|
| 0.446 |
| No | 42 (68.9) | 20 (76.9) |
|
|
Yes | 19 (31.1) | 6 (23.1) |
|
| Grade |
|
| 0.782a |
| Gx | 10 (16.4) | 4 (15.4) |
|
| G3 | 13 (21.3) | 8 (30.8) |
|
| G2 | 27 (44.3) | 9 (34.6) |
|
| G1 | 11 (18.0) | 5 (19.2) |
|
| Serum
CEA level before surgery | 0 (0.00–4.68) | 1.14
(0.00–8.05) | 0.127 |
AZD4547 improves the sensitivity of
ESCC cell lines to gefitinib
AZD4547 potently inhibited p-FGFR1 and downstream
signaling through FRS2 and PLCg at the cellular level (12). A recent study demonstrated that the
FGFR pathway was critical for carcinogenesis of hepatocellular
carcinoma, and AZD4547 may be beneficial for the treatment of HCC
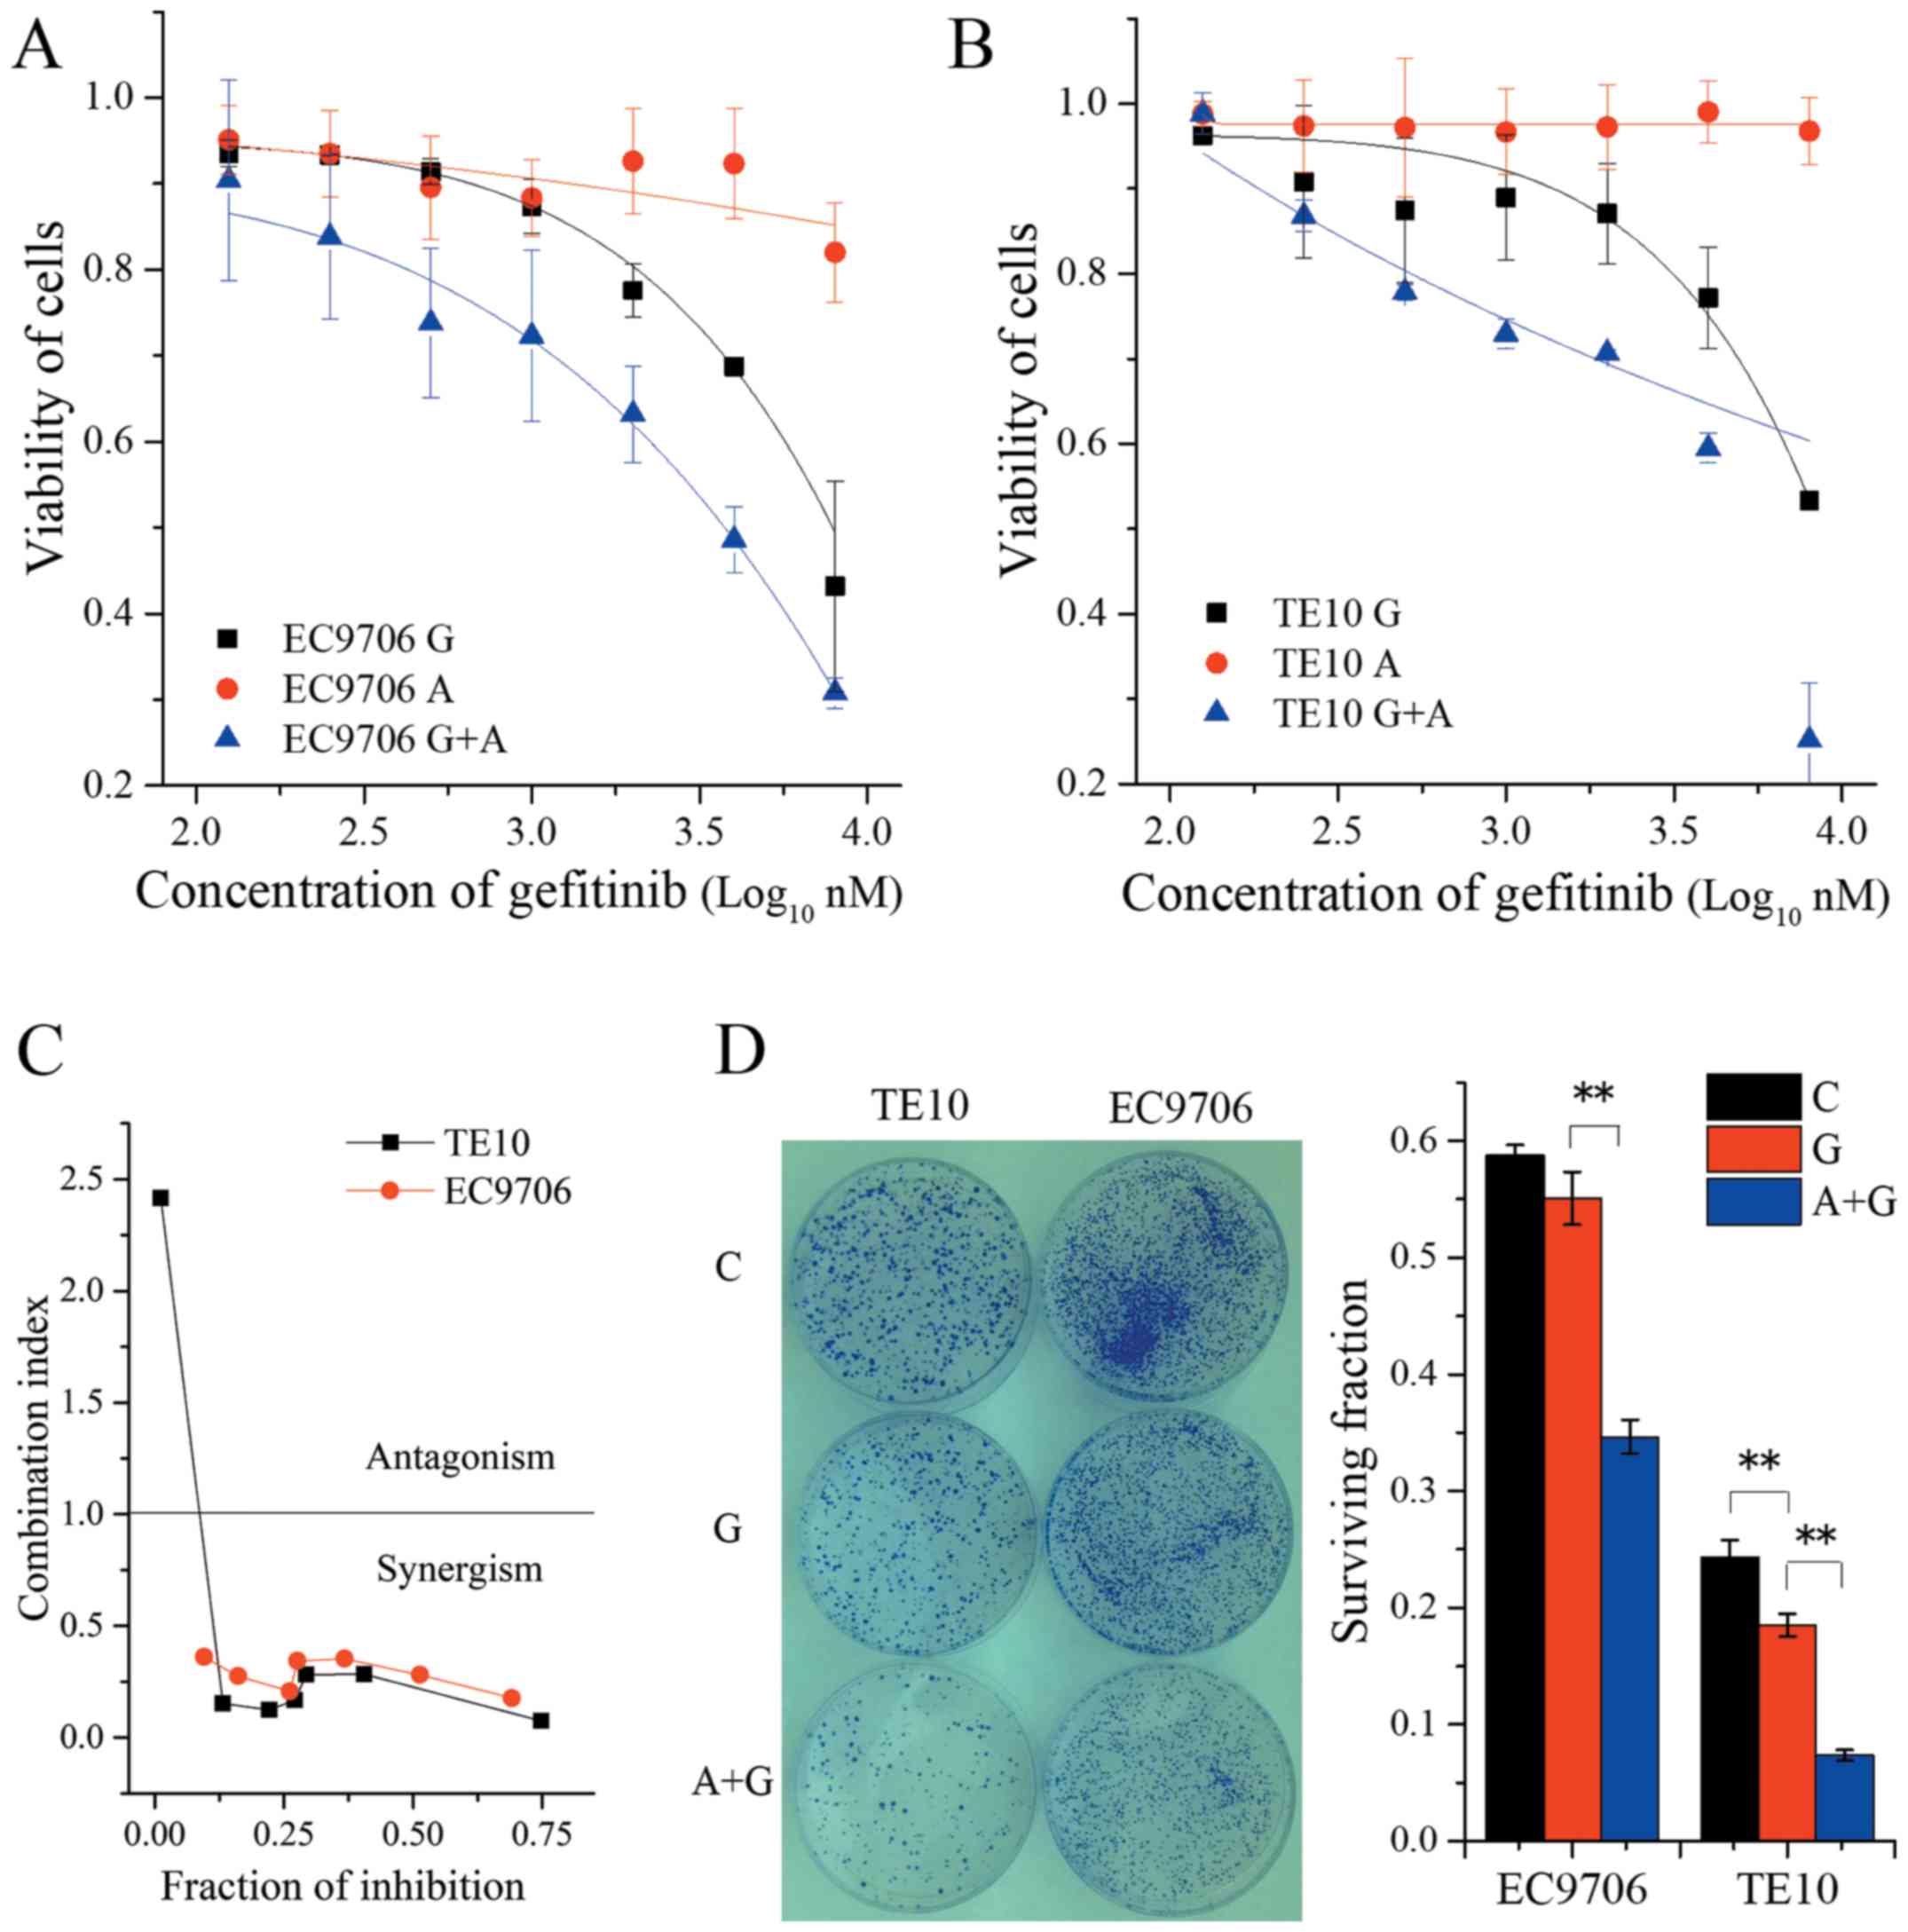
patients with positive expression of p-FGFR1 (19). To explore whether AZD4547 improved
the sensitivity of ESCC cell lines to gefitinib, the TE10 cell
line, which exhibited high expression of p-FGFR1 and the EC9706
cell line which exhibited a low expression level of p-FGFR1 were
selected for subsequent experiments. These cells were treated with
various concentrations of gefitinib alone or in combination with
AZD4547 (500 nM) for 6 days. The treatment interval of 6 days was
chosen mainly because the values of the inhibitory ratio were more
sTable and suiTable for fitting, using the median-effect equation
in order to avoid fluctuation of data under usual exposure time of
48 or 72 h. The results revealed that gefitinib alone slightly
reduced cell viability. The IC50 values of EC9706 and
TE10 were 9.85±5.5 and 22.9±2.1 µM, respectively. However, when
combined with 500 nM AZD4547, the IC50 of gefitinib in
EC9706 and TE10 was decreased to 3.21±0.76 and 4.13±0.12 µM
(Fig. 2A and B), respectively.
Moreover, the combination index analysis revealed strong synergism
in the range of concentration from 0.125 to 8 µM of gefitinib
combined with 0.5 µM AZD4547 in both of these two cell lines
(Fig. 2C). Meanwhile, the
combination of AZD4547 and gefitinib led to a marked inhibition of
cell survival compared with single-agent gefitinib in colony
formation assays (F=191.00, P<0.01 for EC9706 in ANOVA;
F=204.23, P<0.01 for TE10 in ANOVA) (Fig. 2D). Collectively, these results
indicated that AZD4547 improved the sensitivity of ESCC cell lines
to gefitinib. This effect could depend on the phosphorylation
status of FGFR1. It is likely that a high level of p-FGFR1 is
correlated with greater enhancement of sensitivity to
gefitinib.
Effect of AZD4547 and gefitinib
combination therapy on the cell cycle and apoptosis in TE10
cells
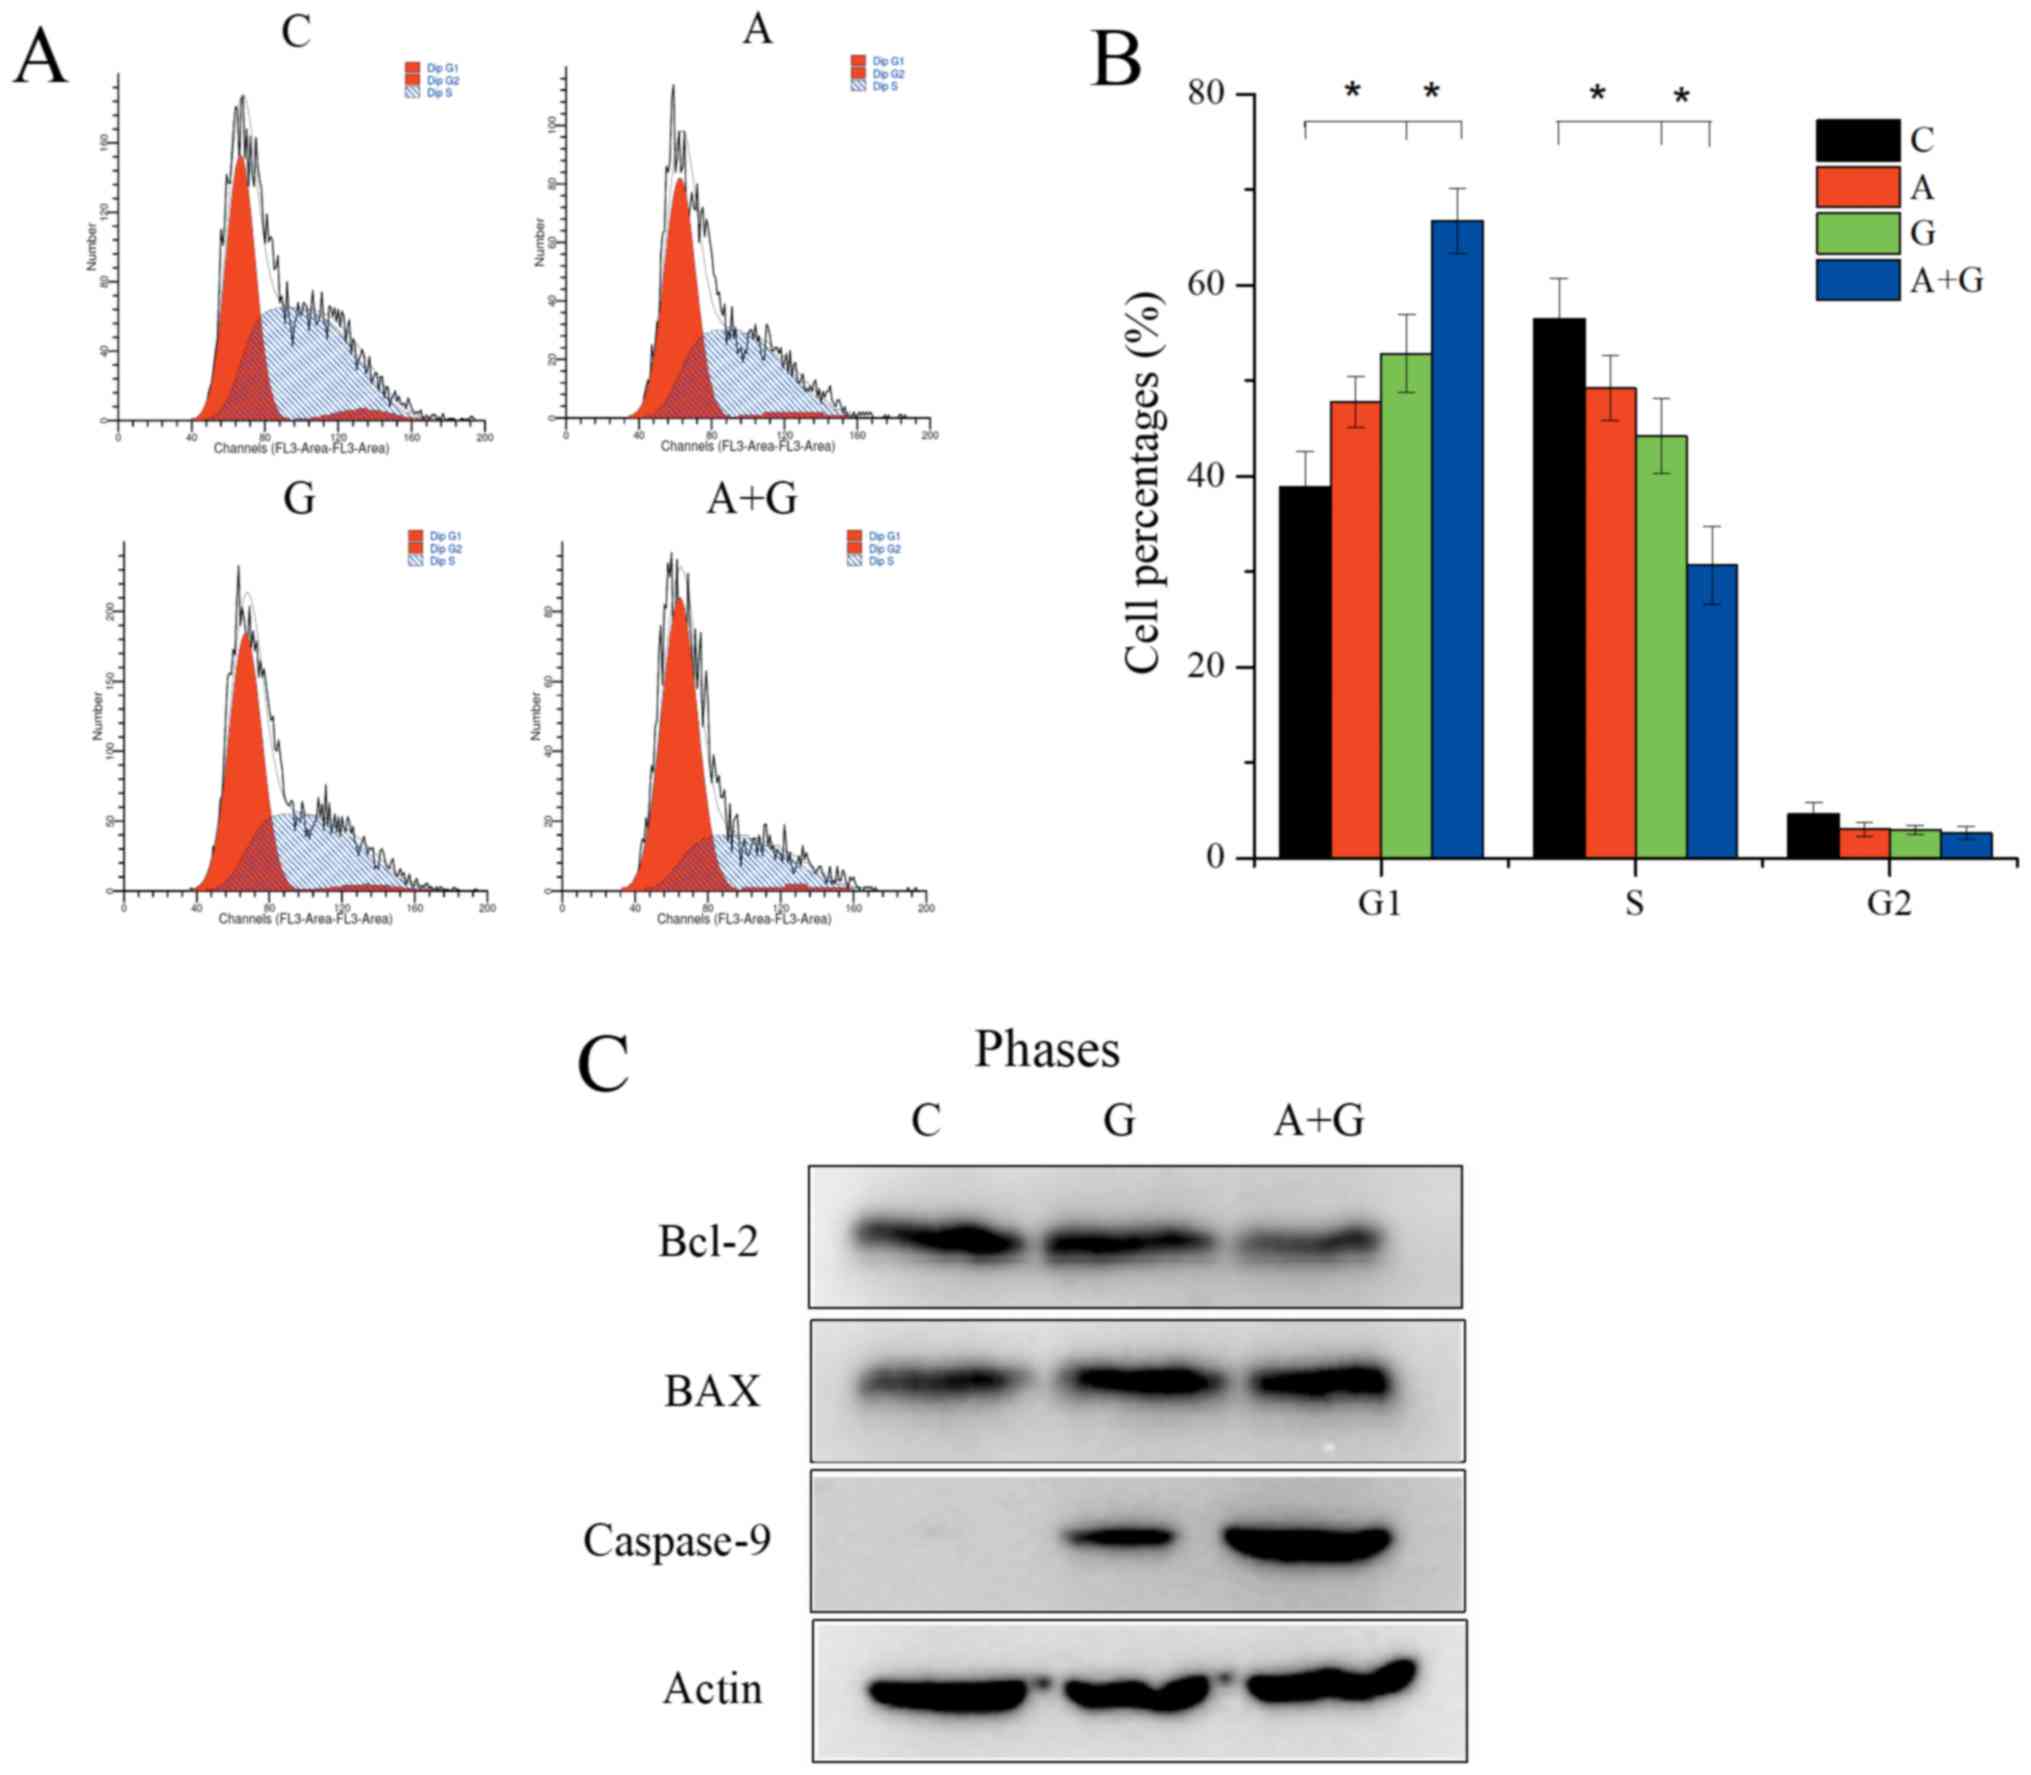
TE10 cells were divided into four groups: group C
(control), group G (gefitinib 500 nM), group A (AZD4547 500 nM) and
group A+G (gefitinib 500 nM+AZD4547 500 nM). Flow cytometric
analysis revealed that gefitinib alone could significantly reduce
the proportion of S phase cells (44.21±3.96 vs. 56.40±4.18;
P=0.029) and increase the G1 phase cells (52.82±4.08 vs.
38.87±3.75; P=0.008). Group A+G could further significantly reduce
S phase cells (30.66±4.09 vs. 44.21±3.96; P=0.017) and promote G1
phase arrest (66.71±3.41 vs. 2.82±4.08; P=0.008) compared with
group G (Fig. 3A and B) (F=23.23,
P<0.01 for S phase distribution in the 4 groups; F=32.80,
P<0.01 for G1 phase distribution in the 4 groups). In addition,
the combination of AZD4547 and gefitinib induced robust apoptosis
compared to gefitinib monotherapy in the TE10 cells revealed by
induced upregulation of caspase-9 (Fig.
3C).
Effects of combined AZD4547 and
gefitinib on signaling pathways in ESCC cell lines
Koole et al reported that combined AZD4547
and gefitinib resulted in reduced AKT/MAPK signaling in head and
neck squamous cell carcinoma (20).
In ESCC, the combination of cetuximab and the FGFR inhibitor
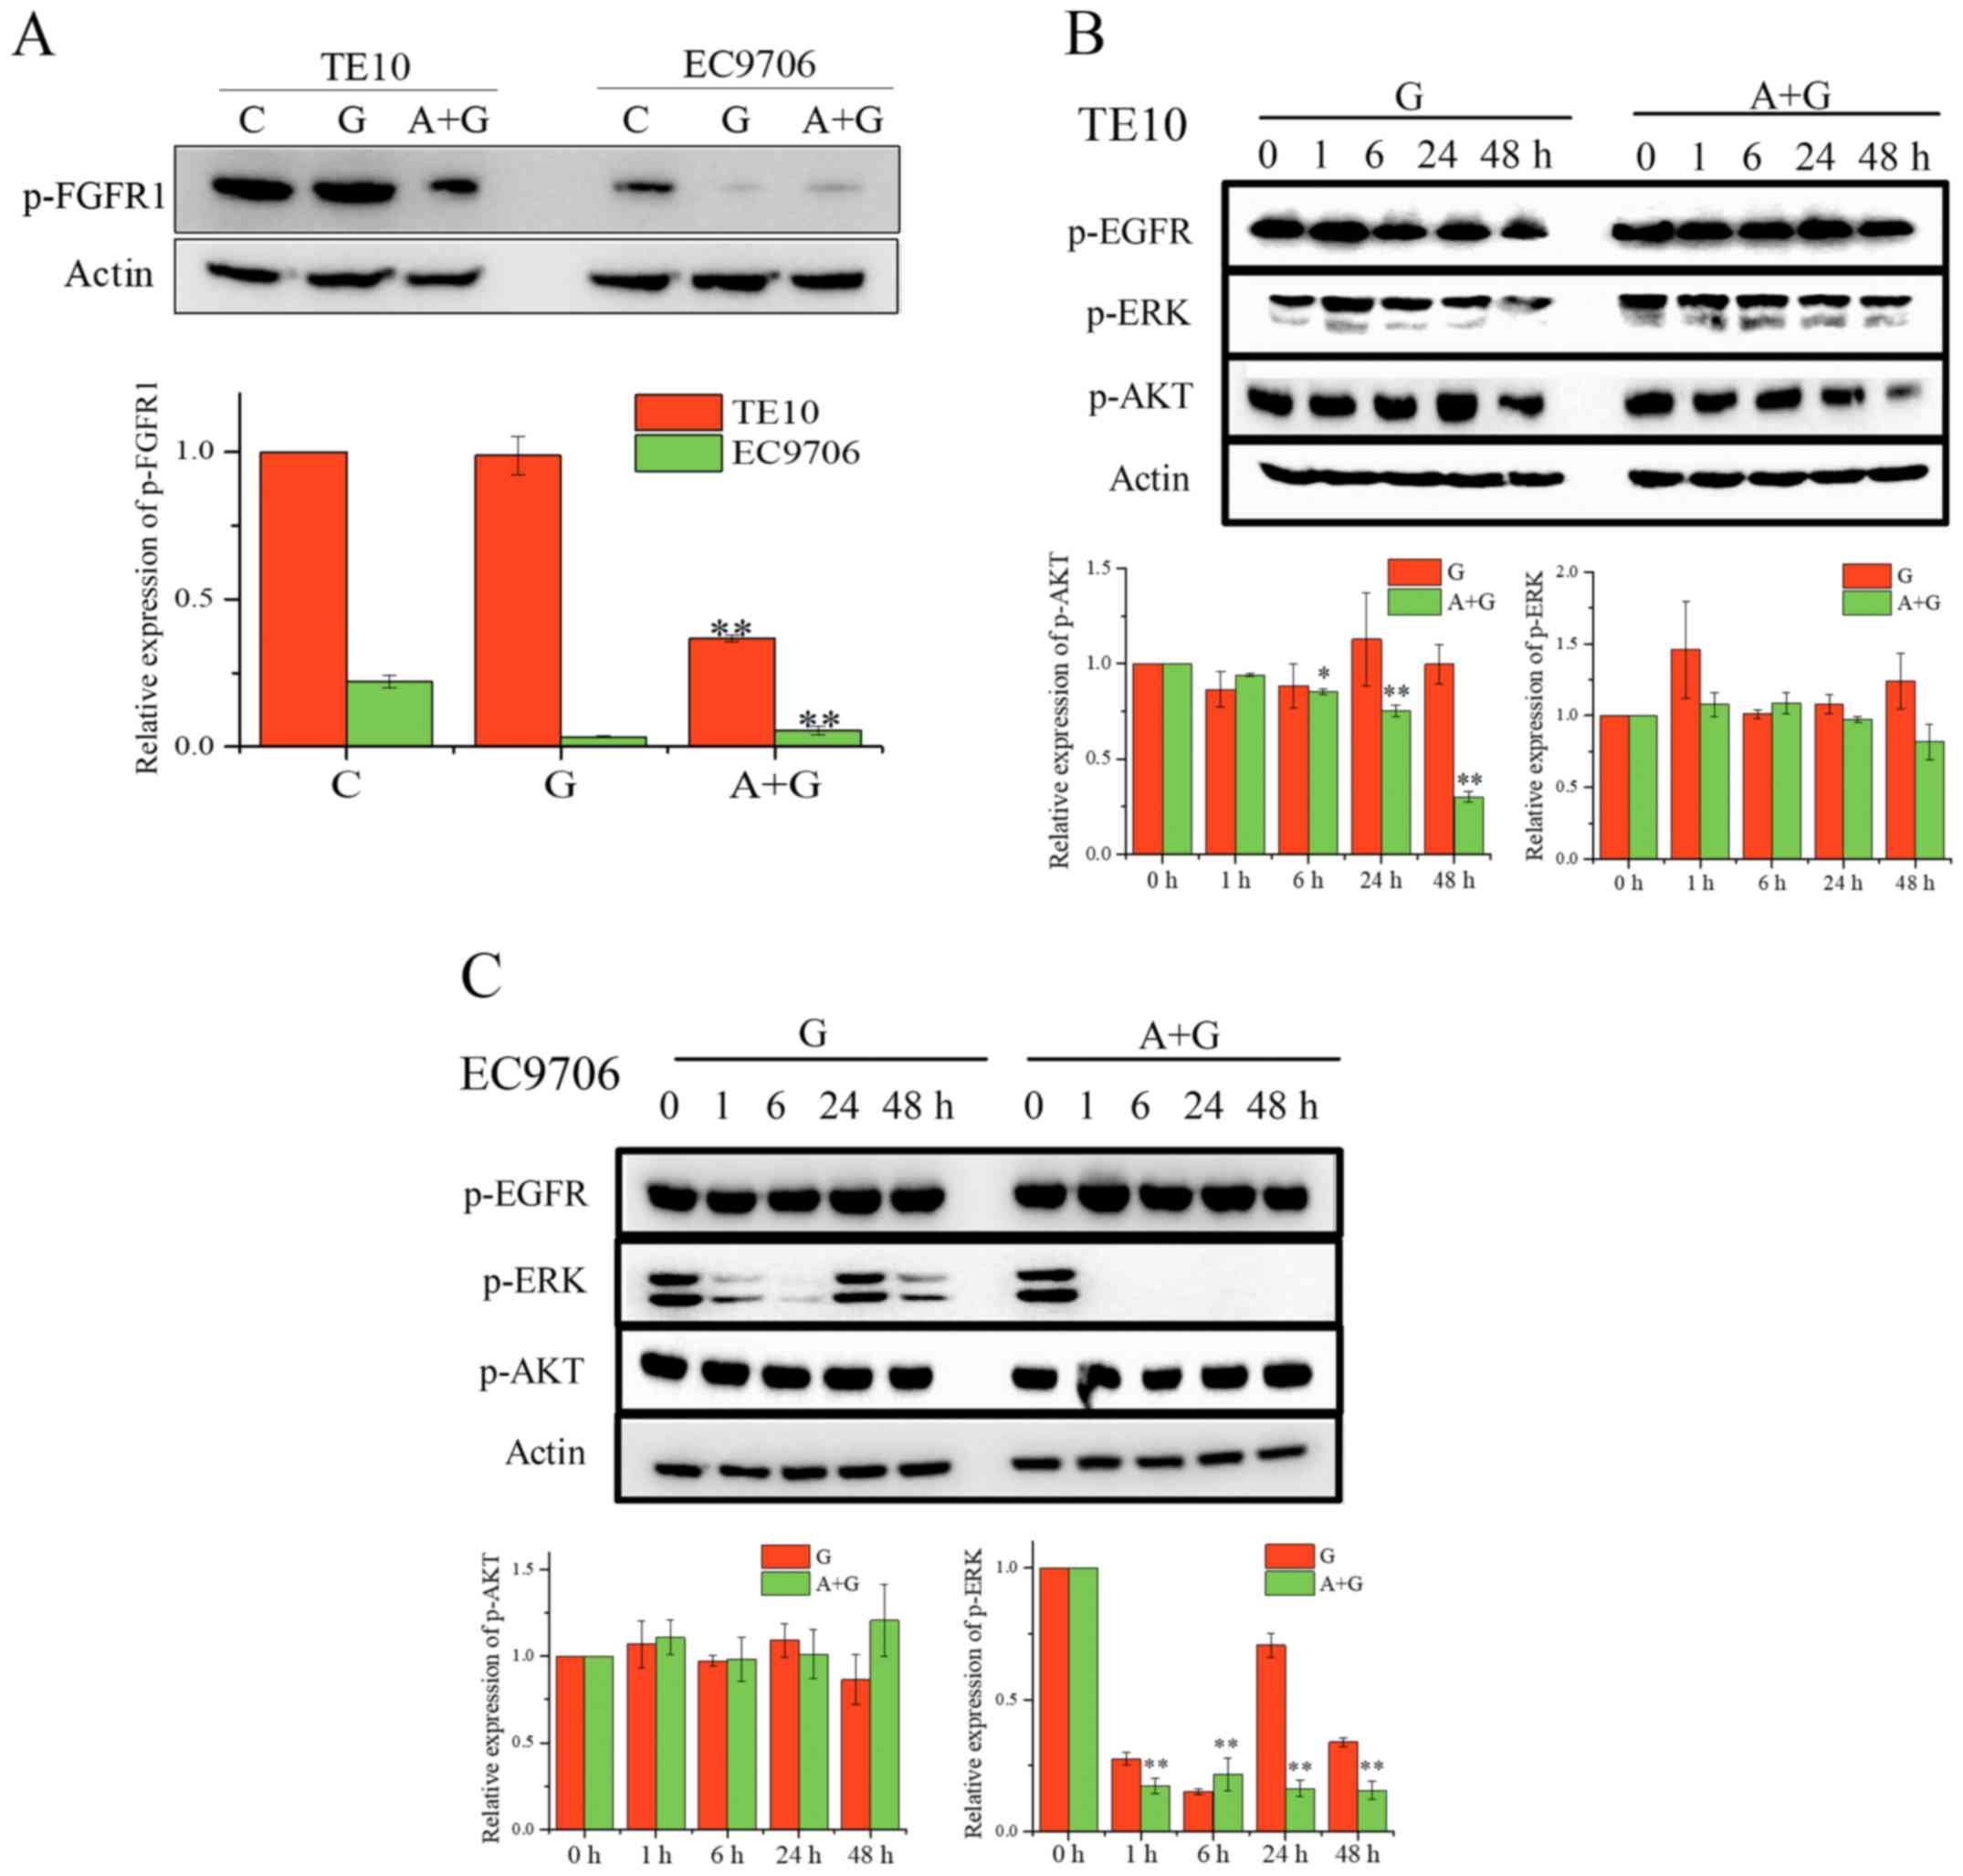
NVP-BJG398 resulted in a greater inhibition of p-AKT (8). To assess the effects of the
combination of AZD4547 and gefitinib on signaling pathways in ESCC
cell lines, we first determined the level of p-FGFR1 in TE10 and
EC9706 after treatment with the indicated drugs for 24 h (Fig. 4A). Western blot analysis revealed
that the combination of gefitinib and ZD4547 significantly
inhibited the phosphorylation of FGFR1 in TE10 cells. In addition,
the level of p-FGFR1 in EC9706 cells was decreased by the
combination of AZD4547 and gefitinib. We analyzed the MAPK/AKT
pathways in these cell lines (Fig.
4B). The expression of p-AKT in TE10 cells treated with the
combination of gefitinib and AZD4547 was gradually inhibited as the
treatment duration increased whereas the gefitinib alone treatment
group completely failed to inhibit the expression of p-AKT
(F=563.96, P<0.01 for combination; F=1.822, P=0.201 for
gefitinib alone). However, co-treatment did not affect AKT
signaling in the EC9706 cells, and dual FGFR/EGFR inhibition
completely abolished ERK signaling (F=306.82, P<0.01 for
combination). Collectively, our data revealed that the combination
of AZD4547 and gefitinib may affect PI3K/AKT and MAPK/ERK signaling
in TE10 cells and EC9706 cells, respectively.
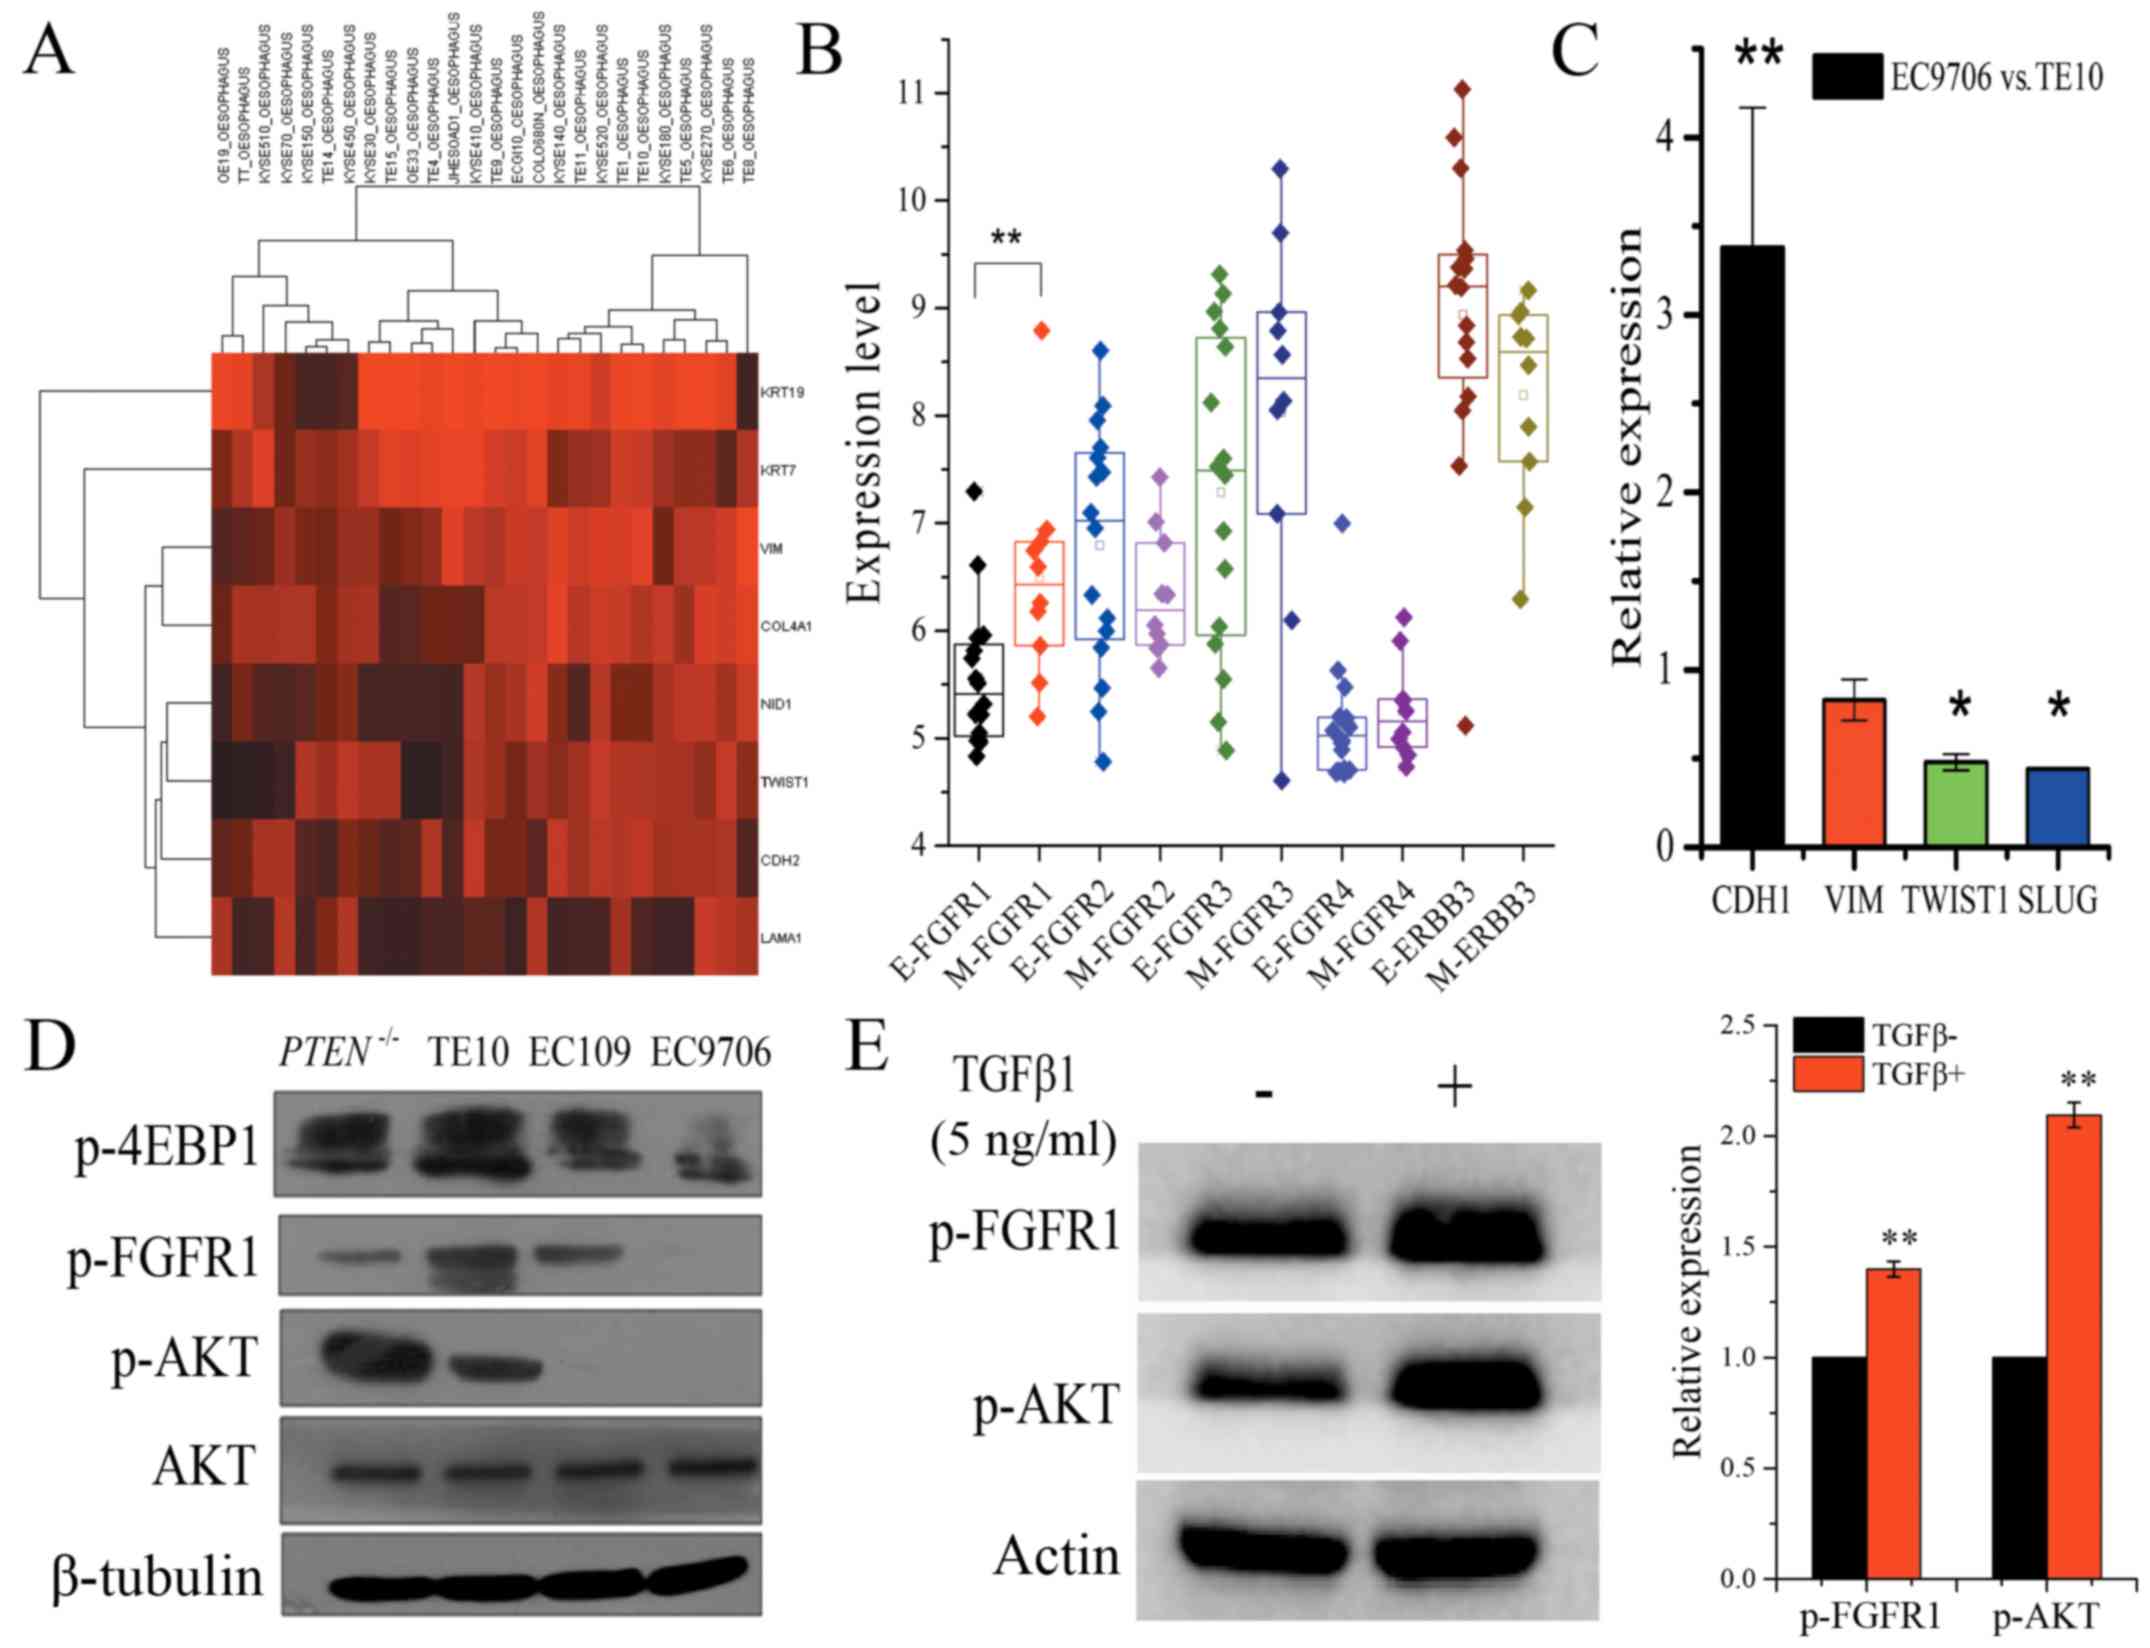
EMT is associated with different
signaling pathways for co-treatment in ESCC
Next, to further investigate the reason why
co-treatment affects different signaling pathways, we used the CCLE
database
(CCLE_Expression_Entrez_2010-09-29.gct;
http://www.broadinstitute.org/ccle/home) to analyze 26
ESCC cell lines with 8 genes which were selected from 26 genes that
had been used to discriminate between mesenchymal and epithelial
phenotype in the previously published study (21). Hierarchical clustering analysis
revealed that ESCC cell lines could be classified into two groups
based on epithelial and mesenchymal markers, and with TE10
exhibiting a mesenchymal phenotype. Notably, mesenchymal phenotype
cells demonstrated significantly higher FGFR1 mRNA expression
compared to cells with an epithelial phenotype (Fig. 5A and B). Quantitative RT-PCR
ascertained that two critical transcriptional factors, TWIST1 and
SLUG that promote the mesenchymal phenotype, exhibited
significantly lower expression in EC9706 cells compared to TE10
cells. Additionally, E-cadherin mRNA expression was significantly
higher in EC9706 cells compared to TE10 cells (fold change:
3.38±0.758, P<0.01), whereas the expression of TWIST1 and SLUG
were significantly lower in EC9706 cells (fold change: 0.48±0.045,
P<0.05; 0.44±0.004, P<0.05, respectively), which also argued
for the mesenchymal phenotype characteristics of TE10 cells and the
epithelial phenotype of EC9706 cells (Fig. 5C). Xuan et al reported that
AKT is likely to have a more important role in EMT induced by
TGF-β1 in EC9706 cells and may contribute to the invasive and
metastatic abilities of EC9706 cells (22). We also found a high level of p-AKT
in TE10 cells, but it was low in EC9706 cells (Fig. 5D). Meanwhile, the EC109 cells with
PTEN deletion exhibited strong upregulated expression of p-AKT
(Fig. 5D). Evidence has shown that
fractionated IR-mediated EMT in esophageal carcinoma cells is
through PTEN-dependent pathways (23). Furthermore, when EC9706 cells were
treated with 5 ng/ml TGF-β1 for 48 h, we observed an increased
level of p-AKT and p-FGFR1 (Fig.
5E). These data confirmed that cellular EMT status defined the
signaling pathways and the effect of co-treatment in ESCC. p-FGFR1
and p-AKT may not only serve as EMT biomarkers, but they can also
be used as efficient biomarkers to rationally combine AZD4547 and
gefitinib for ESCC treatment.
Discussion
Aberrant activation of the FGF/FGFR pathway is an
important mechanism for the development and progression of a
variety of solid tumors. At present, extensive research has shown
that FGFR amplification, mutation, and fusion are the main
mechanisms of FGFR activation. High copy numbers of FGFR1
correlated with a significantly higher risk of recurrence in
patients with ESCC compared to patients with low copy number
expansions (10). Overexpression of
FGFR2 was associated with tumor growth and patient outcomes in
esophagogastric junction adenocarcinoma (24). Notably, the level of phosphorylation
plays a key role in enhancing the activity of the FGFRs. The
activation of FGFR1 can be enhanced by the phosphorylation of
Y653/654 in the activation loop. In the present study, we
determined the profile of p-FGFR1 in cells and tissue samples of
ESCC (Fig. 1). In clinical
practice, gefitinib as well as other EGFR TKIs were still
disappointing for the treatment of ESCC characterized with frequent
somatic copy number alterations. Therefore, we explored whether
AZD4547 could improve the sensitivity of ESCC cell lines to
gefitinib. The results revealed that AZD4547 could increase the
sensitivity of TE10 and EC9706 cells to gefitinib in different
manners. Namely, it appeared that the higher the expression of
p-FGFR1 was, the better the effect of enhanced sensitivity that
could be achieved (Fig. 2).
Recently, some studies have shown that FGFR1 plays
an important role in mediating and maintaining EMT transition
(14,15,25).
EMT plays an important role in mechanisms involved in invasion,
migration, and resistance to targeted drugs in a wide variety of
tumors. Particularly, Xiong et al classified the ESCC
patients into four subtypes using a specific 185-gene signature in
which tumors marked with mesenchymal phenotype exhibited worse
prognosis (21). Conversely, FGFR1
was highly expressed in the mesenchymal-like KRAS-mutant NSCLC, and
MEK inhibition relieved feedback suppression of FGFR1, resulting in
reactivation of ERK. The combination of the MEK inhibitor and the
FGFR inhibitor resulted in tumor shrinkage (26). Consistent with these previous
studies, our findings also provided evidence that revealed moderate
but significant inhibition of p-AKT under combination treatment of
AZD4547 and gefitinib in TE10 cells, which suggested that
p-FGFR/AKT activation may improve the growth of TE10 cells featured
with mesenchymal phenotype. Conversely, EC9706 cells with an
epithelial phenotype were mainly dependent on EGFR/ERK for growth
and survival. Taking the present and other evidence into
consideration revealing that the FGFR/AKT pathway participated in
the EMT process in breast and prostate cancer (27,28),
it is likely that TE10 cells relied more on the FGFR/AKT pathway to
maintain EMT and survival.
Although AZD4547 enhanced the sensitivity of TE10
cell lines to gefitinib, co-treatment did not completely inhibit
p-AKT in TE10 cells. We speculated that more complex biological
networks are involved in maintaining EMT in TE10 cells. This
hypothesis still warrants further investigation. Furthermore, it is
almost a general principle that cancer cells that undergo EMT are
resistant to molecular-targeted drugs partially due to
dysregulation of apoptosis. In KRAS-mutant NSCLC cell line SW1573
with an EMT phenotype, marked apoptosis cannot be induced with
combinational treatment of BGJ398 and trametinib unless the
Bcl-2/Bcl-xL inhibitor ABT263 is added (24). In the present study, although two
powerful targeted drugs were utilized, the inhibitory effects on
ESCC cells were only moderate. It is therefore necessary to
investigate the effect of apoptosis mechanisms on resistance to
certain targeted drugs in ESCC cells.
Recently, EGFR amplification has been demonstrated
to be a strong predictor for the benefit of gefitinib in patients
with esophageal carcinoma (29).
However, due to the high complexity of genomic mutations in
esophageal carcinoma (7), a single
biomarker could be inadequate to predict benefit from gefitinib.
Thus, other accompanied molecular alterations may also play
important roles. A high level of p-FGFR1 has been considered as one
of the important mechanisms in the promotion of EMT. The PI3K/AKT
signaling pathway is the key pathway promoting EMT in a variety of
solid tumors. The level of p-AKT was significantly increased in
EC9706 cells treated with 5 ng/ml TGF-β for 24 h (22). Based on these lines of evidence, we
proposed that the combination of the expression level of p-FGFR1
and p-AKT can serve as the EMT markers in ESCC.
In conclusion, our findings revealed the profile of
p-FGFR1Y654 and confirmed that sensitization to
gefitinib conferred by AZD4547 in ESCC cell lines was dependent on
the level of p-FGFR1Y654. Notably, p-FGFR1 and p-AKT may
serve as EMT markers and efficient biomarkers to rationally combine
AZD4547 and gefitinib for the treatment of ESCC.
Acknowledgements
No special subjects should be acknowledged.
References
|
1
|
Siegel RL, Miller KD and Jemal A: Cancer
statistics, 2015. CA Cancer J Clin. 65:5–29. 2015. View Article : Google Scholar : PubMed/NCBI
|
|
2
|
Ando N, Ozawa S, Kitagawa Y, Shinozawa Y
and Kitajima M: Improvement in the results of surgical treatment of
advanced squamous esophageal carcinoma during 15 consecutive years.
Ann Surg. 232:225–232. 2000. View Article : Google Scholar : PubMed/NCBI
|
|
3
|
Pande AU, Iyer RV, Rani A, Maddipatla S,
Yang GY, Nwogu CE, Black JD, Levea CM and Javle MM: Epidermal
growth factor receptor-directed therapy in esophageal cancer.
Oncology. 73:281–289. 2007. View Article : Google Scholar : PubMed/NCBI
|
|
4
|
Gibault L, Metges JP, Conan-Charlet V,
Lozac'h P, Robaszkiewicz M, Bessaguet C, Lagarde N and Volant A:
Diffuse EGFR staining is associated with reduced overall survival
in locally advanced oesophageal squamous cell cancer. Br J Cancer.
93:107–115. 2005. View Article : Google Scholar : PubMed/NCBI
|
|
5
|
Hara F, Aoe M, Doihara H, Taira N, Shien
T, Takahashi H, Yoshitomi S, Tsukuda K, Toyooka S, Ohta T and
Shimizu N: Antitumor effect of gefitinib (‘Iressa’) on esophageal
squamous cell carcinoma cell lines in vitro and in vivo. Cancer
Lett. 226:37–47. 2005. View Article : Google Scholar : PubMed/NCBI
|
|
6
|
Dutton SJ, Ferry DR, Blazeby JM, Abbas H,
Dahle-Smith A, Mansoor W, Thompson J, Harrison M, Chatterjee A,
Falk S, et al: Gefitinib for oesophageal cancer progressing after
chemotherapy (COG): A phase 3, multicentre, double-blind,
placebo-controlled randomised trial. Lancet Oncol. 15:894–904.
2014. View Article : Google Scholar : PubMed/NCBI
|
|
7
|
Bandla S, Pennathur A, Luketich JD, Beer
DG, Lin L, Bass AJ, Godfrey TE and Litle VR: Comparative genomics
of esophageal adenocarcinoma and squamous cell carcinoma. Ann
Thorac Surg. 93:1101–1106. 2012. View Article : Google Scholar : PubMed/NCBI
|
|
8
|
Zhang Y, Pan T, Zhong X and Cheng C:
Resistance to cetuximab in EGFR-overexpressing esophageal squamous
cell carcinoma xenografts due to FGFR2 amplification and
overexpression. J Pharmacol Sci. 126:77–83. 2014. View Article : Google Scholar : PubMed/NCBI
|
|
9
|
Costa R, Carneiro BA, Taxter T, Tavora FA,
Kalyan A, Pai SA, Chae YK and Giles FJ: FGFR3-TACC3 fusion
in solid tumors: Mini review. Oncotarget. 7:55924–55938. 2016.
View Article : Google Scholar : PubMed/NCBI
|
|
10
|
Kim HS, Lee SE, Bae YS, Kim DJ, Lee CG,
Hur J, Chung H, Park JC, Jung DH, Shin SK, et al: Fibroblast growth
factor receptor 1 gene amplification is associated with poor
survival in patients with resected esophageal squamous cell
carcinoma. Oncotarget. 6:2562–2572. 2015.PubMed/NCBI
|
|
11
|
Furdui CM, Lew ED, Schlessinger J and
Anderson KS: Autophosphorylation of FGFR1 kinase is mediated by a
sequential and precisely ordered reaction. Mol Cell. 21:711–717.
2006. View Article : Google Scholar : PubMed/NCBI
|
|
12
|
Gavine PR, Mooney L, Kilgour E, Thomas AP,
Al-Kadhimi K, Beck S, Rooney C, Coleman T, Baker D, Mellor MJ, et
al: AZD4547: An orally bioavailable, potent, and selective
inhibitor of the fibroblast growth factor receptor tyrosine kinase
family. Cancer Res. 72:2045–2056. 2012. View Article : Google Scholar : PubMed/NCBI
|
|
13
|
Thiery JP, Acloque H, Huang RY and Nieto
MA: Epithelial-mesenchymal transitions in development and disease.
Cell. 139:871–890. 2009. View Article : Google Scholar : PubMed/NCBI
|
|
14
|
Brown WS, Akhand SS and Wendt MK: FGFR
signaling maintains a drug persistent cell population following
epithelial-mesenchymal transition. Oncotarget. 7:83424–83436. 2016.
View Article : Google Scholar : PubMed/NCBI
|
|
15
|
Nguyen PT, Tsunematsu T, Yanagisawa S,
Kudo Y, Miyauchi M, Kamata N and Takata T: The FGFR1 inhibitor
PD173074 induces mesenchymal-epithelial transition through the
transcription factor AP-1. Br J Cancer. 109:2248–2258. 2013.
View Article : Google Scholar : PubMed/NCBI
|
|
16
|
Ashton JC: Drug combination studies and
their synergy quantification using the Chou-Talalay method. Cancer
Res. 1:24002015. View Article : Google Scholar
|
|
17
|
De Hoon MJ, Imoto S, Nolan J and Miyano S:
Open source clustering software. Bioinformatics. 20:1453–1454.
2004. View Article : Google Scholar : PubMed/NCBI
|
|
18
|
Saldanha AJ: Java Treeview-extensible
visualization of microarray data. Bioinformatics. 20:3246–3248.
2004. View Article : Google Scholar : PubMed/NCBI
|
|
19
|
Jo JC, Choi EK, Shin JS, Moon JH, Hong SW,
Lee HR, Kim SM, Jung SA, Lee DH, Jung SH, et al: Targeting FGFR
pathway in human hepatocellular carcinoma: Expressing pFGFR and
pMET for antitumor activity. Mol Cancer Ther. 14:2613–2622. 2015.
View Article : Google Scholar : PubMed/NCBI
|
|
20
|
Koole K, Brunen D, van Kempen PM, Noorlag
R, de Bree R, Lieftink C, van Es RJ, Bernards R and Willems SM:
FGFR1 is a potential prognostic biomarker and therapeutic target in
head and neck squamous cell carcinoma. Clin Cancer Res.
22:3884–3893. 2016. View Article : Google Scholar : PubMed/NCBI
|
|
21
|
Xiong T, Wang M, Zhao J, Liu Q, Yang C,
Luo W, Li X, Yang H, Kristiansen K, Roy B and Zhou Y: An esophageal
squamous cell carcinoma classification system that reveals
potential targets for therapy. Oncotarget. 8:49851–49860. 2017.
View Article : Google Scholar : PubMed/NCBI
|
|
22
|
Xuan X, Zeng Q, Li Y, Gao Y, Wang F, Zhang
H, Wang Z, He H and Li S: Akt-mediated transforming growth
factor-b1-induced epithelial-mesenchymal transition in cultured
human esophageal squamous cancer cells. Cancer Gene Therapy.
21:238–245. 2014. View Article : Google Scholar : PubMed/NCBI
|
|
23
|
He E, Pan F, Li G and Li J: Fractionated
ionizing radiation promotes epithelial-mesenchymal transition in
human esophageal cancer cells through PTEN deficiency-mediated Akt
activation. PLoS One. 10:e01261492015. View Article : Google Scholar : PubMed/NCBI
|
|
24
|
Tokunaga R, Imamura Y, Nakamura K,
Ishimoto T, Nakagawa S, Miyake K, Nakaji Y, Tsuda Y, Iwatsuki M,
Baba Y, et al: Fibroblast growth factor receptor 2 expression, but
not its genetic amplification, is associated with tumor growth and
worse survival in esophagogastric junction adenocarcinoma.
Oncotarget. 6:19748–19761. 2016.
|
|
25
|
Brown WS, Tan L, Smith A, Gray NS and
Wendt MK: Covalent targeting of fibroblast growth factor receptor
inhibits metastatic breast cancer. Mol Cancer Ther. 15:2096–2106.
2016. View Article : Google Scholar : PubMed/NCBI
|
|
26
|
Kitai H, Ebi H, Tomida S, Floros KV,
Kotani H, Adachi Y, Oizumi S, Nishimura M, Faber AC and Yano S:
Epithelial-to-mesenchymal transition defines feedback activation of
receptor tyrosine kinase signaling induced by MEK inhibition in
KRAS-mutant lung cancer. Cancer Discov. 6:754–769. 2016.
View Article : Google Scholar : PubMed/NCBI
|
|
27
|
Qian X, Anzovino A, Kim S, Suyama K, Yao
J, Hulit J, Agiostratidou G, Chandiramani N, McDaid HM, Nagi C, et
al: N-cadherin/FGFR promotes metastasis through
epithelial-to-mesenchymal transition and stem/progenitor cell-like
properties. Oncogene. 33:3411–3421. 2014. View Article : Google Scholar : PubMed/NCBI
|
|
28
|
Terry S, El-Sayed IY, Destouches D, Maillé
P, Nicolaiew N, Ploussard G, Semprez F, Pimpie C, Beltran H,
Londono-Vallejo A, et al: CRIPTO overexpression promotes
mesenchymal differentiation in prostate carcinoma cells through
parallel regulation of AKT and FGFR activities. Oncotarget.
6:11994–2008. 2015. View Article : Google Scholar : PubMed/NCBI
|
|
29
|
Petty RD, Dahle-Smith A, Stevenson DAJ,
Osborne A, Massie D, Clark C, Murray GI, Dutton SJ, Roberts C,
Chong IY, et al: Gefitinib and EGFR gene copy number
aberrations in esophageal cancer. J Clin Oncol. 35:2279–2287. 2017.
View Article : Google Scholar : PubMed/NCBI
|