Introduction
Colon cancer is the third most frequently diagnosed
malignancy and one of the leading causes of mortality globally
(1). Colon adenocarcinoma (COAD) is
by far the most common histologic type of colon cancer (2). Previous findings have shown that the
morbidity and mortality rates of colon cancer continue to increase
(3). Findings have demonstrated
that colon cancer is successfully treated when identified at an
early stage (4), and prognosis in
colon carcinoma aids in the choice of therapeutic options. However,
the underlying molecular mechanism of colon cancer and molecular
biomarkers for the survival assessment of this cancer remains poor.
Thus, the aim of ongoing research is to identify novel biomarkers,
while studying the detailed molecular mechanism remains
imperative.
Recent findings have identified multiple genetic
alterations that result in tumorigenesis and the progression of
colon cancer (5,6). Recently, Kan et al showed that
nesfatin-1/nucleobindin-2 (NUCB-2) enhanced the migration,
invasion, and mesenchymal phenotype of colon cancer via the
LKB1/AMPK/TORC1/ZEB1 pathways (7).
The findings of Unger et al demonstrated that stroma-induced
insulin-like growth factor 2 (IGF-2) can promote colon cancer
progression in a paracrine and an autocrine manner (8). Long non-coding RNAs (lncRNAs) are
mostly defined as a class of non-coding RNAs exceeding 200
nucleotides in length (9).
Increasing evidence has demonstrated that lncRNAs play key roles in
regulating many crucial biological processes such as genetic
imprinting, cell differentiation, apoptosis and cell proliferation,
and immune responses. lncRNAs are involved in numerous human
diseases including various types of cancer (10,11).
There are multiple ways by which lncRNAs can regulate downstream
target genes (12). The expression
of a c-Myc-activated lncRNA CCAT1 was shown to contribute to
colon cancer tumorigenesis, and it also promoted colon cancer cell
proliferation and invasion (13).
Recently, it was found that, lncRNA-ATB may act on colon
tumorigenesis by mediating E-cadherin repression and was also used
as a predictor of poor prognosis (14). Additionally, Thorenoor et al
reported that lncRNA ZFAS1 may function as an oncogene in
colorectal cancer by interacting with cyclin-dependent kinase 1
(CDK1) and this interaction caused indirect destabilization of p53,
leading to cell cycle progression and inhibition of apoptosis
(15). Nevertheless, current
knowledge concerning lncRNA regulation in colon cancer is limited,
and more evidence is required to elucidate the gene and global
lncRNA expression profiles in colon cancer.
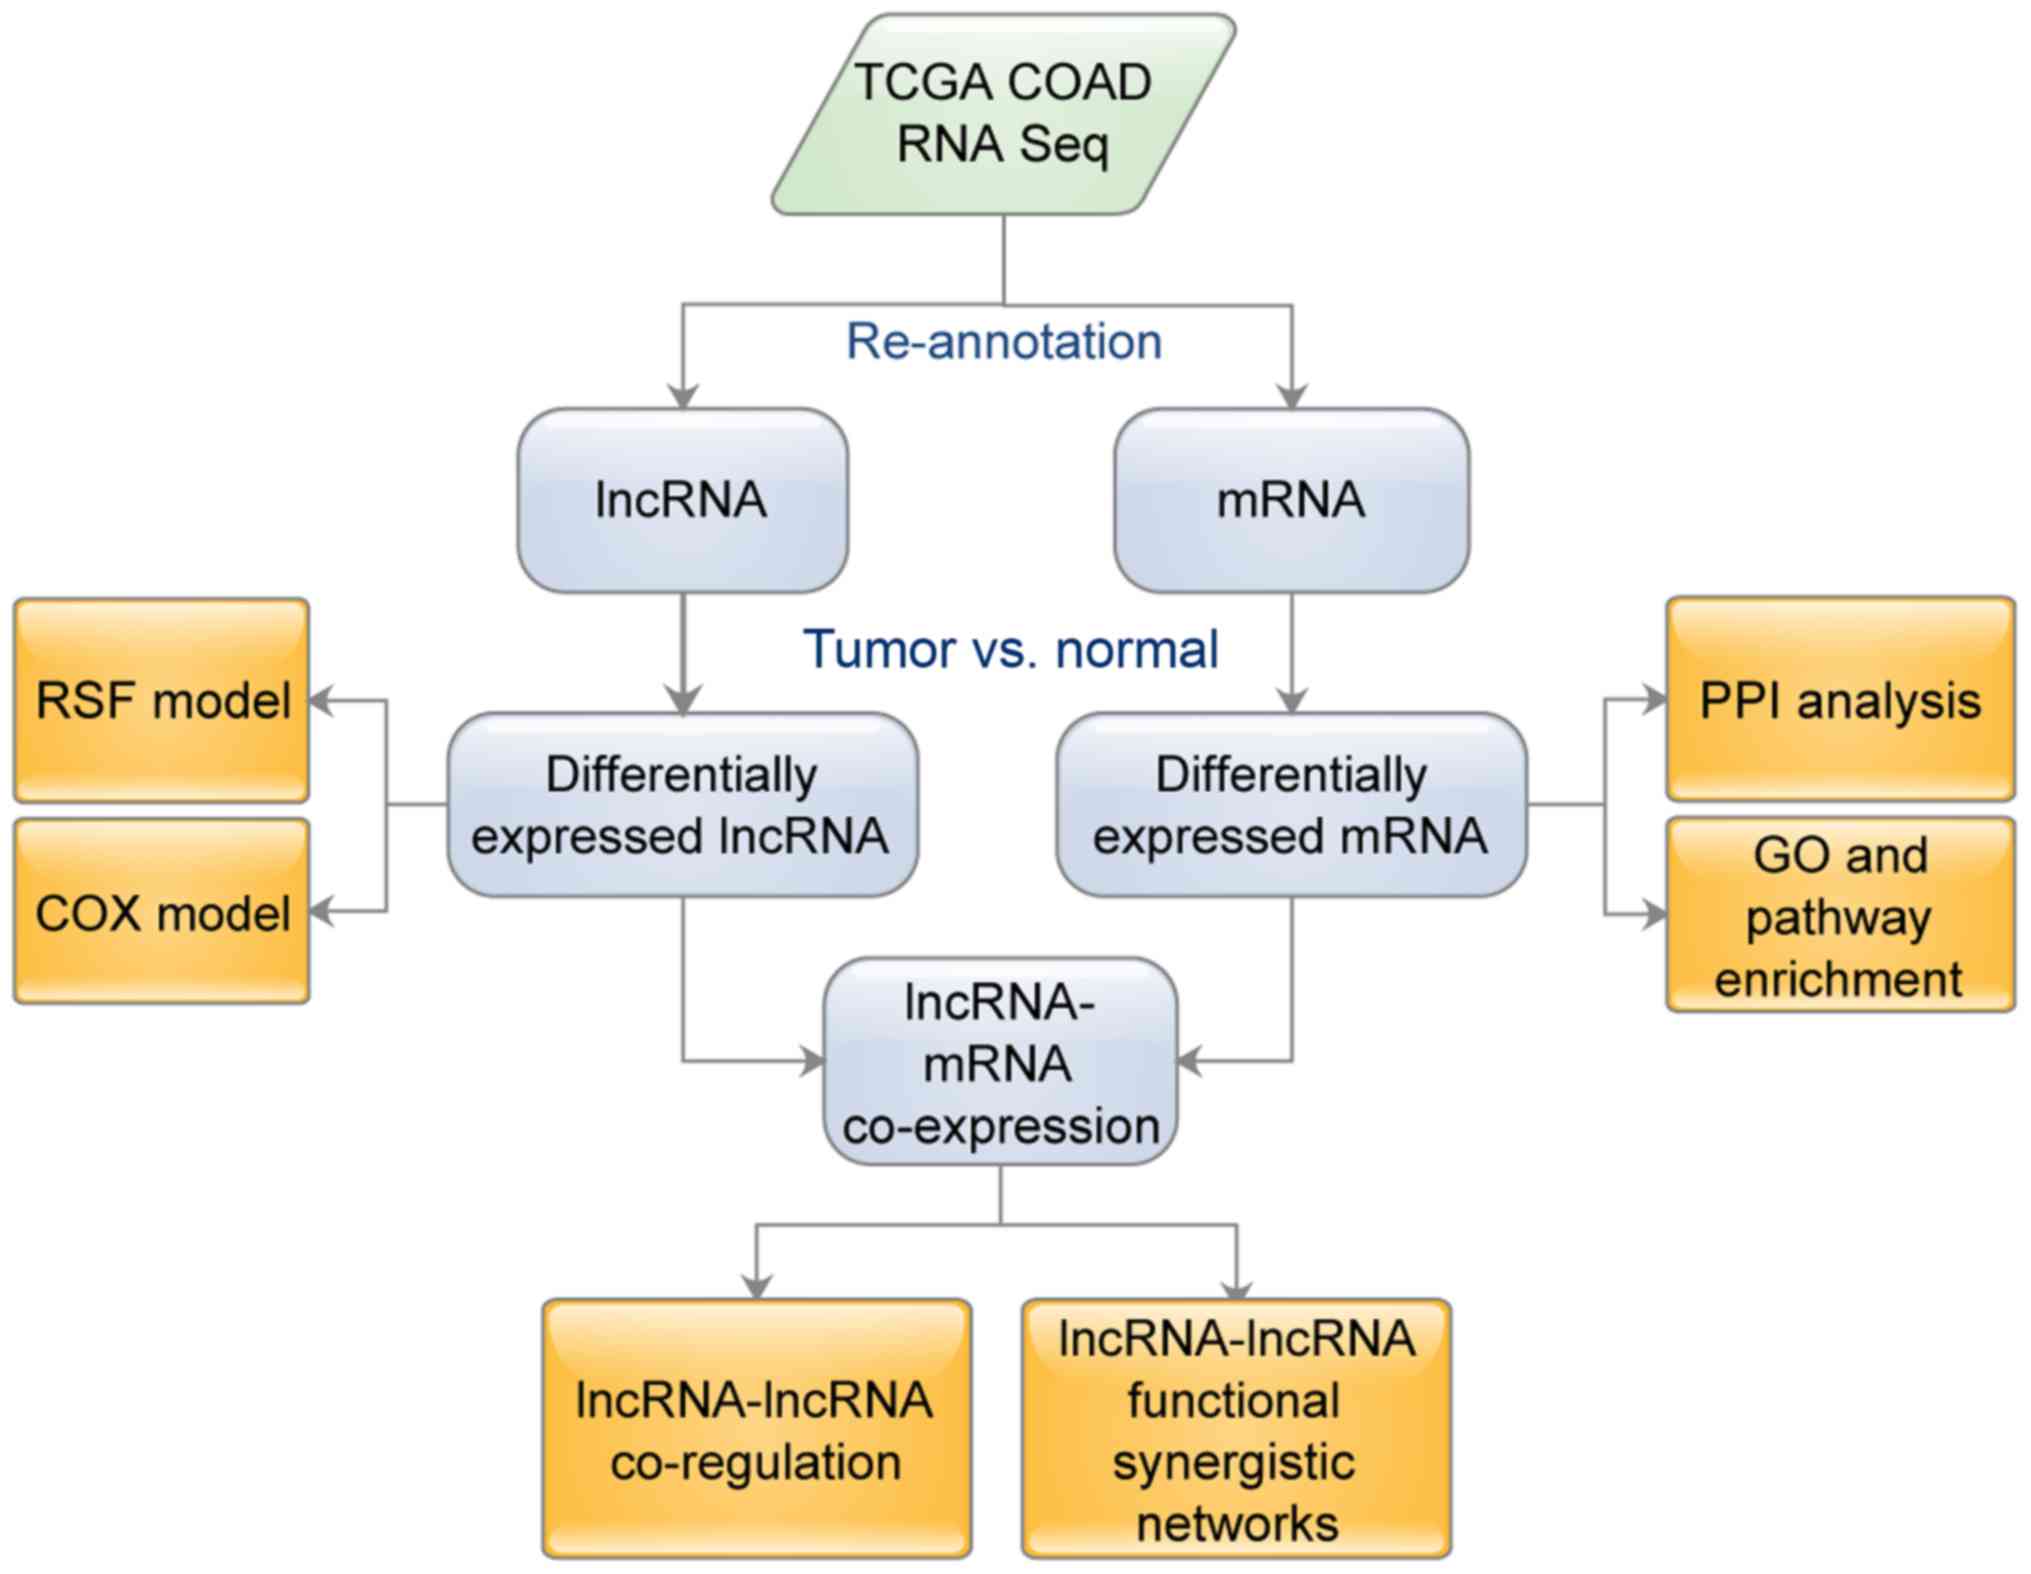
In this study, we identified a RNA-seq-based mRNA
and lncRNA signature of COAD patients from The Cancer Genome Atlas
(TCGA) database using a cohort of >250 cases. Differentially
expressed mRNAs and lncRNAs were identified in the tumor samples
and normal controls. A functional enrichment analysis of
differentially expressed mRNAs was performed, followed by a
protein-protein interaction (PPI) network construction and
significant module selection. Additionally, regulatory
relationships among the differentially expressed mRNAs and lncRNAs
were assessed, and lncRNA-lncRNA co-regulation and functional
synergistic analyses were carried out. Moreover, the risk score
model and Cox regression analysis based on the expression levels of
lncRNAs were utilized to develop a prognostic lncRNA signature. The
differential expression profile analysis of four candidate lncRNAs
in COAD tumors were confirmed by reverse transcription-quantitative
PCR (RT-qPCR). The present study successfully identified
potentially significant genes and lncRNAs in colon cancer, and
provided further insights into the mechanisms and the predictive
capacity of lncRNAs underlying colon cancer.
Materials and methods
Public data acquisition and
re-annotation
The RNA-seq V2 exon data (level 3, raw count) and
clinical information of COAD were downloaded from the TCGA data
portal (https://tcga-data.nci.nih.gov/) for a total of 326
samples (285 tumor samples and 41 normal tissue samples adjacent to
tumors). Of these, 279 patients had complete prognostic
information. Sequence data were generated using the Illumina HiSeq
2000 RNA Sequencing platform. The data were downloaded in March,
2017.
The RNA-seq V2 exon data provided information on the
positions of all exons, raw counts, and reads per kilobase per
million mapped reads (RPKM). To achieve an accurate and completely
annotated dataset, we compared the RNA-seq V2 exon data with the
annotation information of the lncRNA chromosomal location of the
GENCODE (v25) database (16)
(https://www.gencodegenes.org/). If the
starting position of an exon was included in the lncRNA or
protein-coding RNA in the GENCODE database and the positive and
negative strands were consistent, the exon was defined as an lncRNA
or protein-coding RNA. The raw data of 3,038 annotated lncRNAs and
19,161 annotated mRNAs were finally analyzed.
Identification of differentially
expressed lncRNAs and mRNAs
Findings of a previous study demonstrated that a
differential expression analysis based on a variance-stabilizing
transformation combined with limma could perform well and were
relatively unaffected by outliers (17). In the present study, edgeR+ limma
was applied for the differential expression analysis. The raw count
data were preprocessed using the R package edgeR (18) (version 3.4, http://www.bioconductor.org/packages/release/bioc/html/edgeR.html).
The raw count was normalized to log-counts per million (CPM)
values, and the genes whose average expression was lower than the
first quartile (Q1) were filtered out. Linear modeling was
performed and the mean-variance relationship was adjusted using the
precision weights calculated using the voom function (19).
The data were divided into two groups: a COAD group
and a normal control group. Using the t-test method provided by the
limma package (version 3.10.3, http://www.bioconductor.org/packages/2.9/bioc/html/limma.html)
(20), differentially expressed
mRNAs and lncRNAs were identified in the COAD group compared with
the normal control group. P-values were obtained from the t-test
and were adjusted using the Benjamini-Hochberg (BH) (21) multiple testing correction to obtain
adj. P-value. Thresholds for the screening of differentially
expressed lncRNAs and mRNAs were adj. P-value <0.05 and
|log2 fold change (FC)|>2.
Function, pathway enrichment
analysis
The DAVID bioinformatics resource is a web-based
application that consists of an integrated biological knowledge
base and analytic tools for systematically extracting biological
themes behind large gene lists (22). In the present study, functional and
pathway enrichment analyses were performed for differentially
expressed mRNAs using the DAVID online tools (version 6.8,
https://david.ncifcrf.gov/), including
Gene Ontology (GO) (23) and Kyoto
Encyclopedia of Genes and Genomes (KEGG) pathway enrichment
analyses (24). All three GO
categories, i.e., biological process (BP), cellular component (CC),
and molecular function (MF) were analyzed. GO terms and KEGG
pathways with a P-value <0.05 were considered significant.
PPI network construction, module
extraction and analysis
All the human PPIs present in Mentha (http://mentha.uniroma2.it/about.php), BioGRID
(version 3.4; https://wiki.thebiogrid.org/) (25), and HPRD (release 9; http://www.hprd.org/) databases were taken as the
background, and the PPIs among the differentially expressed mRNAs
identified in the previous step were obtained. The resulting PPIs
were then used for the construction of a PPI network using
Cytoscape software (26).
Additionally, CytoNCA (27)
(version 2.1.6; http://apps.cytoscape.org/apps/cytonca), a Cytoscape
plugin, was applied for the connectivity degree analysis. The
important nodes of the top-ranked connectivity degree were
considered as hub proteins (28).
The MCODE plug-in (29) of Cytoscape (26) applies a popular clustering method
that can be used to find clusters (highly interconnected regions)
in a network. In the present study, functional modules were
extracted from the PPI network using the MCODE plug-in (29). The parameters were set as follows:
Included loops, false degree; cut-off, 10; node score cut-off, 0.2;
haircut, true; fluff, false; K-core, 2; and max. depth from seed,
100. A KEGG pathway enrichment analysis was performed for the genes
in the selected modules using the DAVID tool (22), and the threshold was set at
P<0.05.
Analysis of lncRNA-mRNA regulatory
relationships
The Pearson's correlation coefficient r of each
differentially expressed lncRNA and mRNA was calculated based on
the expression values of the lncRNA and mRNA of the corresponding
samples. In addition, a correlation test was performed to obtain
the P-value. The lncRNA-mRNA pairs with |r| >0.85 and P<0.05
were identified, and the differentially expressed mRNA of the pair
was deemed to be the target gene of the lncRNA. Furthermore, a
functional and pathway enrichment analysis of the target genes of
these lncRNAs was performed using the R package clusterProfiler
(version 3.2.11, http://www.bioconductor.org/packages/release/bioc/html/clusterProfiler.html)
(30), of which the enriched
functions were considered functional properties of the lncRNAs. The
threshold for the enrichment analysis was set at BH-corrected
(21) adj. P-value <0.05.
lncRNA-lncRNA co-regulation and
functional synergistic analysis
A co-regulatory network among lncRNAs was
constructed based on the co-regulated genes targeted by two
lncRNAs. If the co-regulated target genes of the two lncRNAs have
significant GO BP (level 4) enrichment results, we believe there is
a functional synergistic effect between the two lncRNAs. The
functional synergistic network was constructed using all of the
functional synergistic lncRNAs. The GO BP enrichment analysis was
carried out using the R package clusterProfiler (30), with a significant enrichment
threshold of BH-corrected P-value <0.05.
Prognosis-related lncRNA
screening
The clinical data were analyzed to match the overall
survival time (OS) and survival status with samples in the tumor
group in the lncRNA matrix. We divided the differentially expressed
lncRNAs into two groups according to the median expression value of
the tumor group: high and low expression groups. The Kaplan-Meier
(K-M) survival curves (31) were
plotted and a log-rank test (31)
was performed for the two groups. Several survival-related
differentially expressed lncRNAs were obtained with P<0.05 as
the threshold for statistical significance.
In order to further screen for a prognosis-related
differentially expressed lncRNA signature, a Random Survival
Forests (RSF) (32) was carried
out. RSF is a new extension of Random Forests (RF) to survival
data. The bootstrap method was used to extract N samples from the
original data, and the survival tree model was established to
obtain the variable importance measure (VIMP) (33) of each variable, which measures the
predictiveness of a variable (a negative value or a value closer to
0 is not predictive). RSF is then used for competing risk data by
growing survival trees to estimate the cumulative hazard function
(CHF), which derives from each tree of the RSF (34).
The differential lncRNA expression data were
randomly divided into a test set (75% of the total samples) and a
validation set (25% of the total samples), and the R package
randomForestSRC (version 2.4.0, https://cran.r-project.org/web/packages/randomForestSRC/index.html)
was used for RSF analysis. First, the RSF model was constructed
through the test set to obtain the VIMP of each lncRNA in the
model, and the VIMP were ranked from high to low. In addition, the
lncRNAs were sorted in order and then included into the model to
obtain the error rate of the current model; when the error rate was
minimum, the current lncRNA combination was regarded as the optimal
combination of the RSF models. The RSF model was reconstructed with
the optimal combination, and the risk score was obtained by
accumulating CHF values at different time points for each patient.
The threshold that was used to distinguish high and low risk was
set as the median of the risk score.
The optimal combination of prognosis-related
differentially expressed lncRNAs was verified by the validation
set, and the risk score of each sample was obtained by using the
same parameters. The samples were divided into high- and low-risk
groups by using the risk score threshold set in the previous step.
The log-rank test was conducted on the K-M survival curves of the
two groups. Multivariate Cox regression analysis was performed with
clinical data to determine whether the identified lncRNA signatures
were independent of other clinical variables.
RNA extraction and RT-qPCR
COAD tissues and matched normal adjacent tissues of
9 COAD patients were obtained from a residual sample biobank of the
First Affiliated Hospital of Harbin Medical University (Harbin,
China). The samples used were previously coded and anonymized.
Total RNA was extracted using a Total RNA Extraction Kit (Axygen
BioScience Inc., Union City, CA, USA; cat. no., AP-MN-MS-RNA-250)
following standard protocols. RNA was reversed-transcribed into
cDNA using the THUNDERBIRD® SYBR® qPCR Mix
(Code no. QPS-201; Toyobo Co. Ltd., Japan). The quantitative
detection of lncRNAs was performed using cDNA with ReverTra Ace
qPCR RT Master Mix with the gDNA Remover (code no. FSQ-301; Toyobo)
and ABI 7500 fast (Applied Biosystems, Thermo Fisher Scientific,
Waltham, MA, USA). The reaction conditions used were: heat at 95°C
for 1 min; then denaturation at 95°C for 15 sec, annealing at 60°C
for 30 sec, and extension at 72°C for 60 sec for 40 cycles.
Experiments were performed in triplicate, and the results were
normalized to the expression of glyceraldehyde-3-phosphate
dehydrogenase (GAPDH). The primers used were: MYLK-AS1
forward, 5′-AGAGCAGGACAGCAGGTGTG-3′ and reverse,
5′-CCTGGCTTCCAATCTCACTG-3′; BVES-AS1 forward,
5′-TTTCATGTGTTCTCACTTCCATCC-3′ and reverse,
5′-TGCACTTCAGGCCACCAT-3′; ADAMTS9-AS1 forward,
5′-TCCACTCATCCTGGCTCTCA-3′ and reverse, 5′-TGGCTGATGGCACAGAACTT-3′;
FENDRR forward, 5′-CCTGCAGCCACTGAAGAATG-3′ and reverse,
5′-TGCAGTGCCTTGGACAGAAG-3′; GAPDH forward,
5′-GCTCTCTGCTCCTCCTGTTC-3′ and reverse, 5′-ACGACCAAATCCGTTGACTC-3′.
The comparative cycle threshold (2−ΔΔCt) method was used
to determine the relative quantitative value.
Statistical analysis
Data were expressed as mean ± standard deviation
(SD), and were analyzed using SPSS 17.0 (SPSS, Inc., Chicago, IL,
USA). The Mann-Whitney test was used to compare differences in
lncRNA concentrations between the COAD and control groups. The
log-rank test was used to compare differences in survival between
the COAD and control groups. The univariate and multivariate Cox
regression analyses were used to determine the risk score for
different variables. P<0.05 was regarded as statistically
significant.
Results
Basic characteristics of the
samples
The basic characteristics of 279 patients with COAD
are shown in Table I. The mean age
of the patients was 64.97±13.3 years. Sixty-nine patients who
succumbed to COAD were also included, accounting for 24.73% of the
total individuals, and the average survival time was 32.48±29.89
months. Fig. 1 shows the flowchart
of the analysis that was utilized in this study.
 | Table I.Basic characteristics of the 279
patients with COAD. |
Table I.
Basic characteristics of the 279
patients with COAD.
| Characteristic | Value |
|---|
| Age (mean ±
SD) | 64.97±13.3 |
| Sex
(male/female) | 154/125 |
| Pathologic_M
(M1/M0/NA) | 39/189/51 |
| Pathologic_N
(N2/N1/N0) | 46/70/163 |
| Pathologic_T
(T4/T3/T2/T1/NA) | 38/191/43/6/1 |
| Stage
(IV/III/II/I/NA) | 39/79/108/44/9 |
| Ethnicity
(white/black or | 191/54/11/23 |
|
African-American/Asian/NA) |
|
| Survival status
(dead/alive) | 69/210 |
Screening of differentially expressed
lncRNAs and mRNAs
According to the abovementioned method, 14,370 mRNAs
and 2,278 lncRNAs were filtered and utilized in the differential
expression analysis. Under the criterion for the differential
expression analysis, 976 differentially expressed mRNAs were
identified, including 304 upregulated and 672 downregulated mRNAs.
Additionally, 169 differentially expressed lncRNAs were identified,
including 57 upregulated and 112 downregulated lncRNAs.
Functional enrichment analysis of
differentially expressed mRNAs
The GO and KEGG pathway enrichment analysis was
performed on the upregulated and downregulated mRNAs, respectively.
The top 10 BP terms, top 5 CC terms, top 5 MF terms, and top 10
pathways enriched by separate upregulated and downregulated mRNAs
are shown in Fig. 2. The results
showed that the upregulated genes were significantly enriched in
the GO terms associated with embryonic development, cell
proliferation, and pathways, such as the Wnt signaling pathway and
the cytokine-cytokine receptor interaction pathway. Additionally,
the downregulated genes were significantly involved in the GO terms
associated with ion homeostasis and drug metabolism-related
pathways.
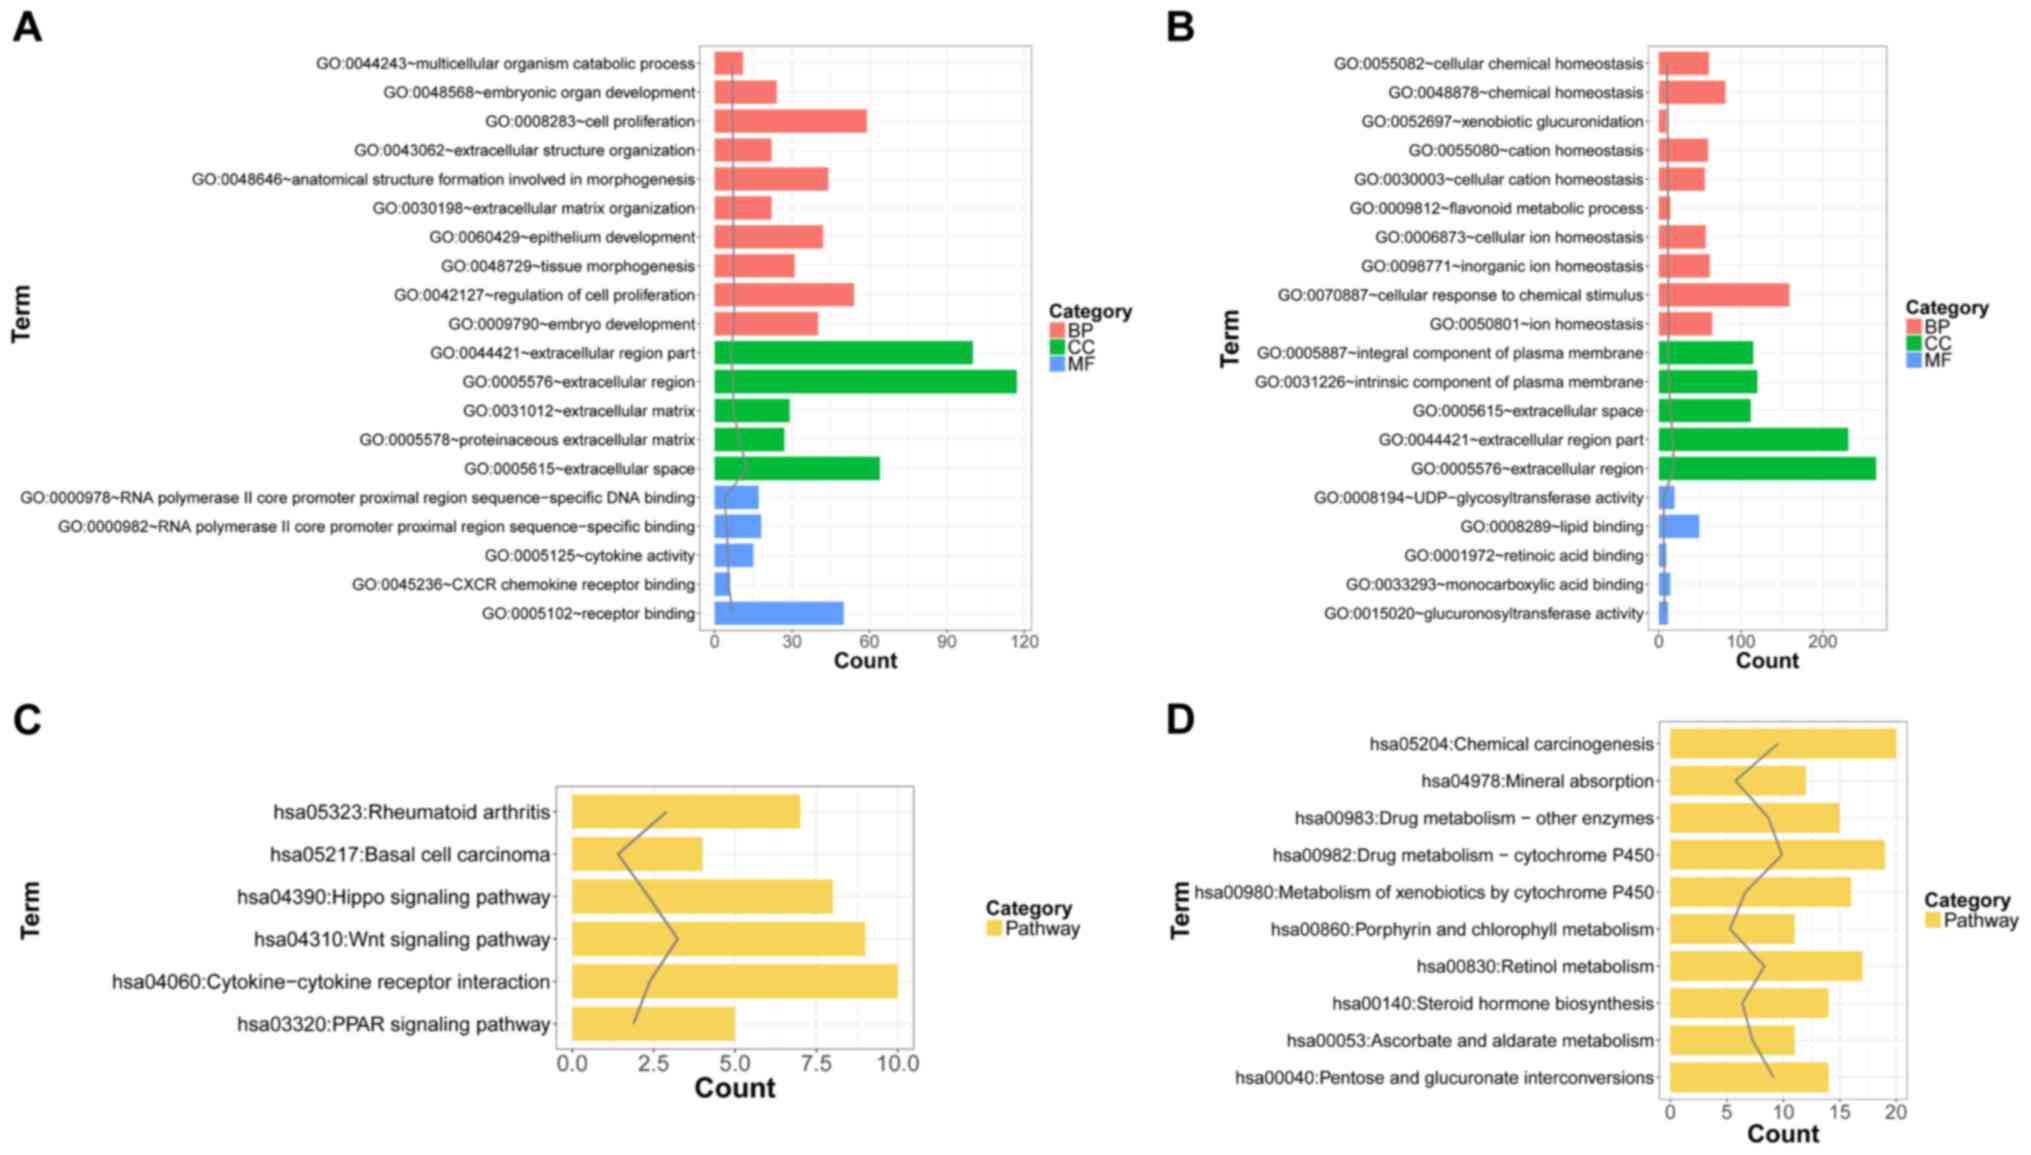 | Figure 2.The top 10, 5, 5 and 10 biological
process (BP), cellular component (CC), molecular function (MF), and
pathways, respectively, enriched by separate upregulated and
downregulated mRNAs. Top 10, 5, 5 and 10 BP, CC, MF and pathways,
respectively, enriched by (A and C) upregulated and (B and D)
downregulated mRNAs. BP, biological process; CC, cellular
component; MF, molecular function. |
PPI network construction and module
selection
We identified 339 PPIs formed by 317 differentially
expressed mRNAs in the PPI network, of which 106 genes were
upregulated and 211 genes were downregulated. The top 10 nodes with
higher degrees in the PPI network are shown in Table II, including the MyoD family
inhibitor (MDFI, degree=20), mesenchyme homeobox 2
(MEOX2; degree=13), thyroid hormone receptor interactor 13
(TRIP13; degree=11).
| Table II.The top 10 nodes with a higher degree
in the PPI network. |
Table II.
The top 10 nodes with a higher degree
in the PPI network.
| mRNA |
Upregulated/downregulated | Degree |
|---|
| MDFI | Up | 20 |
| MEOX2 | Down | 13 |
| TRIP13 | Up | 11 |
| MMP3 | Up | 10 |
| NR3C1 | Down | 9 |
| TFAP2A | Up | 9 |
| ADRB2 | Down | 8 |
| COL1A1 | Up | 8 |
| CRYAB | Down | 8 |
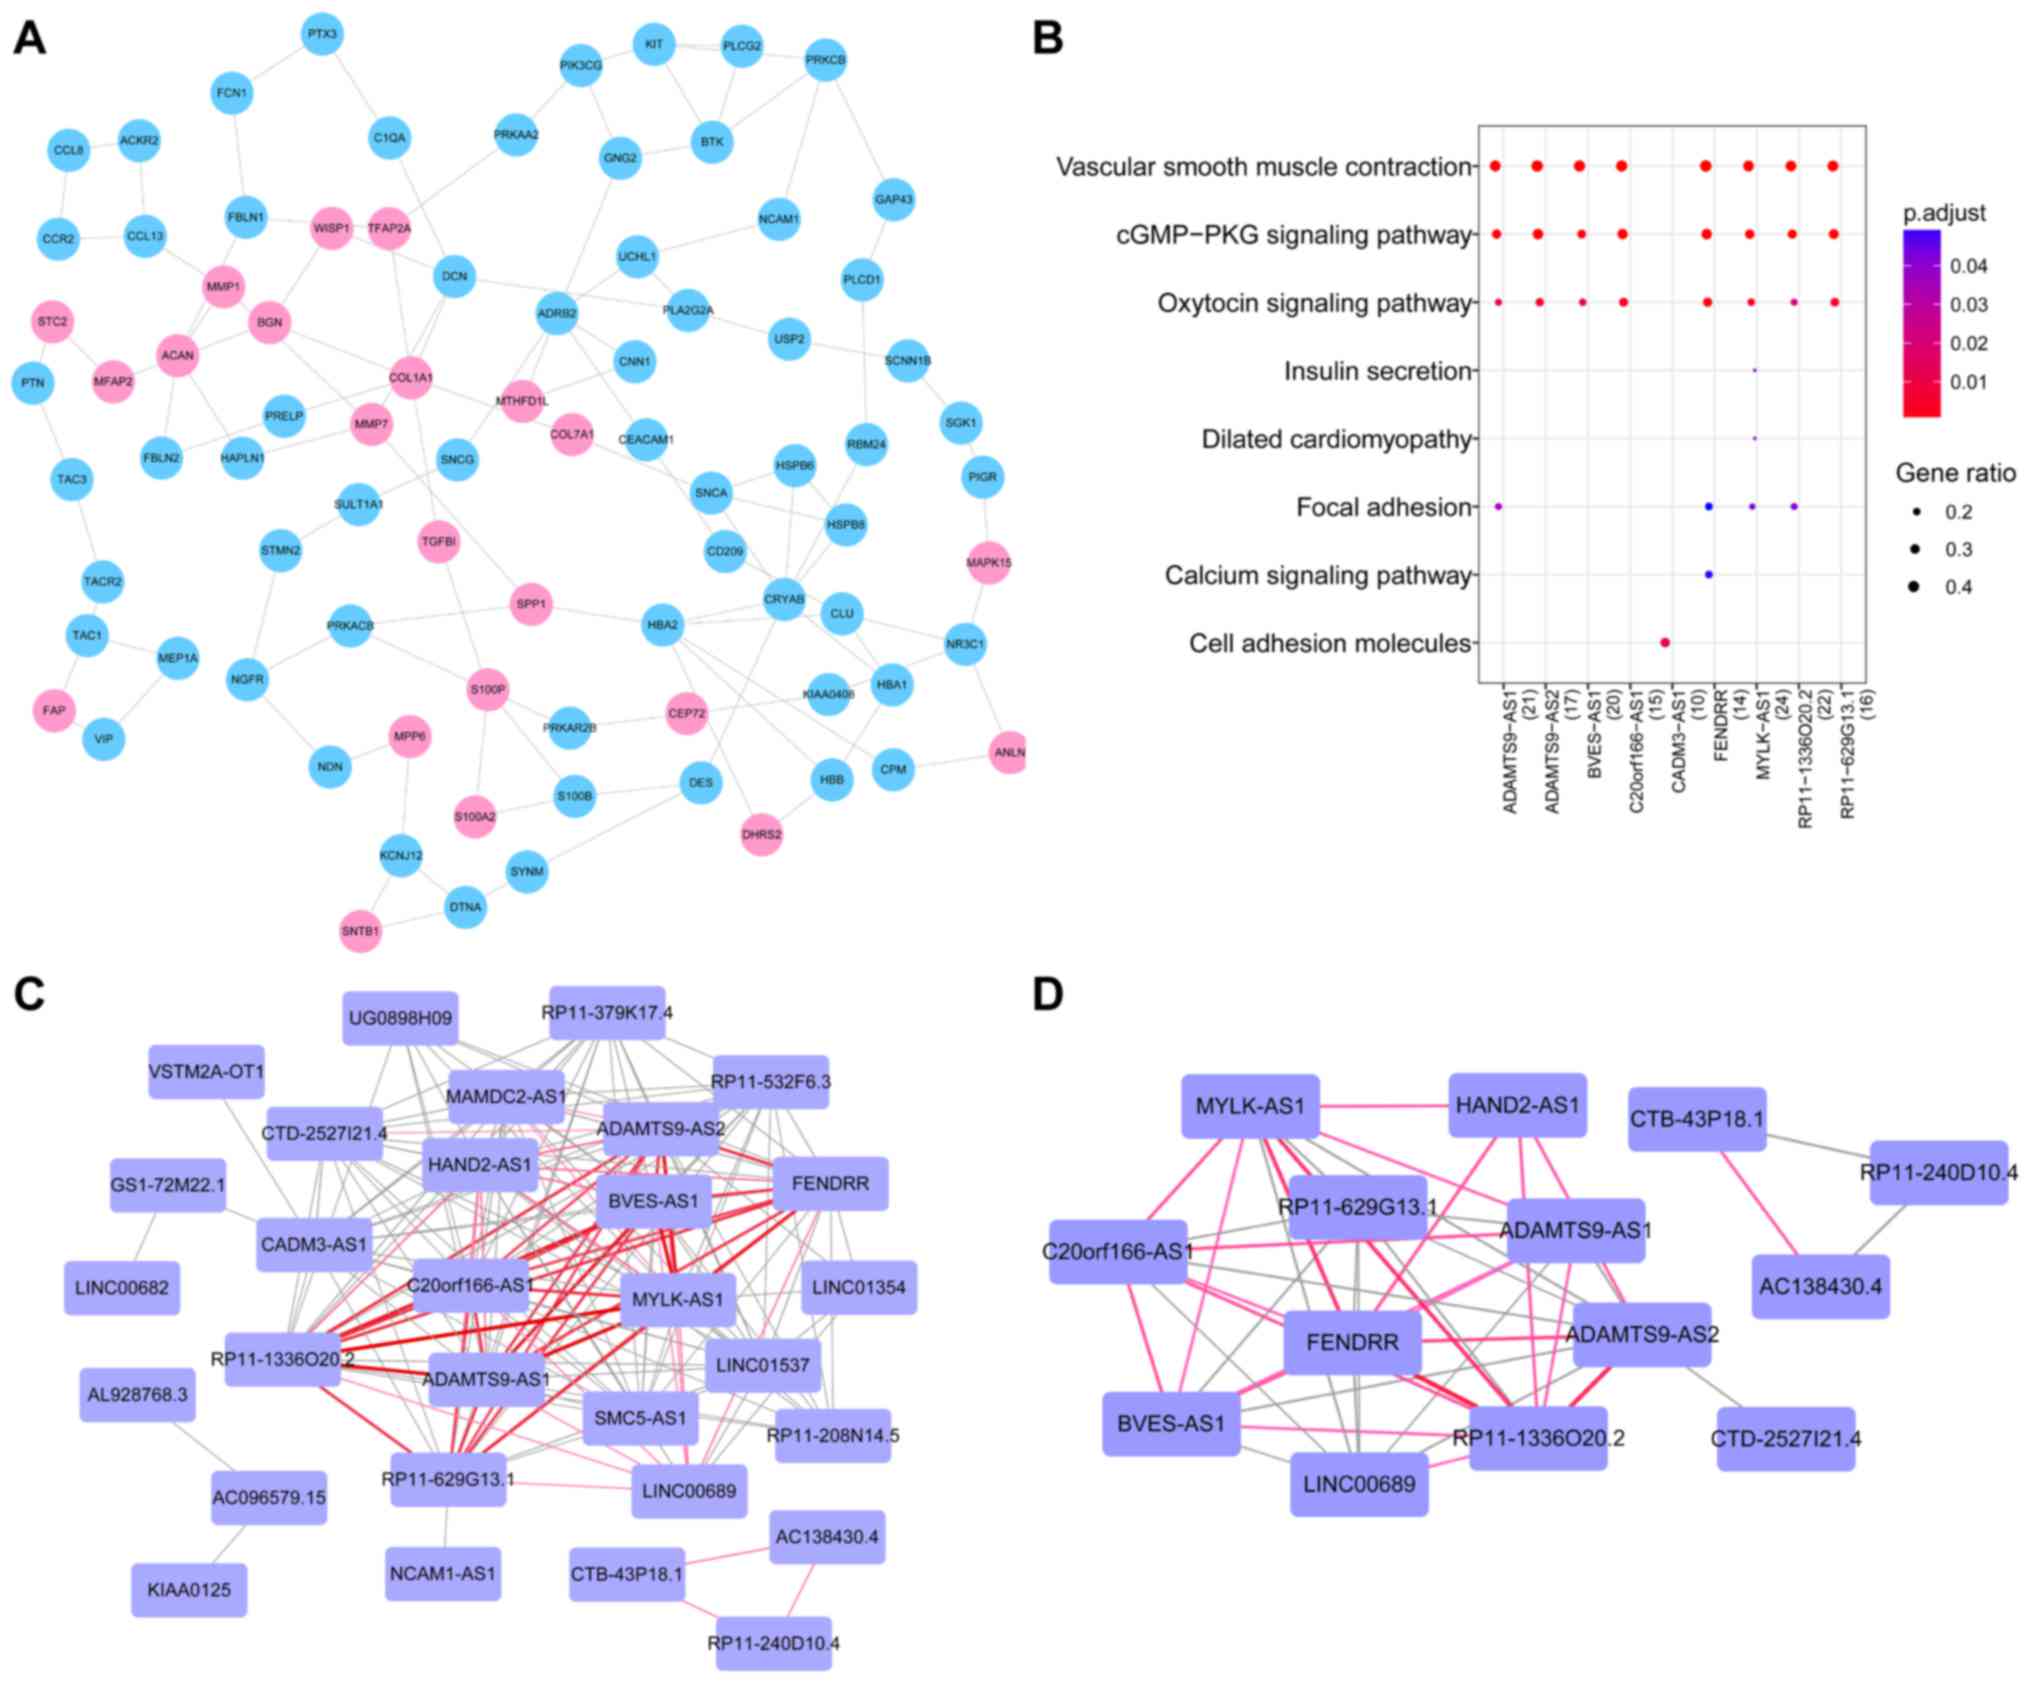
Additionally, further sub-network module mining was
performed in the network, and two significant modules (clusters)
were identified, of which the larger module was comprised of 84
mRNAs and 113 PPIs (Fig. 3A). To
infer the biological function of these mRNAs in the larger module,
they were subjected to a KEGG pathway analysis. The results showed
that these genes were significantly enriched in the Ras signaling
pathway. The other module contained three mRNAs, i.e., C-C motif
chemokine receptor 10 (CCR10), C-C motif chemokine ligand 19
(CCL19), and C-X-C motif chemokine ligand 13
(CXCL13).
Analysis of co-expression of lncRNAs
and mRNAs
We identified 612 lncRNA-mRNA pairs that were
significantly and differentially co-expressed, which consisted of
48 differential lncRNAs and 169 differentially expressed genes with
co-regulatory relationships. The mRNAs with co-regulatory
relationships were regarded as target genes for lncRNAs. To improve
the understanding of the function of the differentially expressed
lncRNAs that targeted genes, KEGG pathway enrichment analysis was
carried out for the top 10 lncRNAs with the most number of target
genes (n≥18). Nine pathways were identified, and we found that
these lncRNAs were mainly involved in vascular smooth muscle
contraction, the cGMP-PKG signaling pathway, and the oxytocin
signaling pathway (Fig. 3B).
lncRNA-lncRNA co-regulation and
functional synergistic analysis
An lncRNA-lncRNA co-regulation network was
constructed based on the co-regulated target genes of two lncRNAs
(Fig. 3C). This co-regulation
network included 30 nodes (lncRNAs) and 161 edges (interactions).
All of the lncRNAs included in this network were downregulated. In
addition, we found that several lncRNAs had more co-regulatory
relationships with other lncRNAs, such as MYLK-AS1 (n=19),
ADAMTS9-AS2 (n=19), and FENDRR (n=19), where n
represents the number of lncRNAs that had co-regulatory
relationships with an lncRNA. Moreover, several lncRNA/lncRNA pairs
had a larger number of co-regulated target genes, such as
MYLK-AS1/RP11-1336O20.2 (n=57),
ADAMTS9-AS1/MYLKAS1 (n=53),
ADAMTS9-AS1/RP11-1336O20.2 (n=53), and
BVES-AS1/MYLK-AS1 (n=51), where n represents the number of
co-regulated target genes of two lncRNAs.
On the other hand, functional synergistic network
was constructed, as shown in Fig.
3D, consisting of 14 lncRNAs and 44 functional synergistic
relationships. Among those functional synergistic lncRNA/lncRNA
pairs, several lncRNA-lncRNA pairs had a strong functional
synergistic effect, including FENDRR/RP11-1336O20.2 (n=35),
ADAMTS9-AS2/RP11-1336O20.2 (n=32),
MYLK-AS1/RP11-1336O20.2 (n=28) and FENDRR/MYLK-AS1
(n=28), where n represents the number of GO terms in which the two
lncRNAs were commonly involved.
Prognosis-related lncRNA
screening
A K-M survival analysis of the differential
expressed lncRNAs revealed 17 lncRNAs that were significantly
associated with survival. The differential lncRNA expression data
were randomly divided into a test set (75% of the total samples)
and a validation set (25% of the total samples), and the R package
randomForestSRC (version 2.4.0, https://cran.r-project.org/web/packages/randomForestSRC/index.html)
was used for the RSF analysis. First, the RSF model was constructed
through the test set to obtain the VIMP of each lncRNA in the
model, and then the VIMPs were ranked from high to low.
Furthermore, the lncRNAs sorted in order were included into the
model to obtain the error rate of the current model; when the error
rate was minimal, the corresponding lncRNA combination was regarded
as the optimal combination of RSF models. The RSF model was
reconstructed with the optimal combination, and the risk score was
obtained by accumulating CHF values at different time points for
each patient, and the threshold that was used to distinguish high
and low risk was set as the median of the risk score.
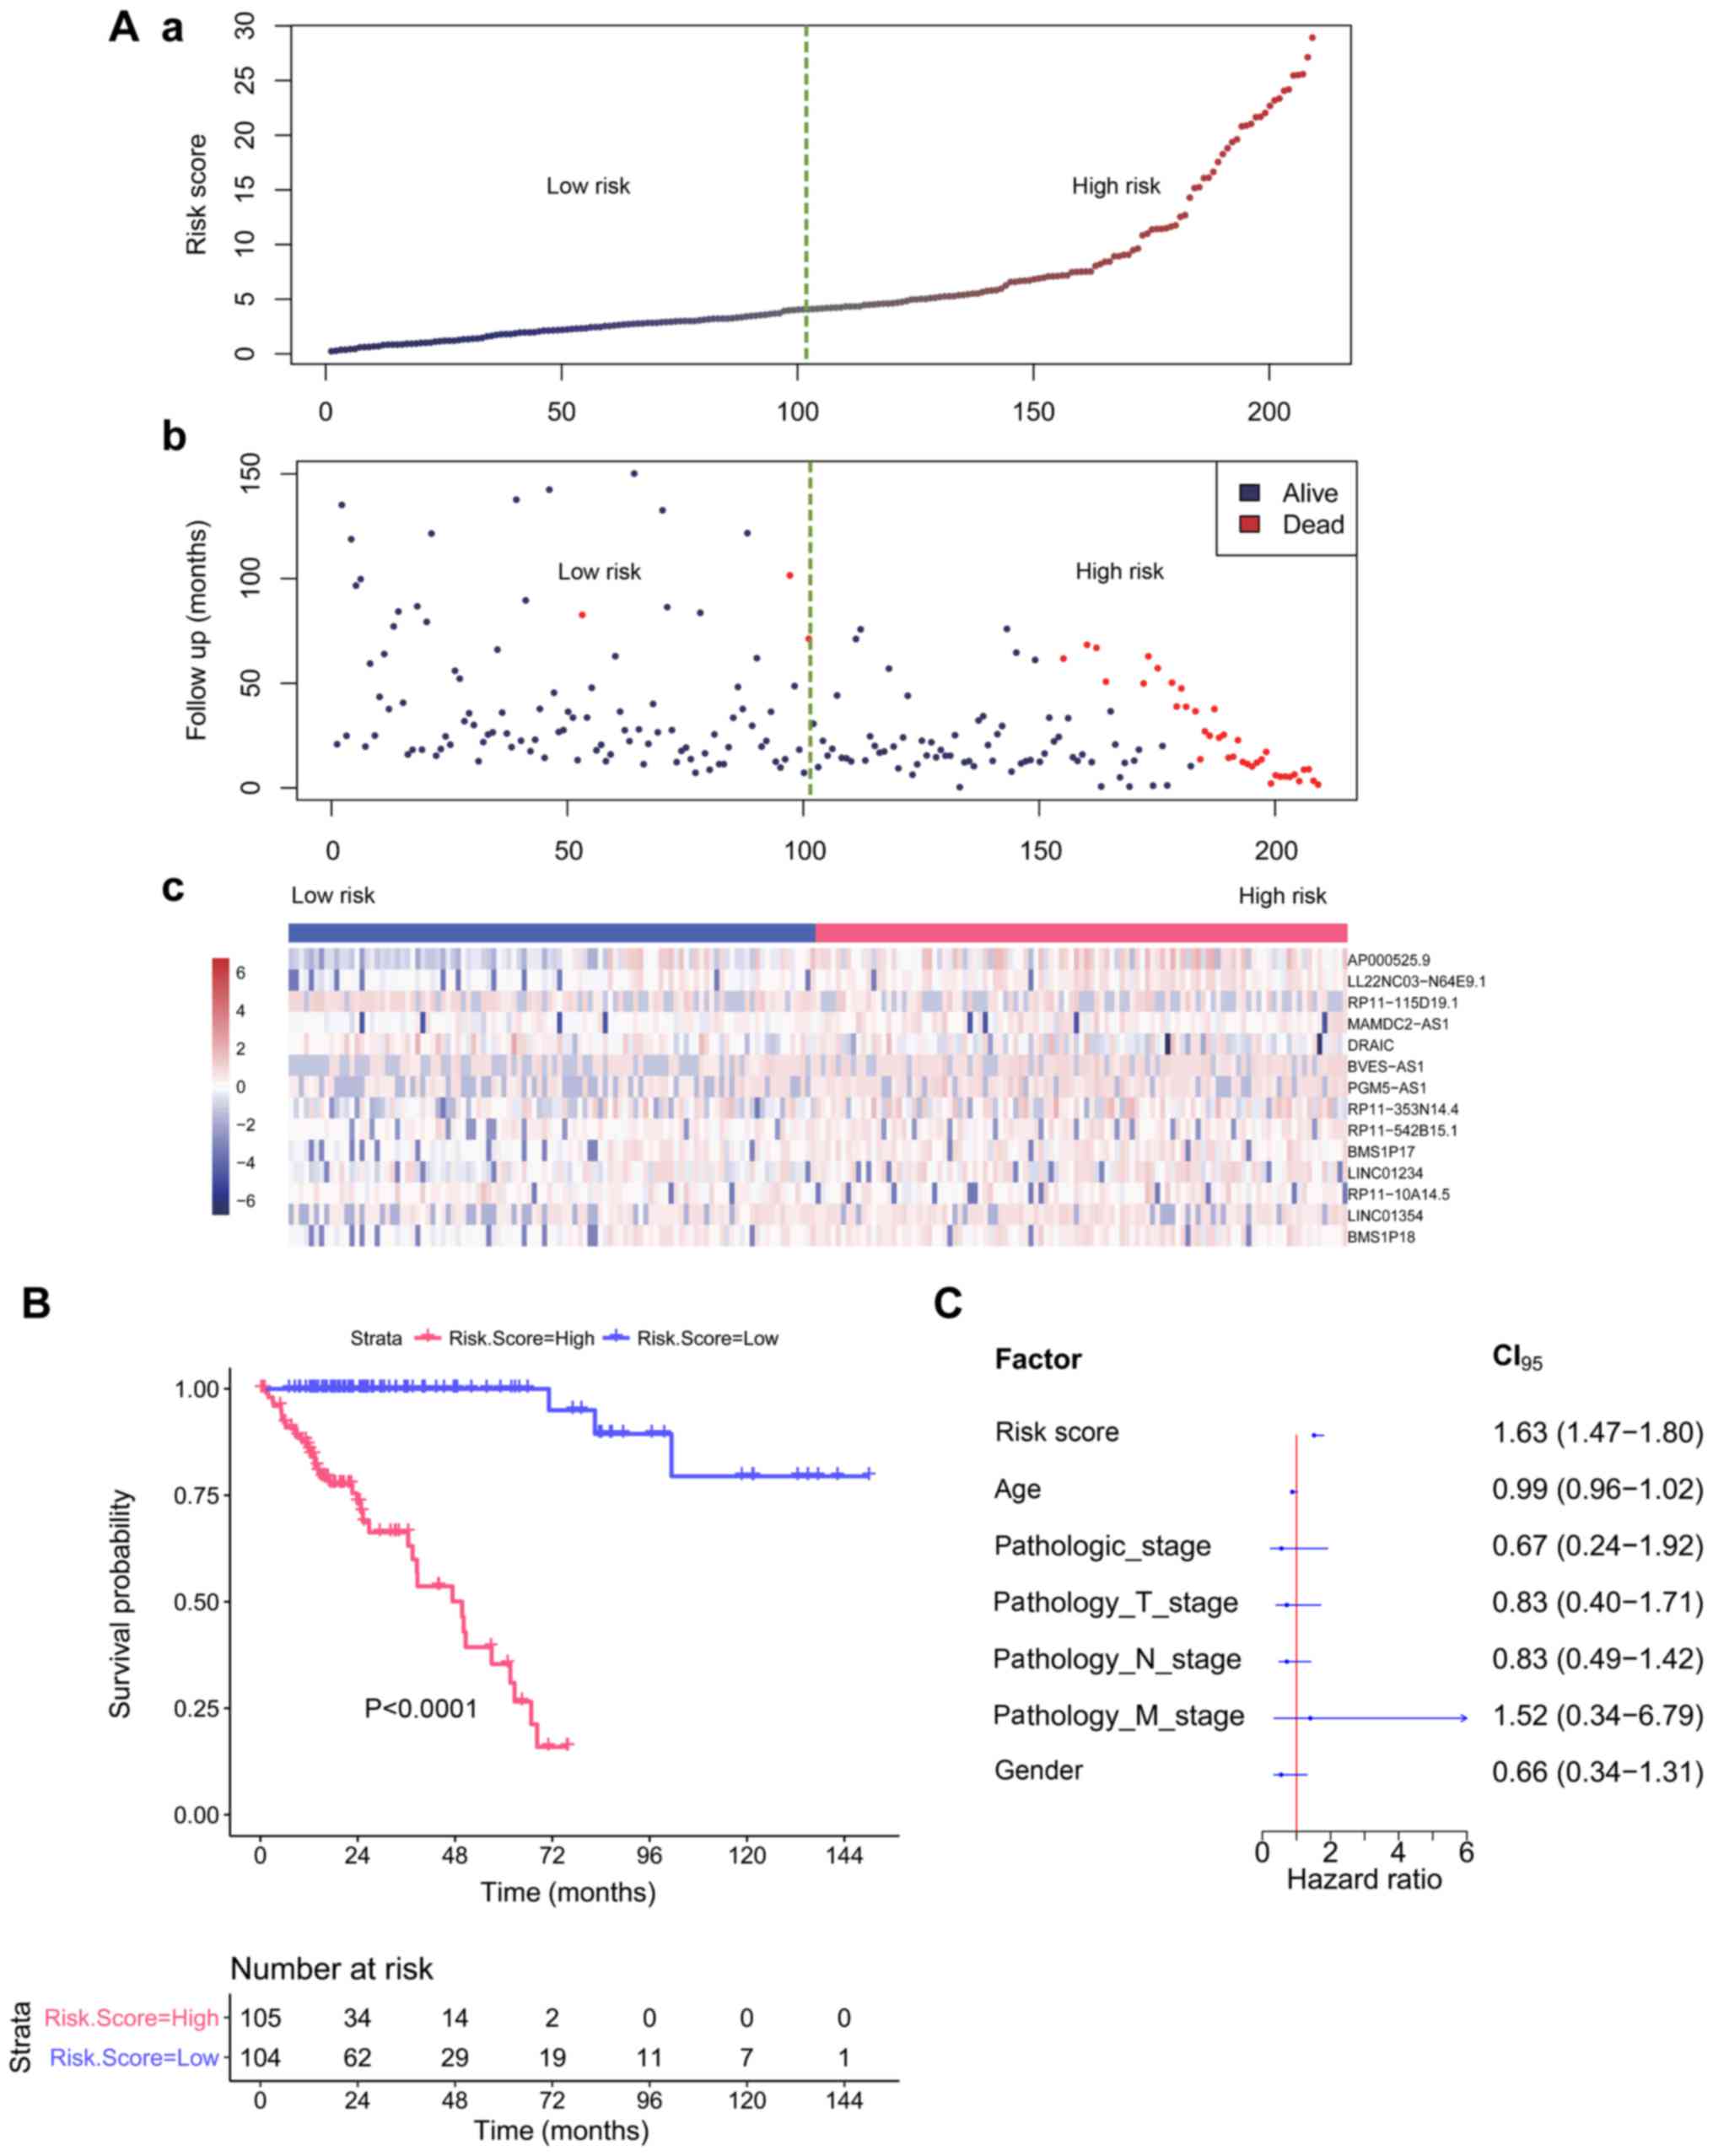
An RF model was constructed in the test set (n=209)
to obtain the VIMP of each lncRNA. According to the abovementioned
method, when the top 14 variables with VIMP ranked in order were
included into the model, the smallest error rate was achieved
(Fig. 4A). We reconstructed the RSF
model for the top 14 lncRNAs (AP000525.9, LL22NC03-N64E9.1,
RP11-115D19.1, MAMDC2-AS1, DRAIC, BVES-AS1, PGM5-AS1,
RP11-353N14.4, RP11-542B15.1, BMS1P17, LINC01234, RP11-10A14.5,
LINC01354, and BMS1P18), and obtained the risk score
(range: 0.21–28.89) for each patient based on the CHFs of the above
14 prognosis-related lncRNAs. The samples were divided into two
groups according to the median of risk score: a high-risk group
(risk score ≥4.12, n=105) and a low-risk group (risk score
<4.12, n=104). Additionally, the log-rank test demonstrated that
the survival rate of the high-risk group was significantly lower
than that of the low-risk group (P<0.0001).
Using the same model and parameters, we used a risk
score of 4.12 as the threshold in the validation set and divided
the samples into a high-risk group (n=52) and a low-risk group
(n=18). Similarly, the log-rank test showed a significant
difference in survival between the two groups (P=0.000023), and the
survival rate of the high-risk group was significantly lower than
that of the low-risk group (Fig.
4B).
The Cox model was constructed with the other known
clinical indicators, including age, pathologic_stage,
pathology_T_stage, pathology_N_stage, pathology_M_stage, and sex,
and the risk score was based on the 14 lncRNAs. As shown in
Table III, the univariate Cox
regression analysis revealed that the risk score, age,
pathologic_stage, pathology_T_stage, pathology_N_stage, and
pathology_M_stage were all significantly associated with OS in COAD
patients. Moreover, multivariate Cox regression analysis revealed
that the risk score was still significantly associated with OS even
after adjustment with other clinical factors (P<0.001) (Table III). The results showed that the
prognostic power of the 14-lncRNA signature was independent of
other clinical variables for predicting the survival of patients
with COAD. The hazard ratio (HR) of each variable is shown in
Fig. 4C.
| Table III.The results of Cox regression
analysis. |
Table III.
The results of Cox regression
analysis.
|
| Univariate Cox
regression | Multivariate Cox
regression |
|---|
|
|
|
|
|---|
| Variable | HR (95% CI) | P-value | HR (95% CI) | P-value |
|---|
| RiskScore | 1.92
(1.63–2.27) | <0.001 | 1.63
(1.47–1.80) | <0.001 |
| Age, years | 1.04
(1.01–1.07) |
0.00473 | 0.99
(0.96–1.02) |
0.561 |
|
Pathologic_stage | 1.97
(1.39–2.80) | <0.001 | 0.67
(0.24–1.92) |
0.457 |
|
Pathology_T_stage | 4.07
(2.07–8.00) | <0.001 | 0.83
(0.40–1.71) |
0.612 |
|
Pathology_N_stage | 2.09
(1.44–3.04) | <0.001 | 0.83
(0.49–1.42) |
0.501 |
|
Pathology_M_stage | 3.18
(1.54–6.57) |
0.00179 | 1.52
(0.34–6.79) |
0.583 |
| Sex
(male/female) | 0.62
(0.33–1.19) |
0.15 | 0.66
(0.34–1.31) |
0.239 |
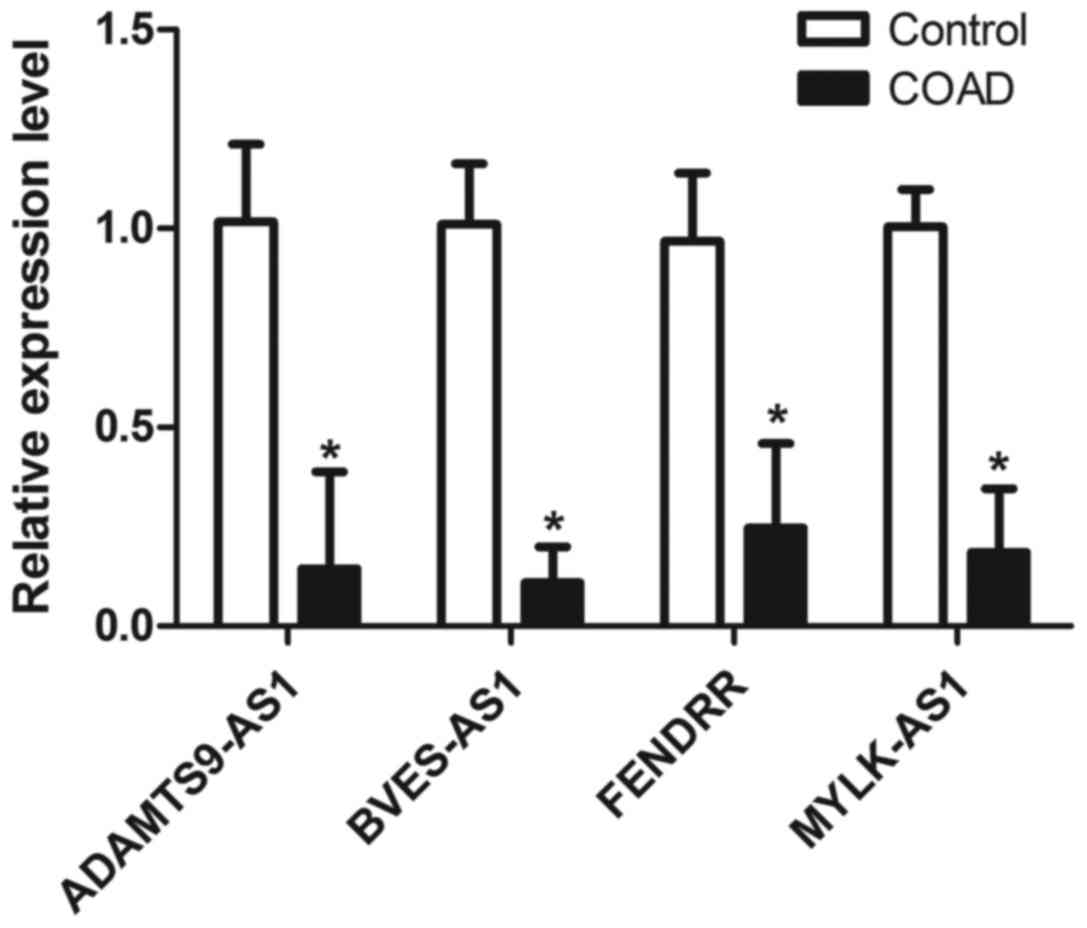
Validation of several lncRNAs using
RT-qPCR
We evaluated the expression levels of four candidate
lncRNAs by RT-qPCR analysis between the COAD tissues and paired
adjacent normal tissues of 9 patients from a residual sample
biobank of our hospital. The present study was approved by the
Ethics Committee of the First Affiliated Hospital of Harbin Medical
University (Harbin, China) and written informed consent was
obtained from all the subjects. The tissues were collected between
April, 2017 and September, 2017. The mean age of the patients was
68.3 years (range, 57–82 years) and the ratio of male to female was
7:2. As shown in Fig. 5,
MYLK-AS1, BVES-AS1, ADAMTS9-AS1, and FENDRR were all
downregulated in COAD samples compared to those in control samples
(P<0.05), which was consistent with the lncRNA expression
profiles determined by the above mentioned bioinformatics
analysis.
Discussion
In this study, we performed a bioinformatics
analysis of the data from COAD and control samples downloaded from
the TCGA database to investigate the global expression profile of
lncRNAs and mRNAs in colon cancer and to identify diagnostic
biomarkers for colon cancer. A total of 976 differentially
expressed mRNAs and 169 differentially expressed lncRNAs were
identified. MDFI and MEOX2 were the PPI network hubs.
By analysis of target genes of differentially expressed lncRNAs, we
found these lncRNAs were primarily involved in vascular smooth
muscle contraction and the cGMP-PKG signaling pathway. Several
lncRNA-lncRNA pairs had co-regulatory relationships or functional
synergistic effects, including BVES-AS1/MYLK-AS1,
ADAMTS9-AS1/MYLK-AS1, and FENDRR/MYLK-AS1. Moreover,
this study identified a 14-lncRNA signature that could be used to
predict the survival times for COAD patients.
MDFI is a known inhibitor of myogenic
differentiation (35). MDFI
regulates the Wnt signaling pathway (36), which plays a significant role in
cancer development and progression (37). A recent study has demonstrated that
MDFI was significantly methylated in colorectal cancer
tissues (38). In the present
study, MDFI was identified as a hub protein in the PPI network.
These findings suggested that MDFI plays a critical role in the
progression of COAD, which requires further validation. Moreover,
MEOX2 was also identified as a hub protein in the PPI network. Chen
et al demonstrated that MEOX2 regulated nuclear factor-κB
(NF-κB) activity in vascular endothelial cells and suggested MEOX2
as a possible molecular target for the anti-angiogenic therapy such
as cancer treatment (39). This
finding again provided evidence that MEOX2 may play a role in COAD
carcinogenesis, while further experimental evidence is required for
validation.
Vascular smooth muscle cells (VSMCs) are the main
cell type of the vascular wall and have critical functions in
vascular diseases (40).
Vasculogenesis involves the de novo formation of blood
vessels and occurs with the recruitment of VSMCs (41). Increasing evidence has demonstrated
that vasculogenesis is critical to tumor growth and metastasis
(42). On the other hand, it has
been shown that nitric oxide increased the migration and invasion
of colon cancer cells by upregulating matrix metalloproteinases
(MMP)-2/9 via the cGMP-PKG-ERK signaling pathways (43). In addition, Li et al
demonstrated that sulindac sulfide can selectively inhibit colon
tumor cell growth by increasing intracellular cGMP levels and
activating cGMP/PKG signaling (44). In this study, by analyzing the
differential expression of lncRNA target genes, we found that these
lncRNAs were mainly associated with vascular smooth muscle
contraction and cGMP-PKG signaling pathways. The results of the
present were consistent with those of previous studies (42–44),
further suggesting the potentially significant roles of identified
lncRNAs in the progression of COAD.
Many studies have been focused on the roles of
lncRNAs in cancer initiation and progression (45,46).
In the present study, through the lncRNA-lncRNA co-regulation and
functional synergistic analysis, we identified several pairs that
had significant co-regulatory relationships or functional
synergistic effects, such as BVES-AS1/MYLK-AS1,
ADAMTS9-AS1/MYLK-AS1, and FENDRR/MYLK-AS1. A previous
study has reported that a decreased expression of FENDRR was able
to predict poor prognosis in gastric cancer, and FENDRR was
able to regulate gastric cancer cell metastasis by affecting
fibronectin1 expression (47).
FENDRR was also downregulated in the current study. At present, few
studies have investigated the roles of ADAMTS9-AS1,
BVES-AS1, and MYLK-AS1. In the present study, these
three lncRNAs were all downregulated in COAD. Moreover, the
downregulation of MYLK-AS1, BVES-AS1, ADAMTS9-AS1, and
FENDRR in COAD tumors were further validated by RT-qPCR. Our
results suggested that these differentially expressed lncRNAs may
play critical roles in the development and progression of COAD.
However, since studies on the interactions and biological functions
of these lncRNAs are still lacking in patients with colon cancer,
many issues need to be addressed in the future.
Gene expression profile-based prognostic lncRNA
signatures for prognosis prediction in patients with cancer have
been previously investigated (48–50).
In the present study, we reported that the expression of 14 lncRNAs
can be used to predict the clinical outcome of COAD. A K-M survival
analysis of the identified differentially expressed lncRNAs and the
risk score method were performed, resulting in 14 prognostic lncRNA
markers, including BVES-AS1. Further survival analysis
demonstrated a clear separation in the survival curves between the
patient groups with high- or low-risk scores in the training or
testing datasets, indicating the predictive power of the 14-lncRNA
signature. The relationship between differentially expressed
lncRNAs and the survival of colorectal cancer patients has been
investigated in small samples using distinct approaches (51). For instance, Li et al
analyzed the prognostic value of 21 lncRNAs in 30 patients with
colorectal cancer using a PCR array (51). The current study used data based on
RNA-seq technology using a larger cohort from the TCGA database. In
addition, when taking other clinical factors into account, such as
age, pathologic_stage, pathology_T_stage, pathology_N_stage,
pathology_M_stage, and sex, the multivariate Cox regression
analysis revealed that the 14-lncRNA signature was independent of
the conventional clinicopathological factors, and can be used as a
risk factor for the prognosis of colon cancer (P<0.001).
However, the functions of only a few lncRNAs have been indicated. A
previous study reported that LL22NC03-N64E9.1 conferred an
oncogenic function in human colorectal cancer via partially
repressing KLF2 transcription (52). Sakurai et al showed that
lncRNA DRAIC may have a tumor suppressive role (53). Thus, no thorough functional
annotation data are available for the 14 prognostic lncRNAs in the
current study. However, we validated the differential pattern of
one of these 14 lncRNAs, BVES-AS1, in COAD patients compared
with controls. Further functional annotation of these prognostic
lncRNAs may increase our understanding of their biological
implications in determining COAD prognosis.
In conclusion, our study identified several
potentially significant genes (MDFI and MEOX2) and
lncRNAs (BVES-AS1, MYLK-AS1, ADAMTS9-AS1, and FENDRR)
in the progression of COAD. Moreover, a 14-lncRNA signature was
identified that could be used to predict the survival times for
patients with COAD. However, the data from the TCGA database were
based on RNA-seq data, and other in vitro and in vivo
experiments are needed to verify the current findings. These
findings may lead to novel insights pertaining to patient prognosis
and contribute to the development of novel therapeutic targets
against colon cancer in future.
Acknowledgements
Not applicable.
Glossary
Abbreviations
Abbreviations:
|
COAD
|
colon adenocarcinoma
|
|
lncRNAs
|
long non-coding RNAs
|
|
CDK1
|
cyclin-dependent kinase 1
|
|
TCGA
|
The Cancer Genome Atlas
|
|
PPI
|
protein-protein interaction
|
|
BH
|
Benjamini-Hochberg
|
|
FC
|
fold change
|
|
GO
|
Gene Ontology
|
|
KEGG
|
Kyoto Encyclopedia of Genes and
Genomes
|
|
BP
|
biological process
|
|
CC
|
cellular component
|
|
MF
|
molecular function
|
|
OS
|
overall survival time
|
|
K-M
|
Kaplan-Meier
|
|
RSF
|
Random Survival Forests
|
|
VIMP
|
variable importance measure
|
|
CHF
|
cumulative hazard function
|
References
|
1
|
Siegel RL, Miller KD and Jemal A: Cancer
statistics, 2016. CA Cancer J Clin. 66:7–30. 2016. View Article : Google Scholar : PubMed/NCBI
|
|
2
|
Corley DA, Jensen CD, Marks AR, Zhao WK,
Lee JK, Doubeni CA, Zauber AG, de Boer J, Fireman BH, Schottinger
JE, et al: Adenoma detection rate and risk of colorectal cancer and
death. N Engl J Med. 370:1298–1306. 2014. View Article : Google Scholar : PubMed/NCBI
|
|
3
|
Sung JJ, Lau JY, Goh KL and Leung WK: Asia
Pacific Working Group on Colorectal Cancer: Increasing incidence of
colorectal cancer in Asia: Implications for screening. Lancet
Oncol. 6:871–876. 2005. View Article : Google Scholar : PubMed/NCBI
|
|
4
|
Radice E, Miranda V and Bellone G:
Low-doses of sequential-kinetic-activated interferon-γ enhance the
ex vivo cytotoxicity of peripheral blood natural killer cells from
patients with early-stage colorectal cancer. A preliminary study.
Int Immunopharmacol. 19:66–73. 2014. View Article : Google Scholar : PubMed/NCBI
|
|
5
|
Jo YK, Roh SA, Lee H, Park NY, Choi ES, Oh
JH, Park SJ, Shin JH, Suh YA, Lee EK, et al: Polypyrimidine
tract-binding protein 1-mediated down-regulation of ATG10
facilitates metastasis of colorectal cancer cells. Cancer Lett.
385:21–27. 2017. View Article : Google Scholar : PubMed/NCBI
|
|
6
|
Mullany LE, Herrick JS, Wolff RK and
Slattery ML: MicroRNA seed region length impact on target messenger
RNA expression and survival in colorectal cancer. PLoS One.
11:e01541772016. View Article : Google Scholar : PubMed/NCBI
|
|
7
|
Kan JY, Yen MC, Wang JY, Wu DC, Chiu YJ,
Ho YW and Kuo PL: Nesfatin-1/Nucleobindin-2 enhances cell
migration, invasion, and epithelial-mesenchymal transition via
LKB1/AMPK/TORC1/ZEB1 pathways in colon cancer. Oncotarget.
7:31336–31349. 2016. View Article : Google Scholar : PubMed/NCBI
|
|
8
|
Unger C, Kramer N, Unterleuthner D,
Scherzer M, Burian A, Rudisch A, Stadler M, Schlederer M, Lenhardt
D, Riedl A, et al: Stromal-derived IGF2 promotes colon cancer
progression via paracrine and autocrine mechanisms. Oncogene.
36:5341–5355. 2017. View Article : Google Scholar : PubMed/NCBI
|
|
9
|
McFadden EJ and Hargrove AE: Biochemical
methods to investigate lncRNA and the influence of lncRNA:protein
complexes on chromatin. Biochemistry. 55:1615–1630. 2016.
View Article : Google Scholar : PubMed/NCBI
|
|
10
|
Liz J and Esteller M: lncRNAs and
microRNAs with a role in cancer development. Biochim Biophys Acta.
1859:169–176. 2016. View Article : Google Scholar : PubMed/NCBI
|
|
11
|
Lees-Miller SP, Beattie TL and Tainer JA:
Noncoding RNA joins Ku and DNA-PKcs for DNA-break resistance in
breast cancer. Nat Struct Mol Biol. 23:509–510. 2016. View Article : Google Scholar : PubMed/NCBI
|
|
12
|
Quinn JJ and Chang HY: Unique features of
long non-coding RNA biogenesis and function. Nat Rev Genet.
17:47–62. 2016. View Article : Google Scholar : PubMed/NCBI
|
|
13
|
He X, Tan X, Wang X, Jin H, Liu L, Ma L,
Yu H and Fan Z: C-Myc-activated long noncoding RNA CCAT1 promotes
colon cancer cell proliferation and invasion. Tumour Biol.
35:12181–12188. 2014. View Article : Google Scholar : PubMed/NCBI
|
|
14
|
Yue B, Qiu S, Zhao S, Liu C, Zhang D, Yu
F, Peng Z and Yan D: LncRNA-ATB mediated E-cadherin repression
promotes the progression of colon cancer and predicts poor
prognosis. J Gastroenterol Hepatol. 31:595–603. 2016. View Article : Google Scholar : PubMed/NCBI
|
|
15
|
Thorenoor N, Faltejskova-Vychytilova P,
Hombach S, Mlcochova J, Kretz M, Svoboda M and Slaby O: Long
non-coding RNA ZFAS1 interacts with CDK1 and is involved in
p53-dependent cell cycle control and apoptosis in colorectal
cancer. Oncotarget. 7:622–637. 2016. View Article : Google Scholar : PubMed/NCBI
|
|
16
|
Harrow J, Frankish A, Gonzalez JM,
Tapanari E, Diekhans M, Kokocinski F, Aken BL, Barrell D, Zadissa
A, Searle S, et al: GENCODE: The reference human genome annotation
for The ENCODE Project. Genome Res. 22:1760–1774. 2012. View Article : Google Scholar : PubMed/NCBI
|
|
17
|
Soneson C and Delorenzi M: A comparison of
methods for differential expression analysis of RNA-seq data. BMC
Bioinformatics. 14:912013. View Article : Google Scholar : PubMed/NCBI
|
|
18
|
Robinson MD, McCarthy DJ and Smyth GK:
edgeR: A Bioconductor package for differential expression analysis
of digital gene expression data. Bioinformatics. 26:139–140. 2010.
View Article : Google Scholar : PubMed/NCBI
|
|
19
|
Law CW, Chen Y, Shi W and Smyth GK: voom:
Precision weights unlock linear model analysis tools for RNA-seq
read counts. Genome Biol. 15:R292014. View Article : Google Scholar : PubMed/NCBI
|
|
20
|
Ritchie ME, Phipson B, Wu D, Hu Y, Law CW,
Shi W and Smyth GK: limma powers differential expression
analyses for RNA-sequencing and microarray studies. Nucleic Acids
Res. 43:e472015. View Article : Google Scholar : PubMed/NCBI
|
|
21
|
Benjamini Y and Hochberg Y: Controlling
the false discovery rate: A practical and powerful approach to
multiple testing. J R Stat Soc B. 57:289–300. 1995.
|
|
22
|
Huang DW, Sherman BT, Tan Q, Kir J, Liu D,
Bryant D, Guo Y, Stephens R, Baseler MW, Lane HC, et al: DAVID
Bioinformatics Resources: Expanded annotation database and novel
algorithms to better extract biology from large gene lists. Nucleic
Acids Res. 35 Suppl 2:W169–175. 2007. View Article : Google Scholar : PubMed/NCBI
|
|
23
|
Ashburner M, Ball CA, Blake JA, Botstein
D, Butler H, Cherry JM, Davis AP, Dolinski K, Dwight SS, Eppig JT,
et al: The Gene Ontology Consortium: Gene ontology: Tool for the
unification of biology. Nat Genet. 25:25–29. 2000. View Article : Google Scholar : PubMed/NCBI
|
|
24
|
Kanehisa M, Goto S, Kawashima S, Okuno Y
and Hattori M: The KEGG resource for deciphering the genome.
Nucleic Acids Res. 32:D277–D280. 2004. View Article : Google Scholar : PubMed/NCBI
|
|
25
|
Chatr-Aryamontri A, Breitkreutz BJ,
Oughtred R, Boucher L, Heinicke S, Chen D, Stark C, Breitkreutz A,
Kolas N, O'Donnell L, et al: The BioGRID interaction database: 2015
update. Nucleic Acids Res. 43:D470–D478. 2015. View Article : Google Scholar : PubMed/NCBI
|
|
26
|
Kohl M, Wiese S and Warscheid B:
Cytoscape: Software for visualization and analysis of biological
networks. Methods Mol Biol. 291–303. 2011. View Article : Google Scholar : PubMed/NCBI
|
|
27
|
Tang Y, Li M, Wang J, Pan Y and Wu FX:
CytoNCA: A cytoscape plugin for centrality analysis and evaluation
of protein interaction networks. Biosystems. 127:67–72. 2015.
View Article : Google Scholar : PubMed/NCBI
|
|
28
|
He X and Zhang J: Why do hubs tend to be
essential in protein networks? PLoS Genet. 2:e882006. View Article : Google Scholar : PubMed/NCBI
|
|
29
|
Bader GD and Hogue CW: An automated method
for finding molecular complexes in large protein interaction
networks. BMC Bioinformatics. 4:22003. View Article : Google Scholar : PubMed/NCBI
|
|
30
|
Yu G, Wang L-G, Han Y and He Q-Y:
clusterProfiler: An R package for comparing biological themes among
gene clusters. OMICS. 16:284–287. 2012. View Article : Google Scholar : PubMed/NCBI
|
|
31
|
Xie J and Liu C: Adjusted Kaplan-Meier
estimator and log-rank test with inverse probability of treatment
weighting for survival data. Stat Med. 24:3089–3110. 2005.
View Article : Google Scholar : PubMed/NCBI
|
|
32
|
Ishwaran H, Kogalur UB, Blackstone EH and
Lauer MS: Random survival forests. Ann Appl Stat. 2:841–860. 2008.
View Article : Google Scholar
|
|
33
|
Ishwaran H: Variable importance in binary
regression trees and forests. Electron J Stat. 1:519–537. 2007.
View Article : Google Scholar
|
|
34
|
Villanueva A, Portela A, Sayols S,
Battiston C, Hoshida Y, Méndez-González J, Imbeaud S, Letouzé E,
Hernandez-Gea V, Cornella H, et al: HEPTROMIC Consortium: DNA
methylation-based prognosis and epidrivers in hepatocellular
carcinoma. Hepatology. 61:1945–1956. 2015. View Article : Google Scholar : PubMed/NCBI
|
|
35
|
Berkes CA and Tapscott SJ: MyoD and the
transcriptional control of myogenesis. Semin Cell Dev Biol.
16:585–595. 2005. View Article : Google Scholar : PubMed/NCBI
|
|
36
|
Kusano S and Raab-Traub N: I-mfa domain
proteins interact with Axin and affect its regulation of the Wnt
and c-Jun N-terminal kinase signaling pathways. Mol Cell Biol.
22:6393–6405. 2002. View Article : Google Scholar : PubMed/NCBI
|
|
37
|
Amado NG, Predes D, Fonseca BF, Cerqueira
DM, Reis AH, Dudenhoeffer AC, Borges HL, Mendes FA and Abreu JG:
Isoquercitrin suppresses colon cancer cell growth in vitro by
targeting the Wnt/β-catenin signaling pathway. J Biol Chem.
289:35456–35467. 2014. View Article : Google Scholar : PubMed/NCBI
|
|
38
|
Li J, Chen C, Bi X, Zhou C, Huang T, Ni C,
Yang P, Chen S, Ye M and Duan S: DNA methylation of CMTM3,
SSTR2, and MDFI genes in colorectal cancer. Gene.
630:1–7. 2017. View Article : Google Scholar : PubMed/NCBI
|
|
39
|
Chen Y, Rabson AB and Gorski DH: MEOX2
regulates nuclear factor-kappaB activity in vascular endothelial
cells through interactions with p65 and IkappaBbeta. Cardiovasc
Res. 87:723–731. 2010. View Article : Google Scholar : PubMed/NCBI
|
|
40
|
Stegemann JP, Hong H and Nerem RM:
Mechanical, biochemical, and extracellular matrix effects on
vascular smooth muscle cell phenotype. J Appl Physiol 1985.
98:2321–2327. 2005. View Article : Google Scholar : PubMed/NCBI
|
|
41
|
Herbert SP and Stainier DY: Molecular
control of endothelial cell behaviour during blood vessel
morphogenesis. Nat Rev Mol Cell Biol. 12:551–564. 2011. View Article : Google Scholar : PubMed/NCBI
|
|
42
|
Baeten CI, Hillen F, Pauwels P, de Bruine
AP and Baeten CG: Prognostic role of vasculogenic mimicry in
colorectal cancer. Dis Colon Rectum. 52:2028–2035. 2009. View Article : Google Scholar : PubMed/NCBI
|
|
43
|
Babykutty S, Suboj P, Srinivas P, Nair AS,
Chandramohan K and Gopala S: Insidious role of nitric oxide in
migration/invasion of colon cancer cells by upregulating MMP-2/9
via activation of cGMP-PKG-ERK signaling pathways. Clin Exp
Metastasis. 29:471–492. 2012. View Article : Google Scholar : PubMed/NCBI
|
|
44
|
Li N, Xi Y, Tinsley HN, Gurpinar E, Gary
BD, Zhu B, Li Y, Chen X, Keeton AB, Abadi AH, et al: Sulindac
selectively inhibits colon tumor cell growth by activating the
cGMP/PKG pathway to suppress Wnt/β-catenin signaling. Mol Cancer
Ther. 12:1848–1859. 2013. View Article : Google Scholar : PubMed/NCBI
|
|
45
|
Raveh E, Matouk IJ, Gilon M and Hochberg
A: The H19 Long non-coding RNA in cancer initiation, progression
and metastasis - a proposed unifying theory. Mol Cancer.
14:1842015. View Article : Google Scholar : PubMed/NCBI
|
|
46
|
Iguchi T, Uchi R, Nambara S, Saito T,
Komatsu H, Hirata H, Ueda M, Sakimura S, Takano Y, Kurashige J, et
al: A long noncoding RNA, lncRNA-ATB, is involved in the
progression and prognosis of colorectal cancer. Anticancer Res.
35:1385–1388. 2015.PubMed/NCBI
|
|
47
|
Xu TP, Huang MD, Xia R, Liu XX, Sun M, Yin
L, Chen WM, Han L, Zhang EB, Kong R, et al: Decreased expression of
the long non-coding RNA FENDRR is associated with poor
prognosis in gastric cancer and FENDRR regulates gastric
cancer cell metastasis by affecting fibronectin1 expression. J
Hematol Oncol. 7:632014. View Article : Google Scholar : PubMed/NCBI
|
|
48
|
Zhou M, Sun Y, Sun Y, Xu W, Zhang Z, Zhao
H, Zhong Z and Sun J: Comprehensive analysis of lncRNA expression
profiles reveals a novel lncRNA signature to discriminate
nonequivalent outcomes in patients with ovarian cancer. Oncotarget.
7:32433–32448. 2016.PubMed/NCBI
|
|
49
|
Sun J, Chen X, Wang Z, Guo M, Shi H, Wang
X, Cheng L and Zhou M: A potential prognostic long non-coding RNA
signature to predict metastasis-free survival of breast cancer
patients. Sci Rep. 5:165532015. View Article : Google Scholar : PubMed/NCBI
|
|
50
|
Li J, Chen Z, Tian L, Zhou C, He MY, Gao
Y, Wang S, Zhou F, Shi S, Feng X, et al: LncRNA profile study
reveals a three-lncRNA signature associated with the survival of
patients with oesophageal squamous cell carcinoma. Gut.
63:1700–1710. 2014. View Article : Google Scholar : PubMed/NCBI
|
|
51
|
Li Q, Dai Y, Wang F and Hou S:
Differentially expressed long non-coding RNAs and the prognostic
potential in colorectal cancer. Neoplasma. 63:977–983. 2016.
View Article : Google Scholar : PubMed/NCBI
|
|
52
|
Lian Y, Yan C, Ding J, Xia R, Ma Z, Hui B,
Ji H, Zhou J and Wang K: A novel lncRNA, LL22NC03-N64E9.1,
represses KLF2 transcription through binding with EZH2 in
colorectal cancer. Oncotarget. 8:59435–59445. 2017. View Article : Google Scholar : PubMed/NCBI
|
|
53
|
Sakurai K, Reon BJ, Anaya J and Dutta A:
The lncRNA DRAIC/PCAT29 locus constitutes a
tumor-suppressive nexus. Mol Cancer Res. 13:828–838. 2015.
View Article : Google Scholar : PubMed/NCBI
|