Introduction
Colorectal cancer (CRC) is a major disease
worldwide. Histopathology has been a traditional method for the
diagnosis of CRC (1). However,
recent genome-wide molecular analysis indicated disease
heterogeneity in patients with similar pathology (2). With the advent and lower cost of
microarray and next-generation sequencing (NGS) technologies,
genome-wide screening of candidate genes is possible. To date, tens
of millions of transcriptome datasets have been generated and
deposited in public databases (3).
Therefore, it is a great challenge for researchers to extract
meaningful information from these huge datasets.
Many scientists reanalyze transcriptomes using
publically available data to promote the understanding of CRC. For
example, ColoGuideEx is a 13-gene expression classifier for
prognosis prediction specific to patients with stage II CRC
(4). ColoGuideEx is derived from
315 CRC transcriptomes, and its robustness was shown across patient
series, populations and different microarrays (4). A 54 gene-set metastasis-prone
signature was proposed for patients with early-stage
mismatch-repair proficient sporadic colorectal cancer (5). Gene Set Enrichment Analysis was
applied to mucosal and adenoma transcriptomes to identify gene
signatures that are associated with colon carcinogenesis (6). Genome-wide association studies (GWAS)
have identified several loci with weak predictive value in CRC
(7). Pathway-based analyses have
enhanced the interpretation of GWAS data, and transcriptome data
have confirmed the pathways (7). In
addition, NGS has been applied to CRC transcriptome analysis. For
example, a tumor-restricted gene fusion, PRTEN-NOTCH2, was detected
and experimentally confirmed, which provides deeper insights into
the complexity of regulatory changes during tumorigenesis (8). There are also numerous CRC
transcriptome analyses that characterize gene expression at the
genome level (1).
With the development of cell separation methods,
cell type-specific analyses have also been performed. For instance,
cluster of differentiation (CD) 133 is an important biomarker of
CRC stem cells. Transcriptome analysis of CD133+ stem
cells indicated the prognostic value of survivin in CRC (9). Different cell types in the CRC niche,
including cancer cells and stromal cells, were separated by flow
cytometry. Transcriptome analyses have identified stromal
transforming growth factor-β gene signatures that predict
recurrence (10). Transcriptome
analyses have also identified a stem/serrated/mesenchymal (SSM)
transcriptional subtype of CRC, which is associated with poor
diagnosis. The upregulated genes in the SSM subtype are prominently
expressed by stromal cells, which suggest that these transcripts
are derived from stromal cells instead of epithelial cancer cells
(11). The involement of stromal
cells in CRC has been well established (11).
In the present study, weighted gene co-expression
network analysis (WGCNA) of the CRC transcriptome was performed and
18 gene co-expression modules were identified. Highly connected
genes were screened, and the clinical relevance of these genes was
validated in additional datasets containing clinical parameters.
The expression of collagen type VI α3 chain (COL6A3) was discovered
to be fibroblast-specific and associated with stromal cancer. The
role of COL6A3 was experimentally verified in CRC cell line,
SW480.
Materials and methods
CRC transcriptome data collection and
preprocessing
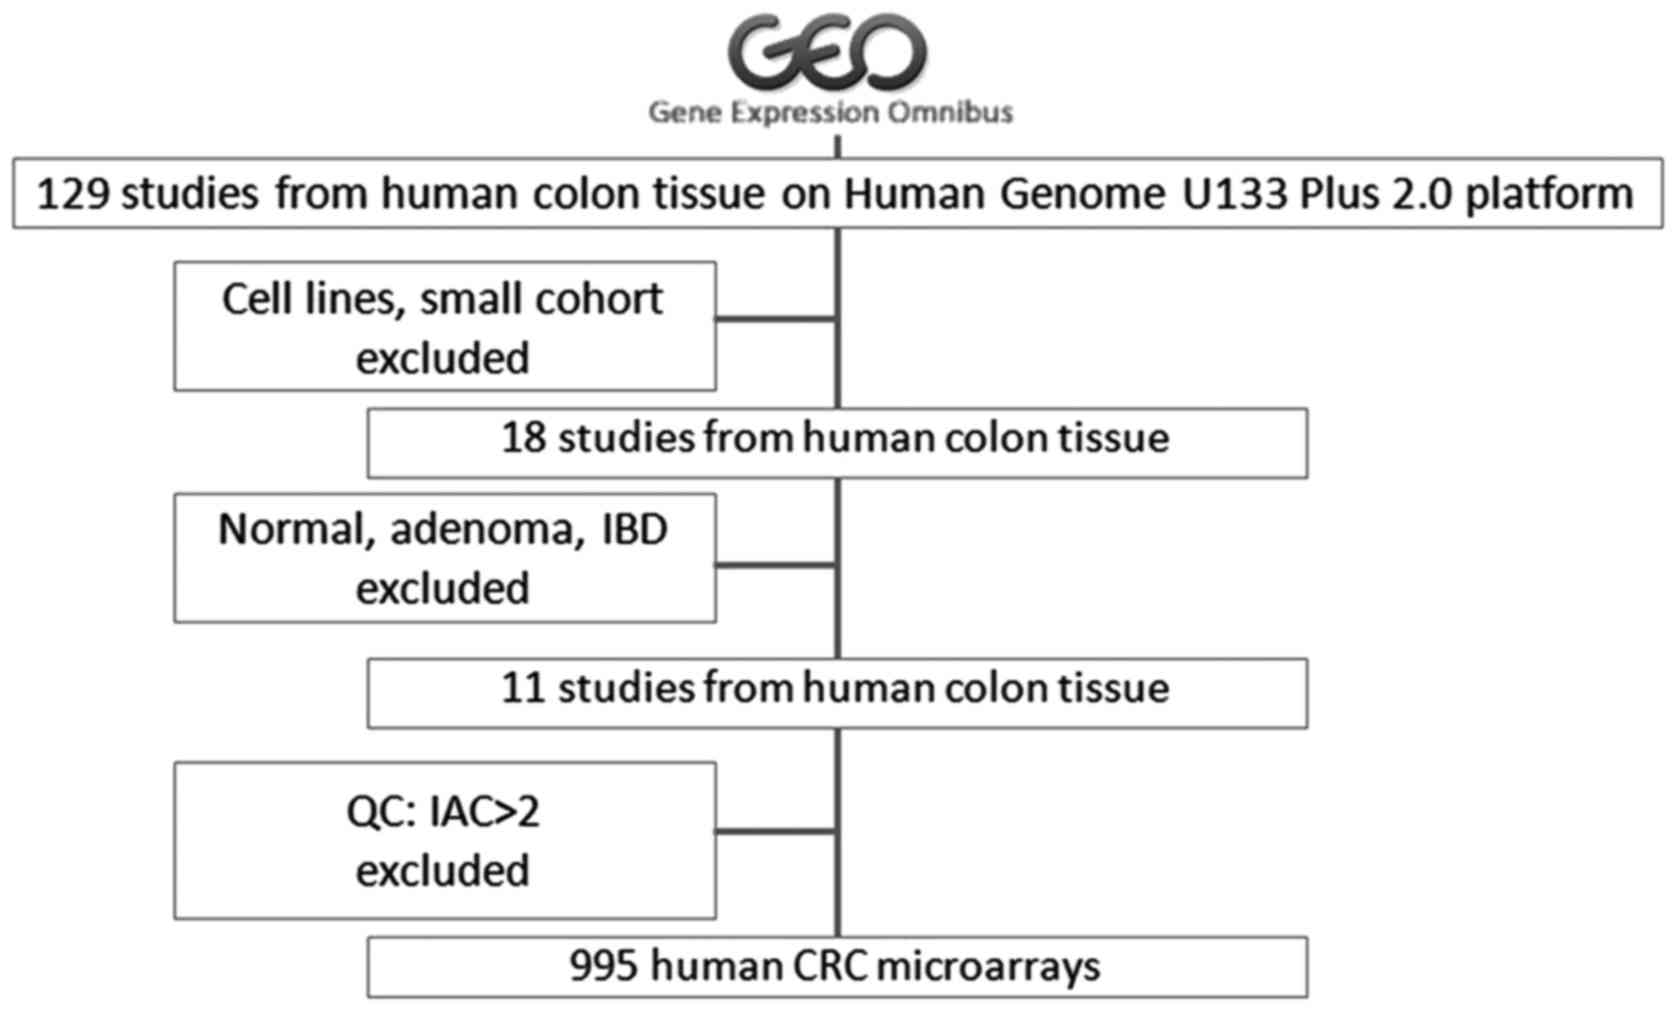
CRC transcriptome data were downloaded from the NCBI
GEO database (12) using the query
terms ‘(colon OR colorectal) AND GPL570’ to obtain all datasets
describing microarray experiments involving CRC using the
Affymetrix HG_U133_2 platform. After filtering the studies that
used cell lines or normal mucosa, or involved small patient
cohorts, a total of 1,045 chips from 11 studies were included for
analysis (Fig. 1). The raw data
were processed using the Affymetrix Expression Console software
(version 1.2; Affymetrix, Inc., Santa Clara, CA, USA) (www.thermofisher.com/cn/zh/home/global/forms/life-science/download-tac-software.html).
Gene expression values were generated using the MAS5 algorithm.
Gene co-expression analyses are particularly sensitive to the
presence of outlier samples and systematic biases in microarray
data. To make the analysis more meaningful, strict quality control
on chip data was performed prior to further analysis. A custom CDF
file (13) was used, and
non-specific and mis-targeted microarray probes were masked prior
to the generation of expression values. Unlike standard CDF files,
this custom file produces gene-level instead of probe set-level
expression values. Scaled expression values were imported into R
(version 2.13.0) for the detection and removal of outliers
(14). Inter-array correlations
(IACs) were averaged for each array and compared with the resulting
distribution of IACs for the dataset. In general, samples with a
mean IAC <2.0 standard deviations below the mean IAC for the
dataset were removed. Samples were also hierarchically clustered
using average linkage and 1-IAC as a distance metric to identify
outliers. This procedure was repeated until no outliers were
evident. This approach constitutes an unbiased method for the
identification and removal of samples with aberrant global gene
expression. Finally, 995 raw files were retained. Expression values
were further normalized using the quantile method. Genes that were
present in <30% of the samples were excluded from further
analysis. Batch effects were commonly observed across multiple
batches of microarray experiments or between different labs. To
eliminate batch effects, additional normalization was performed
using the R package ‘COMBAT’ (15).
Datasets GSE17536 and GSE41258 were used for survival and
metastasis analysis. GSE39397 was used for cell type specific
COL6A3 expression analysis.
WGCNA and module annotation
The networks were constructed from the weighted
correlation matrices following the WGCNA protocols (14,16,17).
Gene ontology enrichment and Kyoto Encyclopedia of Genes and
Genomes pathway analysis for network modules were performed using
the Database for Annotation, Visualization and Integrated Discovery
(DAVID) (18–20). Association of the modules with
genomic dysfunction was detected using DAVID on the basis of
overrepresentation of genes encoded at neighboring chromosomal
locations. In DAVID, an overrepresentation of a term was defined as
a modified Fisher's exact P-value with an adjustment for multiple
tests using the Benjamini method. For genes that were not
characterized by DAVID, a PubMed literature search was
performed.
Visualization
To visualize the pairwise associations between the
genes, Cytoscape was used (21). A
total of 150 pairs of genes with the highest intramodular
topological overlap matrix (TOM) value were depicted. The lines
link nodes that correspond to TOM values between the connected
nodes. Kaplan-Meier survival analyses for censored data were
plotted using SPSS (version 17.0; SPSS, Inc., Chicago, IL, USA) For
each analysis, survival curves were constructed, and the log-rank
test was used to assess the presence of significant differences
between the curves for any two groups being compared.
Generation of a clustered regularly
interspaced short palindromic repeats (CRISPR)/Cas9 COL6A3 knockout
cell line
The SW480 cell line was purchased from the American
Type Culture Collection (ATCC; Manassas, VA, USA) was used in the
present study. The cell line was cultured with Dulbecco's modified
Eagle's medium (DMEM; Gibco; Thermo Fisher Scientific, Inc.,
Waltham, MA, USA) that was supplemented with 10% fetal bovine serum
(FBS; Gibco; Thermo Fisher Scientific, Inc.), streptomycin (100
µg/ml) and penicillin (100 U/ml). CRISPR/Cas9 COL6A3 knockout (KO)
plasmids were constructed by Shanghai GenePharma Co., Ltd.
(Shanghai, China). Briefly, the target sequence of the COL6A3
active fragment, endotrophin (5′-CGAAAGACGAAGGAACTTGC-3′) was used
for the design of single guide RNA. The two sequences Y2854-S
(5′-caccgCGAAAGACGAAGGAACTTGC-3′) and Y2854-A
(5′-aaacGCAAGTTCCTTCGTCTTTCGc-3′) were synthesized and annealed.
The sequences were inserted into the pU6-gRNA-Cas9-EGFP vector
using T4 DNA ligase. Competent cells were prepared via
CaCl2 treatment and used for heat-shock transformation.
The sequencing of plasmids extracted by QIAGEN Plasmid Midi Kit
(Qiagen, Shanghai, China) from one positive clone confirmed the
target sequence. Positive colonies were then amplified to extract
plasmid DNA.
A total of two knockout cell lines, SW480-20 and
SW480-28, were generated by Shanghai GenePharma Co., Ltd. Briefly,
SW480 cells were transfected with 0.6 µg CRISPR/Cas9 COL6A3 KO
plasmids using Lipofectamine© 2000 (Invitrogen; Thermo
Fisher Scientific, Inc.) in 24-well plate. GFP-positive cells were
subsequently selected by fluorescence-activated cell sorting
analysis after 48 h. Single cell colonies were selected, and tested
by polymerase chain reaction and sequencing. PCR was performed in a
50 µl volume reaction mixture containing 25 µl of 2X Phanta buffer,
2 µl of each primer (20 µmol l−1), 3 µl cDNA and 2 µl
Phanta Max Super-Fidelity DNA polymerase (Vazyme Biotech Co., Ltd.,
Nanjing, China). The PCR profile employed for all primer sets
consisted of an initial denaturation at 95°C for 3 min followed by
42 cycles of 95°C for 15 sec, 60°C for 15 sec, 72°C for 20 sec, and
a final extension for 5 min at 72°C.
Cell proliferation, invasion and
migration analyses
For the proliferation assay, the cells (density,
3×10³) were seeded in a 96-well plate with five
replicates for every group. The cells were then incubated in 10%
Cell Counting Kit-8 (CCK-8; Dojindo Molecular Technologies, Inc.,
Kumamoto, Japan) at 37°C. After 0, 24, 48, 72 and 96 h,
proliferation rates were determined by detecting the absorbance at
450 nm.
For the invasion assay, Transwell Matrigel invasion
chambers in two 24-well plates (pore size, 8 µm; BD Biosciences,
San Jose, CA, USA) were used according to the manufacturer's
instructions. Briefly, the cells were serum-starved for 6 h in DMEM
containing 0.1% FBS. Serum-starved cells were trypsinized and
resuspended in DMEM containing 0.1% FBS, and 200 µl serum-free
medium containing 3×10⁵ cells from each subgroup were
added to the upper chamber of each well coated with 50 mg/l
Matrigel (BD Biosciences). A volume of 0.6 ml 15% FBS-containing
medium was then added to the lower chamber as a chemoattractant.
After 24 h at 37°C, the cells on the upper membrane surface were
removed with a cotton swab. The inserts were fixed by treatment
with 95% ethanol for 30 min and stained with 0.1% crystal violet
solution (Beyotime Institute of Biotechnology, Shanghai, China) at
37°C for 30 min. The cells on the bottom of the membrane were
counted from three different light microscopic fields, and the mean
number of cells was calculated.
For the scratch wound-healing assay,
3×10⁵ cells were seeded into a 6-well tissue culture
plate, and after 48 h the cell monolayer reached 80% confluence.
Then, the monolayer was gently scratched with a 20-µl pipette tip,
where a straight line was scratched in one direction. The well was
gently washed twice with PBS to remove the detached cells. Then,
the medium in the wells was replaced with fresh medium. The cells
were grown for additional 24 and 48 h at 37°C. Images of the
monolayer were captured using a light microscope. The same
microscope configuration was set for capturing images at three
different fields. The blank area was quantitatively evaluated using
ImageJ (National Institutes of Health, Bethesda, Maryland,
USA).
Flow cytometric analysis
For cell cycle analysis, the cells were harvested by
trypsinization, fixed with 70% ethanol at −20°C and stored at 4°C
overnight. The cells were subjected to propidium iodide (PI;
Sigma-Aldrich; Merck KGaA, Darmstadt, Germany) staining and flow
cytometric analysis. For apoptosis analysis, the Annexin V/PI assay
was performed according to the manufacturer's instructions (M3031;
MB-CHEM Corporation, Maharashtra 400009, India). Briefly, the cells
were washed and resuspended in 400 µl binding buffer (M3036;
MB-CHEM Corporation, Maharashtra 400009, India) and 5 µl Annexin
V-fluorescein isothiocyanate, followed by incubation for 5 min at
4°C in the dark.
Statistical analysis
Differences between two groups were assessed using
unpaired two-tailed t-tests. For association analysis between gene
expression and patient survival, the univariate Cox model was used.
When clinical parameters were also considered, the multivariate Cox
model was used. Analysis of variance (ANOVA) was used to compare
differences in COL6A3 expression between different types of CRC
cells. The survival time statistics were calculated by log-rank and
visualized in Kaplan-Meier survival curves. P<0.05 was
considered to indicate a statistically significant difference.
Stromal and immune scores were calculated by the ESTIMATE package
(bioinformatics.mdanderson.org/estimate/rpackage.html)
in R (version 2.15.3).
Results
Successful construction of a gene
co-expression network for CRC
The term ‘(colon OR colorectal) AND GPL570’ was used
to search the NCBI GEO database to retrieve CRC transcriptome
datasets. Data from cell lines or studies with a small sample size,
normal tissues, adenoma tissues or inflammatory bowel disease were
excluded. Consequently, 11 GSE datasets were retained. The
Affymetrix Expression Console software was used, and low-quality
probe sets were filtered prior to gene expression calling. Gene
co-expression network analysis is sensitive to abnormal samples. To
further eliminate these outliers, the samples were evaluated by
inter-array correlation analysis. As a result, data from 995 CRC
samples were obtained for downstream gene network construction
(Fig. 1).
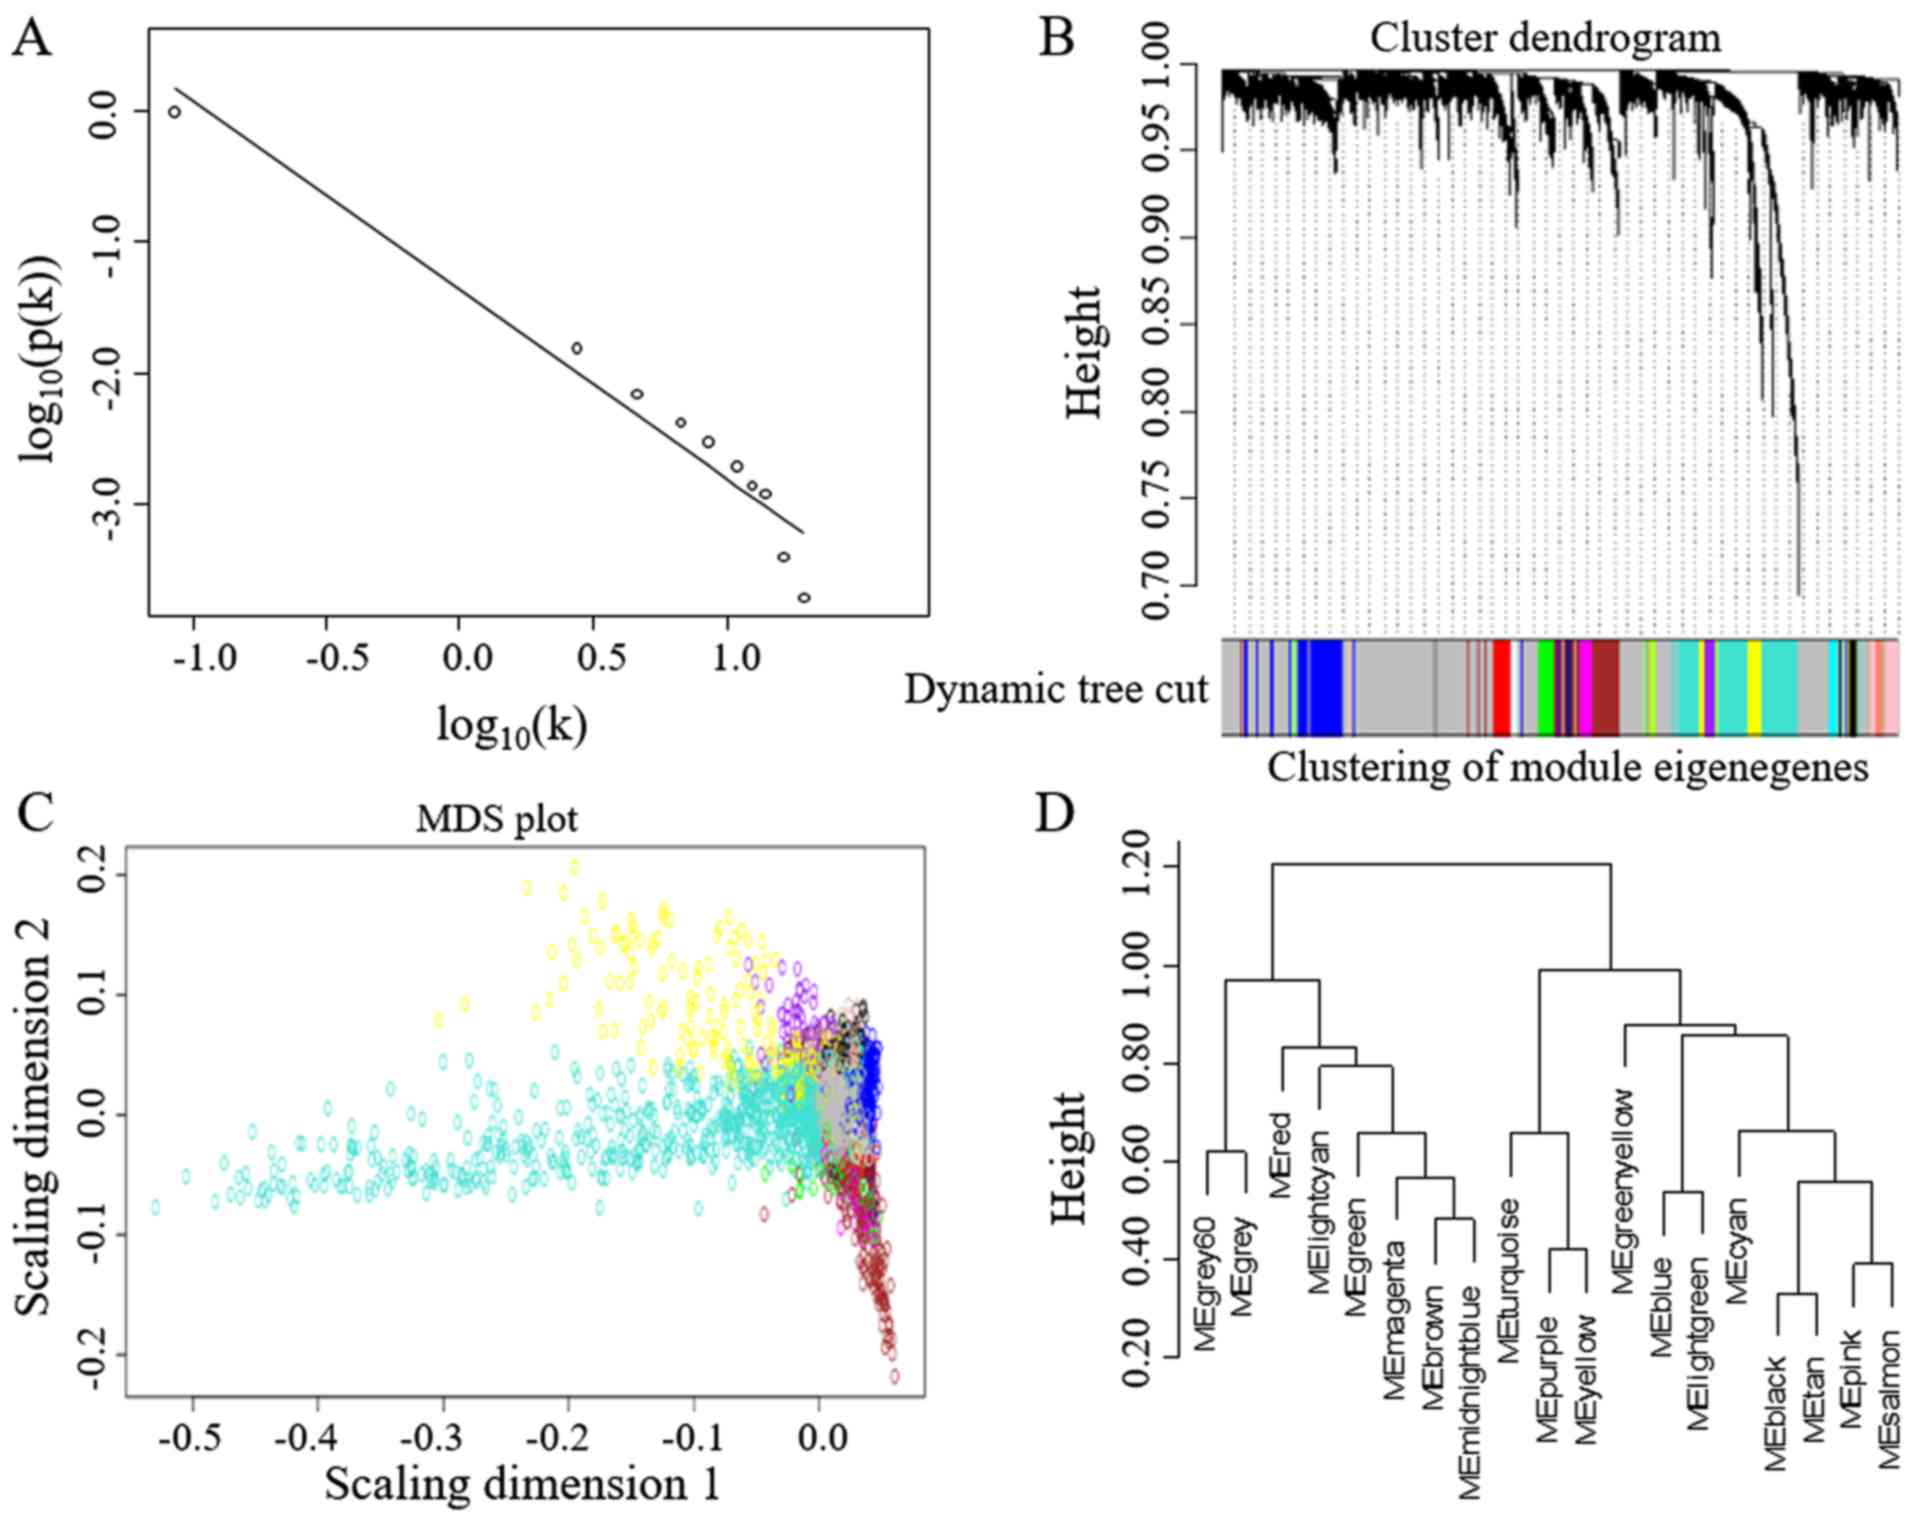
The robustness of the WGCNA method has been well
established given its high citation rate in the literature
(17). WGCNA could effectively
identify gene modules with similar expression patterns and hub
genes with high connectivity. The most variable 5,000 genes by
standard deviation/average were used for gene co-expression network
construction. Network statistics such as power, cluster dendrogram
and module eigengenes are shown in Fig.
2. A total of 18 modules of co-expressed genes were identified
(Table I). These modules could be
classified into two main categories. One class of modules was
enriched with chromosomal gene expression, including chromosomes 7,
8, 13, 20 and X. The other class of modules was associated with
various biological processes, including mitochondrion function,
extracellular matrix (ECM) function, immune responses, carbohydrate
metabolism, protein localization and the cell cycle (Table I).
 | Table I.Functional annotation of CRC
modules. |
Table I.
Functional annotation of CRC
modules.
| Modulea |
Annotationb | KEGG
pathwaysb | Hub genes |
|---|
| Midnight blue
(56) | Mitochondrial part
(4.9E-3) 7 (3.2E-71) |
| C7ORF30, EIF3B,
MRPS24 |
| Tan (74) |
|
| CD55, DUSP4,
LOC100507649 |
| Black (110) | Generation of
precursor metabolites and energy (2.5E-3) |
| HSPA4L,
LOC100507455, C1QBP |
|
| Mitochondrion
(7.7E-10)18 (2.0E-23) |
|
|
| Green (125) | X (6.2E-175)Xq28
(3.8E-17) |
| UBE2A, PHF16,
NKRF |
| Pink (99) |
| O-Glycan
biosynthesis (2.7E-2) | ST6GALNAC1, SPINK4,
REG4 |
| Brown (370) | 20
(9.8E-57)20q13.13 (8.3E-5) |
| STAU1, DYNLRB1,
DDX27 |
| Light green
(42) | 15 (5.0E-61)15q14
(2.0E-5) |
| COPS2, RSL24D1,
MFAP1 |
| Cyan (65) | 14 (7.7E-97)14q11.2
(5.6E-6) |
| C14ORF166, TMX1,
TMED10 |
| Turquoise
(723) | Cell motion
(4.0E-9) | Focal adhesion
(1.8E-11) | SPARC, COL5A2,
TIMP2 |
|
| Extracellular
matrix (5.0E-23) | ECM-receptor
interaction (2.8E-9) |
|
| Yellow (208) | Immune response
(6.3E-32) | Antigen processing
and presentation (3.4E-7) | CD53, LAPTM5,
FCER1G |
|
| MHC class II
protein complex (7.7E-9) | Intestinal immune
network for IgA production (1.1E-6) |
|
| Grey (42) | RNA splicing
(1.4E-7) | Spliceosome
(4.0E-3) | NCRNA00201, NKTR,
PNISR |
|
| Nuclear speck
(4.8E-6) |
|
|
| Salmon (73) | Carbonate
dehydratase (6.5E-3) |
| ZG16, CA1, CA4 |
| Green yellow
(77) | Regulation of
protein localization (4.6E-2) | Pathways in cancer
(2.5E-3) | DDX3X, PTPN11,
G3BP2 |
|
| Membrane fraction
(2.9E-2) |
|
|
| Light cyan
(49) | 20 (4.5E-73)20q13
(8.9E-21) |
| PSMF1, MKKS,
SNRPB |
| Magenta (97) | Nucleoplasm
(3.8E-3) 13 (1.8E-153)13q34 (5.8E-17) |
| CUL4A, IPO5,
UCHL3 |
| Red (120) | 8 (7.8E-165)8q24.3
(4.1E-18) |
| DCAF13, SLC25A32,
ARMC1 |
| Blue (455) | Mitotic cell cycle
(5.5E-34) | Proteasome
(7.8E-10) | BUB1B, OIP5,
PRC1 |
|
| Nuclear lumen
(1.9E-23) | Spliceosome
(1.4E-8) |
|
|
| DNA replication
(6.5E-8) |
|
| Purple (78) | Immune response
(1.2E-17) | Antigen processing
and presentation (3.9E-4) | IFIT3, CMPK2,
IFIT1 |
|
| MHC class I protein
complex (9.5E-5) |
|
|
The hub genes may be important for the survival of
patients with CRC (22). WGCNA
results also provide the connectivity of each gene within a module.
A number of these hub genes have roles in cancer development. For
example, in the cell cycle module, the roles of Opa interacting
protein 5, protein regulator of cytokinesis 1 and BUB1 mitotic
checkpoint serine/threonine kinase B in cancer have been previously
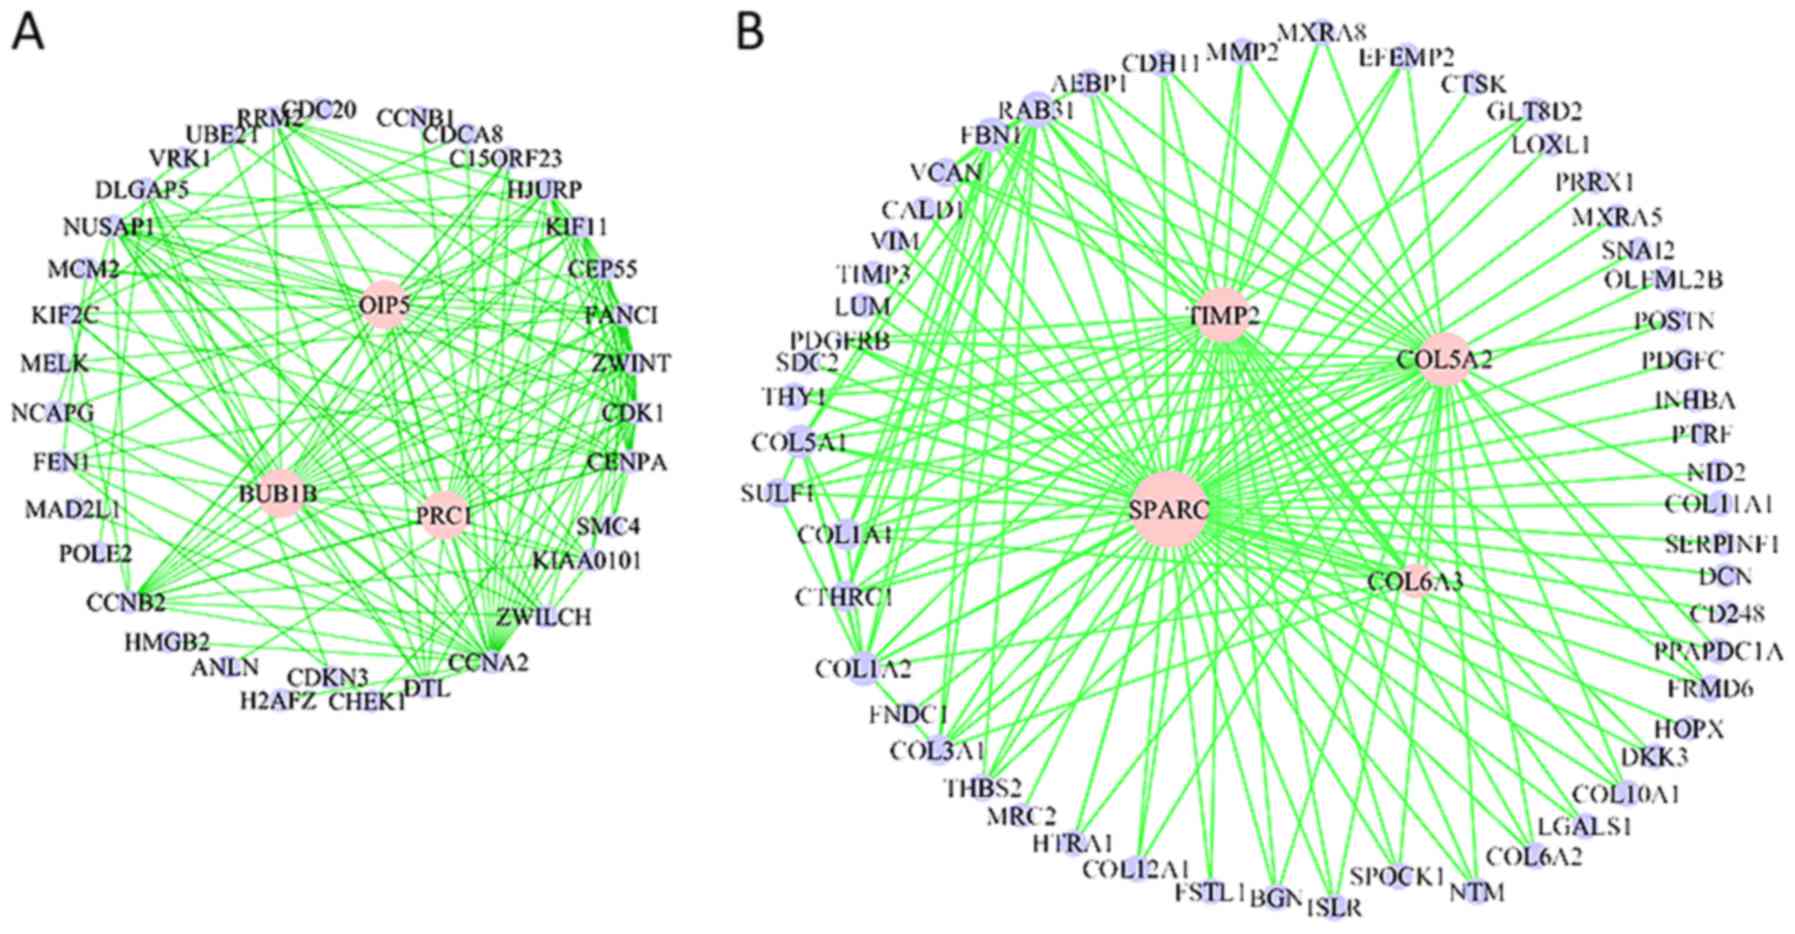
demonstrated (23). A number of the
hub genes have well-known functions in regulating the DNA damage
checkpoint, genome stability and cell cycle arrest, including
checkpoint kinase 1, cyclin B2, cyclin A2 and nucleolar and
spindle-associated protein 1 (24).
In the cell migration/ECM module, there are many collagen encoding
genes, including collagen type V α2 chain (COL5A2), collagen type
VI α2 chain, COL6A3, TIMP metallopeptidase inhibitor 2 (TIMP2) and
collagen type X α1 chain (Fig. 3A and
B).
Clinical implications of the hub genes
in the ECM module
ECM contributes to tumor invasion and metastasis,
which is a vital factor underlying patient mortality (25). ECM can act as a scaffold for cell
migration, a reservoir for cytokines and growth factors, and it can
transmit signals by binding with receptors (26). In the present study, the top 150
connections from the ECM module were extracted, and a co-expression
network was visualized (Fig. 3B).
Many of these genes have been previously implicated in cancer. For
example, the frequency of the TIMP-2 rs81799090 genotype G/G was
higher in patients with metastasis compared with those without
metastasis (27). Cysteine-rich
protein is predominantly expressed by stromal cells in CRC and is
able to inhibit invasion and metastasis (28).
The ECM module is enriched with genes that are
associated with cell migration, which is an important factor in
metastasis. The top 15 genes with high connectivity were analyzed
using the univariate Cox model, and eight of these genes were
associated with overall survival, including collagen type I α1
chain (P=0.017), collagen type III α1 chain (P=0.011), sulfatase 1
(P=0.011), collagen triple helix repeat containing 1 (P=0.016),
collagen type V α1 chain (P=0.029), COL6A3 (P=0.007), TIMP2
(P=0.029) and COL5A2 (P=0.014). Among these eight genes, COL6A3 was
the most significant signature. After taking sex, age and American
Joint Committee on Cancer (AJCC) stage (29) into consideration, COL6A3 remained
associated with prognosis (multivariate Cox model; P=0.004). These
results revealed that COL6A3 is an independent prognosis factor for
the survival of patients with CRC.
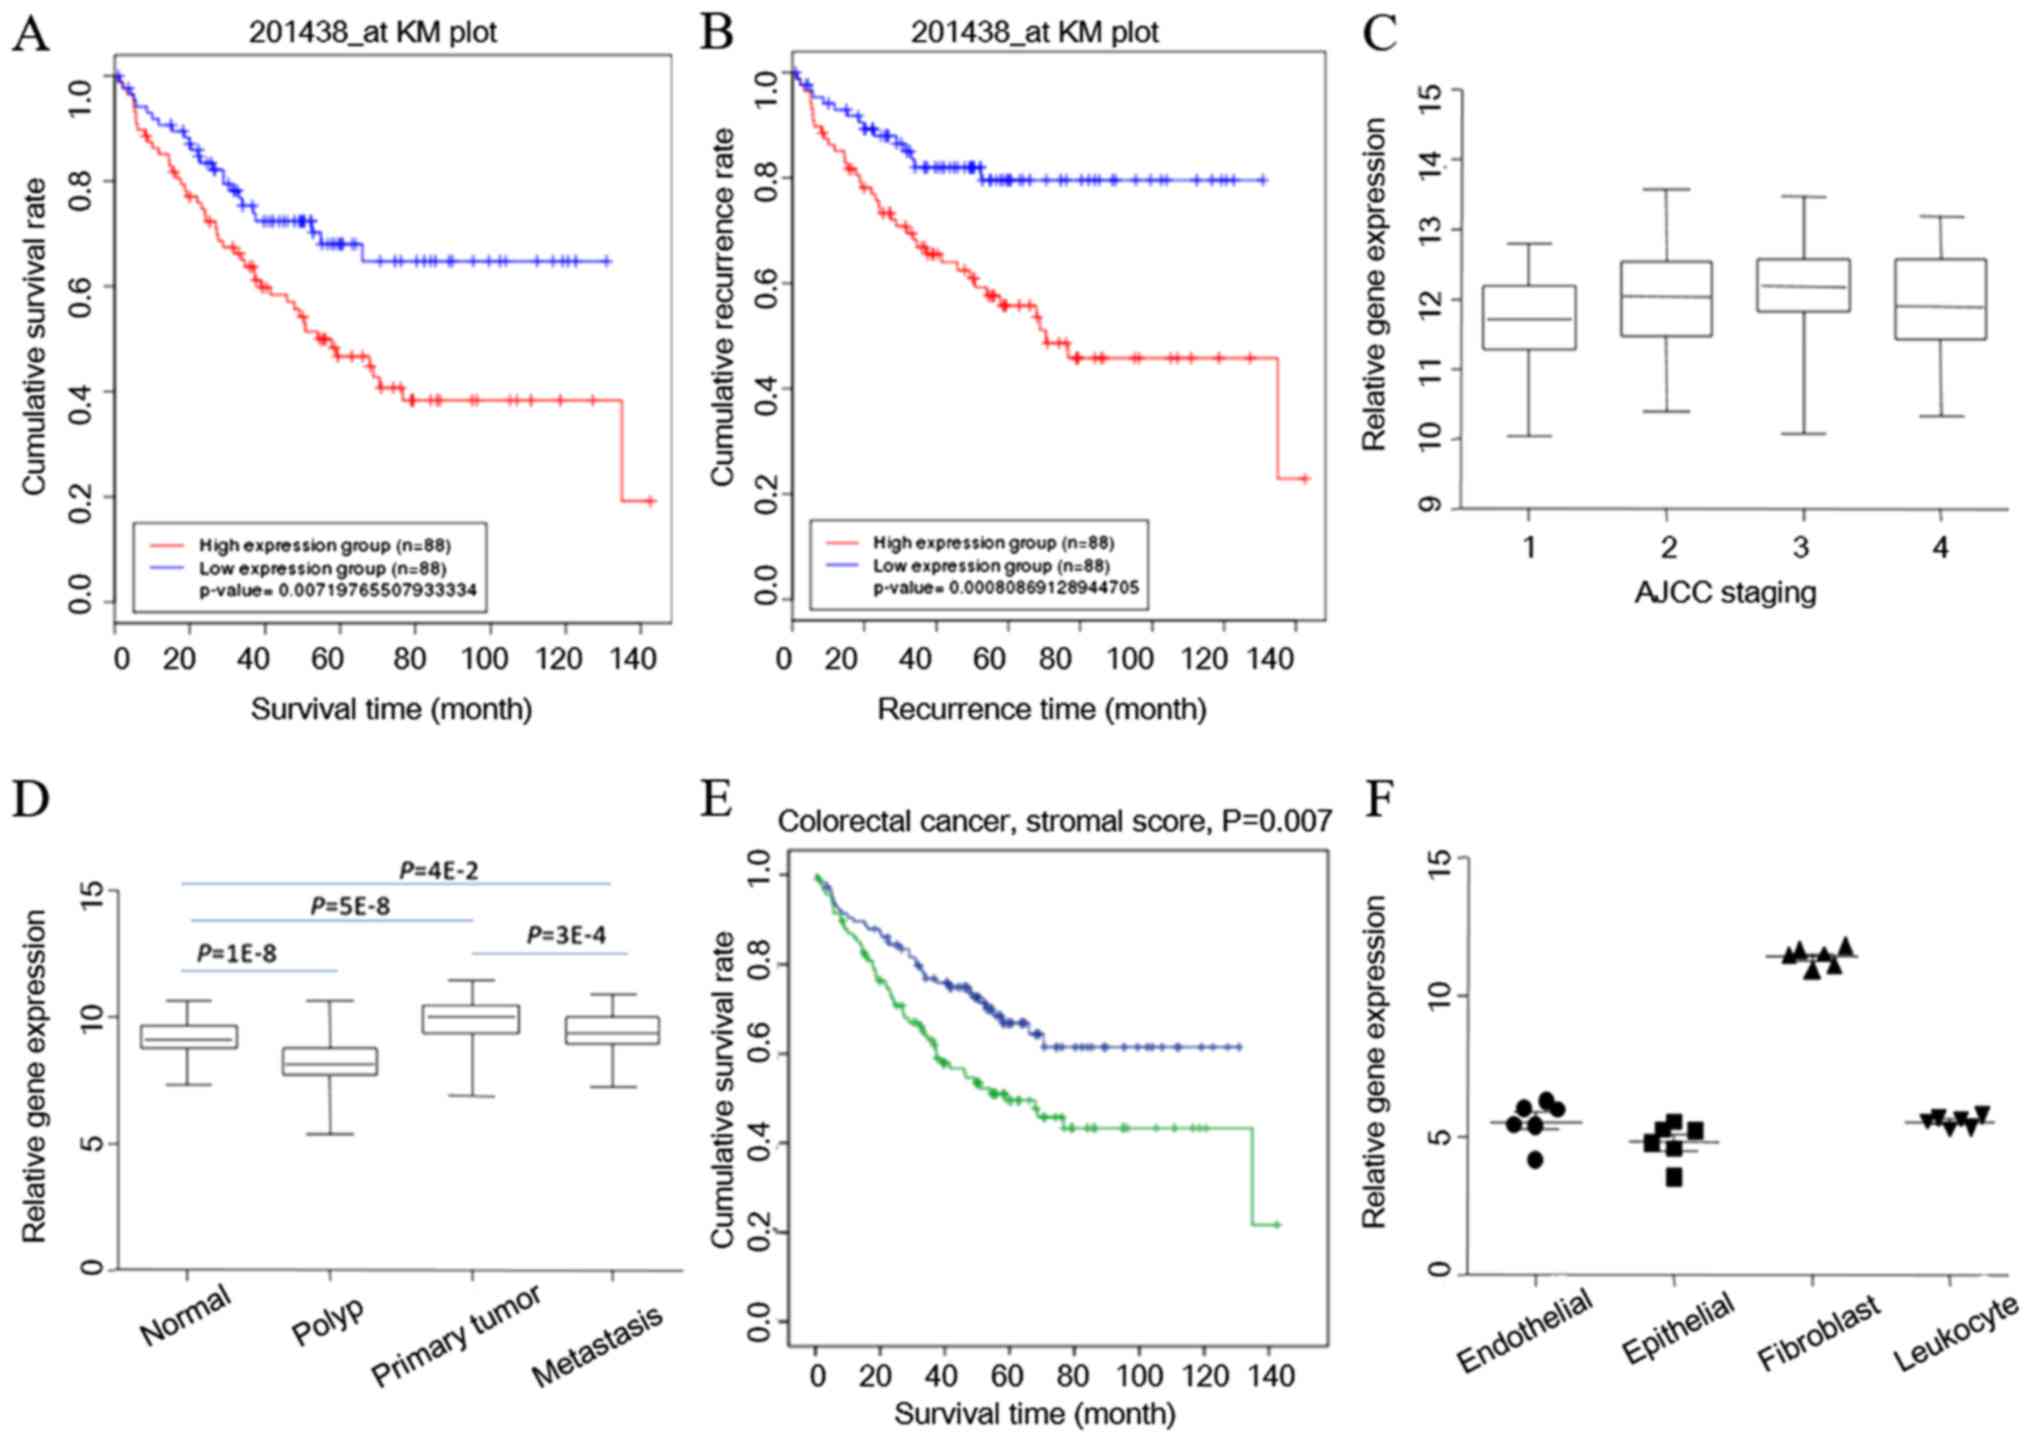
Furthermore, a Kaplan-Meier survival curve was
plotted according to the survival and recurrence information in the
GSE17536 dataset. COL6A3 was able to separate the patients into two
groups, and was associated with survival (Fig. 4A) and recurrence (Fig. 4B). COL6A3 expression was
significantly higher in patients with AJCC stage III compared with
those with AJCC stage I. COL6A3 expression was also higher in
patients of AJCC stage II compared with AJCC stage I patients
(Fig. 4C). These findings were
replicated in an additional dataset (GSE41258), which contains data
on the entire disease progression spectrum. Using the GSE41258
dataset, COL6A3 expression in normal mucosa, and patients with
adenoma, primary colon adenocarcinoma and metastatic CRC was
compared. COL6A3 expression was significantly different in mucosa
compared with cancer tissues, with the highest expression in
primary CRC and the lowest expression in adenoma (P<0.05)
(Fig. 4D). COL6A3 expression also
increased as the stage of cancer increased.
Cancer-associated fibroblasts are a key determinant
in the malignant progression of cancer, as demonstrated by a
previous study (30). Besides tumor
cells, malignant solid tumor tissues consist of tumor-associated
stromal cells, immune cells and vascular cells (31). The transcriptome data were analyzed
using the ESTIMATE bioinformatics tool (31), and it was indicated that the stroma
contributes to the survival of patients with CRC (Fig. 4E) (accepted but unpublished). To
further determine COL6A3 gene expression status in cells that are
present in the cancer microenvironment, the GSE39397 dataset was
reanalyzed. The GSE39397 dataset contains transcriptomes of
purified human CRC epithelial tumor cells, leukocytes, endothelial
cells and fibroblasts (10). The
results of the present study indicated that stromal
cancer-associated fibroblasts are the main contributor for COL6A3
expression in CRC tissues (P=1×10⁻¹⁴; one-way ANOVA)
(Fig. 4F).
COL6A3 knockout decreases
proliferation and invasion, and increases apoptosis in vitro
Since COL6A3 is significantly upregulated in CRC,
COL6A3 was knocked out in the present study to determine whether it
has any roles in the SW480 cell line, which is derived from a
patient with Dukes' type B colorectal adenocarcinoma (32). The C5 terminal of COL6A3 is the
active fragment (33). The
fragment-encoding gene was mutated using the CRISPR-Cas9 system
(GenePharma Inc.). A total of 2 COL6A3-knockout cell lines were
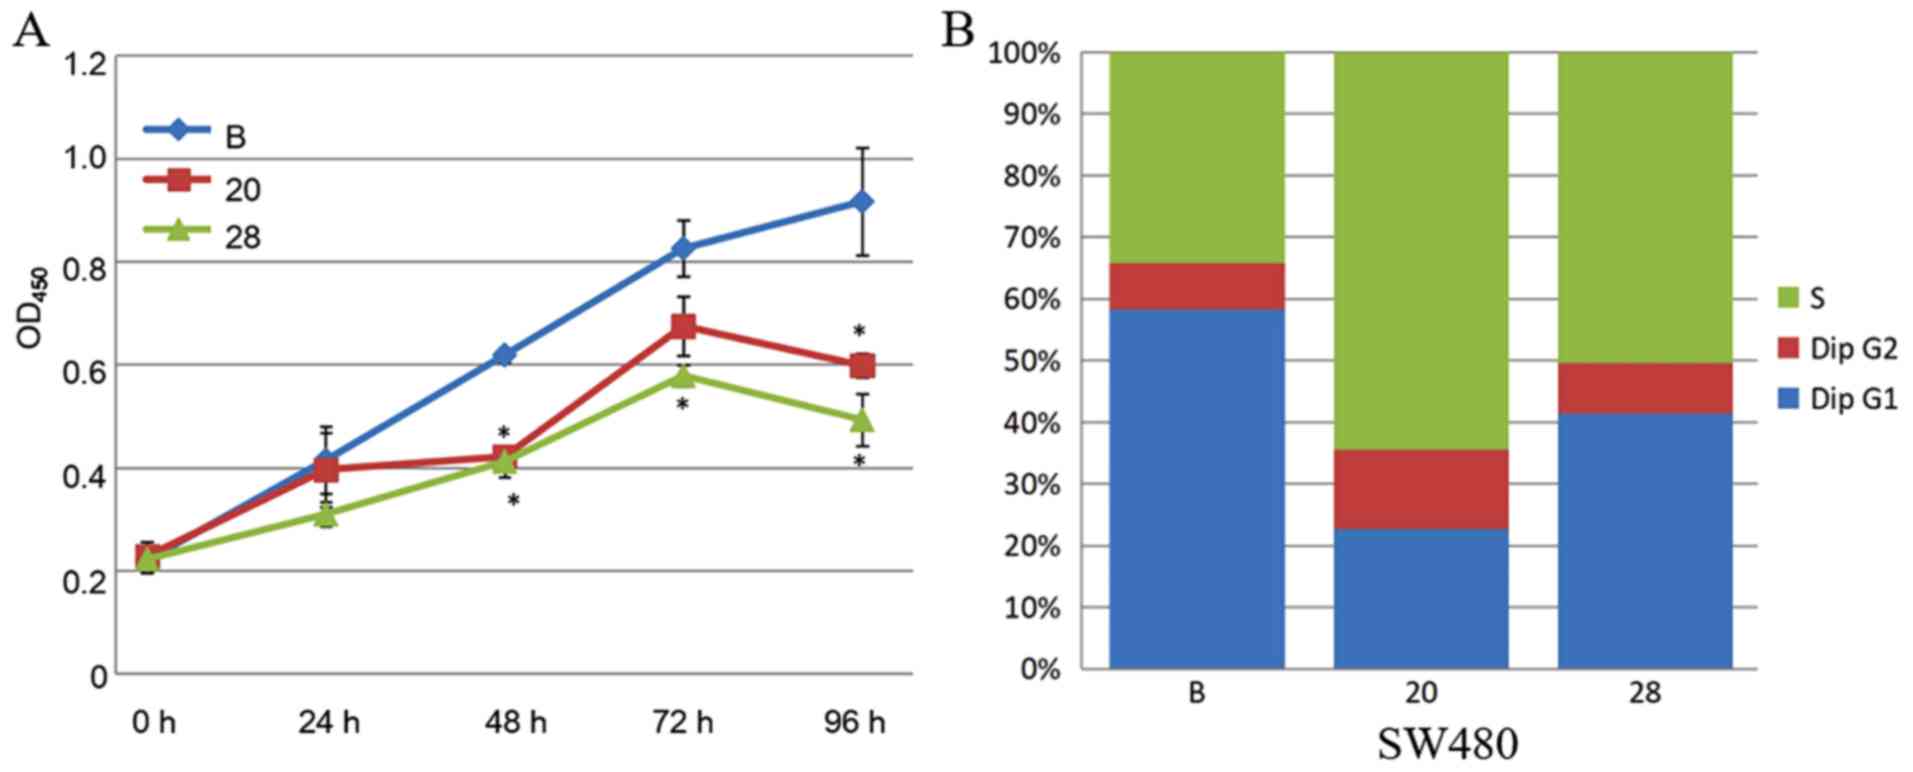
constructed (SW480-20 and SW480-28). The CCK8 assay indicated that
the proliferation rate was significantly decreased in COL6A3
knockout-cell lines (SW480-20 and SW480-28) compared to the
wild-type cell line (P<0.05) (Fig.
5A).
The proportion of cells in the S phase significantly
increased from 34.2 to 64.5% (SW480-20, P=1.3×10⁻⁶) and
to 50.5% (SW480-28, P=7.5×10⁻⁵), following COL6A3
knockout. The proportion of cells in the G1 phase decreased from
58.3 to 22.7% (SW480-20, P=4.0×10⁻⁹) and to 41.5%
(SW480-28, P=6.6×10⁻⁷) following COL6A3 knockout. The
proportion of cells in the G2-M phase slightly increased from 7.5
to 12.8% (SW480-20, P=0.0006) and to 8.0% (SW480-28, P>0.05)
following COL6A3 knockout. Therefore, COL6A3 knockdown in SW480
cells led to cell cycle arrest in the S phase (Fig. 5B). Transwell invasion assay
indicated that the COL6A3 knockout cell lines have a significantly
reduced invasive capacity than the wild-type cell line (P<0.05)
(Fig. 5C). Scratch wound-healing
assay also indicated reduced migratory capability (Fig. 5D).
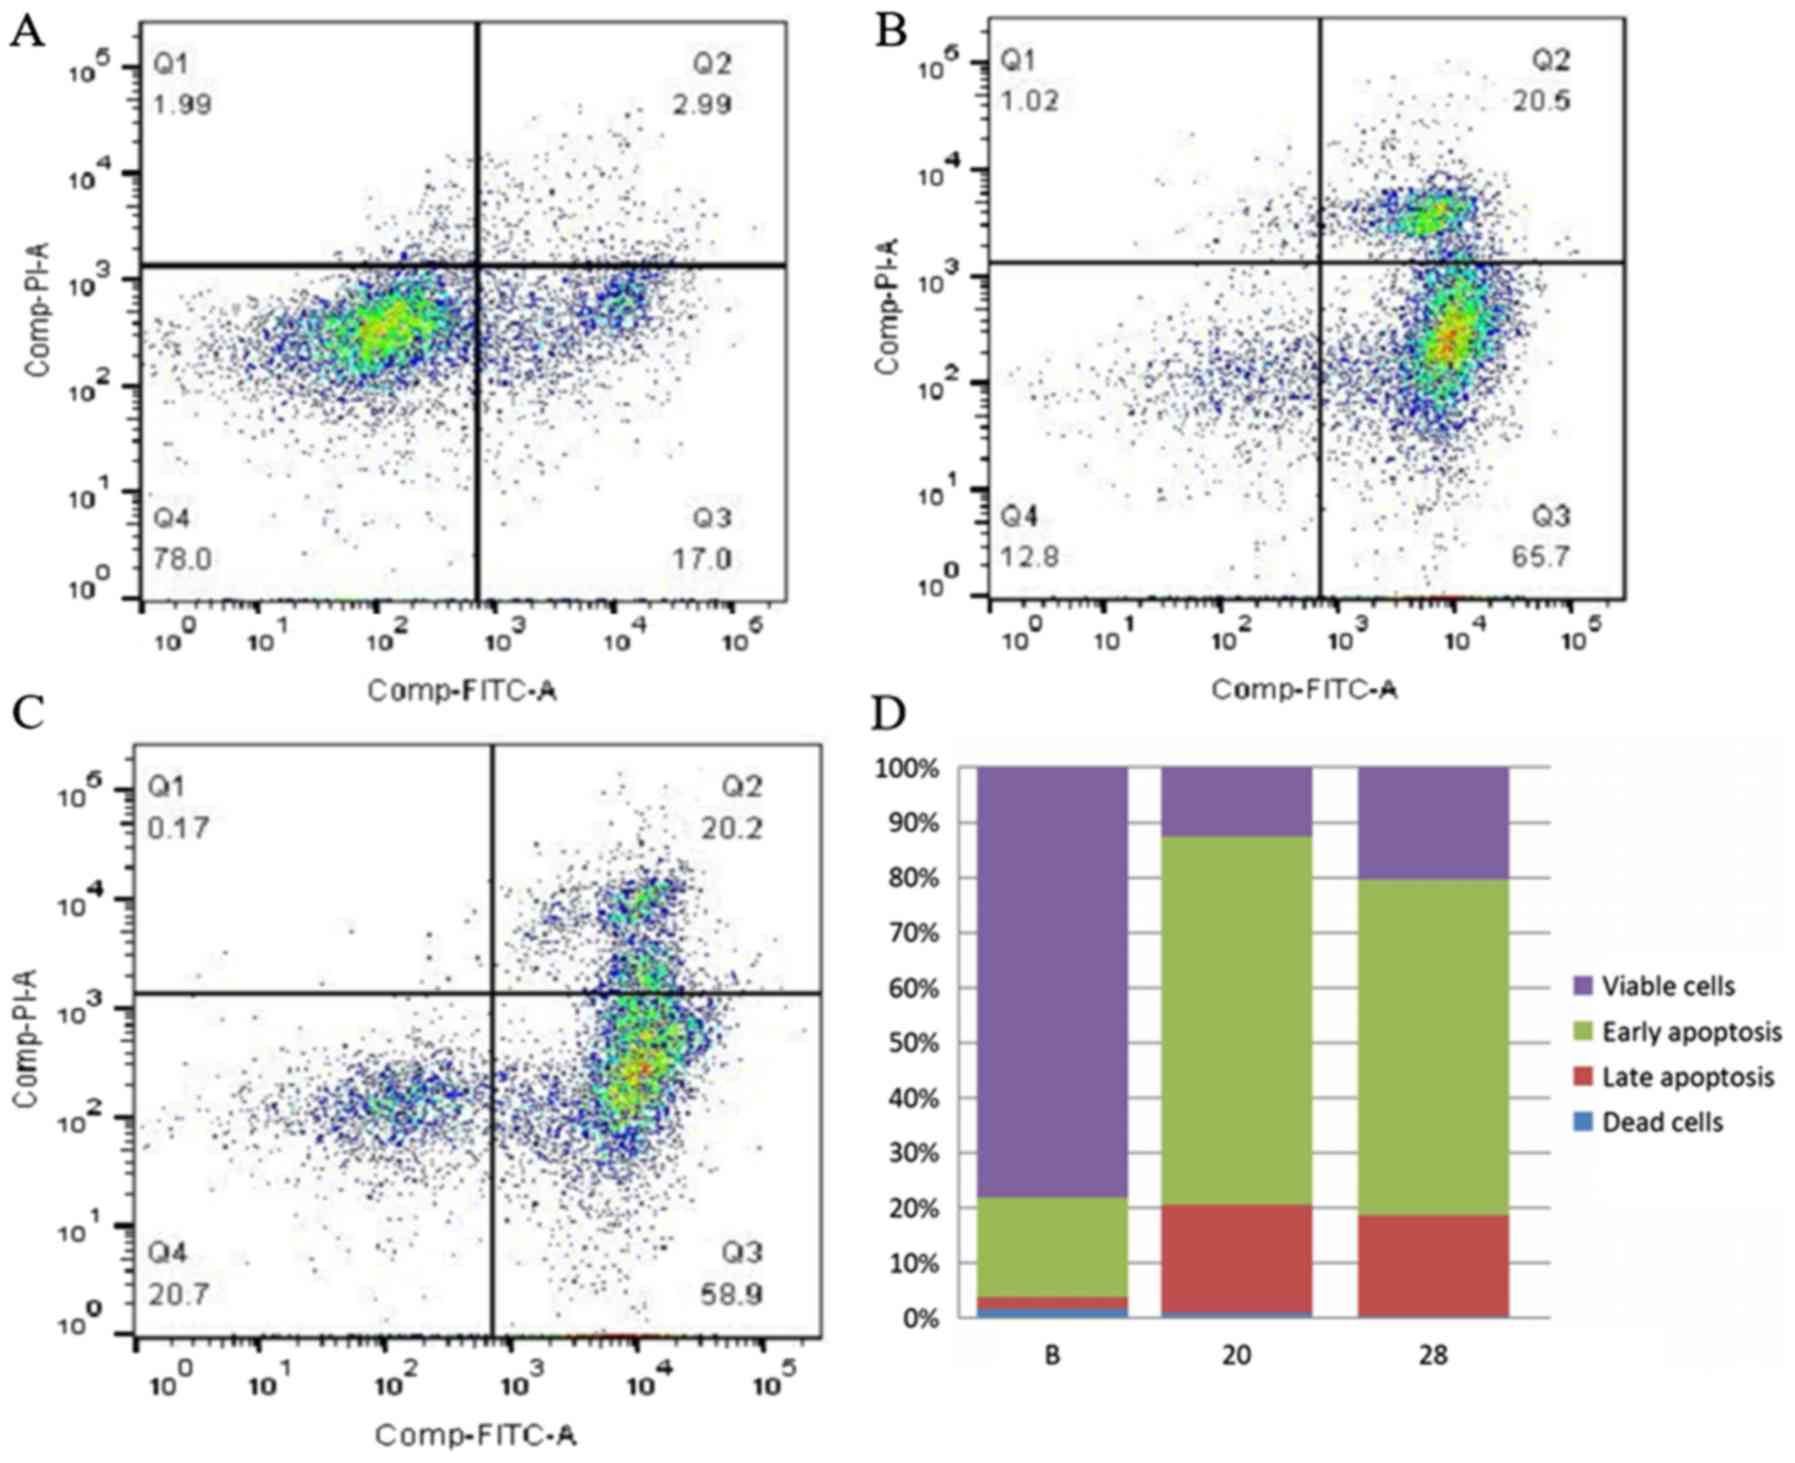
The apoptosis assay indicated that the early
apoptosis rate of SW480 cells increased from 18.2 to 67.0%
(SW480-20, P=2.5×10⁻⁵) and from 18.2 to 61.0% (SW480-28,
P=4.2×10⁻⁵) following COL6A3 knockout. The late
apoptosis rates of COL6A3 knockout cell lines (SW480-20 and
SW480-28) were significantly upregulated than the wild-type cell
line (P<0.01). The rate of dead cells displayed no significant
difference compared to the wild-type cell line. These data
indicated that the knockout of COL6A3 caused early apoptosis
instead of necrosis in SW480 cells (Fig. 6A-D).
Discussion
The present study used WGCNA to construct a CRC gene
co-expression network. To the best our knowledge, the present study
used the largest sample size to date. The 18 identified modules
were annotated, which covers many aspects of CRC, including
chromosome, metabolism, cell cycle and immune response to ECM.
These modules may have important roles in CRC. Considering the role
of the cancer microenvironment in tumor malignancy, hub genes in
the cell migration/ECM module were further analyzed for their
association with patient prognosis. COL6A3, a hub gene in the cell
migration/ECM module, was selected for downstream analysis. COL6A3,
a factor that is predominantly expressed in stromal
cancer-associated fibroblasts, was identified as an independent
prognostic factor. The important role of COL6A3 in CRC malignancy
was verified using an in vitro gene knockout cell
experiment.
WGCNA, which was utilized in the present study, has
been widely employed in the literature (14,16,17). A
recent publication also applied in silico WGCNA to colon
transcriptomes and indicated that a transcriptional module enriched
in cell cycle processes was correlated with recurrence-free
survival (22). The present authors
have previously demonstrated the importance of module-based
analysis in cancer transcriptome analysis (34). Compared with the study by Liu et
al (22), the present study
used a more stringent criterion to select datasets and included
only high-quality data for final analysis. The sample size in the
present study is twice the size compared with the study by Liu
et al (22), which improves
the robustness and confidence of the present analysis.
The emerging importance of the cancer
microenvironment in cancer has been well established (25). Therefore, the present analysis
focused on the ECM module and its hub genes. One of the hub genes,
COL6A3, was selected for its low P-value in survival analysis. The
spatial expression of COL6A3 was further analyzed, which was
identified as an independent prognostic factor. We found that
COL6A3 is mainly expressed in CRC-associated fibroblasts. To the
best our knowledge, the clinical relevance of circulating plasma
COL6A3 in CRC has only been reported by one study (35). The application of NGS has led to the
identification of several mutated genes in CRC that predict
survival outcomes (2,27). The COL6A3 mutation was significantly
associated with improved overall survival independent of
tumor-node-metastasis staging (36). These results demonstrated the
validity of the present analysis.
However, there is currently no commercial human
CRC-associated fibroblast cell line available. Therefore, the SW480
CRC adenocarcinoma cell line was used for the functional study of
COL6A3. COL6A3 gene expression and its potential role in
epithelial-mesenchymal transition in the Caco-2 human colon cancer
cell line had been reported (37).
Therefore, it was reasonable to examine the role of COL6A3 in the
CRC cancer cell line, SW480.
In summary, the present analysis demonstrated that
bioinformatics analysis is useful for identifying important
candidate genes for experimental verification. The ECM module
contains several hub genes that are associated with prognosis.
COL6A3 is an independent prognosis factor in CRC, which is
predominantly expressed in cancer-associated fibroblasts. The
knockout experiments validated the role of COL6A3 in the
proliferation and invasion of CRC cells. However, more insightful
molecular mechanisms may be obtained in future studies. Our
research may provide a framework for in-depth analysis of public
transcriptome data and prioritization of candidate genes for
further investigation.
Acknowledgements
Not applicable.
Funding
The present study was supported partly by the
National Natural Science Foundation of China (grant nos. 31270454,
81400617 and 81502091).
Availability of data and materials
The datasets used and/or analyzed during the current
study are available from the corresponding author on reasonable
request.
Authors' contributions
WL contributed to the design of the study, the
analysis and interpretation of data, and the drafting of the
manuscript. LL contributed to the acquisition of the data and
analysis. HY contributed the design of the study and manuscript
revising. HT collected the data and HH contributed the conception
and design of the study.
Ethics approval and consent to
participate
Not applicable.
Consent for publication
Not applicable.
Competing interests
The authors declare that they have no competing
interests.
References
|
1
|
Roseweir AK, McMillan DC, Horgan PG and
Edwards J: Colorectal cancer subtypes: Translation to routine
clinical pathology. Cancer Treat Rev. 57:1–7. 2017. View Article : Google Scholar : PubMed/NCBI
|
|
2
|
Punt CJ, Koopman M and Vermeulen L: From
tumour heterogeneity to advances in precision treatment of
colorectal cancer. Nat Rev Clin Oncol. 14:235–246. 2017. View Article : Google Scholar : PubMed/NCBI
|
|
3
|
Roychowdhury S and Chinnaiyan AM:
Translating cancer genomes and transcriptomes for precision
oncology. CA Cancer J Clin. 66:75–88. 2016. View Article : Google Scholar : PubMed/NCBI
|
|
4
|
Agesen TH, Sveen A, Merok MA, Lind GE,
Nesbakken A, Skotheim RI and Lothe RA: ColoGuideEx: A robust gene
classifier specific for stage II colorectal cancer prognosis. Gut.
61:1560–1567. 2012. View Article : Google Scholar : PubMed/NCBI
|
|
5
|
Hong Y, Downey T, Eu KW, Koh PK and Cheah
PY: A ‘metastasis-prone’ signature for early-stage mismatch-repair
proficient sporadic colorectal cancer patients and its implications
for possible therapeutics. Clin Exp Metastasis. 27:83–90. 2010.
View Article : Google Scholar : PubMed/NCBI
|
|
6
|
Heijink DM, Fehrmann RS, de Vries EG,
Koornstra JJ, Oosterhuis D, van der Zee AG, Kleibeuker JH and de
Jong S: A bioinformatical and functional approach to identify novel
strategies for chemoprevention of colorectal cancer. Oncogene.
30:2026–2036. 2011. View Article : Google Scholar : PubMed/NCBI
|
|
7
|
Quan B, Qi X, Yu Z, Jiang Y, Liao M, Wang
G, Feng R, Zhang L, Chen Z, Jiang Q and Liu G: Pathway analysis of
genome-wide association study and transcriptome data highlights new
biological pathways in colorectal cancer. Mol Genet Genomics.
290:603–610. 2015. View Article : Google Scholar : PubMed/NCBI
|
|
8
|
Wu Y, Wang X, Wu F, Huang R, Xue F, Liang
G, Tao M, Cai P and Huang Y: Transcriptome profiling of the cancer,
adjacent non-tumor and distant normal tissues from a colorectal
cancer patient by deep sequencing. PLoS One. 7:e410012012.
View Article : Google Scholar : PubMed/NCBI
|
|
9
|
Kim ST, Sohn I, DO IG, Jang J, Kim SH,
Jung IH, Park JO, Park YS, Talasaz A, Lee J and Kim HC:
Transcriptome analysis of CD133-positive stem cells and prognostic
value of survivin in colorectal cancer. Cancer Genomics Proteomics.
11:259–266. 2014.PubMed/NCBI
|
|
10
|
Calon A, Espinet E, Palomo-Ponce S,
Tauriello DV, Iglesias M, Céspedes MV, Sevillano M, Nadal C, Jung
P, Zhang XH, et al: Dependency of colorectal cancer on a
TGF-beta-driven program in stromal cells for metastasis initiation.
Cancer Cell. 22:571–584. 2012. View Article : Google Scholar : PubMed/NCBI
|
|
11
|
Isella C, Terrasi A, Bellomo SE, Petti C,
Galatola G, Muratore A, Mellano A, Senetta R, Cassenti A, Sonetto
C, et al: Stromal contribution to the colorectal cancer
transcriptome. Nat Genet. 47:312–319. 2015. View Article : Google Scholar : PubMed/NCBI
|
|
12
|
Barrett T, Troup DB, Wilhite SE, Ledoux P,
Evangelista C, Kim IF, Tomashevsky M, Marshall KA, Phillippy KH,
Sherman PM, et al: NCBI GEO: Archive for functional genomics data
sets-10 years on. Nucleic Acids Res. 39:D1005–1010. 2011.
View Article : Google Scholar : PubMed/NCBI
|
|
13
|
Dai M, Wang P, Boyd AD, Kostov G, Athey B,
Jones EG, Bunney WE, Myers RM, Speed TP, Akil H, et al: Evolving
gene/transcript definitions significantly alter the interpretation
of GeneChip data. Nucleic Acids Res. 33:e1752005. View Article : Google Scholar : PubMed/NCBI
|
|
14
|
Oldham MC, Konopka G, Iwamoto K,
Langfelder P, Kato T, Horvath S and Geschwind DH: Functional
organization of the transcriptome in human brain. Nat Neurosci.
11:1271–1282. 2008. View
Article : Google Scholar : PubMed/NCBI
|
|
15
|
Johnson WE, Li C and Rabinovic A:
Adjusting batch effects in microarray expression data using
empirical Bayes methods. Biostatistics. 8:118–127. 2007. View Article : Google Scholar : PubMed/NCBI
|
|
16
|
Miller JA, Horvath S and Geschwind DH:
Divergence of human and mouse brain transcriptome highlights
Alzheimer disease pathways. Proc Natl Acad Sci USA.
107:12698–12703. 2010. View Article : Google Scholar : PubMed/NCBI
|
|
17
|
Langfelder P and Horvath S: WGCNA: An R
package for weighted correlation network analysis. BMC
Bioinformatics. 9:5592008. View Article : Google Scholar : PubMed/NCBI
|
|
18
|
da Huang W, Sherman BT and Lempicki RA:
Systematic and integrative analysis of large gene lists using DAVID
bioinformatics resources. Nat Protoc. 4:44–57. 2009. View Article : Google Scholar : PubMed/NCBI
|
|
19
|
da Huang W, Sherman BT and Lempicki RA:
Bioinformatics enrichment tools: Paths toward the comprehensive
functional analysis of large gene lists. Nucleic Acids Res.
37:1–13. 2009. View Article : Google Scholar : PubMed/NCBI
|
|
20
|
Ashburner M, Ball CA, Blake JA, Botstein
D, Butler H, Cherry JM, Davis AP, Dolinski K, Dwight SS, Eppig JT,
et al: Gene ontology: Tool for the unification of biology. The Gene
Ontology Consortium. Nat Genet. 25:25–29. 2000. View Article : Google Scholar : PubMed/NCBI
|
|
21
|
Smoot ME, Ono K, Ruscheinski J, Wang PL
and Ideker T: Cytoscape 2.8: New features for data integration and
network visualization. Bioinformatics. 27:431–432. 2011. View Article : Google Scholar : PubMed/NCBI
|
|
22
|
Liu R, Zhang W, Liu ZQ and Zhou HH:
Associating transcriptional modules with colon cancer survival
through weighted gene co-expression network analysis. BMC Genomics.
18:3612017. View Article : Google Scholar : PubMed/NCBI
|
|
23
|
Lanchbury J, Gutin A and Flake D: Cancer
prognosis signatures. Google Patents. 2016.
|
|
24
|
Scott RE, Ghule PN, Stein JL and Stein GS:
Cell cycle gene expression networks discovered using systems
biology: Significance in carcinogenesis. J Cell Physiol.
230:2533–2542. 2015. View Article : Google Scholar : PubMed/NCBI
|
|
25
|
Friedl P and Alexander S: Cancer invasion
and the microenvironment: Plasticity and reciprocity. Cell.
147:992–1009. 2011. View Article : Google Scholar : PubMed/NCBI
|
|
26
|
Iijima J, Konno K and Itano N:
Inflammatory alterations of the extracellular matrix in the tumor
microenvironment. Cancers (Basel). 3:3189–3205. 2011. View Article : Google Scholar : PubMed/NCBI
|
|
27
|
Horvat M, Potocnik U, Repnik K, Kavalar R
and Stabuc B: Single nucleotide polymorphisms as prognostic and
predictive factors of adjuvant chemotherapy in colorectal cancer of
stages I and II. Gastroenterol Res Pract. 2016:21394892016.
View Article : Google Scholar : PubMed/NCBI
|
|
28
|
Conti J and Thomas G: The role of tumour
stroma in colorectal cancer invasion and metastasis. Cancers
(Basel). 3:2160–2168. 2011. View Article : Google Scholar : PubMed/NCBI
|
|
29
|
Edge SB and Compton CC: The American Joint
Committee on Cancer: The 7th edition of the AJCC cancer staging
manual and the future of TNM. Ann Surg Oncol. 17:1471–1474. 2010.
View Article : Google Scholar : PubMed/NCBI
|
|
30
|
Ostman A and Augsten M: Cancer-associated
fibroblasts and tumor growth-bystanders turning into key players.
Curr Opin Genet Dev. 19:67–73. 2009. View Article : Google Scholar : PubMed/NCBI
|
|
31
|
Yoshihara K, Shahmoradgoli M, Martínez E,
Vegesna R, Kim H, Torres-Garcia W, Treviño V, Shen H, Laird PW,
Levine DA, et al: Inferring tumour purity and stromal and immune
cell admixture from expression data. Nat Commun. 4:26122013.
View Article : Google Scholar : PubMed/NCBI
|
|
32
|
Tomita N, Jiang W, Hibshoosh H, Warburton
D, Kahn SM and Weinstein IB: Isolation and characterization of a
highly malignant variant of the SW480 human colon cancer cell line.
Cancer Res. 52:6840–6847. 1992.PubMed/NCBI
|
|
33
|
Park J and Scherer PE: Adipocyte-derived
endotrophin promotes malignant tumor progression. J Clin Invest.
122:4243–4256. 2012. View
Article : Google Scholar : PubMed/NCBI
|
|
34
|
Liu W, Li L and Li W: Gene co-expression
analysis identifies common modules related to prognosis and drug
resistance in cancer cell lines. Int J Cancer. 135:2795–2803. 2014.
View Article : Google Scholar : PubMed/NCBI
|
|
35
|
Qiao J, Fang CY, Chen SX, Wang XQ, Cui SJ,
Liu XH, Jiang YH, Wang J, Zhang Y, Yang PY and Liu F: Stroma
derived COL6A3 is a potential prognosis marker of colorectal
carcinoma revealed by quantitative proteomics. Oncotarget.
6:29929–29946. 2015. View Article : Google Scholar : PubMed/NCBI
|
|
36
|
Yu J, Wu WK, Li X, He J, Li XX, Ng SS, Yu
C, Gao Z, Yang J, Li M, et al: Novel recurrently mutated genes and
a prognostic mutation signature in colorectal cancer. Gut.
64:636–645. 2015. View Article : Google Scholar : PubMed/NCBI
|
|
37
|
Joyce T, Cantarella D, Isella C, Medico E
and Pintzas A: A molecular signature for Epithelial to Mesenchymal
transition in a human colon cancer cell system is revealed by
large-scale microarray analysis. Clin Exp Metastasis. 26:569–587.
2009. View Article : Google Scholar : PubMed/NCBI
|