Introduction
Thyroid cancer is the most common endocrine
malignancy worldwide, with the most rapidly increasing incidence
(>5% per year) (1). It is the
fifth most common type of cancer in women in the United States,
with ~56,870 cases being newly diagnosed in 2017 and ~2,010
mortalities resulting from thyroid cancer (2). Papillary thyroid cancer (PTC) accounts
for ~80% of all thyroid cancer cases (3). The majority of patients with this
indolent tumor have an excellent prognosis, however >25% of
patients experience disease recurrence during long-term follow-up
(4). Therefore, it is important to
identify the biomarkers associated with the progression and
prognosis of PTC.
BRAF and RAS mutations and fusions
involving the RET and NTRK1 tyrosine kinases
accelerate PTC tumorigenesis and progression by aberrantly
activating the mitogen-activated protein kinase (MAPK) signaling
pathway (5–8). Mutations in members of the
phosphoinositide 3-kinase (PI3K) pathway, including PTEN,
PIK3CA and AKT1, play a fundamental role in thyroid
tumorigenesis (9,10), and the NF-κB pathway controls
proliferative and anti-apoptotic signaling pathways in thyroid
cancer cells (11,12). Furthermore, the WNT-β-catenin
pathway may play a particularly important role in the
aggressiveness of thyroid cancer (10,13).
In addition, the overexpression of microRNA-21 is associated with
aggressive tall-cell histology and may play a crucial role in the
pathogenesis of PTC. In addition, TERT promoter mutations
identify a subset of aggressive and poorly differentiated PTCs
(14). Despite significant research
progress, the mechanisms underlying PTC tumorigenesis remain
elusive. Therefore, a systemic approach is required to identify
predictive biomarkers for disease progression and prognosis.
In the present study, a comprehensive bioinformatics
analysis was used to identify key genes associated with PTC. A
comparison of the expression profiles of PTC and normal tissues
uncovered differentially expressed genes (DEGs). The key genes were
extracted using cytoHubba (15) and
their expression in PTC and normal tissues was compared using The
Cancer Genome Atlas (TCGA) database. To determine whether their
expression was correlated with a poor prognosis, a series of
survival analyses were conducted. The relationships between key
genes that were aberrantly expressed and clinicopathological
factors, as well as tumor progression in patients with PTC, were
also analyzed.
Materials and methods
Microarray data
Four gene expression profiles, GSE3467, GSE29265,
GSE33630 and GSE50901, were acquired from the National Center for
Biotechnology Information Gene Expression Omnibus (GEO) database
(http://www.ncbi.nlm.nih.gov/geo).
GSE3467 included 9 PTC tissue samples and 9 normal samples.
GSE29265 consisted of 20 PTC tissue samples and 20 normal samples.
GSE33630 comprised 49 PTC tissue samples and 45 normal samples.
GSE50901 included 61 PTC tissue samples and 4 normal samples.
Screening DEGs
GEO2R (http://www.ncbi.nlm.nih.gov/geo/geo2r/) is available
to analyze almost any GEO series between two sample groups under
the same experimental conditions (16). This tool uses established
Bioconductor R packages to analyze GEO data. In the present study,
GEO2R was applied to screen for DEGs between PTC and normal tissue
samples. An adjusted P-value (adj. P) <0.01 and |logFC| >1
were set as the cut-off criteria. Common DEGs from the four
datasets were selected for further analyses.
Identification of key genes and
predictions of function
Gene Ontology (GO) terms and Kyoto Encyclopedia of
Genes and Genomes (KEGG) pathway analyses were performed using the
Database for Annotation, Visualization and Integrated Discovery
(DAVID; http://david.abcc.ncifcrf.gov/) online tool, with an
enrichment threshold of P<0.05. GO analysis comprises biological
process (BP), cellular component (CC) and molecular function (MF)
terms. A DEG-associated protein-protein interaction (PPI) network
was constructed using the STRING database (https://string-db.org/) (17) and was subsequently visualized using
Cytoscape (18). Hub genes were
filtered from the intersection of the top 55 genes of 12
topological analysis methods using the Cytoscape plugin
cytoHubba.
Patients and clinicopathological
data
Normalized RNA sequencing data (Illumina HiSeq) and
the corresponding clinicopathological data for PTCs from the TCGA
dataset were downloaded from Firebrowse (http://firebrowse.org/) and cBioPortal for Cancer
Genomics (http://www.cbioportal.org/).
Normalized expression levels of mRNAs were log2-transformed and
used for further analyses. The expression of key genes was
validated using RNA sequencing data from 501 PTC and 59 normal
thyroid samples. The clinicopathological data included the
following variables: sex, age at diagnosis, maximum tumor size,
multifocality, extrathyroidal extension (ETE), histological
subtypes, lymph node metastasis (LNM), and tumor-node-metastasis
(TNM) stage.
Statistical analysis
All statistical analyses were performed using SPSS
23.0 (IBM Corp., Armonk, NY, USA) and GraphPad Prism 6.0 software
(GraphPad, Inc., San Diego, CA, USA). An independent-sample
Student's t-test was applied to compare the differential expression
of DEGs between two groups. Disease-free survival (DFS), which was
defined as the time from registration to detection of tumor
recurrence or progression or until the last follow-up date, was
calculated using Kaplan-Meier analysis followed by the log-rank
test. Non-parametric receiver operating characteristic (ROC)
analyses were performed to calculate the best cut-off value for hub
gene expression levels predictive of LNM and DFS. The multivariable
Cox proportional hazards regression model was used to determine
independent predictive factors for DFS. Initial candidate variables
with P<0.5 in the univariate analyses were included in further
multiple logistic regression. To analyze the association between
key genes and clinicopathological parameters, patients were divided
into low-expression and high-expression groups according to the
median expression levels of the key genes. The associations between
the expression of key genes and clinicopathological characteristics
were evaluated using the χ2 test. Multivariable logistic
regression was performed to identify independent predictors of LNM.
Multivariate survival analysis was performed on all parameters that
were revealed to be significant on univariate analysis. P<0.05
was considered to indicate a statistically significant
difference.
Results
Identification of DEGs
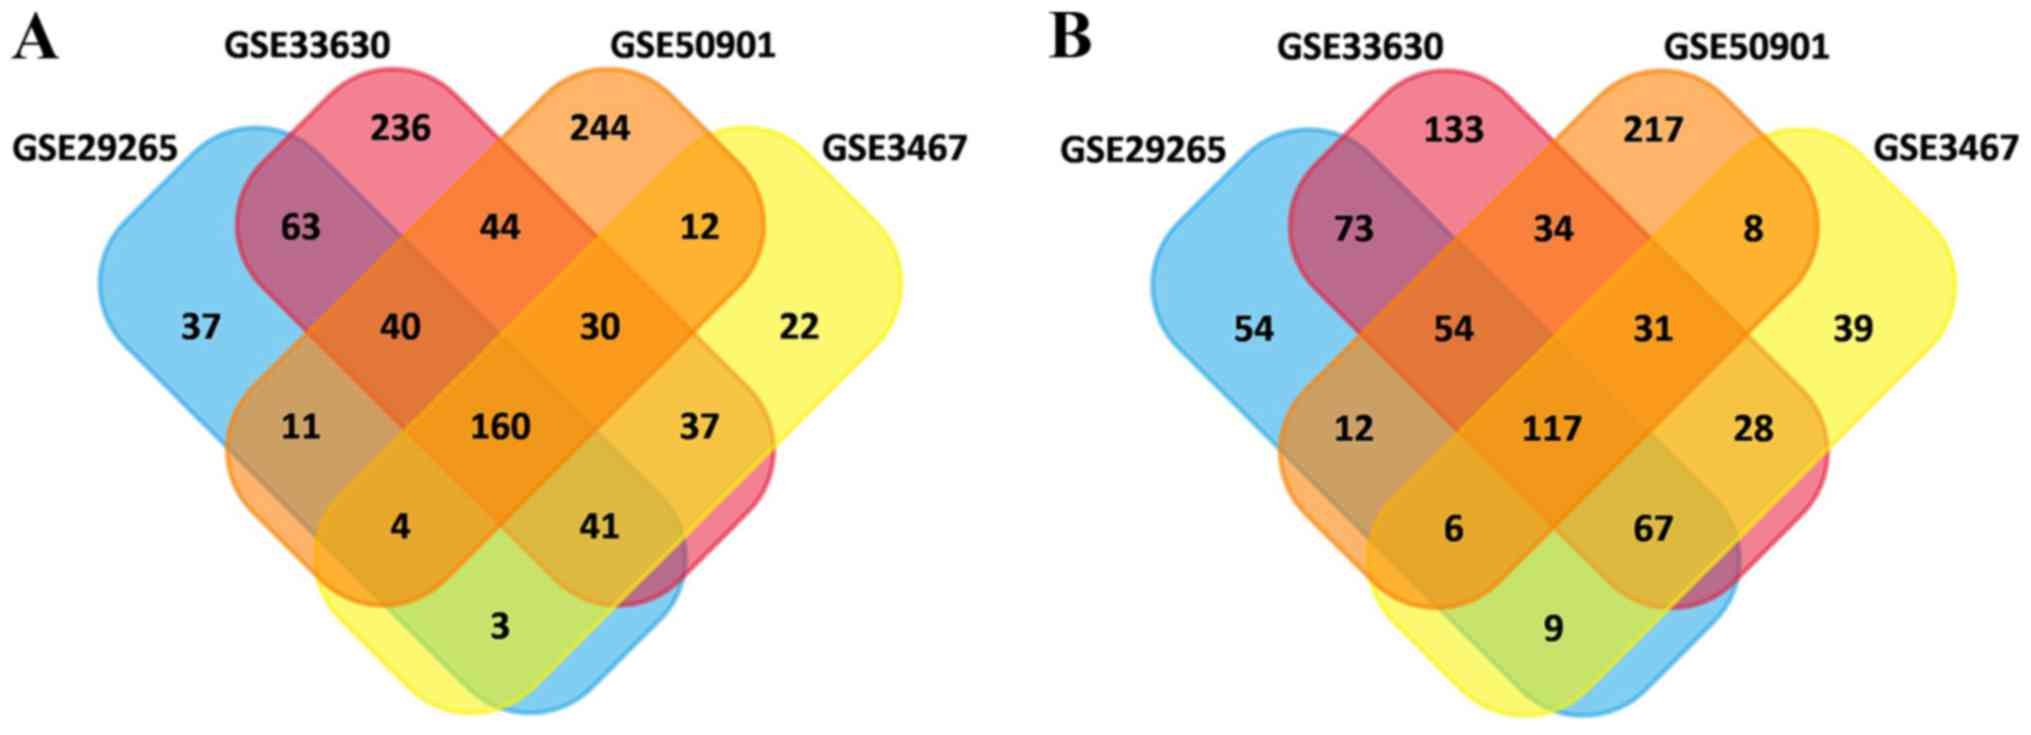
In total, 615, 752, 1,189 and 1,025 DEGs were
identified in the GSE3467, GSE29265, GSE33630 and GSE50901 gene
expression profile datasets, respectively. Among them, 277 genes
showed identical expression trends in the four datasets, including
160 upregulated genes (Fig. 1A) and
117 downregulated genes (Fig. 1B)
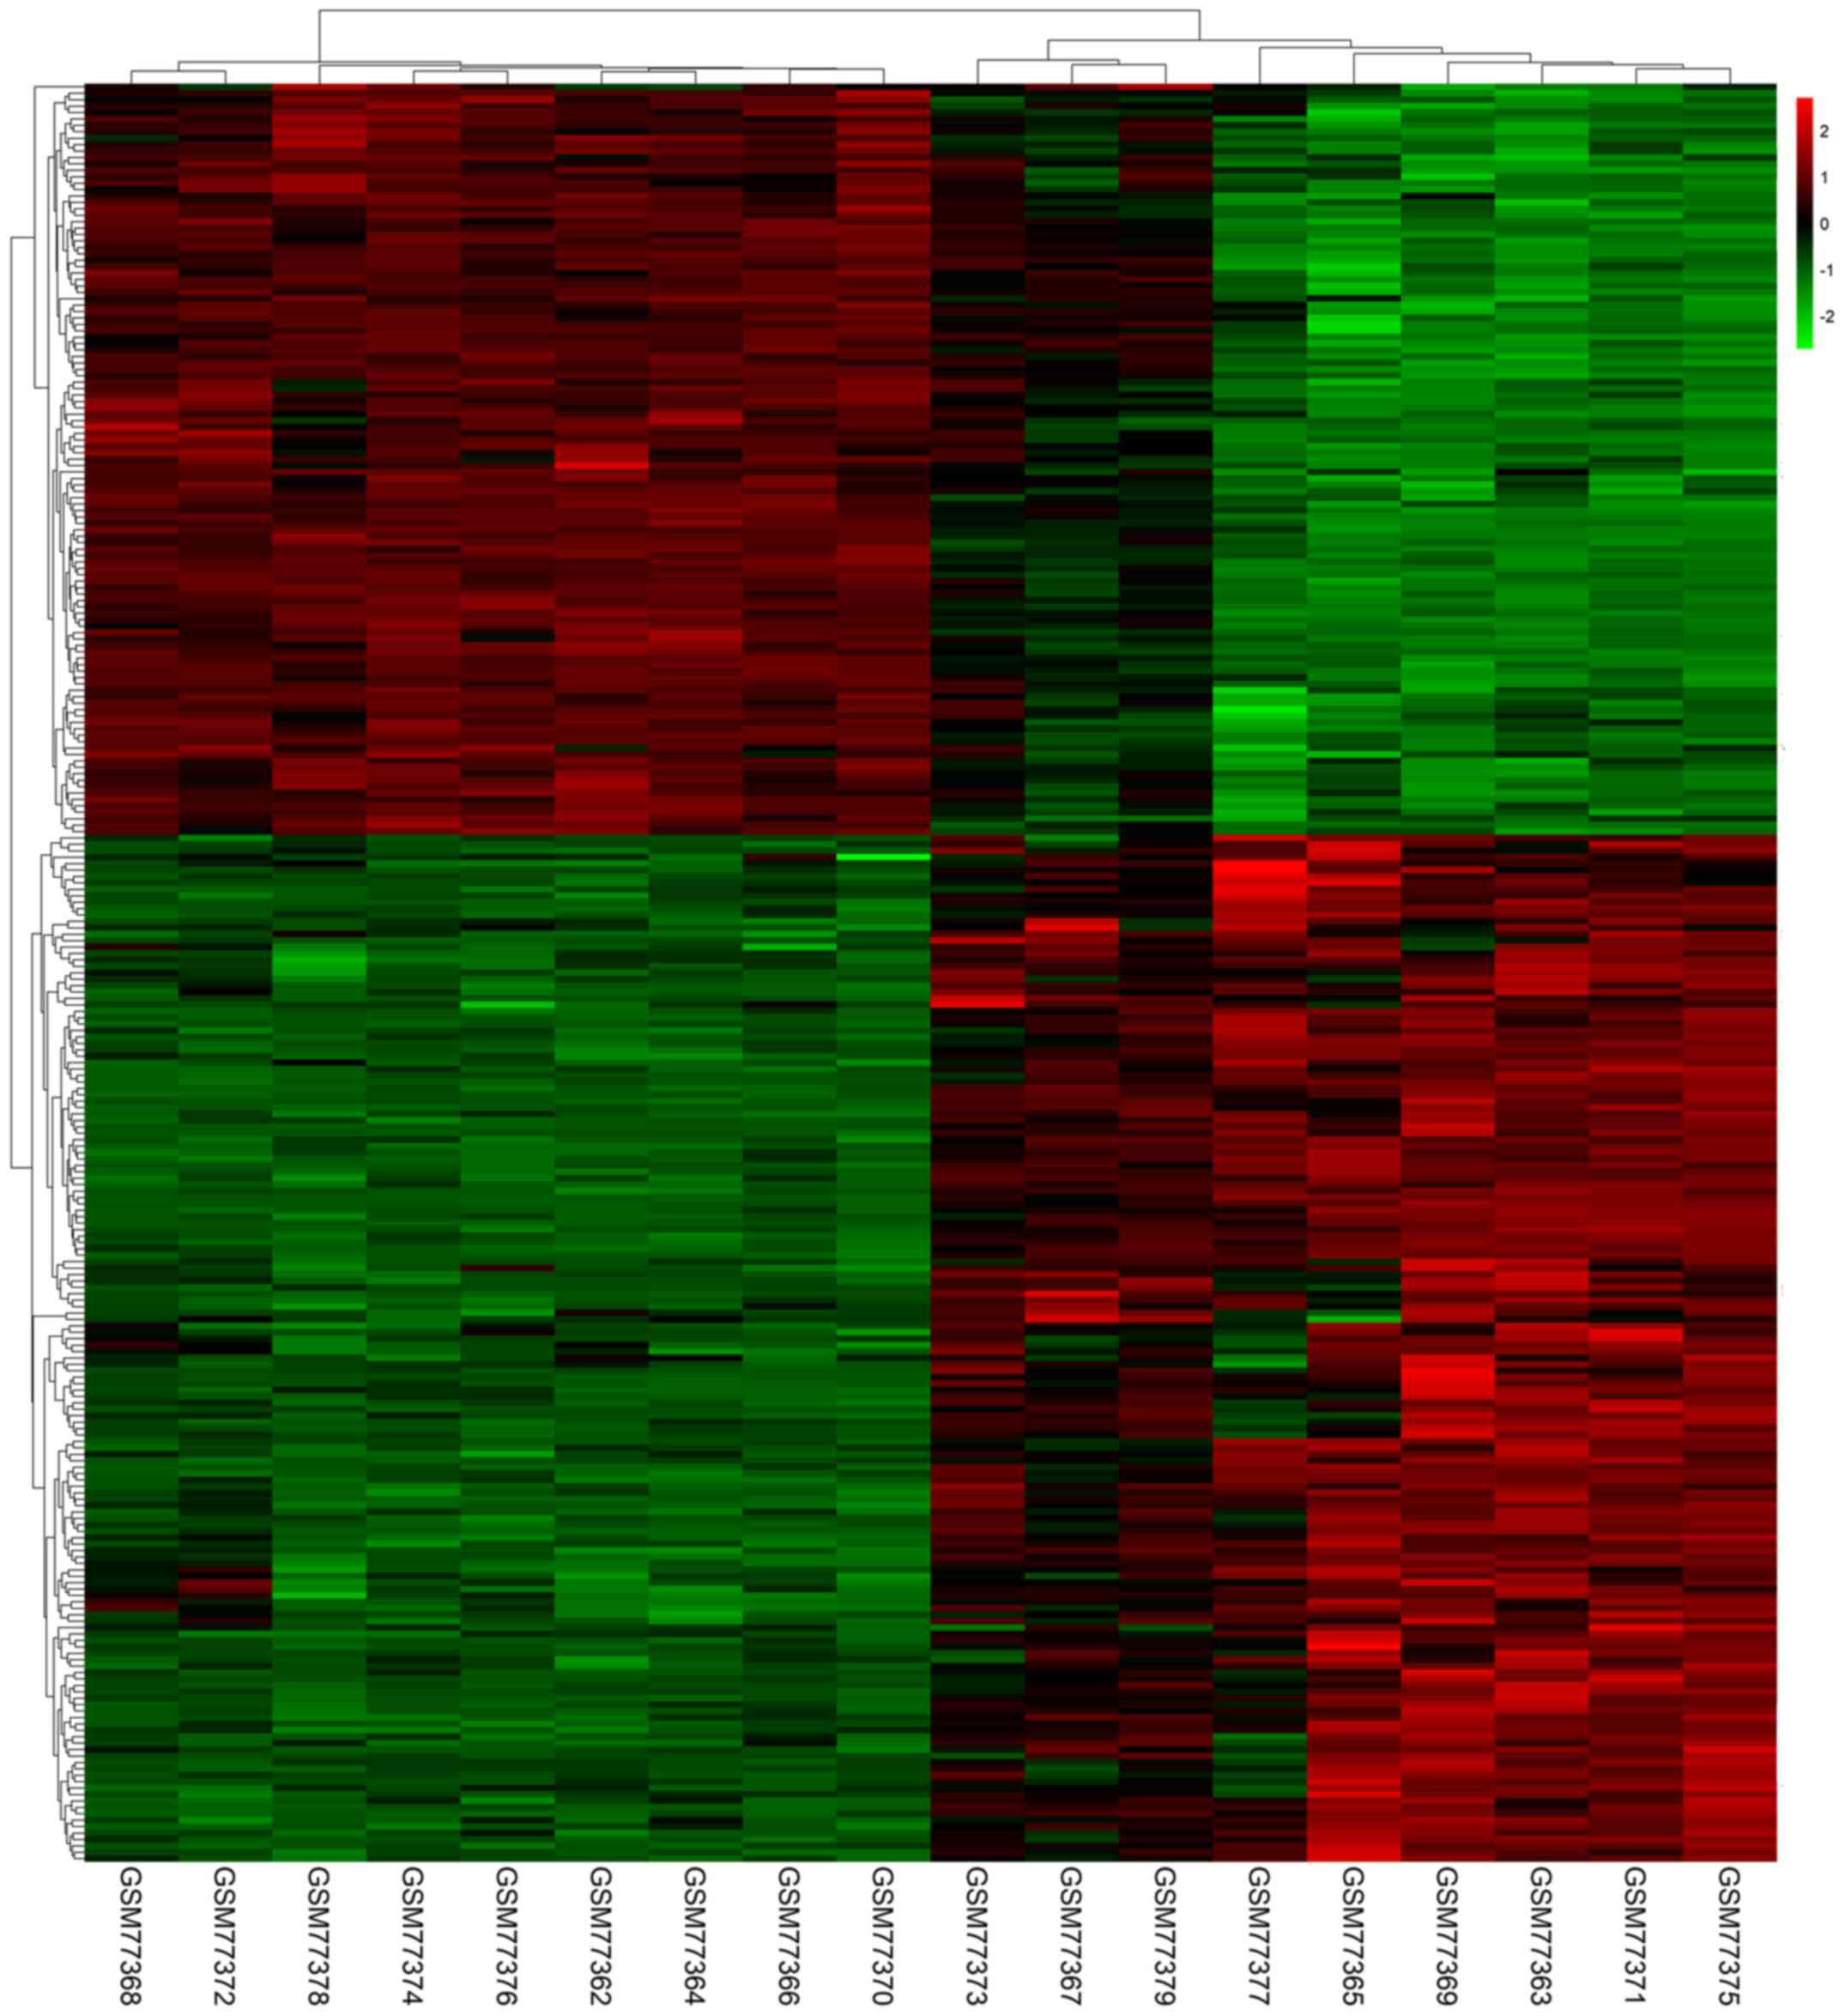
in PTC tissues compared with normal tissues. A heat map
demonstrated the significant differential distribution of the DEGs
using data profile GSE3467 as a reference (Fig. 2).
Identification of key genes and
prediction of function
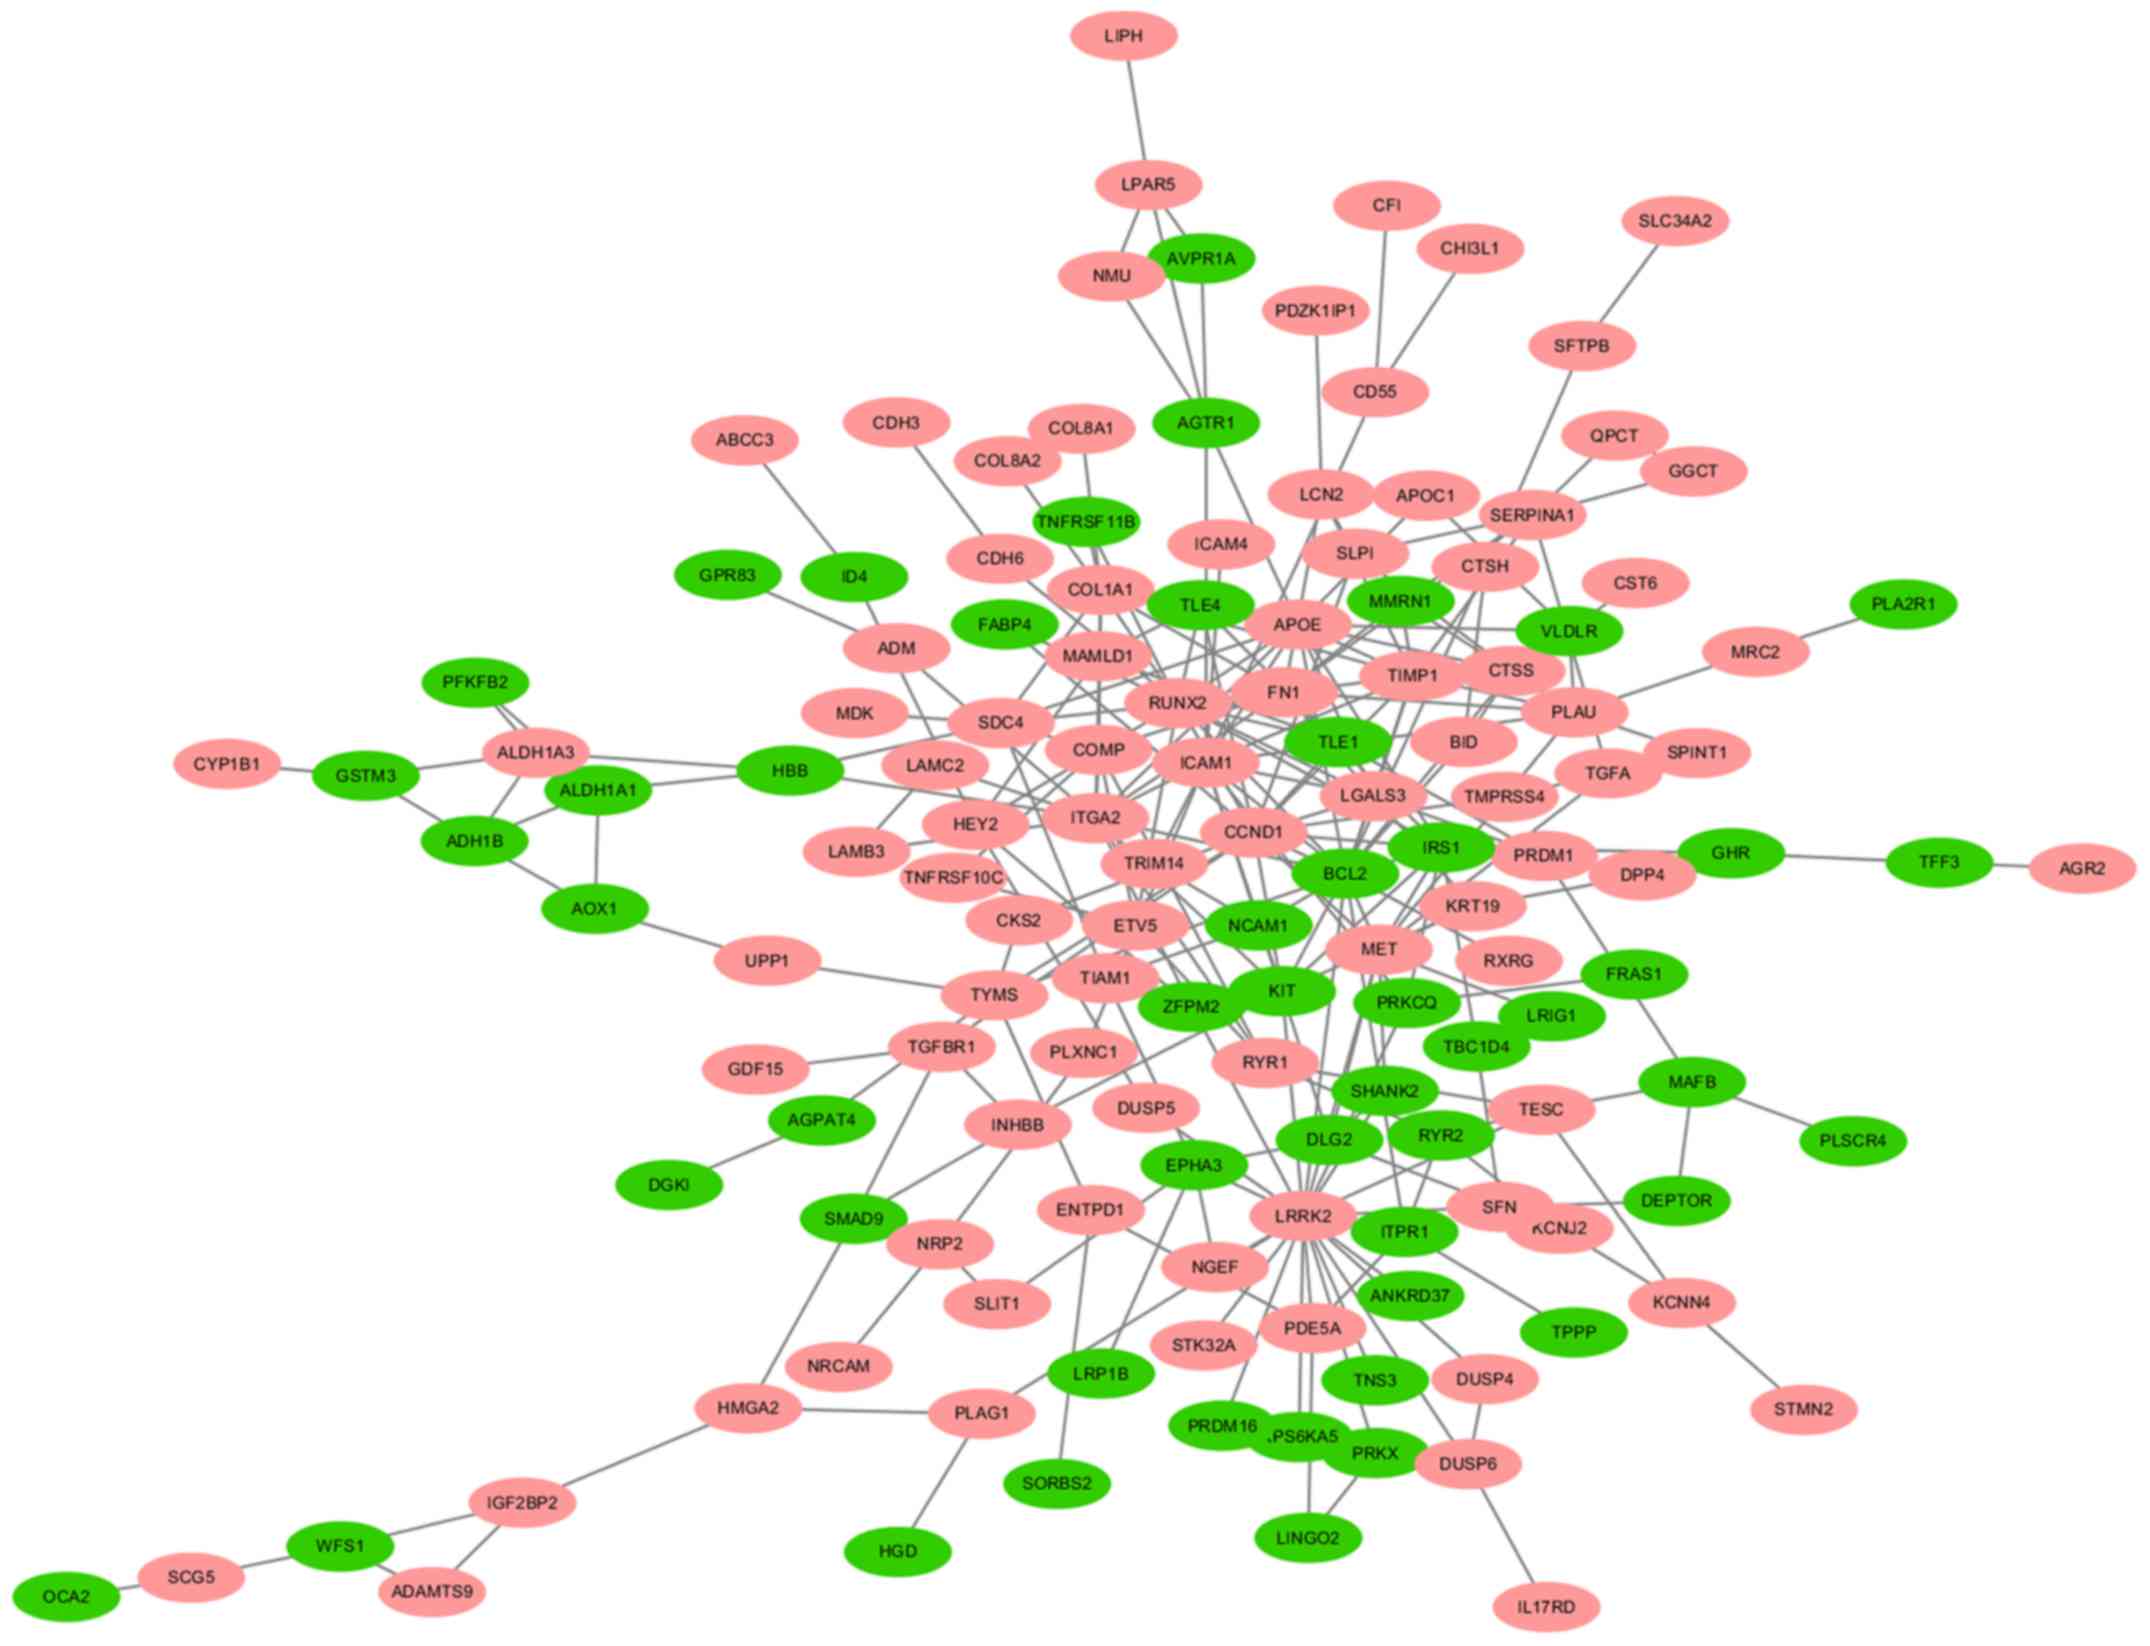
A total of 140 DEGs (89 upregulated and 51
downregulated genes) were filtered into the PPI network, which
comprised 140 nodes and 255 edges, using the STRING online database
and were visualized using Cytoscape software (Fig. 3). Seven key genes were selected from
the intersection of the top 55 genes from 12 algorithms by
cytoHubba, including apolipoprotein E (APOE), CTSS,
IRS1, KIT proto-oncogene receptor tyrosine kinase (KIT),
LGALS3, RUNX2 and transforming growth factor-β receptor type 1
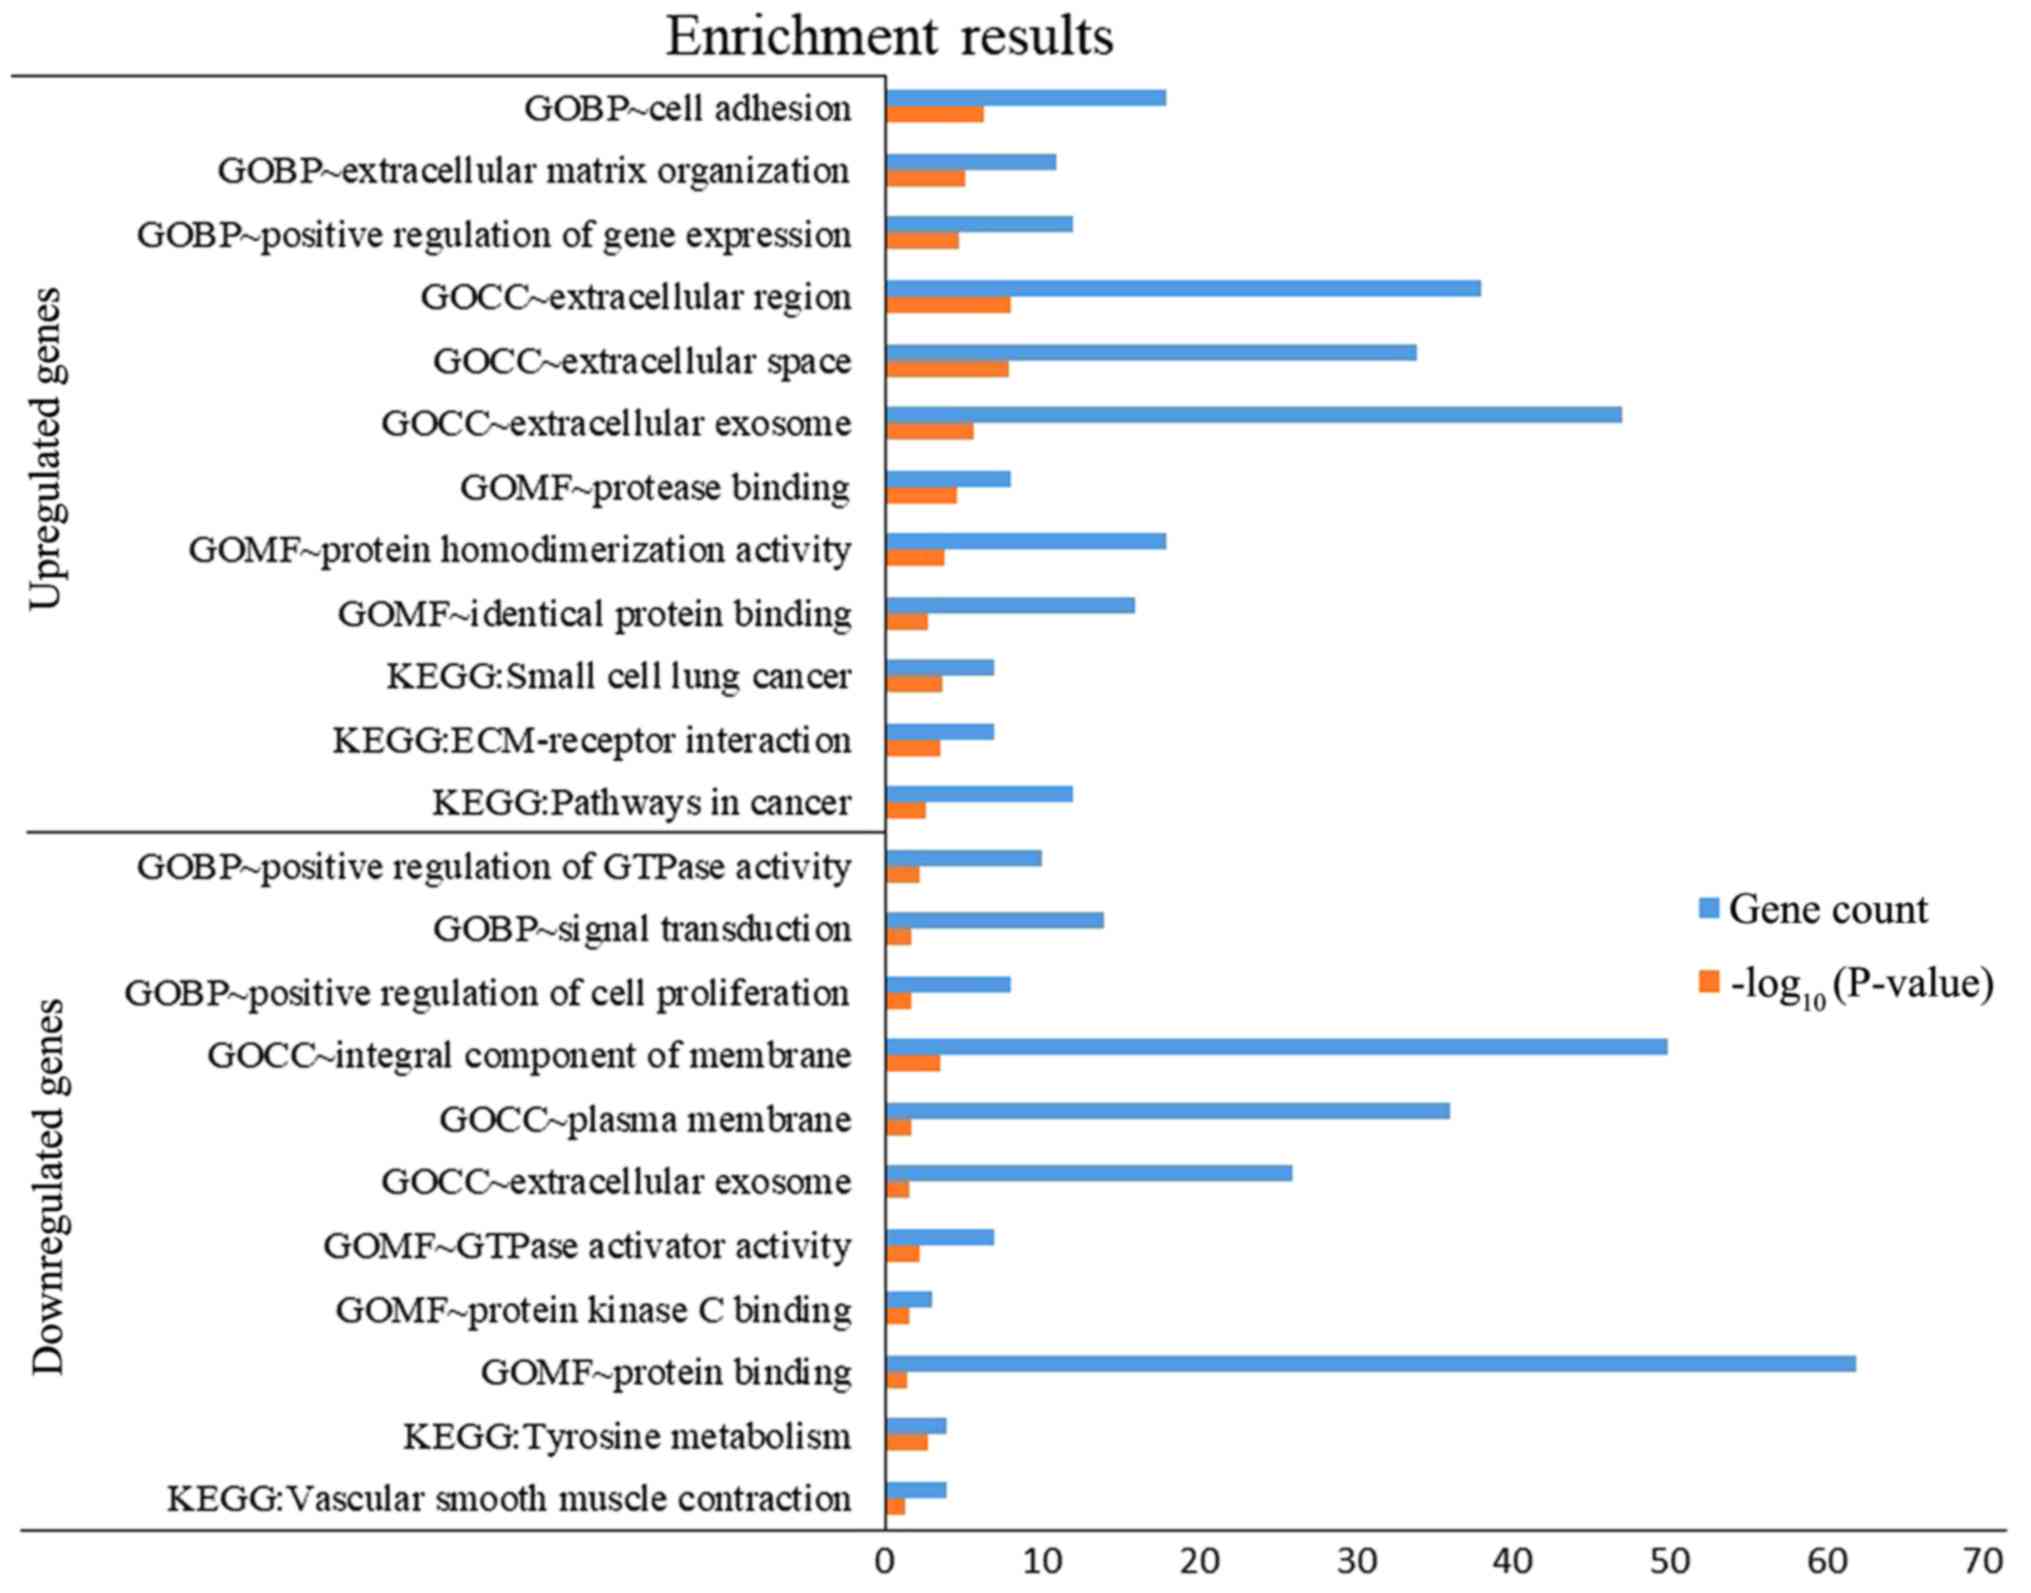
(TGFBR1). DEGs were subjected to functional enrichment
analyses, which indicated that the upregulated genes were mainly
enriched in the terms ‘cell adhesion’, ‘protease binding’, ‘small
cell lung cancer’, ‘ECM-receptor interaction’ and ‘pathways in
cancer’, while the downregulated genes were mainly enriched in the
terms ‘signal transduction’, ‘protein binding’ and ‘tyrosine
metabolism’ (Fig. 4). Therefore,
these DEGs may be associated with thyroid tumorigenesis.
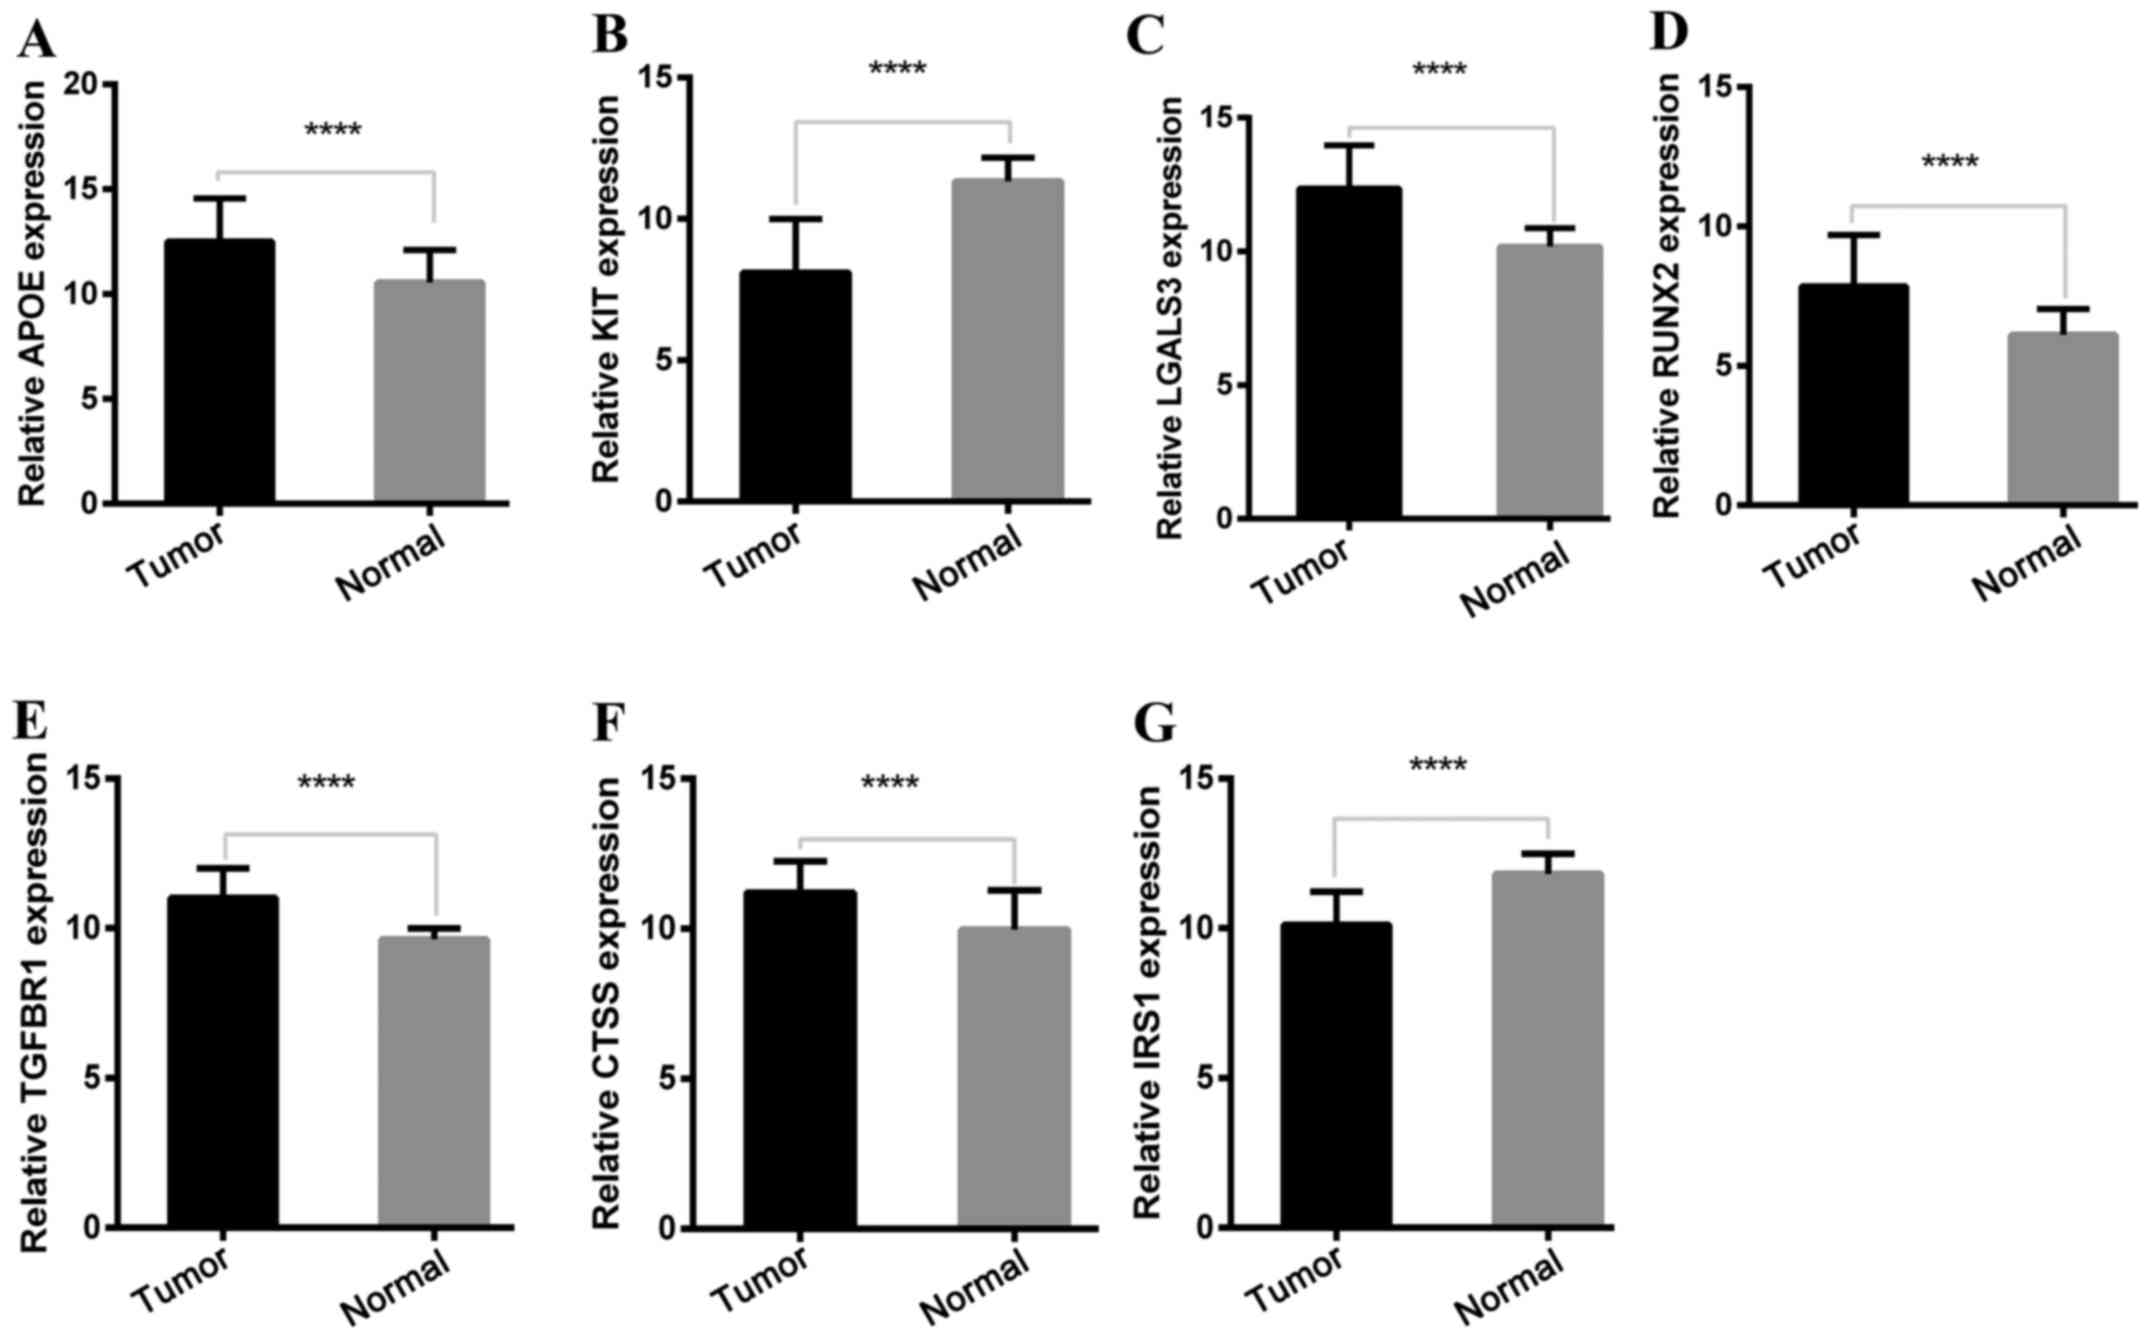
Expression of key genes in the TCGA
cohort
To determine the reliability of the identified DEGs
from the four cohorts, their expression levels in 501 PTC samples
and 59 normal thyroid tissues included in the TCGA database were
evaluated. Consistent with the GEO analysis, 5 upregulated and 2
downregulated genes were significantly overexpressed and
underexpressed respectively, in the PTC samples compared with the
normal tissue samples (P<0.0001; Fig. 5).
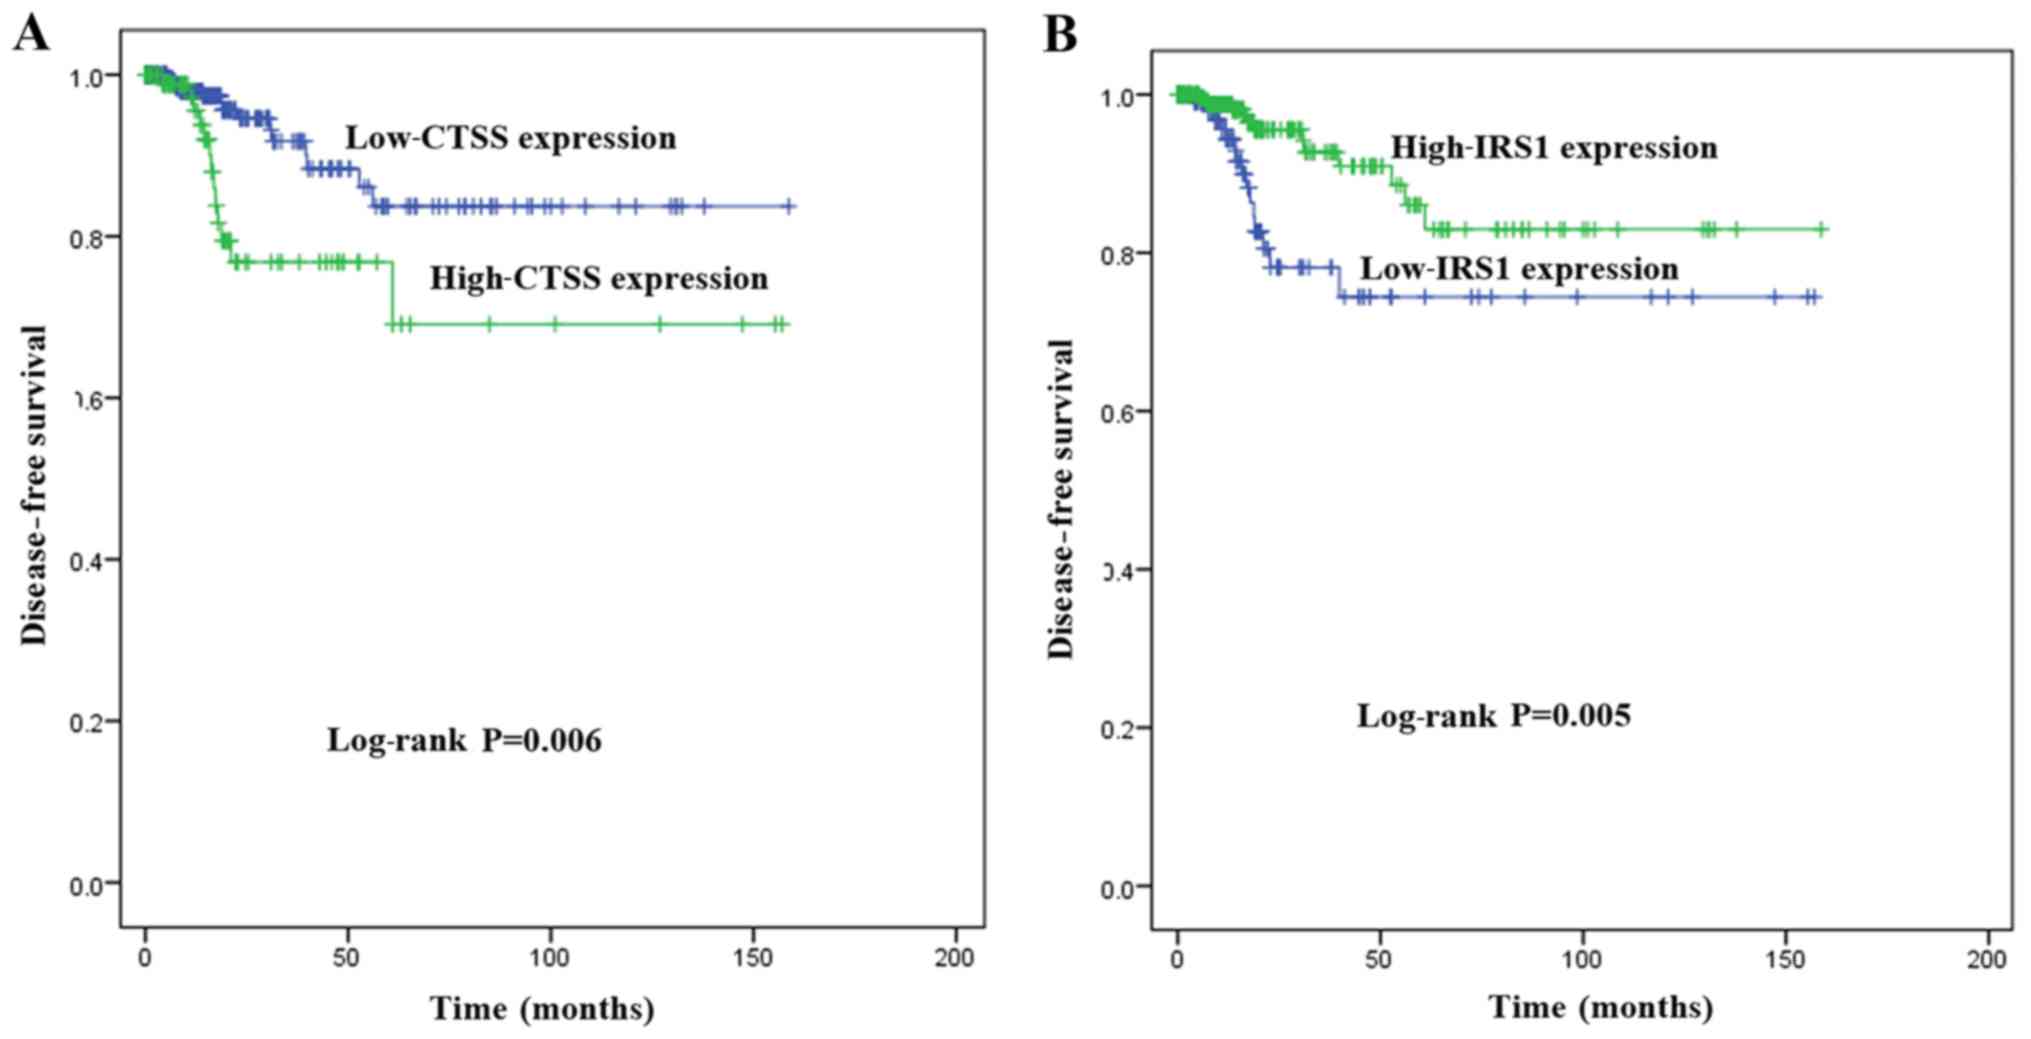
Key genes associated with DFS
To investigate the association between the
expression of key genes and DFS in patients with PTC, Kaplan-Meier
survival analyses comparing the expression of the seven key genes
and the DFS in the TCGA cohort were performed. From the
Kaplan-Meier survival curves, CTSS (Fig. 6A; P=0.006) and IRS1 (Fig. 6B; P=0.005) were observed to exhibit
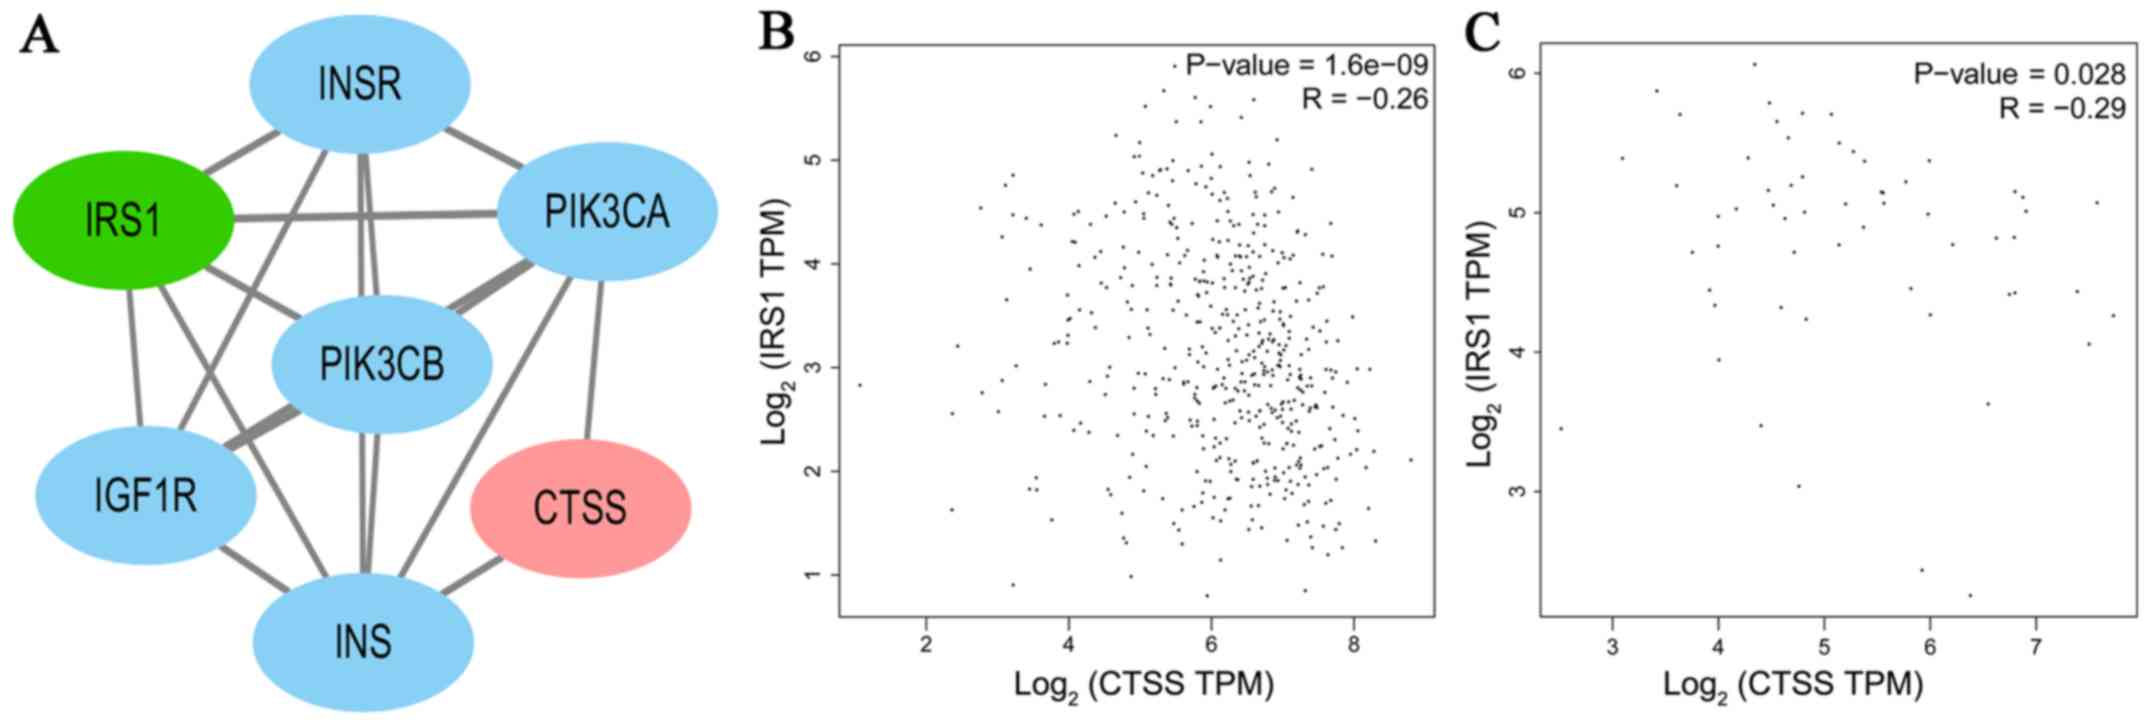
significant correlations with DFS. A PPI network analysis revealed
that there was no direct association between IRS1 and CTSS
(Fig. 7A). A significant positive
correlation was observed between CTSS and IRS1 mRNAs,
both in PTC tissues and normal thyroid tissues (Pearson's
correlation, in PTC tissues, r=−0.26, P<0.001, Fig. 7B; in normal thyroid tissues,
r=−0.29, P<0.05, Fig. 7C).
Key genes independently predicting
DFS
The Cox proportional hazards regression model was
used to determine whether aberrant expression levels of CTSS and
IRS1 may be independent risk factors for DFS in PTC. Univariate
analysis revealed that the significant variables associated with
DFS were increased LNM (HR, 3.242; 95% CI, 1.300–8.083; P=0.012),
advanced TNM stage (HR, 2.323; 95% CI, 1.102–4.895; P=0.027),
higher expression of CTSS (HR, 2.705; 95% CI, 1.287–5.688;
P=0.009), and lower expression of IRS1 (HR, 0.360, 95% CI,
0.171–0.756; P=0.007). Multivariate analysis adjusted for sex,
histological type, T stage, LNM, TNM stage, as well as the
expression of CTSS and IRS1 indicated that only the
increased expression of CTSS was an independent predictive
factor for DFS (HR, 2.649; 95% CI, 1.095–6.409; P=0.031).
Therefore, the increased expression of CTSS was considered
to have a significant negative impact on the DFS of patients with
PTC (Table I).
 | Table I.Univariate and multivariate Cox
regression analysis of factors associated with disease-free
survival (DFS). |
Table I.
Univariate and multivariate Cox
regression analysis of factors associated with disease-free
survival (DFS).
|
| Univariate
analysis | Multivariate
analysis |
|---|
|
|
|
|
|---|
| All variables | P-value | HR | 95% CI | P-value | HR | 95% CI |
|---|
| Age (years) |
|
|
|
|
|
|
|
<45 |
| 1 |
|
|
|
|
|
≥45 | 0.939 | 1.030 | 0.488–2.172 | nd | nd | nd |
| Sex |
|
|
|
|
|
|
|
Male |
| 1 |
|
| 1 |
|
|
Female | 0.273b | 0.641 | 0.290–1.418 | 0.152 | 0.530 | 0.222–1.265 |
| Maximum tumor size
(cm) |
|
|
|
|
|
|
|
<4 |
| 1 |
|
|
|
|
| ≥4 | 0.619 | 1.229 | 0.545–2.771 | nd | nd | nd |
| Multifocality |
|
|
|
|
|
|
|
Unifocal |
| 1 |
|
|
|
|
|
Multifocal | 0.794 | 1.108 | 0.515–2.383 | nd | nd | nd |
| ETE |
|
|
|
|
|
|
| No |
| 1 |
|
|
|
|
|
Yes | 0.952 | 1.024 | 0.470–2.230 | nd | nd | nd |
| LNM |
|
|
|
|
|
|
| N0 |
| 1 |
|
| 1 |
|
| N1 | 0.012c | 3.242 | 1.300–8.083 | 0.112 | 2.400 | 0.816–7.056 |
| T stage |
|
|
|
|
|
|
|
T1-T2 |
| 1 | 1 |
|
|
|
|
T3-T4 | 0.326b | 1.451 | 0.690–3.052 | 0.611 | 1.239 | 0.542–2.835 |
| TNM stage |
|
|
|
|
|
|
|
I–II |
| 1 |
|
| 1 |
|
|
III–IV | 0.027c | 2.323 | 1.102–4.895 | 0.100 | 2.117 | 0.867–5.173 |
| Histological
type |
|
|
|
|
|
|
|
Classical PTC |
| 1 |
|
| 1 |
|
|
Follicular PTC | 0.369b | 0.575 | 0.172–1.925 | 0.672 | 1.312 | 0.373–4.610 |
|
Tall-cell PTC | 0.557 | 0.548 | 0.073–4.086 | 0.190 | 0.251 | 0.032–1.980 |
| CTSS |
|
|
|
|
|
|
| ≥
cut-offa | 0.009d | 2.705 | 1.287–5.688 | 0.031c | 2.649 | 1.095–6.409 |
| <
cut-offa |
| 1 |
|
| 1 |
|
| IRS1 |
|
|
|
|
|
|
| ≥
cut-offa | 0.007d | 0.360 | 0.171–0.756 | 0.208 | 0.551 | 0.218–1.392 |
| <
cut-offa |
| 1 |
|
| 1 |
|
Expression of CTSS and
clinicopathological factors
To further analyze the association between the
expression of CTSS and clinicopathological characteristics
in patients with PTC, patients were divided into high-expression
and low-expression groups based on CTSS levels. It was
revealed that high expression of CTSS was significantly
associated with different histological subtypes (increased
tall-cell subtype and reduced follicular subtype; P<0.001), more
frequent LNM (P<0.001) and advanced TNM stage (P=0.049).
However, there was no significant association between the
expression of CTSS and any other clinicopathological
characteristic, including age, sex, maximum size of tumor,
multifocality and T stage (P>0.05; Table II).
| Table II.Correlation between the expression of
CTSS and patient clinicopathological characteristics. |
Table II.
Correlation between the expression of
CTSS and patient clinicopathological characteristics.
|
| CTSS
subgroupa |
|
|---|
|
|
|
|
|---|
| Variables | Low (%) | High (%) |
P-valueb |
|---|
| No. of cases | 251 | 250 |
|
| Age (years) |
|
|
0.140 |
|
<45 | 106 (46.5) | 122 (53.5) |
|
|
≥45 | 145 (53.1) | 128 (46.9) |
|
| Sex |
|
|
0.244 |
|
Male | 62
(45.9) | 73
(54.1) |
|
|
Female | 187 (51.8) | 174 (48.2) |
|
| Maximum tumor size
(cm) |
|
|
0.529 |
|
<4 | 177 (49.6) | 180 (50.4) |
|
| ≥4 | 64
(52.9) | 57
(47.1) |
|
| Multifocality |
|
|
0.495 |
|
Unifocal | 129 (48.7) | 136 (51.3) |
|
|
Multifocal | 117 (51.8) | 109 (48.2) |
|
| ETE |
|
|
0.230 |
| No | 183 (55.1) | 149 (44.9) |
|
|
Yes | 59
(48.8) | 62
(51.2) |
|
| T stage |
|
|
0.133 |
|
T1-T2 | 162 (52.8) | 145 (47.2) |
|
|
T3-T4 | 89
(45.9) | 105 (54.1) |
|
| LNM |
|
|
<0.001d |
| N0 | 129 (57.1) | 97
(42.9) |
|
| N1 | 87
(38.7) | 138 (61.3) |
|
| TNM stage |
|
|
0.049c |
|
I–II | 177 (53.0) | 157 (47.0) |
|
|
III–IV | 72
(43.6) | 93
(56.4) |
|
| Histological
type |
|
|
<0.001d |
|
Classical PTC | 144 (44.6) | 179 (55.4) |
|
|
Follicular PTC | 77
(77.8) | 22
(22.2) |
|
|
Tall-cell PTC | 8
(23.5) | 26
(76.5) |
|
Correlation between the expression of
CTSS and LNM
Binary logistic regression analysis was performed to
determine whether the overexpression of CTSS may be an independent
risk factor for LNM in PTC. As listed in Table III, univariate analysis revealed
that LNM was associated with older age (OR, 0.610; 95% CI,
0.420–0.887; P=0.010), larger tumor size (OR, 1.884; 95% CI,
1.203–2.951; P=0.006), ETE (OR, 2.751; 95% CI, 1.809–4.183;
P<0.001), advanced T stage (OR, 2.646; 95% CI, 1.792–3.908;
P<0.001), histological subtype (OR, 0.172; 95% CI, 0.091–0.326;
P<0.001), overexpression of IRS1 (OR, 0.335; 95% CI,
0.228–0.492; P<0.001) and overexpression of CTSS (OR, 2.688; 95%
CI, 1.780–4.059; P<0.001). After adjusting for these variables,
multivariate analysis indicated that overexpression of CTSS
(OR, 2.015; 95% CI, 1.225–3.315; P=0.006) was an independent risk
factor for LNM, whereas age ≥45 years was a significant protective
predictive factor (OR, 0.527; 95% CI, 0.331–0.840; P=0.007), as was
the overexpression of IRS1 (OR, 0.579; 95% CI, 0.362–0.926;
P=0.022) and follicular-variant histology was significantly
associated with a lower incidence of LNM compared with classical
PTC (OR, 0.205; 95% CI, 0.102–0.414; P<0.001). No significant
associations were observed between LNM and other factors, including
tumor size, ETE and T stage (P>0.05; Table III).
| Table III.Univariate and multivariate logistic
regression analysis of the factors associated with lymph node
metastasis (LNM). |
Table III.
Univariate and multivariate logistic
regression analysis of the factors associated with lymph node
metastasis (LNM).
|
| Univariate
analysis | Multivariate
analysis |
|---|
|
|
|
|
|---|
| Variables | P-value | OR | 95% CI | P-value | OR | 95% CI |
|---|
| Age (years) |
|
|
|
|
|
|
|
<45 |
| 1 |
|
| 1 |
|
|
≥45 |
0.010b | 0.610 | 0.420–0.887 | 0.007c | 0.527 | 0.331–0.840 |
| Sex |
|
|
|
|
|
|
|
Male |
| 1 |
|
|
|
|
|
Female |
0.051 | 0.659 | 0.434–1.001 | nd | nd | nd |
| Maximum tumor size
(cm) |
|
|
|
|
|
|
|
<4 |
| 1 |
|
| 1 |
|
| ≥4 |
0.006c | 1.884 | 1.203–2.951 | 0.246 | 1.443 | 0.776–2.682 |
| Multifocality |
|
|
|
|
|
|
|
Unifocal |
| 1 |
|
|
|
|
|
Multifocal |
0.088 | 1.386 | 0.953–2.017 | nd | nd | nd |
| ETE |
|
|
|
|
|
|
| No |
| 1 |
|
| 1 |
|
|
Yes |
<0.001d | 2.751 | 1.809–4.183 | 0.392 | 1.430 | 0.630–3.246 |
| T stage |
|
|
|
|
|
|
|
T1-T2 |
| 1 |
|
| 1 |
|
|
T3-T4 |
<0.001d | 2.646 | 1.792–3.908 | 0.346 | 1.495 | 0.648–3.448 |
| Histological
type |
|
|
|
|
|
|
|
Classical PTC |
| 1 |
|
| 1 |
|
|
Follicular PTC |
<0.001d | 0.172 | 0.091–0.326 |
<0.001d | 0.205 | 0.102–0.414 |
|
Tall-cell PTC |
0.185 | 1.671 | 0.783–3.567 | 0.932 | 1.038 | 0.439–2.458 |
| CTSS |
|
|
|
|
|
|
| ≤
cut-offa |
| 1 |
|
| 1 |
|
| >
cut-offa |
<0.001d | 2.688 | 1.780–4.059 | 0.006c | 2.015 | 1.225–3.315 |
| IRS1 |
|
|
|
|
|
|
| ≤
cut-offa |
| 1 |
|
| 1 |
|
| >
cut-offa |
<0.001d | 0.335 | 0.228–0.492 | 0.022b | 0.579 | 0.362–0.926 |
Discussion
The present study identified 277 DEGs in tumor
samples from four GEO cohorts. Enrichment analyses indicated that
the majority of the DEGs could be associated with thyroid
tumorigenesis. The top DEGs [APOE, CTSS, IRS1, KIT,
galectin-3 (LGALS3), runt-related transcription factor 2
(RUNX2) and TGFBR1] were extracted as hub genes, and
their aberrant expression in the TCGA cohort was consistent with
the GEO analysis, supporting the validity of the results.
Apolipoprotein E (APOE) is a 299-amino acid
glycoprotein that is known to play a role in cholesterol transport
and metabolism. APOE can play diverse roles in a number of
biological processes, including cell growth, differentiation,
immune stress and survival (19).
APOE has been identified to be overexpressed in lung
(20) and ovarian cancer (21), however, the data available regarding
APOE in PTC are limited. The present study revealed that
APOE was significantly upregulated in PTC tissues.
Therefore, APOE may be a typical biological characteristic
of PTC.
KIT proto-oncogene receptor tyrosine kinase
(KIT), a type-III receptor tyrosine kinase (RTK), plays a
crucial role in the occurrence of cancer. Dysregulation of
KIT (including overexpression and gain-of-function,
loss-of-function and point mutations) has been detected in several
types of human cancer (22–25). In thyroid tumors, the expression
levels of KIT were significantly lower in malignant than in
benign tumors, which was considered a very strong predictive
indicator for discriminating malignant from benign tumors (26,27).
Consistent with the results of previous studies, the present study
revealed that KIT was significantly downregulated in PTC
tissues. Therefore, KIT may be a useful diagnostic marker in
PTC.
LGALS3, a member of a β-galactoside-binding
protein family, is involved in normal growth development, and
cancer progression and metastasis, as well as implicated in cell
growth, differentiation, adhesion and malignant transformation.
Previous studies have demonstrated that LGALS3 may serve as
a diagnostic marker for thyroid cancer (28,29).
The present study demonstrated that the expression levels of
LGALS3 were significantly higher in PTC tissues than in
normal tissues, which supported the hypothesis that LGALS3
is a valuable diagnostic marker for thyroid cancer.
Runt-related transcription factor 2 (RUNX2)
is a transcription factor required for bone development. The
involvement of RUNX2 in tumor progression and metastasis has
been increasingly recognized in different types of tumor cells
(30–35). The present study revealed that
RUNX2 was upregulated in PTC tissues. Additionally,
RUNX2 was enriched in the GO BP terms ‘positive regulation
of cell proliferation’ and in the KEGG pathway ‘transcriptional
misregulation in cancer’. In agreement with this, previous studies
have identified an association between the expression of
RUNX2 and thyroid cancer progression (36–39).
Therefore, RUNX2 may play an important role in thyroid
tumorigenesis.
Transforming growth factor-β (TGF-β) is a
member of the disulfide-bonded cytokine family and plays an
important role in cell growth, differentiation, apoptosis and
survival. TGFBR1 is a receptor for TGF-β ligands.
Following stimulation with TGF-β ligands, TGFBR1
activates several different signaling pathways, including the Smad,
MAPK, PI3K and serine/threonine protein kinase (Akt) pathways, and
contributes to the invasion, metastasis and progression of cancer
(40–42). However, the oncogenic role of
TGFBR1 in thyroid cancer has not been adequately
investigated. The present study revealed that TGFBR1 was
associated with the GO BP terms ‘positive regulation of apoptotic
signaling pathway’, ‘positive regulation of cell proliferation’,
‘positive regulation of cell migration’ and the KEGG term ‘pathways
in cancer’. Furthermore, the present study demonstrated that
TGFBR1 was highly expressed in PTC tissues, indicating a
potential role in thyroid tumorigenesis.
In the present study, aberrant expression of
CTSS and IRS1 was revealed to be associated with DFS.
To the best of our knowledge, there have been no previous studies
on the relationship between IRS1 and CTSS. Although there was no
direct association between IRS1 and CTSS, a
significant positive correlation was observed between CTSS and IRS1
mRNAs, both in PTC and normal thyroid tissues. The mechanisms
underlying the relationship between CTSS and IRS1
must be explored in future studies. Insulin receptor substrate 1
(IRS1) is an adaptor protein that functions as a downstream
messenger from activated cell surface receptors to numerous
signaling pathway cascades. Early studies on IRS1 introduced
its role in metabolism, but a great deal of recent research has
focused on its role in cancer progression and metastasis. The
PI3K/Akt pathway is one of the main downstream signaling pathways
activated by phosphorylated IRS1 (43). However, the regulatory roles of
IRS1 in tumorigenesis are controversial. IRS1 has
been shown to promote the proliferation and metastasis of
pancreatic (44) and colon cancer
(45). However, in other studies,
suppression of IRS1 promoted the metastasis of head and neck
squamous cell carcinoma (46),
neutrophil elastase-mediated degradation of IRS1 induced
lung tumor cell proliferation (47). Previous studies have also
demonstrated that IRS1 may be both a tumor promoter and
suppressor in breast cancer (48,49).
The present study revealed that IRS1 was a protective factor
for LNM, and the low-IRS1 expression group exhibited a
shorter DFS time compared with the high-IRS1 expression
group, indicating it as a negative regulator in PTC. This finding
was consistent with studies that have indicated that IRS1 was a
metastatic suppressor (50).
Therefore, the role of IRS1 may depend on the type of cancer.
In the present study, the overexpression of
CTSS was the only independent predictive risk factor for
DFS. The high-CTSS expression group exhibited different
histological types, advanced TNM stage and increased LNM compared
with the low-CTSS expression group. Furthermore, CTSS
was identified as an independent risk factor for LNM in PTC. The
results of the present study indicated that CTSS may play an
important role in tumorigenesis, and that high CTSS
expression may be associated with disease recurrence and
progression in PTC.
Cysteine cathepsin proteases, which are
endo-lysosomal proteases, contribute to diseases such as cancer,
osteoporosis and arthritis (51).
The initial attention of researchers in cathepsins in cancer is
attributed to the overexpression of cathepsin in tumors in
comparison with normal tissues. Previous studies spanning decades
have suggested that cathepsins make crucial contributions to tumor
progression of numerous cancers by diverse mechanisms. For example,
cysteine cathepsins are associated with protein catabolism and
autophagy, degradation of the extracellular matrix (ECM) and
activation and degradation of growth factors, cytokines and
chemokines (52–55).
The human family of cysteine cathepsins comprises 11
members that are involved in diverse physiological processes,
including bone protein degradation, autophagy, antigen
presentation, growth factor receptor recycling, cellular stress
signaling and lysosome-mediated cell death (56). CTSS is a lysosomal cysteine
protease of the papain superfamily of cysteine proteases, which
plays an important role in cancer by contributing to apoptosis,
autophagy, angiogenesis, invasion, migration and clinical prognosis
(57–60). CTSS has characteristics
distinct from numerous other family members. Firstly, it remains
active at neutral and acidic pH (61), whereas many other cysteine
cathepsins are active at an acidic pH. Secondly, the expression of
CTSS is unique among the cysteine cathepsin family, as it is
specifically expressed by antigen-presenting cells (APCs) (62). Thirdly, CTSS exerts more
physiological effects than other cathepsins in the processing of
proteins in the extracellular microenvironment (63).
Previous studies have indicated that CTSS was
frequently overexpressed in colorectal (58,64),
lung, gastric (65) and prostate
cancer (66), as well as in
hepatocellular carcinoma (67),
glioma (68) and breast cancer
(69). Although the results of
these recent in vitro and in vivo studies
demonstrated that CTSS played an important role in
tumorigenesis, no data are currently available regarding the
abnormal expression of CTSS or its association with the
clinical outcomes of patients with PTC. The present study revealed
that CTSS was frequently upregulated in PTC samples compared
with normal tissues. Furthermore, it was revealed that high
CTSS expression was significantly associated with more
frequent LNM and a poorer DFS. However, the exact mechanisms
underlying how the overexpression of CTSS influenced LNM
remained unclear. It has been reported that the expression of
CTSS was regulated by the PI3K/Akt and Ras/Raf/MAPK
signaling pathways through the activation of NF-κB (69), which has been well established to
contribute to thyroid tumorigenesis (70). Therefore, all these results
indicated that the expression of CTSS plays a key role in thyroid
tumorigenesis and its overexpression may be associated with
aggressiveness and progression in thyroid cancer.
Accumulating evidence has demonstrated that the
expression of CTSS is an independent predictor of a poor
prognosis in some types of human cancer, including gastric
(65) and colorectal cancer
(58), as well as glioma (71) and lung cancer (72). The present study extended this
observation to PTC. A shorter DFS time was observed in patients
with high expression of CTSS compared with those with low
expression of CTSS. These results indicated that the
overexpression of CTSS may provide guidance for identifying
postoperative patients at high risk of disease recurrence or
progression who may benefit from effective adjuvant therapy.
To the best of our knowledge, the present study was
the first to demonstrate that CTSS was significantly
upregulated in PTC samples compared with normal tissues.
Furthermore, a high expression of CTSS was significantly
associated with LNM and disease recurrence or progression in
patients with PTC. Further studies are required to confirm the
results of the present study and to identify the mechanism
underlying the association between CTSS expression and the
pathogenesis of PTC. Confirmation of the results of the present
study may establish the expression of CTSS as a diagnostic
and prognostic marker of PTC.
Acknowledgements
Not applicable.
Funding
The present study was supported in part by the Key
Research and Development Project of Jiangsu Province (BE2015723)
and Six Talent Peak Funding Plan (WSN-061).
Availability of data and materials
The datasets used during the present study are
available from the corresponding author upon reasonable
request.
Authors' contributions
JT and YL conceived and designed the study. XA, TC,
BS and HL analyzed the data. JT and HL wrote the paper. XQ, DD and
ZZ were also involved in the conception of the study. All authors
read and approved the manuscript and agree to be accountable for
all aspects of the research in ensuring that the accuracy or
integrity of any part of the work are appropriately investigated
and resolved.
Ethics approval and consent to
participate
Not applicable.
Consent for publication
Not applicable.
Competing interests
The authors state that they have no competing
interests.
Glossary
Abbreviations
Abbreviations:
|
CTSS
|
cathepsin S
|
|
PTC
|
papillary thyroid cancer
|
|
DEGs
|
differentially expressed genes
|
|
DFS
|
disease-free survival
|
|
LNM
|
lymph node metastasis
|
|
ETE
|
extrathyroidal extension
|
|
TNM
|
tumor-node-metastasis
|
|
CI
|
confidence interval
|
|
HR
|
hazard ratio
|
|
OR
|
odds ratio
|
References
|
1
|
Siegel RL, Miller KD and Jemal A: Cancer
statistics, 2016. CA Cancer J Clin. 66:7–30. 2016. View Article : Google Scholar : PubMed/NCBI
|
|
2
|
Siegel RL, Miller KD and Jemal A: Cancer
Statistics, 2017. CA Cancer J Clin. 67:7–30. 2017. View Article : Google Scholar : PubMed/NCBI
|
|
3
|
Haugen BR: 2015 American Thyroid
Association Management Guidelines for Adult Patients with Thyroid
Nodules and Differentiated Thyroid Cancer: What is new and what has
changed? Cancer. 123:372–381. 2017. View Article : Google Scholar : PubMed/NCBI
|
|
4
|
Grogan RH, Kaplan SP, Cao H, Weiss RE,
Degroot LJ, Simon CA, Embia OM, Angelos P, Kaplan EL and Schechter
RB: A study of recurrence and death from papillary thyroid cancer
with 27 years of median follow-up. Surgery. 154:1436–1446;
discussion 1446-7. 2013. View Article : Google Scholar : PubMed/NCBI
|
|
5
|
Giordano TJ, Kuick R, Thomas DG, Misek DE,
Vinco M, Sanders D, Zhu Z, Ciampi R, Roh M, Shedden K, et al:
Molecular classification of papillary thyroid carcinoma: Distinct
BRAF, RAS, and RET/PTC mutation-specific gene expression profiles
discovered by DNA microarray analysis. Oncogene. 24:6646–6656.
2005. View Article : Google Scholar : PubMed/NCBI
|
|
6
|
Adeniran AJ, Zhu Z, Gandhi M, Steward DL,
Fidler JP, Giordano TJ, Biddinger PW and Nikiforov YE: Correlation
between genetic alterations and microscopic features, clinical
manifestations, and prognostic characteristics of thyroid papillary
carcinomas. Am J Surg Pathol. 30:216–222. 2006. View Article : Google Scholar : PubMed/NCBI
|
|
7
|
Greco A, Miranda C and Pierotti MA:
Rearrangements of NTRK1 gene in papillary thyroid carcinoma. Mol
Cell Endocrinol. 321:44–49. 2010. View Article : Google Scholar : PubMed/NCBI
|
|
8
|
Ellis RJ, Wang Y, Stevenson HS, Boufraqech
M, Patel D, Nilubol N, Davis S, Edelman DC, Merino MJ, He M, et al:
Genome-wide methylation patterns in papillary thyroid cancer are
distinct based on histological subtype and tumor genotype. J Clin
Endocrinol Metab. 99:E329–E337. 2014. View Article : Google Scholar : PubMed/NCBI
|
|
9
|
Saji M and Ringel MD: The PI3K-Akt-mTOR
pathway in initiation and progression of thyroid tumors. Mol Cell
Endocrinol. 321:20–28. 2010. View Article : Google Scholar : PubMed/NCBI
|
|
10
|
Xing M: Molecular pathogenesis and
mechanisms of thyroid cancer. Nat Rev Cancer. 13:184–199. 2013.
View Article : Google Scholar : PubMed/NCBI
|
|
11
|
Li X, Abdel-Mageed AB, Mondal D and Kandil
E: The nuclear factor kappa-B signaling pathway as a therapeutic
target against thyroid cancers. Thyroid. 23:209–218. 2013.
View Article : Google Scholar : PubMed/NCBI
|
|
12
|
Bauerle KT, Schweppe RE, Lund G, Kotnis G,
Deep G, Agarwal R, Pozdeyev N, Wood WM and Haugen BR: Nuclear
factor κB-dependent regulation of angiogenesis, and metastasis in
an in vivo model of thyroid cancer is associated with secreted
interleukin-8. J Clin Endocrinol Metab. 99:E1436–E1444. 2014.
View Article : Google Scholar : PubMed/NCBI
|
|
13
|
Clevers H and Nusse R: Wnt/β-catenin
signaling and disease. Cell. 149:1192–1205. 2012. View Article : Google Scholar : PubMed/NCBI
|
|
14
|
Agrawal N, Akbani R, Aksoy BA, Ally A,
Arachchi H, Asa SL, Auman JT, Balasundaram M, Balu S, Baylin SB, et
al: Cancer Genome Atlas Research Network: Integrated genomic
characterization of papillary thyroid carcinoma. Cell. 159:676–690.
2014. View Article : Google Scholar : PubMed/NCBI
|
|
15
|
Chin CH, Chen SH, Wu HH, Ho CW, Ko MT and
Lin CY: cytoHubba: Identifying hub objects and sub-networks from
complex interactome. BMC Syst Biol. 8 Suppl 4:S112014. View Article : Google Scholar : PubMed/NCBI
|
|
16
|
Barrett T, Wilhite SE, Ledoux P,
Evangelista C, Kim IF, Tomashevsky M, Marshall KA, Phillippy KH,
Sherman PM, Holko M, et al: NCBI GEO: Archive for functional
genomics data sets - update. Nucleic Acids Res. 41D:D991–D995.
2013.
|
|
17
|
Franceschini A, Szklarczyk D, Frankild S,
Kuhn M, Simonovic M, Roth A, Lin J, Minguez P, Bork P, von Mering
C, et al: STRING v9.1: Protein-protein interaction networks, with
increased coverage and integration. Nucleic Acids Res.
41D:D808–D815. 2013.
|
|
18
|
Shannon P, Markiel A, Ozier O, Baliga NS,
Wang JT, Ramage D, Amin N, Schwikowski B and Ideker T: Cytoscape: A
software environment for integrated models of biomolecular
interaction networks. Genome Res. 13:2498–2504. 2003. View Article : Google Scholar : PubMed/NCBI
|
|
19
|
Liu Z, Gao Y, Hao F, Lou X, Zhang X, Li Y,
Wu D, Xiao T, Yang L, Li Q, et al: Secretomes are a potential
source of molecular targets for cancer therapies and indicate that
APOE is a candidate biomarker for lung adenocarcinoma metastasis.
Mol Biol Rep. 41:7507–7523. 2014. View Article : Google Scholar : PubMed/NCBI
|
|
20
|
Su WP, Chen YT, Lai WW, Lin CC, Yan JJ and
Su WC: Apolipoprotein E expression promotes lung adenocarcinoma
proliferation and migration and as a potential survival marker in
lung cancer. Lung Cancer. 71:28–33. 2011. View Article : Google Scholar : PubMed/NCBI
|
|
21
|
Boylan KL, Andersen JD, Anderson LB,
Higgins L and Skubitz AP: Quantitative proteomic analysis by
iTRAQ(R) for the identification of candidate biomarkers in ovarian
cancer serum. Proteome Sci. 8:312010. View Article : Google Scholar : PubMed/NCBI
|
|
22
|
Chen EC, Karl TA, Kalisky T, Gupta SK,
O'Brien CA, Longacre TA, van de Rijn M, Quake SR, Clarke MF and
Rothenberg ME: KIT signaling promotes growth of colon xenograft
tumors in mice and is up-regulated in a subset of human colon
cancers. Gastroenterology. 149:705–17.e2. 2015. View Article : Google Scholar : PubMed/NCBI
|
|
23
|
Joensuu H, Rutkowski P, Nishida T, Steigen
SE, Brabec P, Plank L, Nilsson B, Braconi C, Bordoni A, Magnusson
MK, et al: KIT and PDGFRA mutations and the risk of GI stromal
tumor recurrence. J Clin Oncol. 33:634–642. 2015. View Article : Google Scholar : PubMed/NCBI
|
|
24
|
Gavert N, Shvab A, Sheffer M, Ben-Shmuel
A, Haase G, Bakos E, Domany E and Ben-Ze'ev A: c-Kit is suppressed
in human colon cancer tissue and contributes to L1-mediated
metastasis. Cancer Res. 73:5754–5763. 2013. View Article : Google Scholar : PubMed/NCBI
|
|
25
|
Mainetti LE, Zhe X, Diedrich J, Saliganan
AD, Cho WJ, Cher ML, Heath E, Fridman R, Kim HR and Bonfil RD:
Bone-induced c-kit expression in prostate cancer: A driver of
intraosseous tumor growth. Int J Cancer. 136:11–20. 2015.
View Article : Google Scholar : PubMed/NCBI
|
|
26
|
Panebianco F, Mazzanti C, Tomei S, Aretini
P, Franceschi S, Lessi F, Di Coscio G, Bevilacqua G and Marchetti
I: The combination of four molecular markers improves thyroid
cancer cytologic diagnosis and patient management. BMC Cancer.
15:9182015. View Article : Google Scholar : PubMed/NCBI
|
|
27
|
Pusztaszeri MP, Sadow PM and Faquin WC:
CD117: A novel ancillary marker for papillary thyroid carcinoma in
fine-needle aspiration biopsies. Cancer Cytopathol. 122:596–603.
2014. View Article : Google Scholar : PubMed/NCBI
|
|
28
|
Trimboli P, Virili C, Romanelli F,
Crescenzi A and Giovanella L: Galectin-3 performance in histologic
a cytologic assessment of thyroid nodules: A systematic review and
meta-analysis. Int J Mol Sci. 18:182017. View Article : Google Scholar
|
|
29
|
Xing M, Haugen BR and Schlumberger M:
Progress in molecular-based management of differentiated thyroid
cancer. Lancet. 381:1058–1069. 2013. View Article : Google Scholar : PubMed/NCBI
|
|
30
|
Owens TW, Rogers RL, Best S, Ledger A,
Mooney AM, Ferguson A, Shore P, Swarbrick A, Ormandy CJ, Simpson
PT, et al: Runx2 is a novel regulator of mammary epithelial cell
fate in development and breast cancer. Cancer Res. 74:5277–5286.
2014. View Article : Google Scholar : PubMed/NCBI
|
|
31
|
Sase T, Suzuki T, Miura K, Shiiba K, Sato
I, Nakamura Y, Takagi K, Onodera Y, Miki Y, Watanabe M, et al:
Runt-related transcription factor 2 in human colon carcinoma: A
potent prognostic factor associated with estrogen receptor. Int J
Cancer. 131:2284–2293. 2012. View Article : Google Scholar : PubMed/NCBI
|
|
32
|
Boregowda RK, Olabisi OO, Abushahba W,
Jeong BS, Haenssen KK, Chen W, Chekmareva M, Lasfar A, Foran DJ,
Goydos JS, et al: RUNX2 is overexpressed in melanoma cells and
mediates their migration and invasion. Cancer Lett. 348:61–70.
2014. View Article : Google Scholar : PubMed/NCBI
|
|
33
|
Ge C, Zhao G, Li Y, Li H, Zhao X, Pannone
G, Bufo P, Santoro A, Sanguedolce F, Tortorella S, et al: Role of
Runx2 phosphorylation in prostate cancer and association with
metastatic disease. Oncogene. 35:366–376. 2016. View Article : Google Scholar : PubMed/NCBI
|
|
34
|
Pratap J, Lian JB and Stein GS: Metastatic
bone disease: Role of transcription factors and future targets.
Bone. 48:30–36. 2011. View Article : Google Scholar : PubMed/NCBI
|
|
35
|
Sancisi V, Gandolfi G, Ambrosetti DC and
Ciarrocchi A: Histone deacetylase inhibitors repress tumoral
expression of the proinvasive factor RUNX2. Cancer Res.
75:1868–1882. 2015. View Article : Google Scholar : PubMed/NCBI
|
|
36
|
Sancisi V, Borettini G, Maramotti S,
Ragazzi M, Tamagnini I, Nicoli D, Piana S and Ciarrocchi A: Runx2
isoform I controls a panel of proinvasive genes driving
aggressiveness of papillary thyroid carcinomas. J Clin Endocrinol
Metab. 97:E2006–E2015. 2012. View Article : Google Scholar : PubMed/NCBI
|
|
37
|
Dalle Carbonare L, Frigo A, Francia G,
Davì MV, Donatelli L, Stranieri C, Brazzarola P, Zatelli MC,
Menestrina F and Valenti MT: Runx2 mRNA expression in the tissue,
serum, and circulating non-hematopoietic cells of patients with
thyroid cancer. J Clin Endocrinol Metab. 97:E1249–E1256. 2012.
View Article : Google Scholar : PubMed/NCBI
|
|
38
|
Kaptan E, Bas Sancar S, Sancakli A, Aktas
HG, Bayrak BB, Yanardag R and Bolkent S: Runt-related transcription
factor 2 (Runx2) Is responsible for galectin-3 overexpression in
human thyroid carcinoma. J Cell Biochem. 118:3911–3919. 2017.
View Article : Google Scholar : PubMed/NCBI
|
|
39
|
Carr FE, Tai PW, Barnum MS, Gillis NE,
Evans KG, Taber TH, White JH, Tomczak JA, Jaworski DM, Zaidi SK, et
al: Thyroid hormone receptor-β (TRβ) mediates runt-related
transcription factor 2 (Runx2) expression in thyroid cancer cells:
A novel signaling pathway in thyroid cancer. Endocrinology.
157:3278–3292. 2016. View Article : Google Scholar : PubMed/NCBI
|
|
40
|
Bian Y, Terse A, Du J, Hall B, Molinolo A,
Zhang P, Chen W, Flanders KC, Gutkind JS, Wakefield LM, et al:
Progressive tumor formation in mice with conditional deletion of
TGF-beta signaling in head and neck epithelia is associated with
activation of the PI3K/Akt pathway. Cancer Res. 69:5918–5926. 2009.
View Article : Google Scholar : PubMed/NCBI
|
|
41
|
Wu T, Chen X, Peng R, Liu H, Yin P, Peng
H, Zhou Y, Sun Y, Wen L, Yi H, et al: Let-7a suppresses cell
proliferation via the TGF-β/SMAD signaling pathway in cervical
cancer. Oncol Rep. 36:3275–3282. 2016. View Article : Google Scholar : PubMed/NCBI
|
|
42
|
He J, Jin Y, Zhou M, Li X, Chen W, Wang Y,
Gu S, Cao Y, Chu C, Liu X and Zou Q: Solute carrier family 35
member F2 is indispensable for papillary thyroid carcinoma
progression through activation of transforming growth factor-β type
I receptor/apoptosis signal-regulating kinase 1/mitogen-activated
protein kinase signaling axis. Cancer Sci. 109:642–655. 2018.
View Article : Google Scholar : PubMed/NCBI
|
|
43
|
Zha J and Lackner MR: Targeting the
insulin-like growth factor receptor-1R pathway for cancer therapy.
Clin Cancer Res. 16:2512–2517. 2010. View Article : Google Scholar : PubMed/NCBI
|
|
44
|
Wang G, Pan J, Zhang L, Wei Y and Wang C:
Long non-coding RNA CRNDE sponges miR-384 to promote proliferation
and metastasis of pancreatic cancer cells through upregulating
IRS1. Cell Prolif. 50:502017. View Article : Google Scholar
|
|
45
|
Bailey KL, Agarwal E, Chowdhury S, Luo J,
Brattain MG, Black JD and Wang J: TGFβ/Smad3 regulates
proliferation and apoptosis through IRS-1 inhibition in colon
cancer cells. PLoS One. 12:e01760962017. View Article : Google Scholar : PubMed/NCBI
|
|
46
|
Luo X, Fan S, Huang W, Zhai S, Ma Z, Li P,
Sun SY and Wang X: Downregulation of IRS-1 promotes metastasis of
head and neck squamous cell carcinoma. Oncol Rep. 28:659–667. 2012.
View Article : Google Scholar : PubMed/NCBI
|
|
47
|
Houghton AM, Rzymkiewicz DM, Ji H, Gregory
AD, Egea EE, Metz HE, Stolz DB, Land SR, Marconcini LA, Kliment CR,
et al: Neutrophil elastase-mediated degradation of IRS-1
accelerates lung tumor growth. Nat Med. 16:219–223. 2010.
View Article : Google Scholar : PubMed/NCBI
|
|
48
|
Wang Y, Zhang X, Zou C, Kung HF, Lin MC,
Dress A, Wardle F, Jiang BH and Lai L: miR-195 inhibits tumor
growth and angiogenesis through modulating IRS1 in breast cancer.
Biomed Pharmacother. 80:95–101. 2016. View Article : Google Scholar : PubMed/NCBI
|
|
49
|
Ma Z, Gibson SL, Byrne MA, Zhang J, White
MF and Shaw LM: Suppression of insulin receptor substrate 1 (IRS-1)
promotes mammary tumor metastasis. Mol Cell Biol. 26:9338–9351.
2006. View Article : Google Scholar : PubMed/NCBI
|
|
50
|
Shi J, Wang DM, Wang CM, Hu Y, Liu AH,
Zhang YL, Sun B and Song JG: Insulin receptor substrate-1
suppresses transforming growth factor-beta1-mediated
epithelial-mesenchymal transition. Cancer Res. 69:7180–7187. 2009.
View Article : Google Scholar : PubMed/NCBI
|
|
51
|
Vasiljeva O, Reinheckel T, Peters C, Turk
D, Turk V and Turk B: Emerging roles of cysteine cathepsins in
disease and their potential as drug targets. Curr Pharm Des.
13:387–403. 2007. View Article : Google Scholar : PubMed/NCBI
|
|
52
|
Clark AK, Yip PK, Grist J, Gentry C,
Staniland AA, Marchand F, Dehvari M, Wotherspoon G, Winter J, Ullah
J, et al: Inhibition of spinal microglial cathepsin S for the
reversal of neuropathic pain. Proc Natl Acad Sci USA.
104:10655–10660. 2007. View Article : Google Scholar : PubMed/NCBI
|
|
53
|
Dennemärker J, Lohmüller T, Müller S,
Aguilar SV, Tobin DJ, Peters C and Reinheckel T: Impaired turnover
of autophagolysosomes in cathepsin L deficiency. Biol Chem.
391:913–922. 2010. View Article : Google Scholar : PubMed/NCBI
|
|
54
|
Pan L, Li Y, Jia L, Qin Y, Qi G, Cheng J,
Qi Y, Li H and Du J: Cathepsin S deficiency results in abnormal
accumulation of autophagosomes in macrophages and enhances Ang
II-induced cardiac inflammation. PLoS One. 7:e353152012. View Article : Google Scholar : PubMed/NCBI
|
|
55
|
Yin M, Soikkeli J, Jahkola T, Virolainen
S, Saksela O and Hölttä E: TGF-β signaling, activated stromal
fibroblasts, and cysteine cathepsins B and L drive the invasive
growth of human melanoma cells. Am J Pathol. 181:2202–2216. 2012.
View Article : Google Scholar : PubMed/NCBI
|
|
56
|
Olson OC and Joyce JA: Cysteine cathepsin
proteases: Regulators of cancer progression and therapeutic
response. Nat Rev Cancer. 15:712–729. 2015. View Article : Google Scholar : PubMed/NCBI
|
|
57
|
Chen KL, Chang WS, Cheung CH, Lin CC,
Huang CC, Yang YN, Kuo CP, Kuo CC, Chang YH, Liu KJ, et al:
Targeting cathepsin S induces tumor cell autophagy via the EGFR-ERK
signaling pathway. Cancer Lett. 317:89–98. 2012. View Article : Google Scholar : PubMed/NCBI
|
|
58
|
Gormley JA, Hegarty SM, O'Grady A,
Stevenson MR, Burden RE, Barrett HL, Scott CJ, Johnston JA, Wilson
RH, Kay EW, et al: The role of Cathepsin S as a marker of prognosis
and predictor of chemotherapy benefit in adjuvant CRC: A pilot
study. Br J Cancer. 105:1487–1494. 2011. View Article : Google Scholar : PubMed/NCBI
|
|
59
|
Small DM, Burden RE, Jaworski J, Hegarty
SM, Spence S, Burrows JF, McFarlane C, Kissenpfennig A, McCarthy
HO, Johnston JA, et al: Cathepsin S from both tumor and
tumor-associated cells promote cancer growth and
neovascularization. Int J Cancer. 133:2102–2112. 2013. View Article : Google Scholar : PubMed/NCBI
|
|
60
|
Yang M, Liu J, Shao J, Qin Y, Ji Q, Zhang
X and Du J: Cathepsin S-mediated autophagic flux in
tumor-associated macrophages accelerate tumor development by
promoting M2 polarization. Mol Cancer. 13:432014. View Article : Google Scholar : PubMed/NCBI
|
|
61
|
Sage J, Mallèvre F, Barbarin-Costes F,
Samsonov SA, Gehrcke JP, Pisabarro MT, Perrier E, Schnebert S,
Roget A, Livache T, et al: Binding of chondroitin 4-sulfate to
cathepsin S regulates its enzymatic activity. Biochemistry.
52:6487–6498. 2013. View Article : Google Scholar : PubMed/NCBI
|
|
62
|
Shi GP, Webb AC, Foster KE, Knoll JH,
Lemere CA, Munger JS and Chapman HA: Human cathepsin S: Chromosomal
localization, gene structure, and tissue distribution. J Biol Chem.
269:11530–11536. 1994.PubMed/NCBI
|
|
63
|
Jordans S, Jenko-Kokalj S, Kühl NM,
Tedelind S, Sendt W, Brömme D, Turk D and Brix K: Monitoring
compartment-specific substrate cleavage by cathepsins B, K, L, and
S at physiological pH and redox conditions. BMC Biochem. 10:232009.
View Article : Google Scholar : PubMed/NCBI
|
|
64
|
Burden RE, Gormley JA, Kuehn D, Ward C,
Kwok HF, Gazdoiu M, McClurg A, Jaquin TJ, Johnston JA, Scott CJ, et
al: Inhibition of Cathepsin S by Fsn0503 enhances the efficacy of
chemotherapy in colorectal carcinomas. Biochimie. 94:487–493. 2012.
View Article : Google Scholar : PubMed/NCBI
|
|
65
|
Liu WL, Liu D, Cheng K, Liu YJ, Xing S,
Chi PD, Liu XH, Xue N, Lai YZ, Guo L, et al: Evaluating the
diagnostic and prognostic value of circulating cathepsin S in
gastric cancer. Oncotarget. 7:28124–28138. 2016.PubMed/NCBI
|
|
66
|
Lindahl C, Simonsson M, Bergh A, Thysell
E, Antti H, Sund M and Wikström P: Increased levels of
macrophage-secreted cathepsin S during prostate cancer progression
in TRAMP mice and patients. Cancer Genomics Proteomics. 6:149–159.
2009.PubMed/NCBI
|
|
67
|
Wang X, Xiong L, Yu G, Li D, Peng T, Luo D
and Xu J: Cathepsin S silencing induces apoptosis of human
hepatocellular carcinoma cells. Am J Transl Res. 7:100–110.
2015.PubMed/NCBI
|
|
68
|
Gole B, Huszthy PC, Popović M, Jeruc J,
Ardebili YS, Bjerkvig R and Lah TT: The regulation of cysteine
cathepsins and cystatins in human gliomas. Int J Cancer.
131:1779–1789. 2012. View Article : Google Scholar : PubMed/NCBI
|
|
69
|
Gautam J, Bae YK and Kim JA: Up-regulation
of cathepsin S expression by HSP90 and 5-HT7 receptor-dependent
serotonin signaling correlates with triple negativity of human
breast cancer. Breast Cancer Res Treat. 161:29–40. 2017. View Article : Google Scholar : PubMed/NCBI
|
|
70
|
Kondo T, Ezzat S and Asa SL: Pathogenetic
mechanisms in thyroid follicular-cell neoplasia. Nat Rev Cancer.
6:292–306. 2006. View Article : Google Scholar : PubMed/NCBI
|
|
71
|
Flannery T, McQuaid S, McGoohan C,
McConnell RS, McGregor G, Mirakhur M, Hamilton P, Diamond J, Cran
G, Walker B, et al: Cathepsin S expression: An independent
prognostic factor in glioblastoma tumours - A pilot study. Int J
Cancer. 119:854–860. 2006. View Article : Google Scholar : PubMed/NCBI
|
|
72
|
Kos J, Sekirnik A, Kopitar G, Cimerman N,
Kayser K, Stremmer A, Fiehn W and Werle B: Cathepsin S in tumours,
regional lymph nodes and sera of patients with lung cancer:
Relation to prognosis. Br J Cancer. 85:1193–1200. 2001. View Article : Google Scholar : PubMed/NCBI
|