Introduction
Acute myeloid leukemia (AML) is characterized by
malignant proliferation of hematopoietic cells of myeloid lineage.
AML has poor prognosis and effective treatments are still lacking
despite rigorous research efforts. For AML patients receiving
initial treatment, the remission rate can reach as high as 80%
after receiving normal chemotherapy, however for some patients, AML
will reoccur (1), and the recurrent
AML has a poorer prognosis (2).
Accurate diagnosis and treatment requires cytogenetics as a
prediction tool, and gene overexpression and silencing may provide
necessary information.
The suppressor of cytokine signaling-1 (SOCS1) gene,
a tumor suppressor gene, belongs to the suppressor of cytokine
signaling (SOCS) family. SOCS1 negatively regulates cytokines via
the JAK/STAT3 pathway by a negative feedback loop. The SOCS1 gene
in humans is located on 16p13.3 and codes for a protein with 221
amino acids. Numerous studies have ascertained that the promoter of
SOCS1 is located on the CpG island of the 5′-end this gene, and its
abnormal methylation can result in silencing of SOCS1 expression
(3). Silencing of SOCS1 expression
is associated with carcinogenesis, especially in malignant tumors
and proliferative diseases of the hematopoietic system (4).
SOCS1 suppresses the JAK2/STAT signaling pathway to
negatively control the expression of cytokines (5) by several mechanisms. SOCS1 combined
with phosphorylated tyrosine in the SH2 region blocks activation of
JAK2 and transduction of cell signaling (6). Furthermore, the KIR region upstream of
the SH2 region can directly act on JAK2 kinase to inhibit binding
of the kinase with the substrate, thereby suppressing its activity.
In addition, an E3 ubiquitin ligase complex can be formed in the
SOCS-Box region at the SOCS1 C-terminal to cause proteasomal
degradation of cytokine signal transduction proteins including JAK2
(7). In the present study, we
investigated the status of SOCS1 expression in AML patients and the
relationship between SOCS1 silencing resulting from methylation and
AML occurrence and development.
Materials and methods
Patients
Between February 2015 and October 2017, samples from
110 patients diagnosed with AML and 10 normal controls were
obtained from the Department of Hematology at The Second Hospital
of Hebei Medical University. Patient clinical characteristics are
shown in Table I.
 | Table I.Characteristics of patients. |
Table I.
Characteristics of patients.
| Variables | IT | RR | RE | NC |
|---|
| Male/female
(n/n) | 22/28 | 8/2 | 21/29 | 5/5 |
| Median age
(range) | 48.4 (19–67) | 45.3 (17–66) | 34.8 (22–64) | 50 (19–66) |
The initial treatment group (IT) included patients
who were initially diagnosed, but did not receive any treatment.
Patients in the relapsed/refractory group (RR) relapsed after a
complete remission or were not yet relieved after treatment of two
courses. Patients in the remission group (RE) included those who
were fully relieved after treatment. Patients in the normal control
group (NC) included those who were healthy or with nutritional
anemia. The diagnosis and classification of AML was performed
according to French-American-British (FAB) criteria, and included
M0 (2 patients), M1 (9 patients),
M2 (50 patients), M4 (36 patients) and
M5 (13 patients).
The research specimens were studied from bone marrow
cells which were isolated by lymphocyte separation. This study was
approved by the Ethics Committee of Hebei Medical University and
written informed consent was obtained from each patient.
Cell lines
Human AML cell lines U937 and THP-1 were purchased
from the American Type Culture Collection (ATCC; Manassas, VA,
USA). U937 and THP-1 cells were cultured in RPMI-1640 medium
(Gibco; Thermo Fisher Scientific, Inc., Waltham, MA, USA),
supplemented with 10% fetal bovine serum (FBS; Clark Bioscience,
Claymont, DE, USA) and incubated at 37°C in a humidified atmosphere
of 5% CO2 in air.
Cell viability and apoptosis
assay
Cell viability was assessed by Cell Counting Kit-8
(CCK-8; Beijing Zoman Biotechnology Co., Ltd., Beijing, China)
according to the manufacturer's instructions. U937 and THP-1 cells
were plated in 96-well plates at a density of 1×10⁴
cells/well to investigate the proliferation curves and viability
curves effected by 5-azacytidine (5-azaC) and 5-aza-2-deoxycytidine
(5-aza-dC; both from Sigma-Aldrich; Merck, St. Louis, MO, USA) for
48 h. The cell medium was changed every day. The absorbance at a
wavelength of 450 nm was assessed using a microplate reader
(Molecular Devices Co., Sunnyvale, CA, USA). The assay was
performed in triplicate wells and each experiment was repeated
three times.
The apoptosis of treated and transfected cells was
determined using the FITC Annexin V Apoptosis Detection kit (BD
Biosciences, San Jose, CA, USA). The treatment concentrations of
5-azaC and 5-aza-dC in U937 cells were 1, 2, 5 and 10 µmol/l
respectively, and those in THP-1 were 10, 20, 50 and 100 µmol/l,
respectively. Data were analyzed using BD FACSDiva software v6.1.3
(BD Biosciences, San Jose, CA, USA).
Real-time PCR
Total RNA from bone marrow mononuclear cells and AML
cell lines was isolated using RNeasy mini kit (Qiagen Inc.,
Valencia, CA, USA). cDNA was synthesized from RNA using The
RevertAid™ First Strand cDNA Synthesis kit (Thermo Fisher
Scientific, Inc.). PCR was performed using the SuperReall PreMix
Plus (SYBR-Green) (Tiangen Biotech Co. Ltd., Beijing, China). PCR
was carried out by heating at 95°C for 10 min, followed by 40
cycles at 95°C for 10 sec, 60°C for 20 sec, and 72°C for 15 sec,
with a final step for 10 min at 72°C. β-actin was used as an
internal control. The relative gene expression was analyzed by the
2−ΔΔCq method (8)
against the NC group which was used as a control. Values were
normalized to the expression level of β-actin. The primer sequences
are shown in Table II.
| Table II.Primer sequences. |
Table II.
Primer sequences.
| Genes | Primers (5′-3′) | Size (bp) |
|---|
| SOCS-1 | F:
GACGCCTGCGGATTCTAC |
|
|
| R:
AGCGGCCGGCCTGAAAG | 181 |
| DNMT3A | F:
TATTGATGAGCGCACAAGAGAGC |
|
|
| R:
GGGTGTTCCAGGGTAACATTGAC | 111 |
| DNMT3B | F:
GGCAAGTTCTCCGAGGTCTCTG |
|
|
| R:
TGGTACATGGCTTTTCGATAGGA | 113 |
| MECP2 | F:
ACTCCCCAGAATACACCTTGCTT |
|
|
| R:
TGAGGCCCTGGAGGTCCT | 113 |
| MBD2 | F:
AACCCTGCTGTTTGGCTTAAC |
|
|
| R:
CGTACTTGCTGTACTCGCTCTTC | 101 |
| β-actin | F:
GAGCTACGAGCTGCCTGAC |
|
|
| R:
GGTAGTTTCGTGGATGCCACAG | 121 |
| SOCS-1, M-MSP | F:
TTCGCGTGTATTTTTAGGTCGGTC |
|
|
| R:
CGACACAACTCCTACAACGACCG | 160 |
| SOCS-1, U-MSP | F:
TTATGAGTATTTGTGTGTATTTTTAGGTTGGTT |
|
|
| R:
CACTAACAACACAACTCCTACAACAACCA | 175 |
Methylation-specific PCR (MSP)
Extraction and bisulphite modification of genomic
DNA (2 µg) was performed using a DNA extraction kit (Shanghai
Generay Biotech Co. Ltd., Shanghai, China) and the EZ DNA
Methylation-Gold™ kit (Zymo Research Biotech Co.,
Irvine, CA, USA) according to the manufacturer's instructions. The
cycling conditions were: 10 min at 95°C, 40 cycles of 30 sec at
95°C, 40 sec at 58°C, 45 sec at 72°C and 72°C for 10 min. The
original cDNA sequence was checked in the gene pool and the primers
were designed according to a previously published study (9). PCR products were resolved in 2%
agarose gel, stained with ethidium bromide and visualized under UV
illumination.
Western blot analysis
Cells were washed three times with PBS and lysed
with RIPA buffer (BestBio, Shanghai, China). Total proteins (50 µg)
per sample were isolated by 10% SDS-PAGE and then transferred to
polyvinylidene fluoride (PVDF) membranes (Millipore Corp, Billerica
MA, USA). The membranes were probed with antibodies for SOCS1
(1:1,000; cat. no. 3950), t-JAK2 (1:1,000; cat. no. 4040), p-JAK2
(1:1,000; cat. no. 4406), t-STAT3 (1:1,000; cat. no. 9139), p-STAT3
(1:1,000; cat. no. 52075), t-STAT5 (1:1,000; cat. no. 25656),
p-STAT5 (1:1,000; cat. no. 4322) and β-actin (1:2,000; cat no.
3700), and then incubated with anti-rabbit IgG, horseradish
peroxidase (HRP)-linked secondary antibody (1:3,000; cat. no. 3700)
(all from Cell Signaling Technology, Inc., Danvers, MA, USA) for 1
h for chemiluminescent detection. Specific bindings were visualized
with Azure c500 (Azure Biosystems, Dublin, CA, USA).
Cell transfection
Full-length SOCS1 (NM-003745.1) cDNA was synthesized
and cloned into pCMV3-C-GFPSpark vector (Sino Biological Inc.,
Beijing, China). The sequence and orientation of the SOCS1 insert
was confirmed by DNA sequencing. pCMV3-SOCS1-GFPSpark was then
transfected into U937 and THP-1 cells by Lipofectamine 3000 reagent
(1:1 ratio) (Invitrogen; Thermo Fisher Scientific, Inc.). Cells
were incubated for 2 days at 37°C. The empty vector was used as
control.
Statistical analysis
Statistical analysis was performed with SPSS
software (version 21.0; IBM Corp., Armonk, NY, USA). All data are
presented as the mean ± standard deviation (SD). One-way analysis
of variance (ANOVA) with a Fisher's least significant difference
and a Chi-squared were used to compare the data. A P-value of
<0.05 was considered to indicate a statistically significant
difference.
Results
SOCS1 gene mRNA expression and
methylation state in AML groups
We first investigated the mRNA expression of SOCS1
in the four groups of AML patients. We found that SOCS1 gene
expression was significantly lower in the IT and RR groups when
compared to the RE and NC groups (P<0.05) (Fig. 1A). Relative expression of SOCS1 mRNA
in each group was found to be 0.0306±0.0137 for IT, 0.0164±0.0101
for RR, 1.3346±0.4852 for RE and 1.5983±0.3891 for NC. Fold change
differences were compared to NC values. Subsequently, we compared
SOCS1 methylation in the four groups. Methylation of SOCS1 was not
detected in the RE and NC groups, but it was detected in 24 (48%)
IT patients and 8 (80%) RR patients. The frequency of methylation
was significantly higher in the IT, RR groups compared with the RE
and NC group (P<0.05) (Fig. 1B).
Thus, SOCS1 gene methylation was negatively correlated with mRNA
expression.
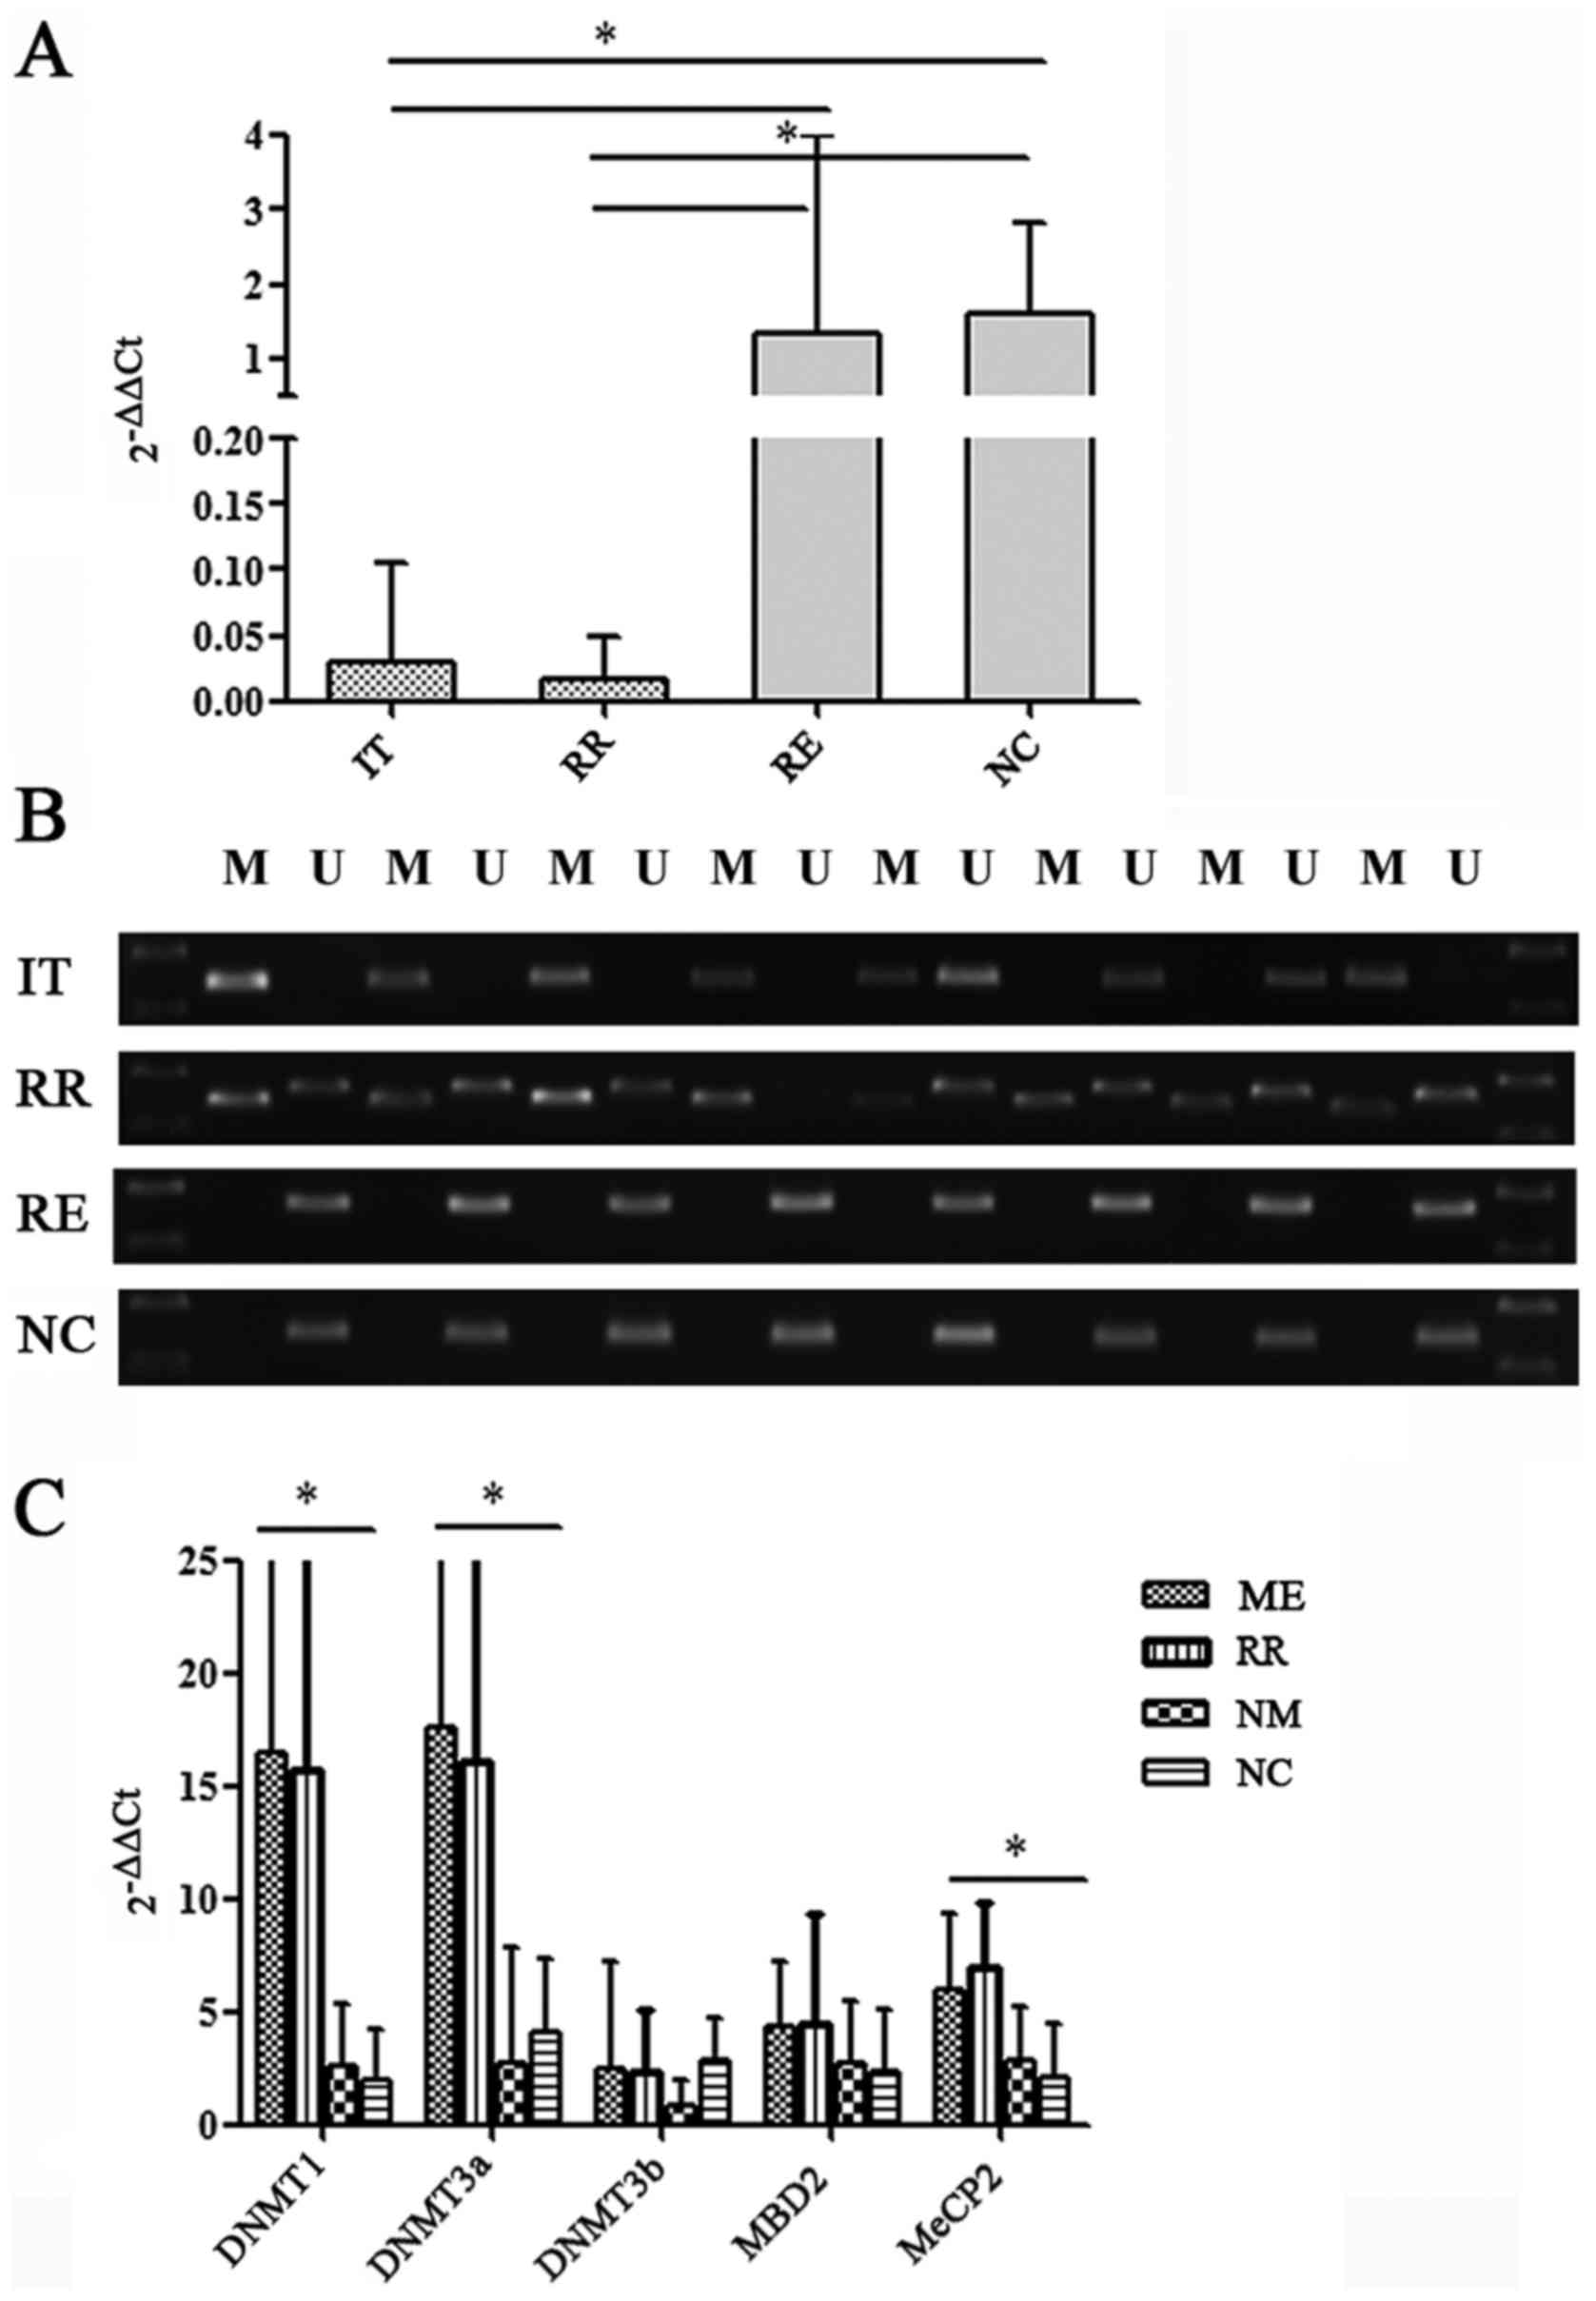 | Figure 1.Relative gene expression of SOCS1 and
SOCS1 methylation-related genes. (A) qPCR results of SOCS1 in IT,
RR, RE and NC groups. Total RNA was extracted from bone marrow
mononuclear cells and gene expression was detected with the qPCR
method. Fold change difference was compared to a normal control
group using the 2−ΔΔCq method. Data represent the mean ±
SD from 50 samples in the IT group, 50 samples in the RE group, 10
samples in the RR group and 10 samples in the NC group. *P<0.05.
(B) SOCS1 gene methylation state. M indicates the methylation
strip, U indicates the non-methylation strip. Eight cases were
randomly selected from the IT, RR, RE and NC groups. (C) Relative
expression of mRNA of SOCS1 methylation-related genes. Gene
expression of DNMT1, DNMT3a and MeCP2 genes. Data is presented as
the mean ± SD and is presented as fold change differences between
ME, NM, RR and NC. *P<0.05. ME, methylation group; NM,
non-methylation group; RR, relapsed/refractory group; RE, remission
group; NC, normal control group. |
Expression of the SOCS1
methylation-related gene
AML patients in the IT group were divided into a
SOCS1 methylation group (ME) (24 cases) and a non-methylation group
(NM) (26 cases) according to the methylation state of the SOCS1
gene. The NC and RR groups included 10 cases. We found that the
mRNA of DNA methyltransferases (DNMTs) such as DNMT1 and DNMT3a in
the SOCS1 ME and RR group was higher than that in the NM and NC
group (P<0.05) (Fig. 1C). There
was no change in the mRNA expression of DNMT3b. In addition, gene
expression of methylated CpG binding protein MeCP2 was higher in
the ME and RR groups than in the NM and NC group (P<0.05). MBD2
in the ME and RR groups was significantly higher than that of the
NM and NC groups, however, the difference was of no statistical
significance (P>0.05).
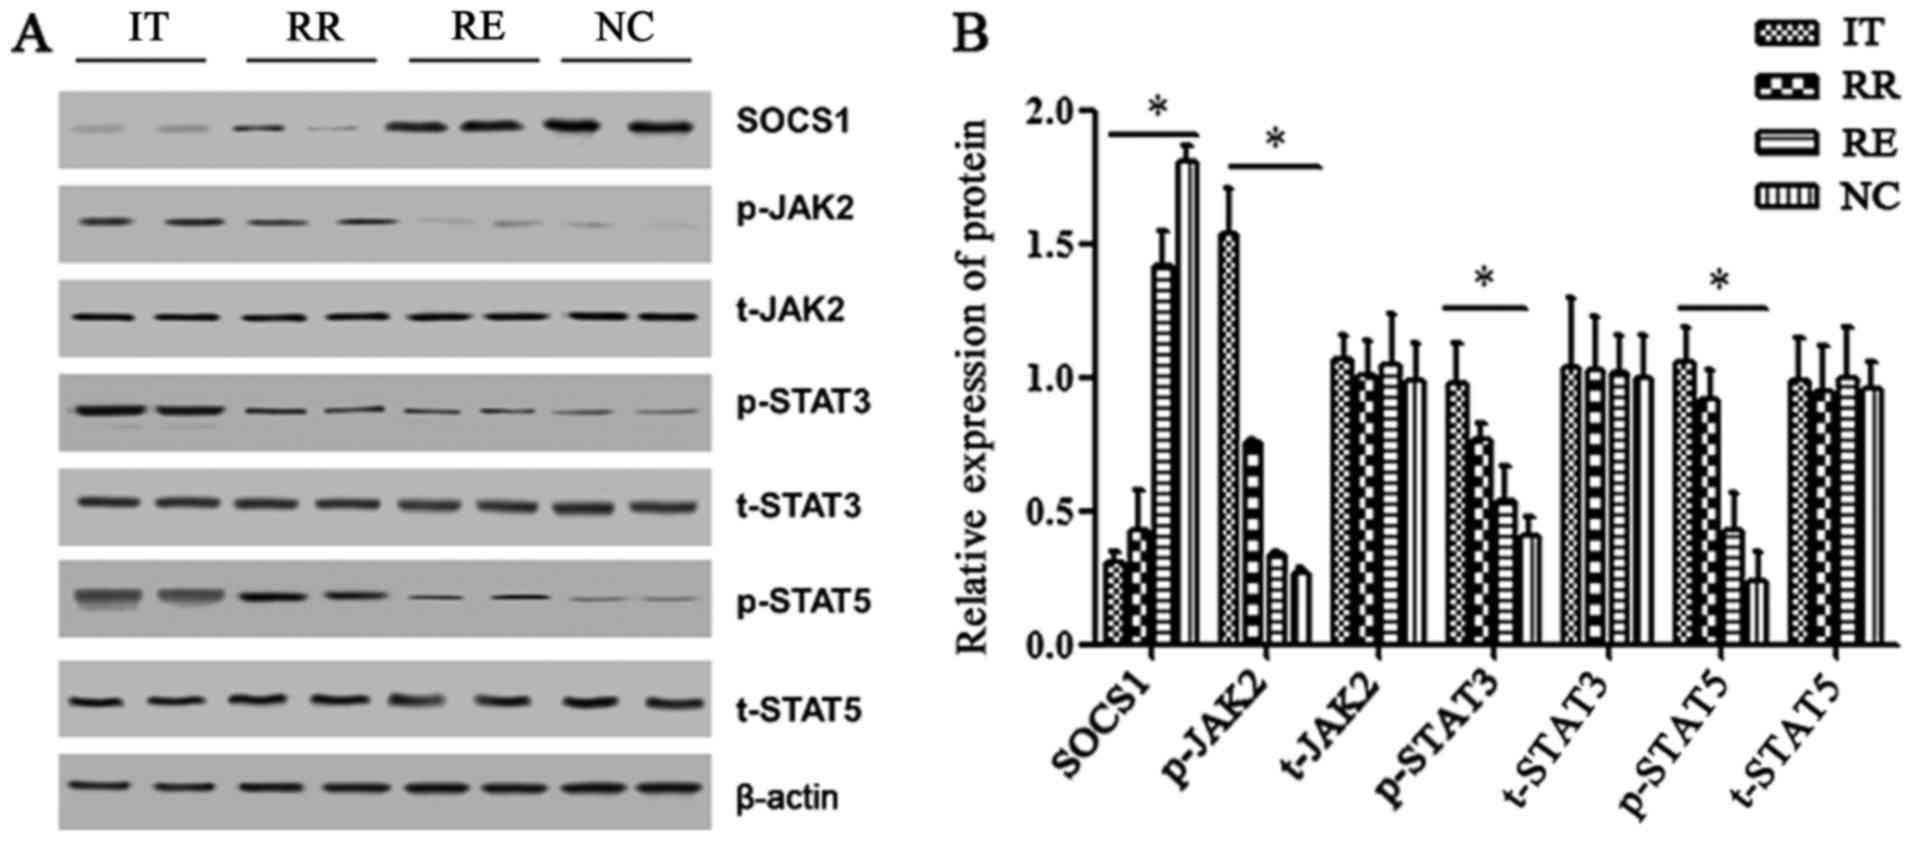
Expression of the SOCS1 protein and
downstream pathway proteins
The relative expression of the SOCS1 protein in the
AML IT and RR groups was significantly lower than that in the RE
and NC groups (P<0.05) (Fig. 2A and
B). In contrast, p-JAK2, p-STAT3 and p-STAT5 expression was
significantly higher in the IT and RR groups (P<0.05) in
comparison to the RE and NC groups. There was no difference in the
expression of t-JAK2, t-STAT3 and t-STAT5 among the four
groups.
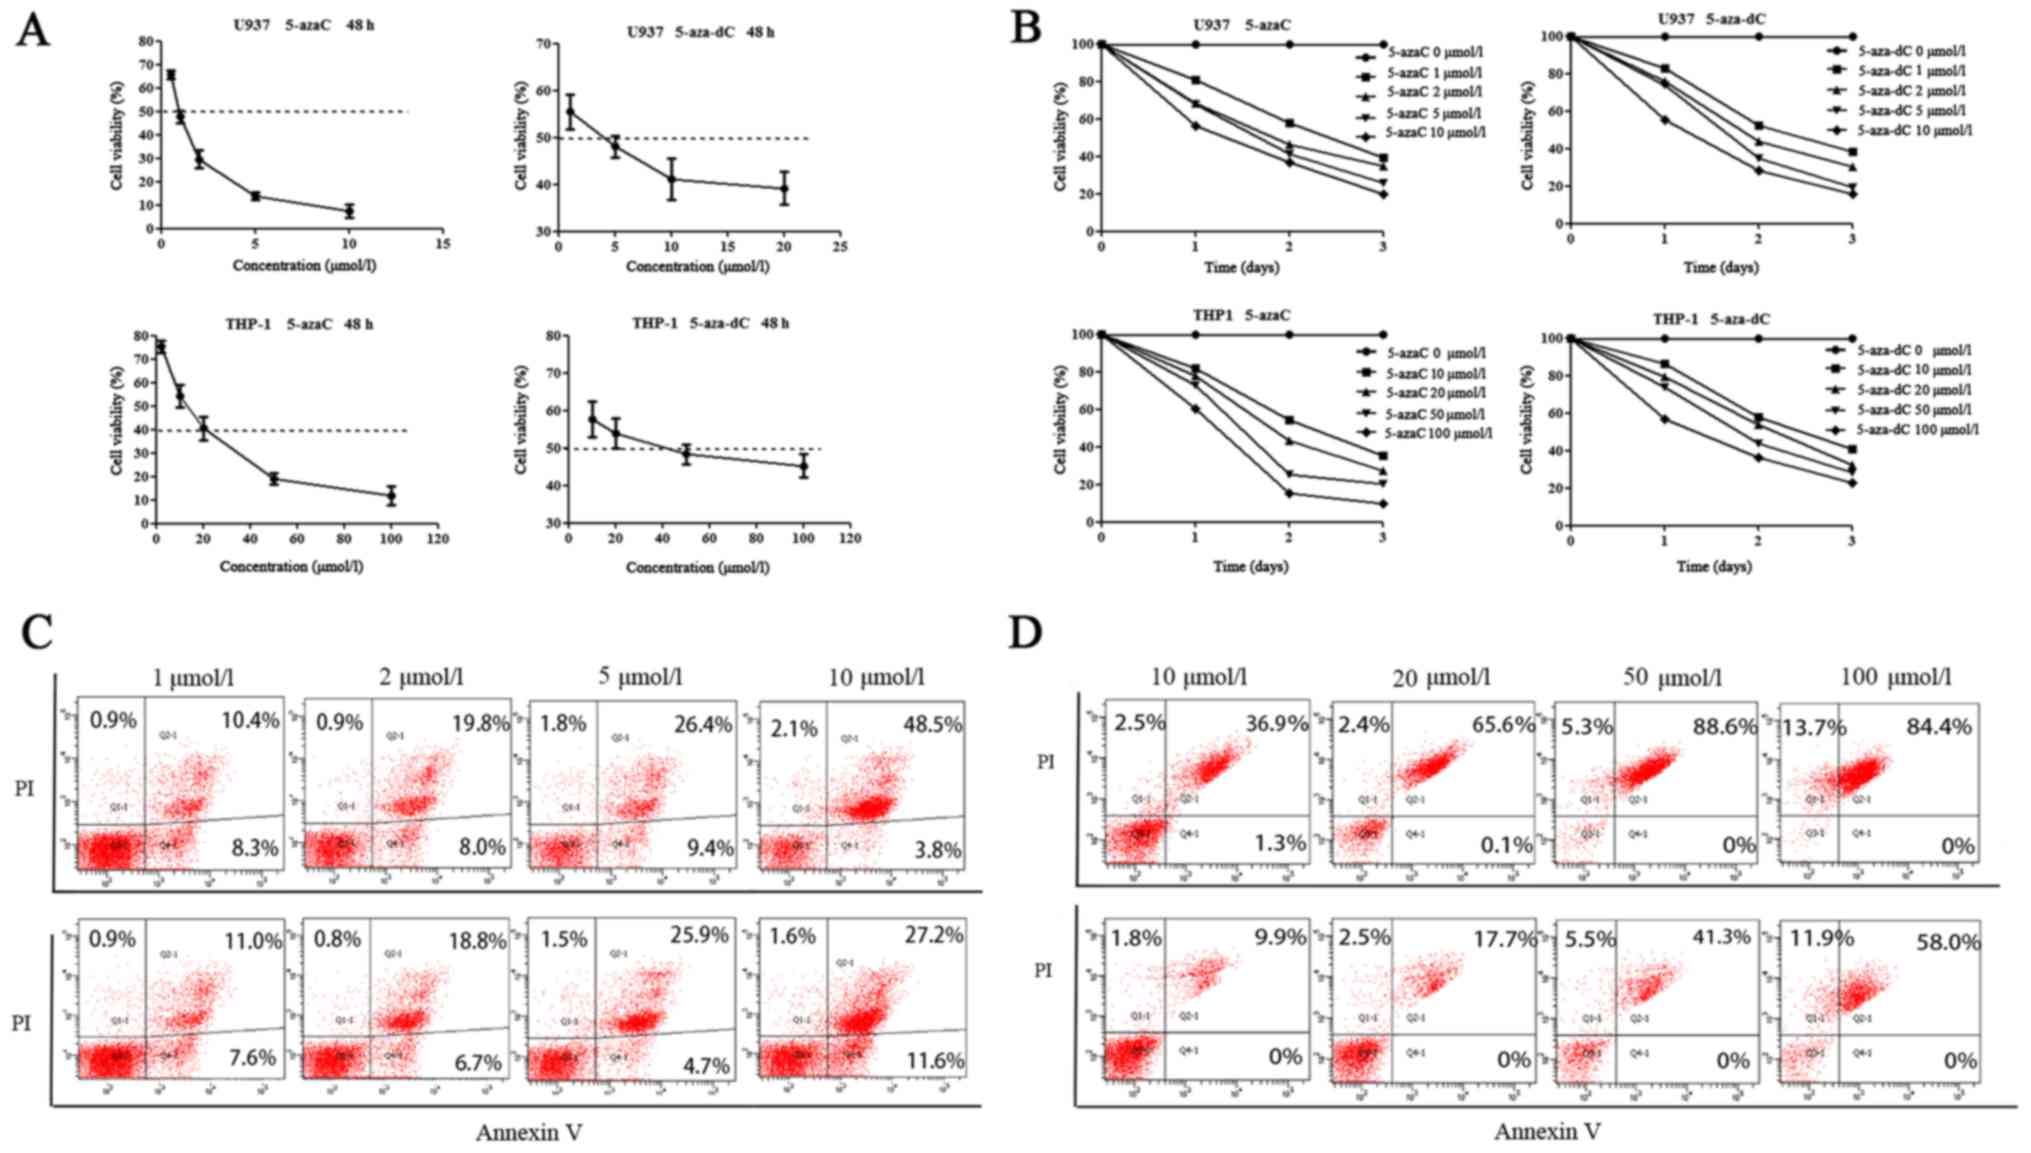
Cell viability and the apoptosis rate
of AML cell lines in response to demethylation drugs
The half maximal inhibitory concentration
(IC50) of 5-azaC on U937 and THP-1 cell lines as
determined by the cell viability assay was found to be 0.95 and
17.05 µmol/l, respectively, and that of 5-aza-dC was 4.79 and 43.55
µmol/l, respectively (Fig. 3A).
With the increase of drug concentration and duration of drug
treatment (time <3 days), the viability of U937 and THP-1 cells
gradually decreased (Fig. 3B).
However, the apoptosis rate of U937 and THP-1 cells gradually
increased with the increase of drug concentration (Fig. 3C and D). The results indicated that
the viability of the two cell lines was negatively associated with
the drug concentration and treatment time, while the apoptosis rate
of the two cell lines was positively associated with the drug
concentration.
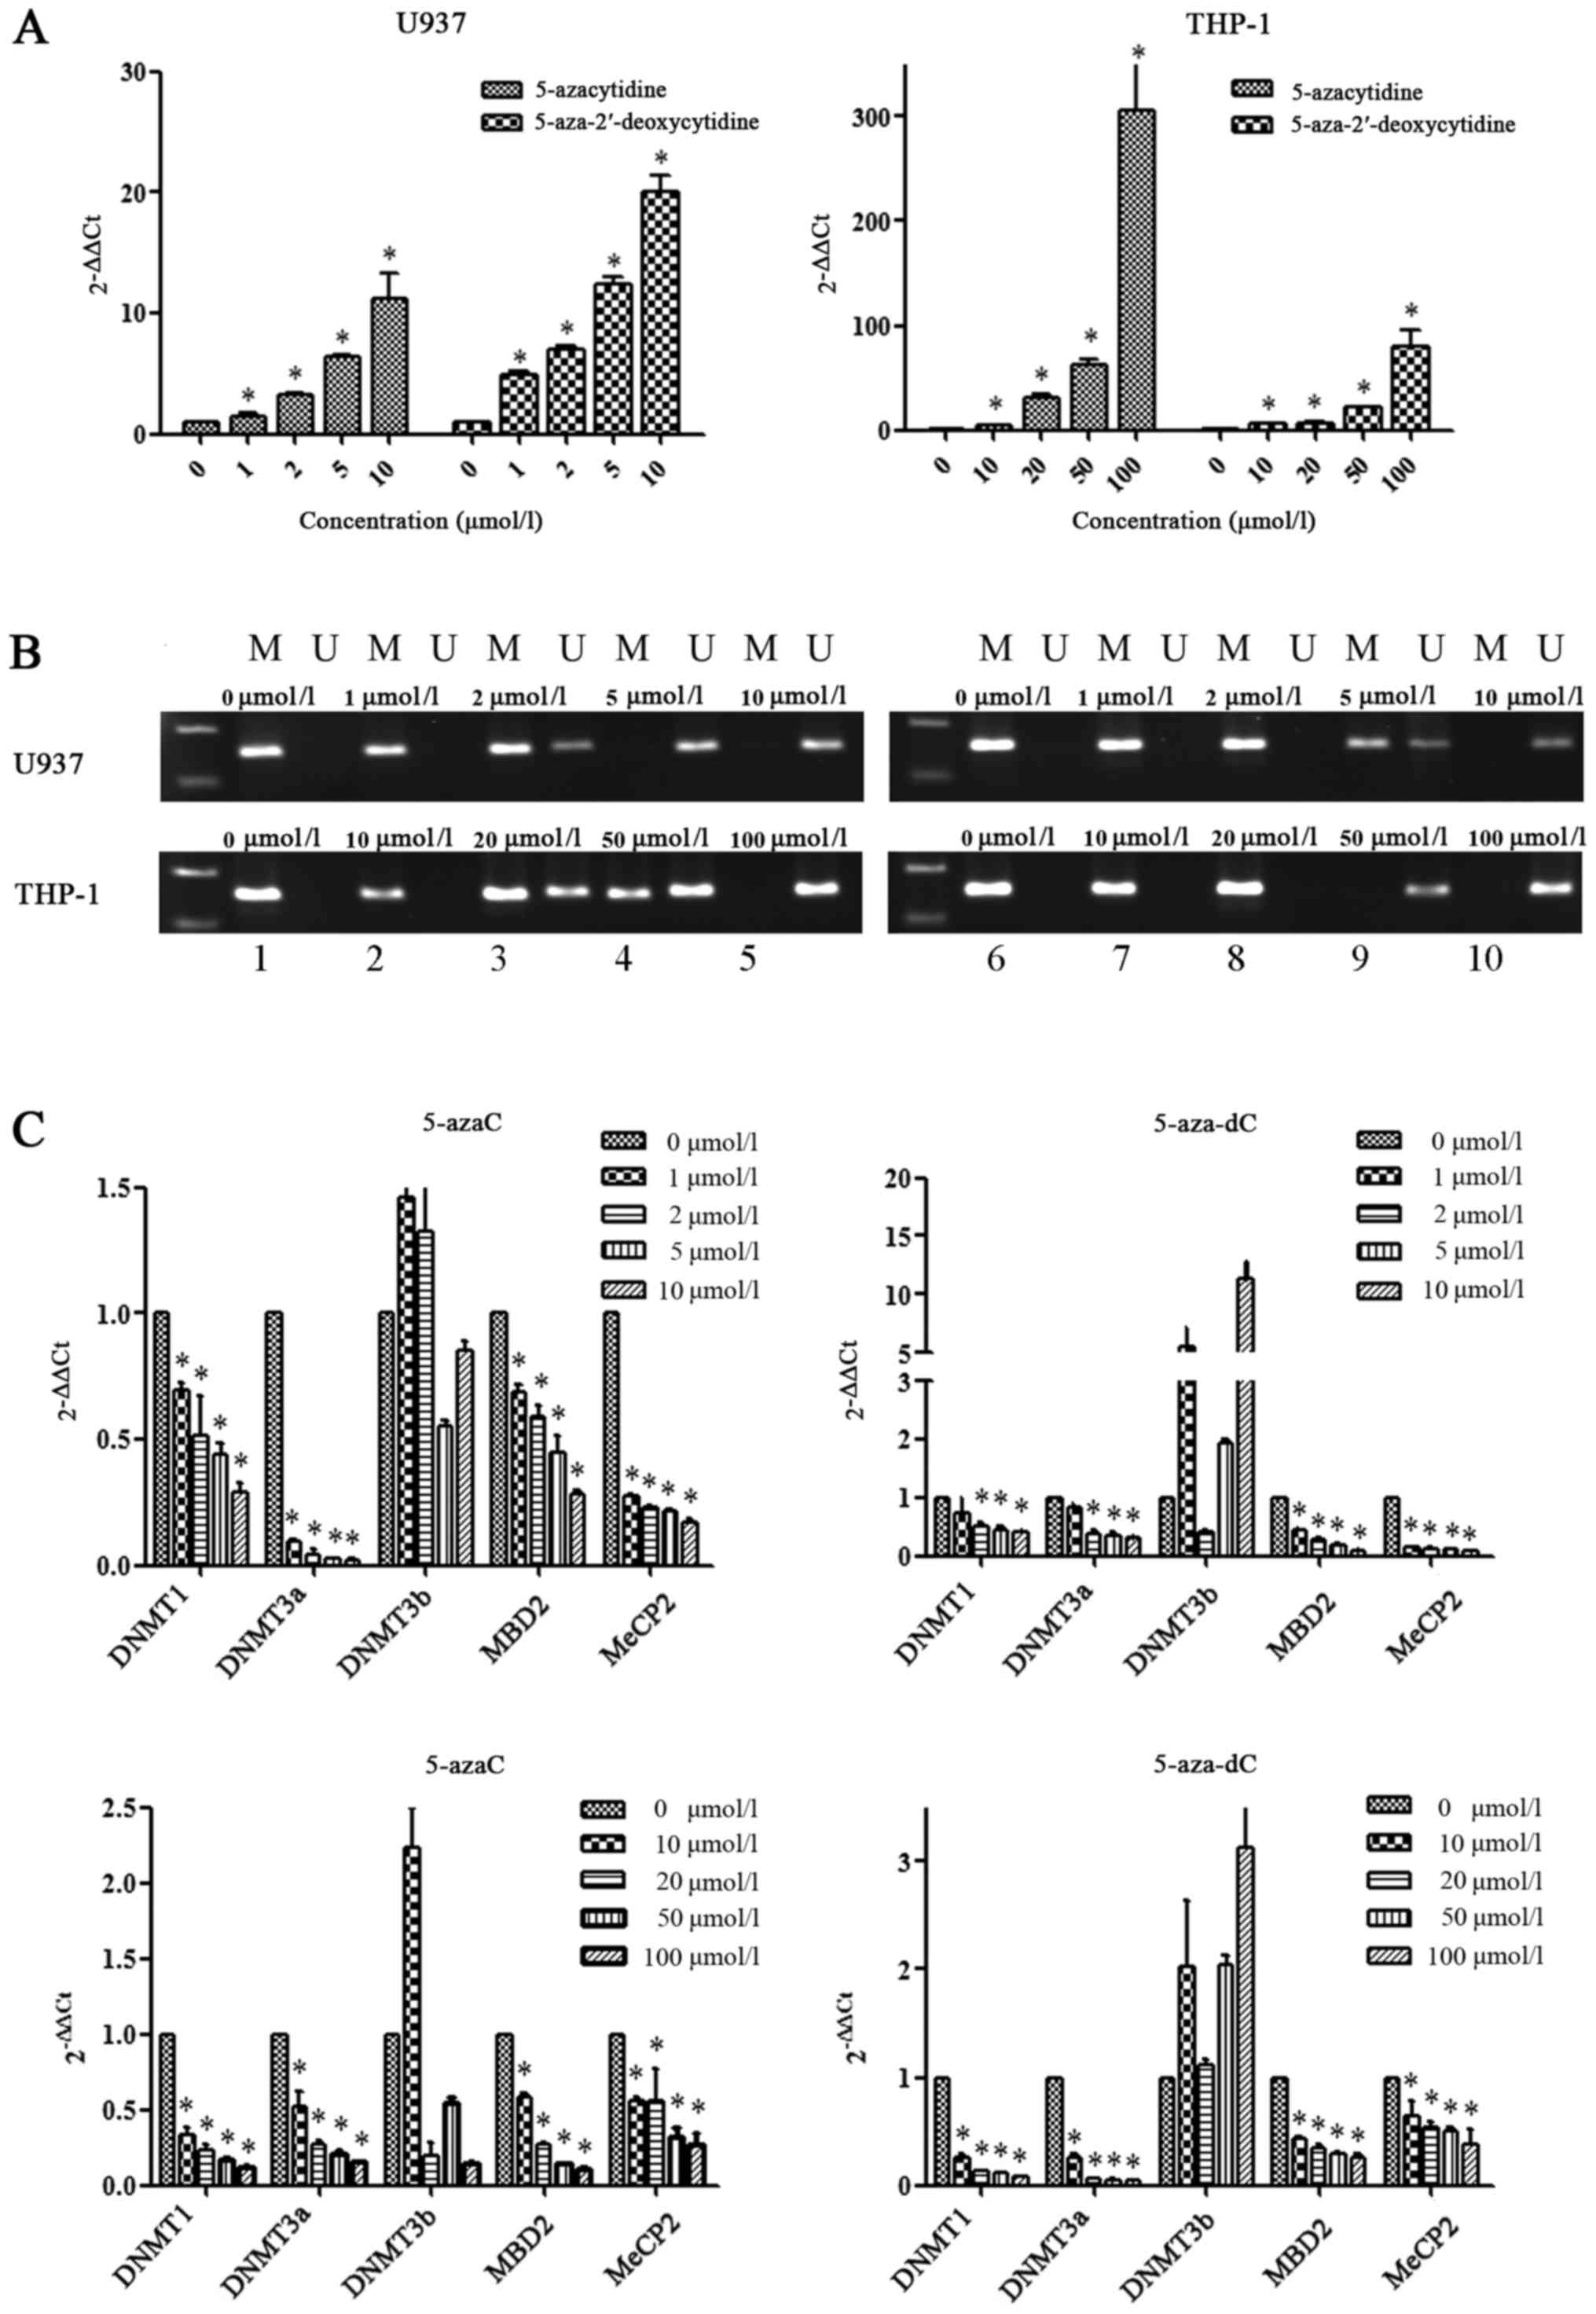
SOCS1 gene expression and methylation
state in AML cell lines in response to demethylation drugs
AML cell lines were treated with four concentrations
of demethylation drugs. We observed an increase in SOCS1 mRNA
expression in response to 5-azaC and 5-aza-dC in a dose dependent
manner in both U937 and THP-1 cells (Fig. 4A). Statistical differences existed
among the untreated group and the treated groups (P<0.05).
Following intervention with demethylation drugs, the
non-methylation strip of the SOCS1 gene in the U937 and THP-1 cell
lines was light while the methylation strip was darker. As the
concentration increased, SOCS1 completely transformed from a
methylated state to an unmethylated state (Fig. 4B). As the concentration of the
demethylation drugs increased, the mRNA expression of the SOCS1
gene increased, and the relative expression of methylation-related
genes DNMT1, DNMT3a, MBD2 and MeCP2 gradually decreased. The
expression of DNMT1 and DNMT3a in the U937 cells treated with
5-aza-dC (1 µmol/l) was not significantly different compared with
that in the untreated group (P>0.05), while the expression of
DNMT1, DNMT3a, MBD2 and MeCP2 in the 5-azaC- and 5-aza-dC-treated
U937 and THP-1 cells was significantly different between the
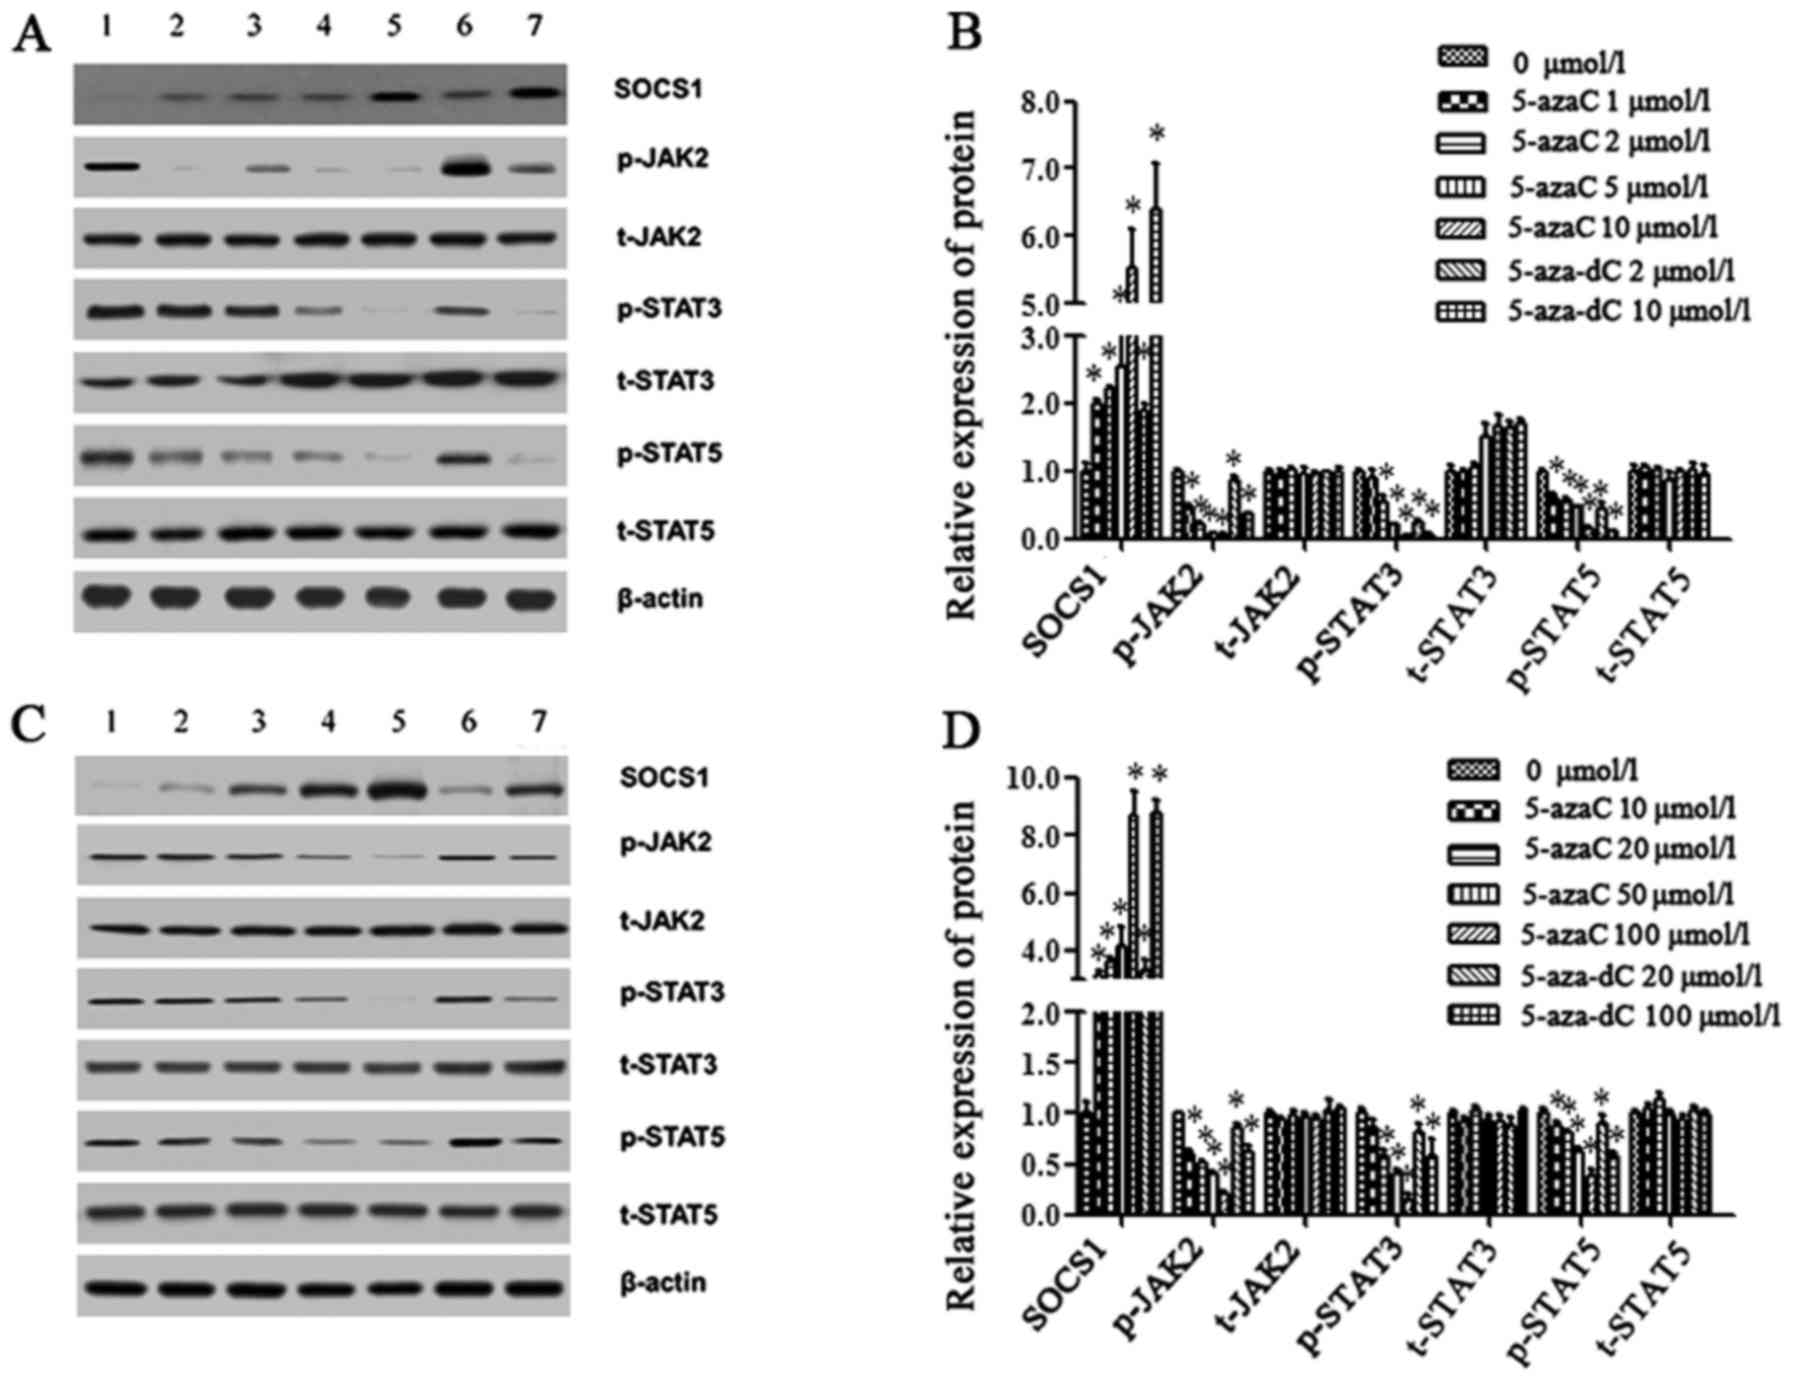
untreated group and the drug-treated groups (P<0.05) (Fig. 4C). As the concentration of the
demethylation drugs increased, the relative expression of the SOCS1
protein gradually increased, while downstream p-JAK2, p-STAT3 and
p-STAT5 protein expression gradually decreased, which was
negatively associated with the SOCS1 protein. The expression of the
p-STAT3 protein between the untreated group and the drug-treated
groups was statistically different (P<0.05) except for the
5-azaC low concentration group (1 or 10 µmol/l). Statistical
differences in p-JAK2 and p-STAT5 protein expression existed among
the untreated group and the treated groups (P<0.05). t-JAK2,
t-STAT3 and t-STAT5 protein expression was not markedly altered
(Fig. 5).
Protein expression in
SOCS1-transfected AML cell lines is altered
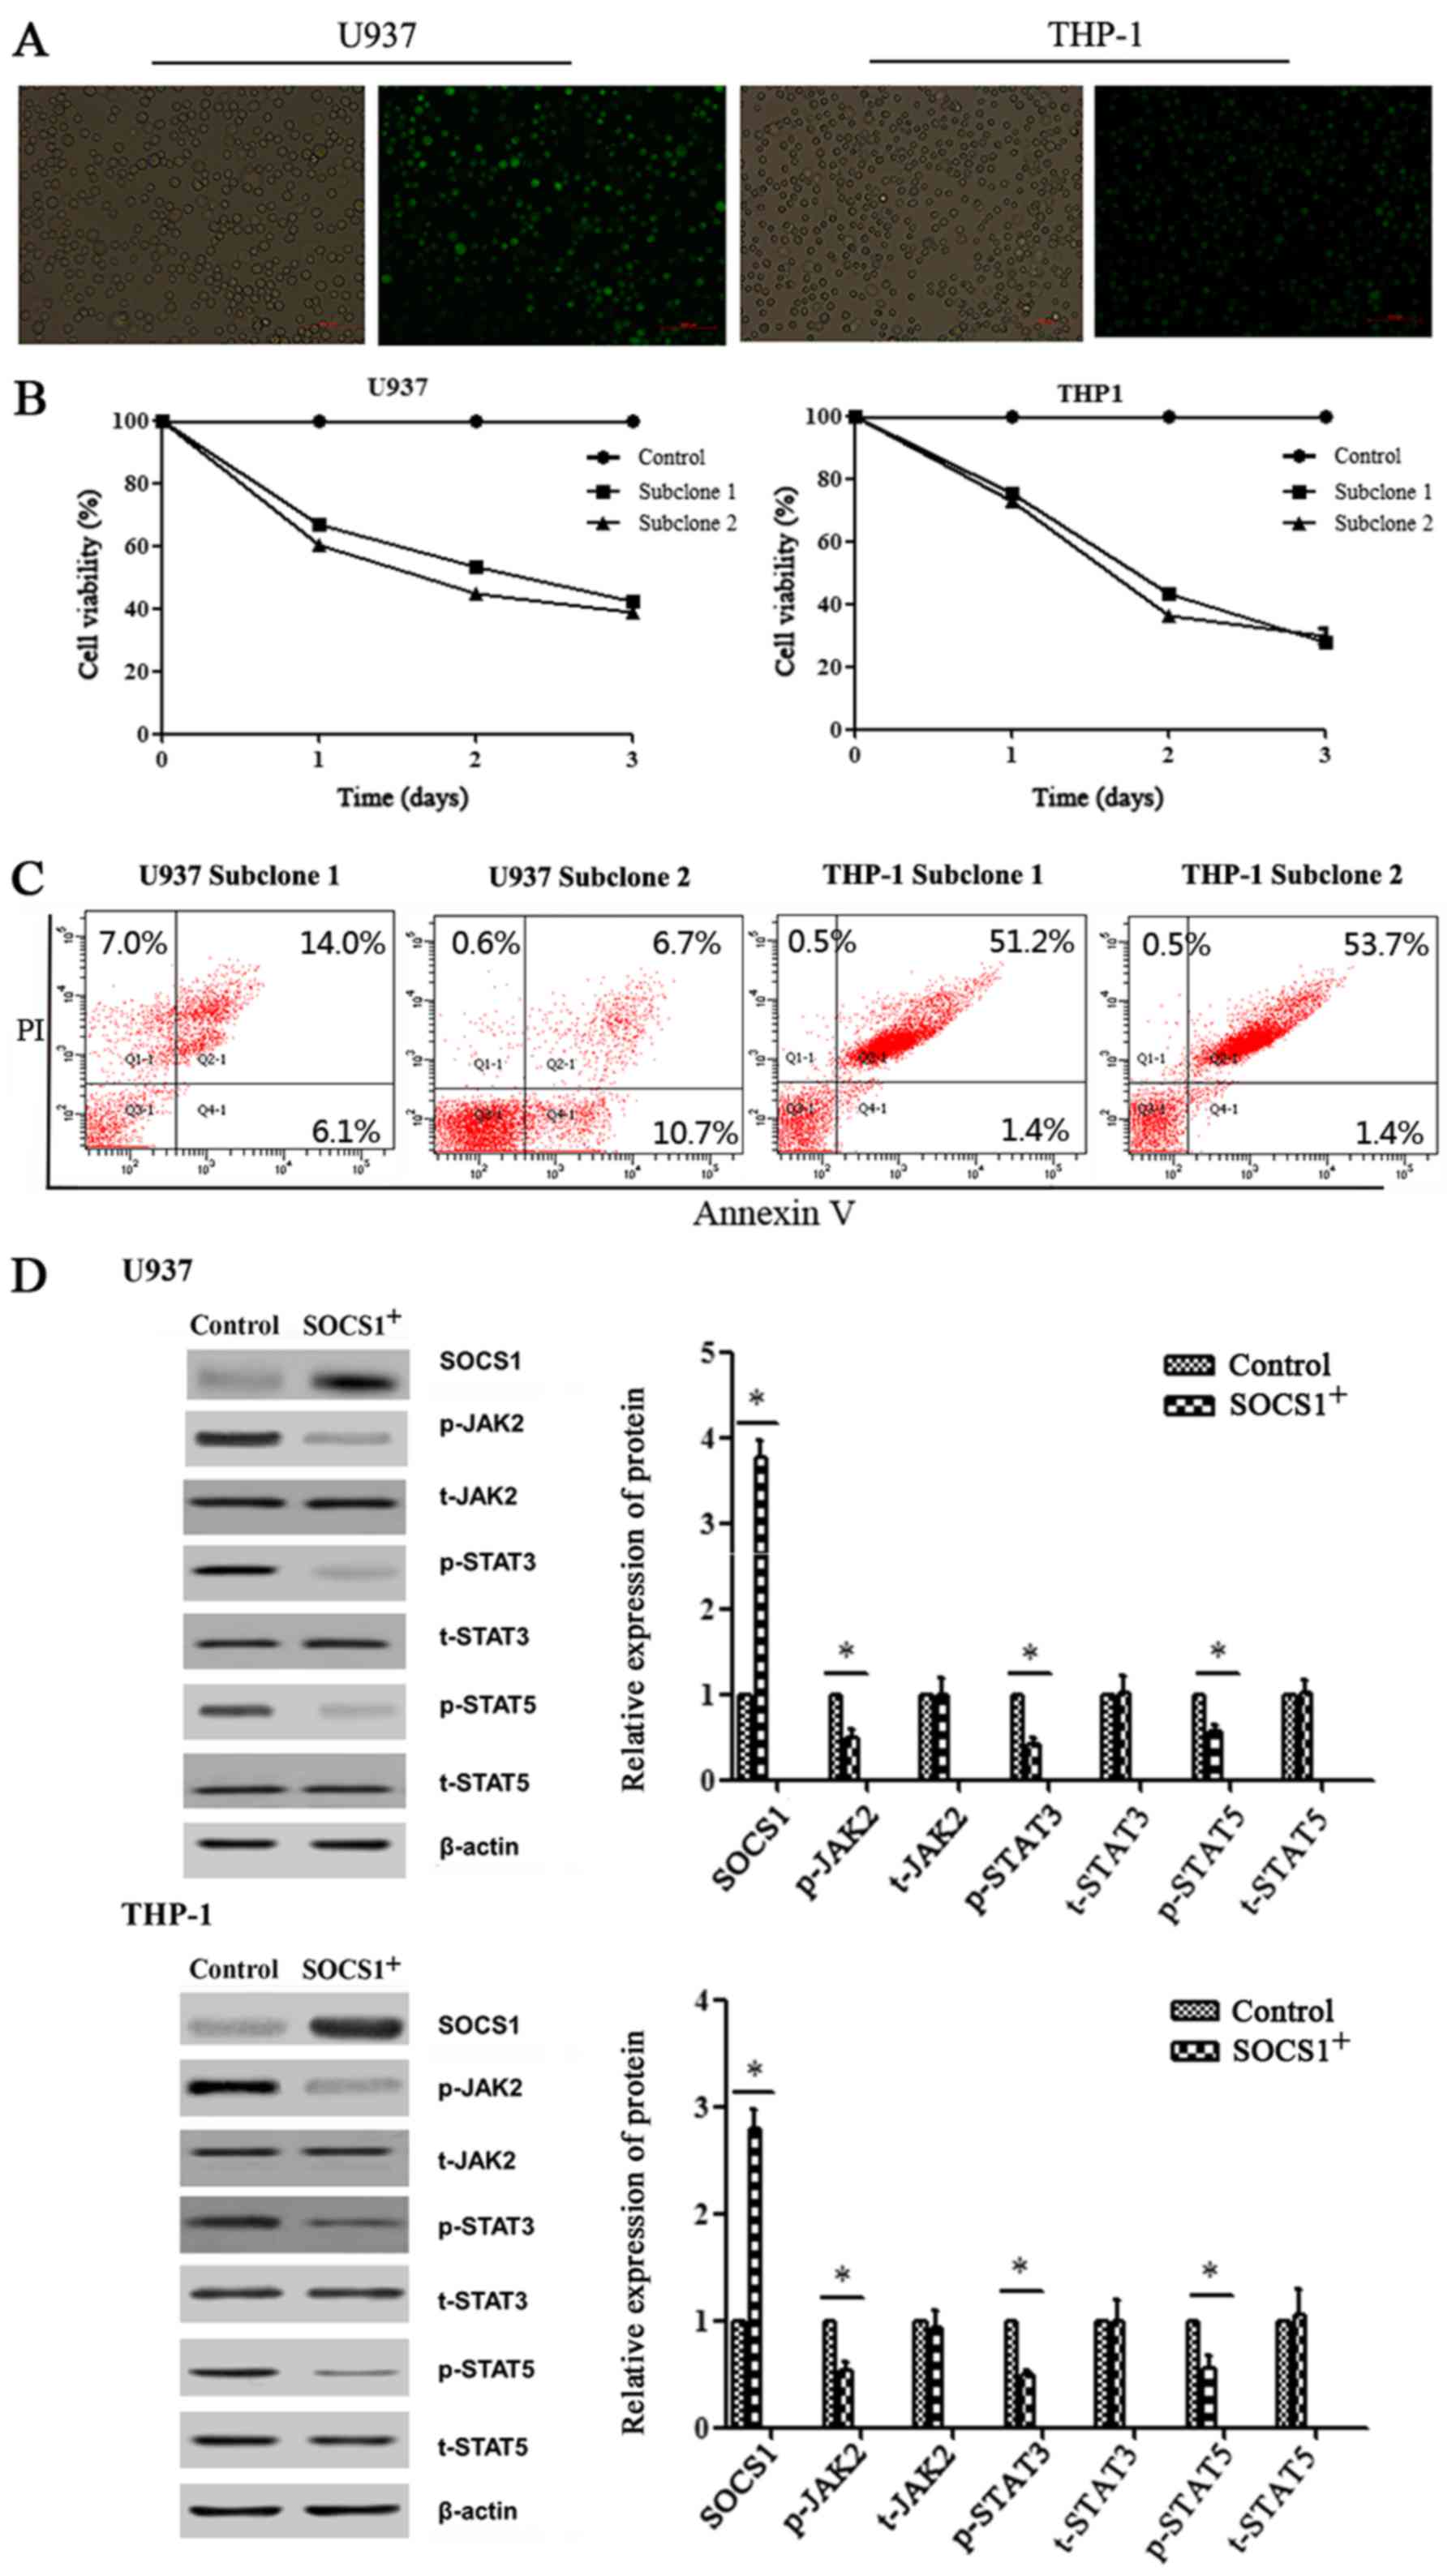
SOCS1 was overexpressed in U937 and THP-1 cell lines
transfected with the pCMV3-C-GFPSpark vector, and overexpression
was confirmed by fluorescence as well as by western blotting
(Fig. 6A and D). As time increased
(time <3 days), the viability of transfected cells gradually
decreased and the apoptosis rate gradually increased (Fig. 6B and C). We found that in cells
overexpressing SOCS1, there was a significant decrease in the
expression of p-JAK2, p-STAT3 and p-STAT5 proteins (P<0.05)
confirming that SOCS1 negatively affects the downstream JAK2/STAT
signaling pathway. No significant change in the expression of
t-JAK2, t-STAT3 and t-STAT5 proteins was observed.
Discussion
SOCS1, widely recognized as a tumor suppressor gene,
is related to lymphatic metastasis and disease progression of liver
cancer (10). Its methylation rate
in hepatocellular carcinoma ranges from 39–60%. SOCS1 methylation
also exists in other tumors, such as 61% in cervical cancer
(11), 45% in esophageal squamous
cancers (12) and 40% in
hepatoblastomas (13). Recent
studies have demonstrated that SOCS1 upregulates the expression of
tiny RNAs in multiple myeloma, breast and prostate cancer, further
confirming the effect of SOCS1 as a tumor-suppressor gene (14–16).
DNA methylation refers to the process of biologically adding a
methyl group to cytosine in cytosine-guanine CpG dinucleotides with
S-adenosylmethionine (SAM) as a methyl donor under the catalysis of
DNA methyltransferases (DNMTs). DNMTs mainly include DNMT1, DNMT3a
and DNMT3b. DNA methylation needs to be read by a conserved family
of proteins, namely, methyl-CpG binding proteins, which are bound
by a methylated DNA-binding domain (MBD) to 5-methylcytosine (5 mC)
followed by CpG. Five methylated CpG binding proteins are currently
known, MeCP2, MBD1, MBD2, MBD3 and MBD4. Both MeCP2 and MBD2 can
bind to methylated DNA and inhibit the transcription of methylated
target genes. Our findings revealing that methylated SOCS1 is
increased in AML corroborates these studies. In the initial
treatment and relapsed/refractory groups, methylated SOCS1 (48 and
80% respectively) decreased the expression of mRNA and protein,
while the expression of DNA methyltransferases DNMT1, DNMT3a and
CpG binding proteins MBD2 and MeCP2 was increased, indicating their
participation in SOCS1 gene methylation. In contrast, in the
remission and normal control groups, the SOCS1 gene was found to be
in a non-methylated state and its mRNA and protein levels were
highly expressed. JAK2/STAT is a major signaling pathway for AML
cell growth and proliferation. SOCS1, can directly bind with the
JAK2/STAT complex and suppress this signal transduction pathway.
Park et al (17) reported
that SOCS1 silencing increased phosphorylation of STAT and promoted
tumor development. In the present study, we found that SOCS1
protein expression in the initial treatment and relapsed/refractory
groups was decreased, while the expression of its downstream
p-JAK2, p-STAT3 and p-STAT5 proteins was higher than that in the
remission and normal control groups. SOCS1 suppressed signal
transduction of the JAK2/STAT pathway to exert its biological
functions by suppressing p-JAK2, p-STAT3 and p-STAT5 proteins.
DNA methylation is a reversible change. In the
present study, we performed demethylation on AML cell lines U937
and THP-1 with drugs 5-azaC and 5-aza-dC. We found that following
treatment, the SOCS1 gene changed from a methylated state to a
non-methylated state and this was accompanied by increased mRNA and
protein expression in a drug concentration-dependent manner. In
contrast, the expression of downstream p-JAK2, p-STAT3 and p-STAT5
proteins and the tumor cell viability rate was decreased, while the
apoptosis rate was increased. Furthermore, the expression of the
p-JAK2, p-STAT3 and p-STAT5 proteins was downregulated in cells
transfected with the SOCS1 protein. This further ascertained that
SOCS1 negatively regulates the downstream JAK2/STAT signaling
pathway. In addition, in transfected cells, we also observed that
the cell viability rate was decreased and the apoptosis rate was
increased.
The relationship between SOCS1 methylation and AML
should be further explored in gene methylation sequencing and with
siRNA, which is the study aim in our future study.
Thus, this study revealed that SOCS1 may be used a
therapeutic target and interventions that may induce expression of
SOCS1 may be used for anticancer therapy (18–20).
Whether SOCS1 can suppress other types of tumors should be verified
by studies on different types of tumors. The demethylated SOCS1
gene may possibly become a new target for future tumor therapy and
provide a new hope for tumor therapy and prognosis.
Acknowledgements
Not applicable.
Funding
No funding was received.
Availability of data and materials
The datasets used and/or analyzed during the current
study are available from the corresponding author on reasonable
request.
Authors' contributions
XZ and JL conceived and designed the study; XZ, LY,
XL and YZ collected, analysed and interpreted the data; YP and XW
designed the experimental techniques and XZ drafted the manuscript.
All authors read and approved the manuscript and agree to be
accountable for all aspects of the research in ensuring that the
accuracy or integrity of any part of the work are appropriately
investigated and resolved.
Ethics approval and consent to
participate
The present study was approved by the Ethics
Committee of Hebei Medical University and written informed consent
was obtained from each patient.
Patient consent for publication
Not applicable.
Competing interests
The authors declare that they have no competing
interests.
References
|
1
|
Walter RB, Othus M, Burnett AK, Löwenberg
B, Kantarjian HM, Ossenkoppele GJ, Hills RK, Ravandi F, Pabst T,
Evans A, et al: Resistance prediction in AML: Analysis of 4601
patients from MRC/NCRI, HOVON/SAKK, SWOG and MD Anderson Cancer
Center. Leukemia. 29:312–320. 2015. View Article : Google Scholar : PubMed/NCBI
|
|
2
|
Ramos NR, Mo CC, Karp JE and Hourigan CS:
Current approaches in the treatment of relapsed and refractory
acute myeloid leukemia. J Clin Med. 4:665–695. 2015. View Article : Google Scholar : PubMed/NCBI
|
|
3
|
Zhang J, Li H, Yu JP, Wang SE and Ren XB:
Role of SOCS1 in tumor progression and therapeutic application. Int
J Cancer. 130:1971–1980. 2012. View Article : Google Scholar : PubMed/NCBI
|
|
4
|
Trengove MC and Ward AC: SOCS proteins in
development and disease. Am J Clin Exp Immunol. 2:1–29.
2013.PubMed/NCBI
|
|
5
|
Skjesol A, Liebe T, Iliev DB, Thomassen
EI, Tollersrud LG, Sobhkhez M, Lindenskov Joensen L, Secombes CJ
and Jørgensen JB: Functional conservation of suppressors of
cytokine signaling proteins between teleosts and mammals: Atlantic
salmon SOCS1 binds to JAK/STAT family members and suppresses type I
and II IFN signaling. Dev Comp Immunol. 45:177–189. 2014.
View Article : Google Scholar : PubMed/NCBI
|
|
6
|
Lesinski GB, Zimmerer JM, Kreiner M,
Trefry J, Bill MA, Young GS, Becknell B and Carson WE III:
Modulation of SOCS protein expression influences the interferon
responsiveness of human melanoma cells. BMC Cancer. 10:1422010.
View Article : Google Scholar : PubMed/NCBI
|
|
7
|
Beaurivage C, Champagne A, Tobelaim WS,
Pomerleau V, Menendez A and Saucier C: SOCS1 in cancer: An oncogene
and a tumor suppressor. Cytokine. 82:87–94. 2016. View Article : Google Scholar : PubMed/NCBI
|
|
8
|
Livak KJ and Schmittgen TD: Analysis of
relative gene expression data using real-time quantitative PCR and
the 2−ΔΔCT method. Methods. 25:402–408. 2001.
View Article : Google Scholar : PubMed/NCBI
|
|
9
|
Chen CY, Tsay W, Tang JL, Shen HL, Lin SW,
Huang SY, Yao M, Chen YC, Shen MC, Wang CH and Tien HF:
SOCS1 methylation in patients with newly diagnosed acute
myeloid leukemia. Genes Chromosomes Cancer. 37:300–305. 2003.
View Article : Google Scholar : PubMed/NCBI
|
|
10
|
Chu PY, Yeh CM, Hsu NC, Chang YS, Chang JG
and Yeh KT: Epigenetic alteration of the SOCS1 gene in
hepatocellular carcinoma. Swiss Med Wkly. 140:w130652010.PubMed/NCBI
|
|
11
|
Sobti RC, Singh N, Hussain S, Suri V,
Nijhawan R, Bharti AC, Bharadwaj M and Das BC: Aberrant promoter
methylation and loss of suppressor of cytokine signalling-1 gene
expression in the development of uterine cervical carcinogenesis.
Cell Oncol. 34:533–543. 2011. View Article : Google Scholar
|
|
12
|
Hussain S, Singh N, Salam I, Bandil K,
Yuvaraj M, Akbar Bhat M, Muzaffar Mir M, Siddiqi MA, Sobti RC,
Bharadwaj M, et al: Methylation-mediated gene silencing of
suppressor of cytokine signaling-1 (SOCS-1) gene in esophageal
squamous cell carcinoma patients of Kashmir valley. J Recept Signal
Transduct Res. 31:147–156. 2011. View Article : Google Scholar : PubMed/NCBI
|
|
13
|
Sakamoto LH, DE Camargo B, Cajaiba M,
Soares FA and Vettore AL: MT1G hypermethylation: A potential
prognostic marker for hepatoblastoma. Pediatr Res. 67:387–393.
2010. View Article : Google Scholar : PubMed/NCBI
|
|
14
|
Jiang S, Zhang HW, Lu MH, He XH, Li Y, Gu
H, Liu MF and Wang ED: MicroRNA-155 functions as an OncomiR in
breast cancer by targeting the suppressor of cytokine signaling 1
gene. Cancer Res. 70:3119–3127. 2010. View Article : Google Scholar : PubMed/NCBI
|
|
15
|
Babar IA, Cheng CJ, Booth CJ, Liang X,
Weidhaas JB, Saltzman WM and Slack FJ: Nanoparticle-based therapy
in an in vivo microRNA-155 (miR-155)-dependent mouse model of
lymphoma. Proc Natl Acad Sci USA. 109:E1695–E1704. 2012. View Article : Google Scholar : PubMed/NCBI
|
|
16
|
Kobayashi N, Uemura H, Nagahama K, Okudela
K, Furuya M, Ino Y, Ito Y, Hirano H, Inayama Y, Aoki I, et al:
Identification of miR-30d as a novel prognostic maker of prostate
cancer. Oncotarget. 3:1455–1471. 2012. View Article : Google Scholar : PubMed/NCBI
|
|
17
|
Park Y, Shon SK, Kim A, Kim KI, Yang Y,
Cho DH, Lee MS and Lim JS: SOCS1 induced by NDRG2 expression
negatively regulates STAT3 activation in breast cancer cells.
Biochem Biophys Res Commun. 363:361–367. 2007. View Article : Google Scholar : PubMed/NCBI
|
|
18
|
Iwahori K, Serada S, Fujimoto M, Ripley B,
Nomura S, Mizuguchi H, Shimada K, Takahashi T, Kawase I, Kishimoto
T and Naka T: SOCS-1 gene delivery cooperates with cisplatin plus
pemetrexed to exhibit preclinical antitumor activity against
malignant pleural mesothelioma. Int J Cancer. 132:459–471. 2013.
View Article : Google Scholar : PubMed/NCBI
|
|
19
|
Doti N, Scognamiglio PL, Madonna S,
Scarponi C, Ruvo M, Perretta G, Albanesi C and Marasco D: New
mimetic peptides of the kinase-inhibitory region (KIR) of SOCS1
through focused peptide libraries. Biochem J. 443:231–240. 2012.
View Article : Google Scholar : PubMed/NCBI
|
|
20
|
Xiong H, Du W, Zhang YJ, Hong J, Su WY,
Tang JT, Wang YC, Lu R and Fang JY: Trichostatin A, a histone
deacetylase inhibitor, suppresses JAK2/STAT3 signaling via inducing
the promoter-associated histone acetylation of SOCS1 and SOCS3 in
human colorectal cancer cells. Mol Carcinog. 51:174–184. 2012.
View Article : Google Scholar : PubMed/NCBI
|