Introduction
Lung cancer is also known as primary bronchogenic
carcinoma and is a type of malignancy that originates in the
bronchial epithelium. Lung cancer is one of the most common
malignant tumors and the most deadly cancer worldwide (1). In recent years, due to population
aging, smoking, environmental pollution and other factors, the
incidence and mortality rates of lung cancer have tended to
increase across the globe, especially in China and other developing
countries (2). Biomarkers are of
great significance for the diagnosis and treatment of diseases,
particularly cancers. With the development of large-scale proteomic
technology, especially biological mass spectrometry (MS), proteomic
technology has become a mainstream technological approach in cancer
biomarker discovery.
Embryos and tumors share great similarities in many
respects. In 1829, French scientists, Lobstein and Recamier, first
proposed the concept of an embryonic origin of tumors, that is,
cancer occurs due to the continued proliferation of embryonic cells
present in the body (3). In the
1970s, Pierce developed the theory of ‘cancer, a problem of
developmental biology’ and noted that tumorigenesis is closely and
strongly related to developmental biology (4). Due to the similarity between tumors
and embryonic cells during gestation in terms of growth, invasion
and immune system suppression, it has been proposed in recent years
that we should think of and study tumors from an evolutionary
perspective (5–7). With the development of experimental
techniques and the increase in research investigations, the early
hypothesis that embryonic development and tumorigenesis are closely
related has increasingly been confirmed.
In our preliminary study, to eliminate the
interference of high-abundance proteins in the blood and enrich
lung cancer-specific markers in body fluid, we established a new
primary organ culture model to detect the free proteins released by
tumor cells into the bloodstream (8). In the present study, we used the
research system for tumor-associated proteins in body fluid that
was established in our preliminary study. We also established
primary cultures of tumor and control tissue samples from non-small
cell lung cancer (NSCLC) patients and collected conditioned medium
(CM). We then used liquid chromatography (LC) and linear ion trap
(LTQ) MS to isolate and identify the full spectrum of the total
proteins in CM samples. Subsequently, we used BRB-ArrayTools
(http://linus.nci.nih.gov/BRB-ArrayTools.html),
ArraySVG and other programs and analyzed MS data using the spectral
counts produced by label-free quantitative proteomics as the
quantitative parameter. We used the Gene Set Enrichment Analysis P
(GSEA-P) program to conduct enrichment analysis of the free
proteins identified in tumor tissue CM based on the
maternal-placental interface expression profile data at different
stages. Data mining of free proteins was conducted to identify
important lung cancer-associated plasma proteins.
Materials and methods
Sample collection
Tissue samples of lung cancer patients for the
present study were all taken from hospitalized patients in the
Department of Thoracic Surgery at the Cancer Hospital of the
Chinese Academy of Medical Sciences and Peking Union Medical
College. When the specimens were obtained, none of the patients had
received physical or chemical treatments. We conducted a
comprehensive collection of patient clinical data. The
histopathological types of surgically resected tumor tissues were
determined by senior pathologists based on the World Health
Organization (WHO) classification of lung cancer tissue. Tumor
staging was determined based on the 7th edition of the Union for
International Cancer Control (UICC) tumor-node-metastasis (TNM)
staging system. During the period from September 2005 to October
2006, we collected fresh tumor and control tissue samples for
primary culture from 9 patients, including 5 patients with squamous
cell carcinoma (SCC), 3 patients with adenocarcinoma (ADC) and 1
patient with large cell carcinoma (LCLC). The clinical data of the
patients are listed in Table I.
 | Table I.Demographic features of primary
culture tissue samples. |
Table I.
Demographic features of primary
culture tissue samples.
| No. | Sex | Age | Histopathological
types | TNM staging | Pathological
staging | Differentiation
degree |
|---|
| 25 | Female | 75 | ADC | T2N0M0 | IB | Moderately |
| 26 | Male | 68 | ADC | T2N2M0 | IIIA | Moderately |
| 27 | Male | 73 | SCC | T2N0M0 | IB | Moderate-poorly |
| 29 | Male | 65 | LCLC | T3N1M0 | IIIA | Poorly |
| 30 | Male | 52 | SCC | T2N1M0 | IIB | Moderately |
| 31 | Male | 37 | SCC | T4N2M0 | IIIB | Moderately |
| 33 | Female | 61 | SCC | T2N1M0 | IIB | Poorly |
| 34 | Male | 58 | SCC | T3N2M0 | IIIA | Well |
| 38 | Male | 45 | ADC | T3N1M0 | IIIA | Moderate-poorly |
Peripheral blood samples were collected from July
2007 to November 2007 from 59 NSCLC patients (38 males and 21
females; mean age, 61.8 years) who underwent surgery at the
National Cancer Center/National Clinical Research Center for
Cancer/Cancer Hospital of Chinese Academy of Medical Sciences and
Peking Union Medical College. The cohort of the NSCLC patients
included 26 patients with lung SCC and 33 patients with lung ADC.
There were 40 stage I–II cases and 19 stage III cases. All patients
provided written informed consent before surgery, and treatments
were performed in accordance with the current ethical principles of
the Independent Ethics Committee, Cancer Hospital, Chinese Academy
of Medical Sciences. Peripheral blood samples were collected via
venipuncture prior to surgery and preserved in EDTA-coated tubes.
Samples were centrifuged at 4°C for 10 min at 1,000 × g to separate
plasma from blood cells. Supernatants were collected, divided into
aliquots and stored at −80°C until use. Disease-free survival (DFS)
was defined as the interval between surgery and recurrence; if
recurrence was not diagnosed, the date of death or last follow-up
was recorded. Overall survival (OS) was defined as the interval
between surgery and death. After surgery, patients were followed up
for over eight years or until death. At the end of the follow-up
period (11–99 months, with a mean of 74 months), tumor recurrence
had been identified in 33 (55.0%) patients; 27 (45.0%) patients had
died at the time of data censorship.
Primary tissue culture and CM
collection
We chose different control tissues depending on
pathological characteristics. For SCC, the control tissue was
normal bronchial tissue from the same patient. For ADC and large
cell lung cancer (LCLC), the control tissue was normal lung tissue
from the same patient. In all cases, the distance between the
control and tumor tissues was >3 cm. Samples of paracancerous
bronchial/lung tissues and lung cancer tissues that were dissected
from the body within 30 min were cut into small pieces with volumes
of approximately 5 mm3 using a scalpel. Tissue pieces
were placed into collagen-coated gridded dishes, and LHC-9 medium
(Invitrogen; Thermo Fisher Scientific, Inc., Waltham, MA, USA) was
added carefully and slowly in a dropwise manner to prevent
disruption of these pieces. The dishes were placed in a culture
box, which was then filled with a gas mixture of 50% N2,
45% O2 and 5% CO2. The culture box was placed
on a shaker, with a shaking frequency of 8–10 times/min. CM was
collected after 24 h of incubation in a 36.5°C incubator. The
collected CM was added to an Amicon Ultra tube (cat no. UFC900596;
Millipore; Merck KGaA, Darmstadt, Germany) and then centrifuged for
45 min at 4,000 × g and 4°C. This process was performed to
desalinate and concentrate the sample.
LC-MS analysis and identification of
proteins released into CM by cells
Enzyme digestion of proteins in
CM
A total of 30 µg of CM proteins was dissolved in 50
µl of solution containing 8 M urea and 10 mM dithiothreitol (DTT);
100 µl of 50 mM NH4HCO3 solution was then
added, and the sample was incubated in a 37°C water bath for 4 h.
Subsequently, 2.5 µl of 1 M indoleacetic acid (IAA) solution was
added, and protein alkylation was completed during 1 h of reaction
at room temperature in the dark. Next, 40 µl of acetonitrile (ACN;
a final concentration of 10%) and 30 µl of 50 mM
NH4HCO3 were added to the mixture, followed
by sequencing-grade trypsin at a protein-to-enzyme ratio of 100:1
and all components were well mixed. After the entire system was
mixed by shaking, the mixture was incubated in a 37°C water bath
for 2 h. To ensure the enzyme digestion effects, trypsin was added
2 h later in a ratio of 100:1, and the incubation was continued for
a total of 16 h after mixing. The reaction solution was acidified
with 5% formic acid (FA) to terminate the reaction.
SPE desalination
The desalting column was an LC-18 solid-phase
extraction (SPE) column (Supelco Inc., Bellefonte, PA, USA). The
desalting steps were as follows: The SPE column was activated with
2 ml of ACN and equilibrated with 2 ml of 0.1% trifluoroacetic acid
(TFA) solution in water; the peptide mixture was slowly added to
the column until all of the samples had entered the column matrix;
2 ml of 0.1% TFA solution in water was added for desalting; elution
was conducted by adding 1.5 ml of eluent (containing 80% ACN and
0.1% TFA) and the eluate was collected, lyophilized and stored at
−20°C.
LC-ESI-MS/MS separation and
identification of peptide mixture
Reversed-phase liquid chromatography-tandem mass
spectrometry (RPLC-MS/MS) was used to analyze the peptide mixture
using a Thermo Finnigan™ LTQ system (Thermo Fisher Scientific,
Inc.) with an electrospray ionization (ESI) ion source and the
high-throughput analysis mode. A nano-LC system (Thermo Fisher
Scientific, Inc.) was run with an LC-Packing system, equipped with
a Famos autosampler system, Swithos loading pump and Ultimate
elution pump; the system was monitored using Dionex chromatography
software. Two RP-C18 trap columns (Supelco Inc.) were connected to
the ten-port valve. When samples were being loaded to one column,
inverted elution was conducted on the other column, and a PicoFrit™
analytical column (BioBasic®C18, 5 µm, 75 µm i.d. × 10
cm, 15 µm i.d. spray tip; New Objective, Woburn, MA, USA) was then
used. Elution chromatography was conducted on the Ultimate system
(Thermo Fisher Scientific, Inc.) and the eluted components directly
entered the MS instrument through the ESI ion source. The LC
conditions were as follows: Mobile phase A, 5% ACN-95% water; and
mobile phase B, 0.1% FA-80% ACN solution.
Database search
The tandem mass spectral database was queried using
the SEQUEST engine of the Bioworks3.1 software (Thermo Fisher
Scientific, Inc.). We used the International Protein Index (IPI)
human protein database v3.07 in the Fasta database (ftp://ftp.ebi.ac.uk/pub/databases/IPI). The search
settings for peptide amino acid sequence variable modifications
were C (+57.02 Da), M (+15.99 Da), a false discovery rate (FDR) of
<0.01 and a peptide mass tolerance of 1.5 Da. The reverse
database was established by reversing the amino acid sequence of
each protein. BuildSummary software was used to integrate and
compare the Sequest search results. The data filtering parameters
were set as follows: Xcorr ≥1.9, 1+; Xcorr ≥2.2, 2+; Xcorr ≥3.75,
3+; DeltCn ≥0.1; Rsp ≤4.
Bioinformatic analysis of the CM free
protein database
This process used the IPI as the index for data
processing. We selected all proteins with no less than two matching
peptides and eliminated redundant proteins due to homology for all
samples.
Gene Ontology (GO) was combined with the SWISS-PROT
protein database (http://www.uniprot.org/uniprot/?query=reviewed%3Ayes)
to analyze the biological processes, cellular localization and
molecular functions of the proteins in the CM. BRB-ArrayTools
software (http://linus.nci.nih.gov/BRB-ArrayTools.html)
(9) was used for the
identification, cluster analysis and enrichment analysis for
differential proteins. Gene Set Enrichment Analysis (GSEA) was
first proposed by Mootha et al in 2003 (10). It was later modified by Subramanian
et al (11) to introduce
weighted scores to replace uniform scores. GSEA-P 2.0 software was
used to conduct enrichment analysis of the free proteins identified
in tumor tissue CM based on the placental-maternal interface
expression profiles at different stages. GSEA analysis first uses
the gene expression profile data of two groups that are known to
have different phenotypes, and distribution L can be obtained by
sorting genes based on the correlation between gene expression
profiles and phenotypes. The data to be analyzed were named S,
which is a series of data with common characteristics. For example,
S may be gene-coding products in the same metabolic pathway, genes
located in the same chromosomal band or genes/proteins with the
same functions, as indicated by GO analysis. Via GSEA analysis, we
ultimately obtained the enrichment conditions of data S in the
existing distribution L. The data could be either randomly
distributed or enriched in data closely related to a certain
phenotype. The latter may indicate biological significance.
Enzyme-linked immunosorbent assay
(ELISA)
Hypoxanthine phosphoribosyltransferase 1 (HPRT1)
protein concentrations in plasma were assessed using ELISA
according to the manufacturer's instructions. ELISA kits for HPRT1
were purchased from Aviva Systems Biology (San Diego, CA, USA).
Briefly, 100 µl of diluted plasma was added to the wells of an
anti-HPRT1 microplate, which was then incubated at 37°C for 2 h.
Subsequently, 100 µl of prepared biotinylated HPRT1 detector
antibody was added to each well, and the microplate was incubated
at 37°C for 1 h. After 3 washes, 100 µl of prepared conjugate was
added to each well, and the microplate was incubated at 37°C for 1
h. After 5 washes, absorbance at 450 nm was immediately assessed
using a microplate reader (Bio-Rad Laboratories, Hercules, CA,
USA).
Statistical analysis
The relationships between plasma levels of the HPRT1
protein and clinical parameters were analyzed by he Mann-Whitney
test, using SPSS software, version 17.0 (SPSS, Inc., Chicago, IL,
USA). DFS and OS rates by plasma levels of the selected proteins
were assessed by log-rank test, and the Kaplan-Meier curves.
P-values <0.05 were considered statistically significant
(P<0.05).
Results
Identification of free proteins in the CM
of primary cultures of lung cancer and the corresponding control
tissues
Identification of proteins in the CM
of primary cultures
For each case of lung cancer, the CM from the
primary culture was dialyzed, lyophilized, bleached, reduced,
alkylated and enzyme digested to obtain mixed peptides, which were
then identified and sequenced using a nanoliter LC-MS/MS (LTQ,
Thermo Finnigan). Among the CM samples corresponding to 9 cases (18
samples), a total of 987 high-confidence proteins (with at least
two matching peptides for each protein) were detected (data not
shown).
To further elucidate the biological significance of
free proteins associated with lung cancer and the identified
differential free proteins, we used the GO database to conduct
biological functional classification for the 987 identified
proteins. GO is an integrated classification system that can
systematically annotate genes at three levels, molecular function,
biological process and cellular component. As an important
bioinformatic tool, GO can be used to identify common molecular and
biological functions shared among a massive number of proteins.
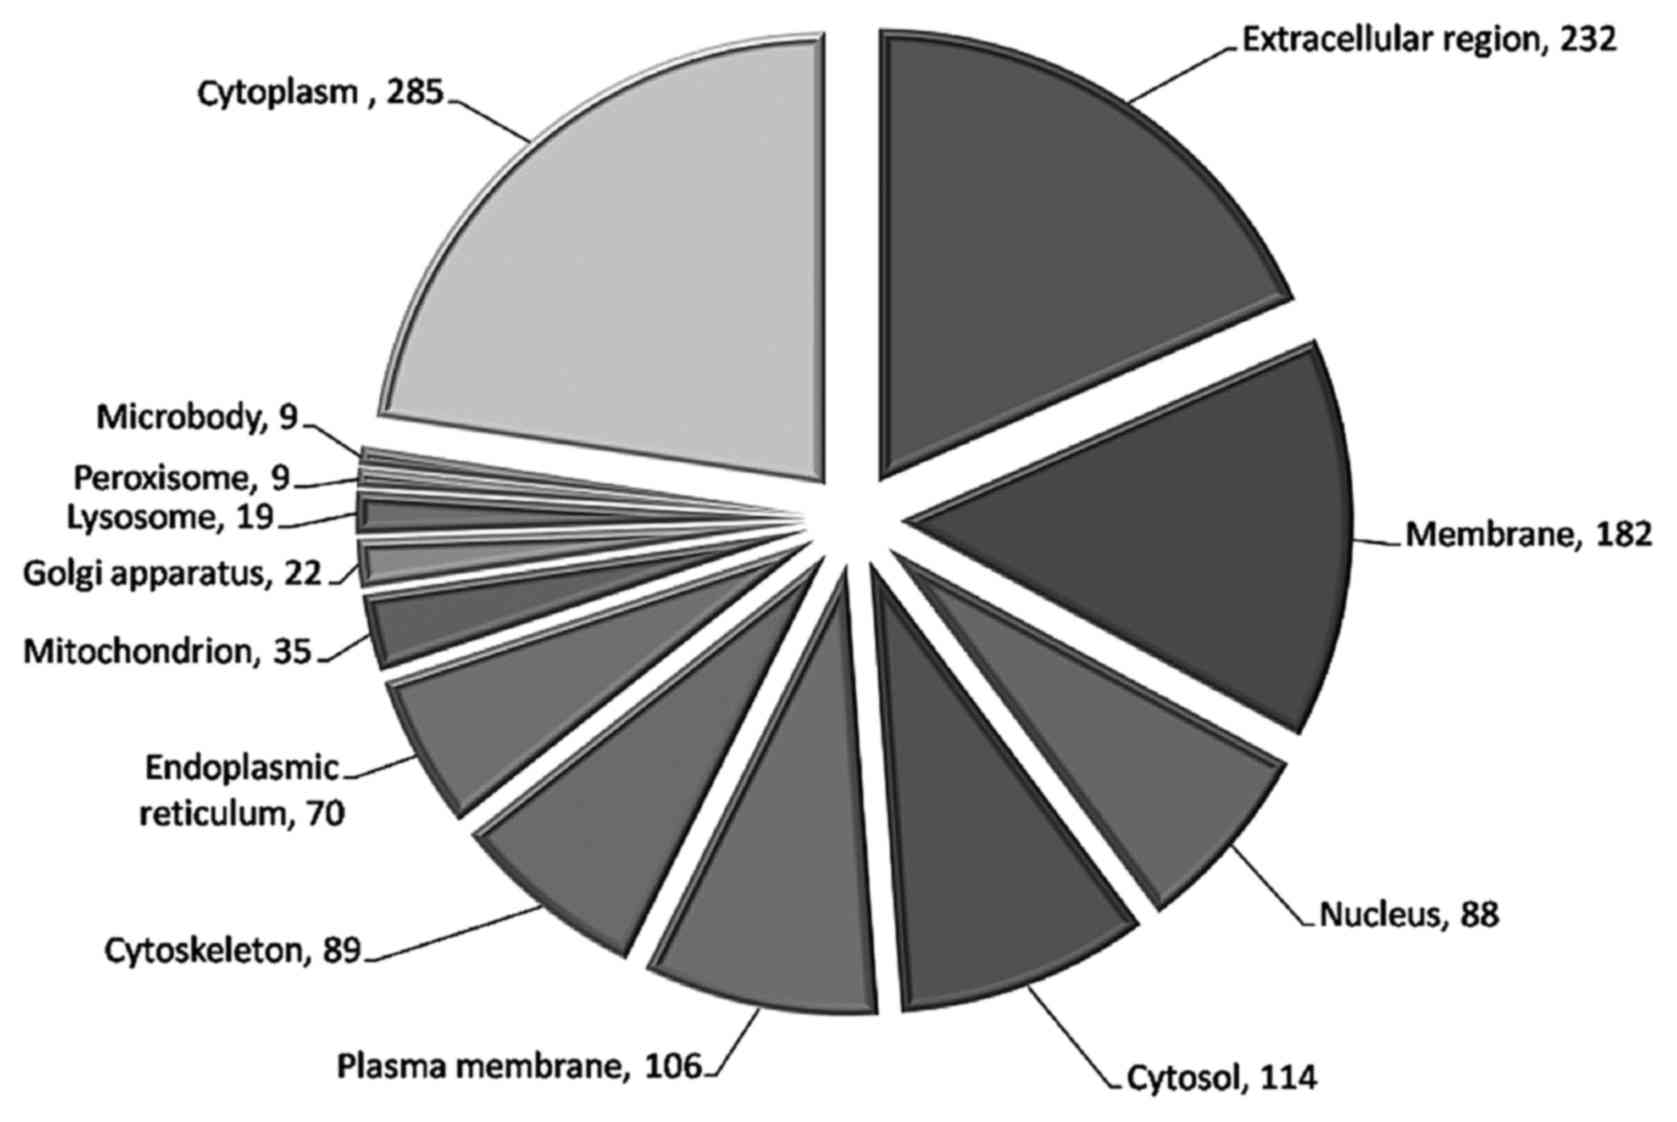
Among the 987 proteins, 232 (23.5%) are
extracellular or secreted proteins, 182 (18.4%) are
membrane-associated proteins and the two types of proteins together
account for 41.9% of all of the identified proteins (Fig. 1). This finding confirmed that this
strategy was an effective method to enrich secreted proteins.
The 987 free proteins identified in the lung cancer
microenvironment are primarily involved in such important processes
as cell growth and maintenance, metabolism, catalysis,
extracellular matrix (ECM)-receptor signaling transduction and cell
adhesion. These proteins were enriched in 15 biological processes
(Fig. 2), including protein
binding, hydrolase activity, calcium ion binding and cytoskeletal
protein binding.
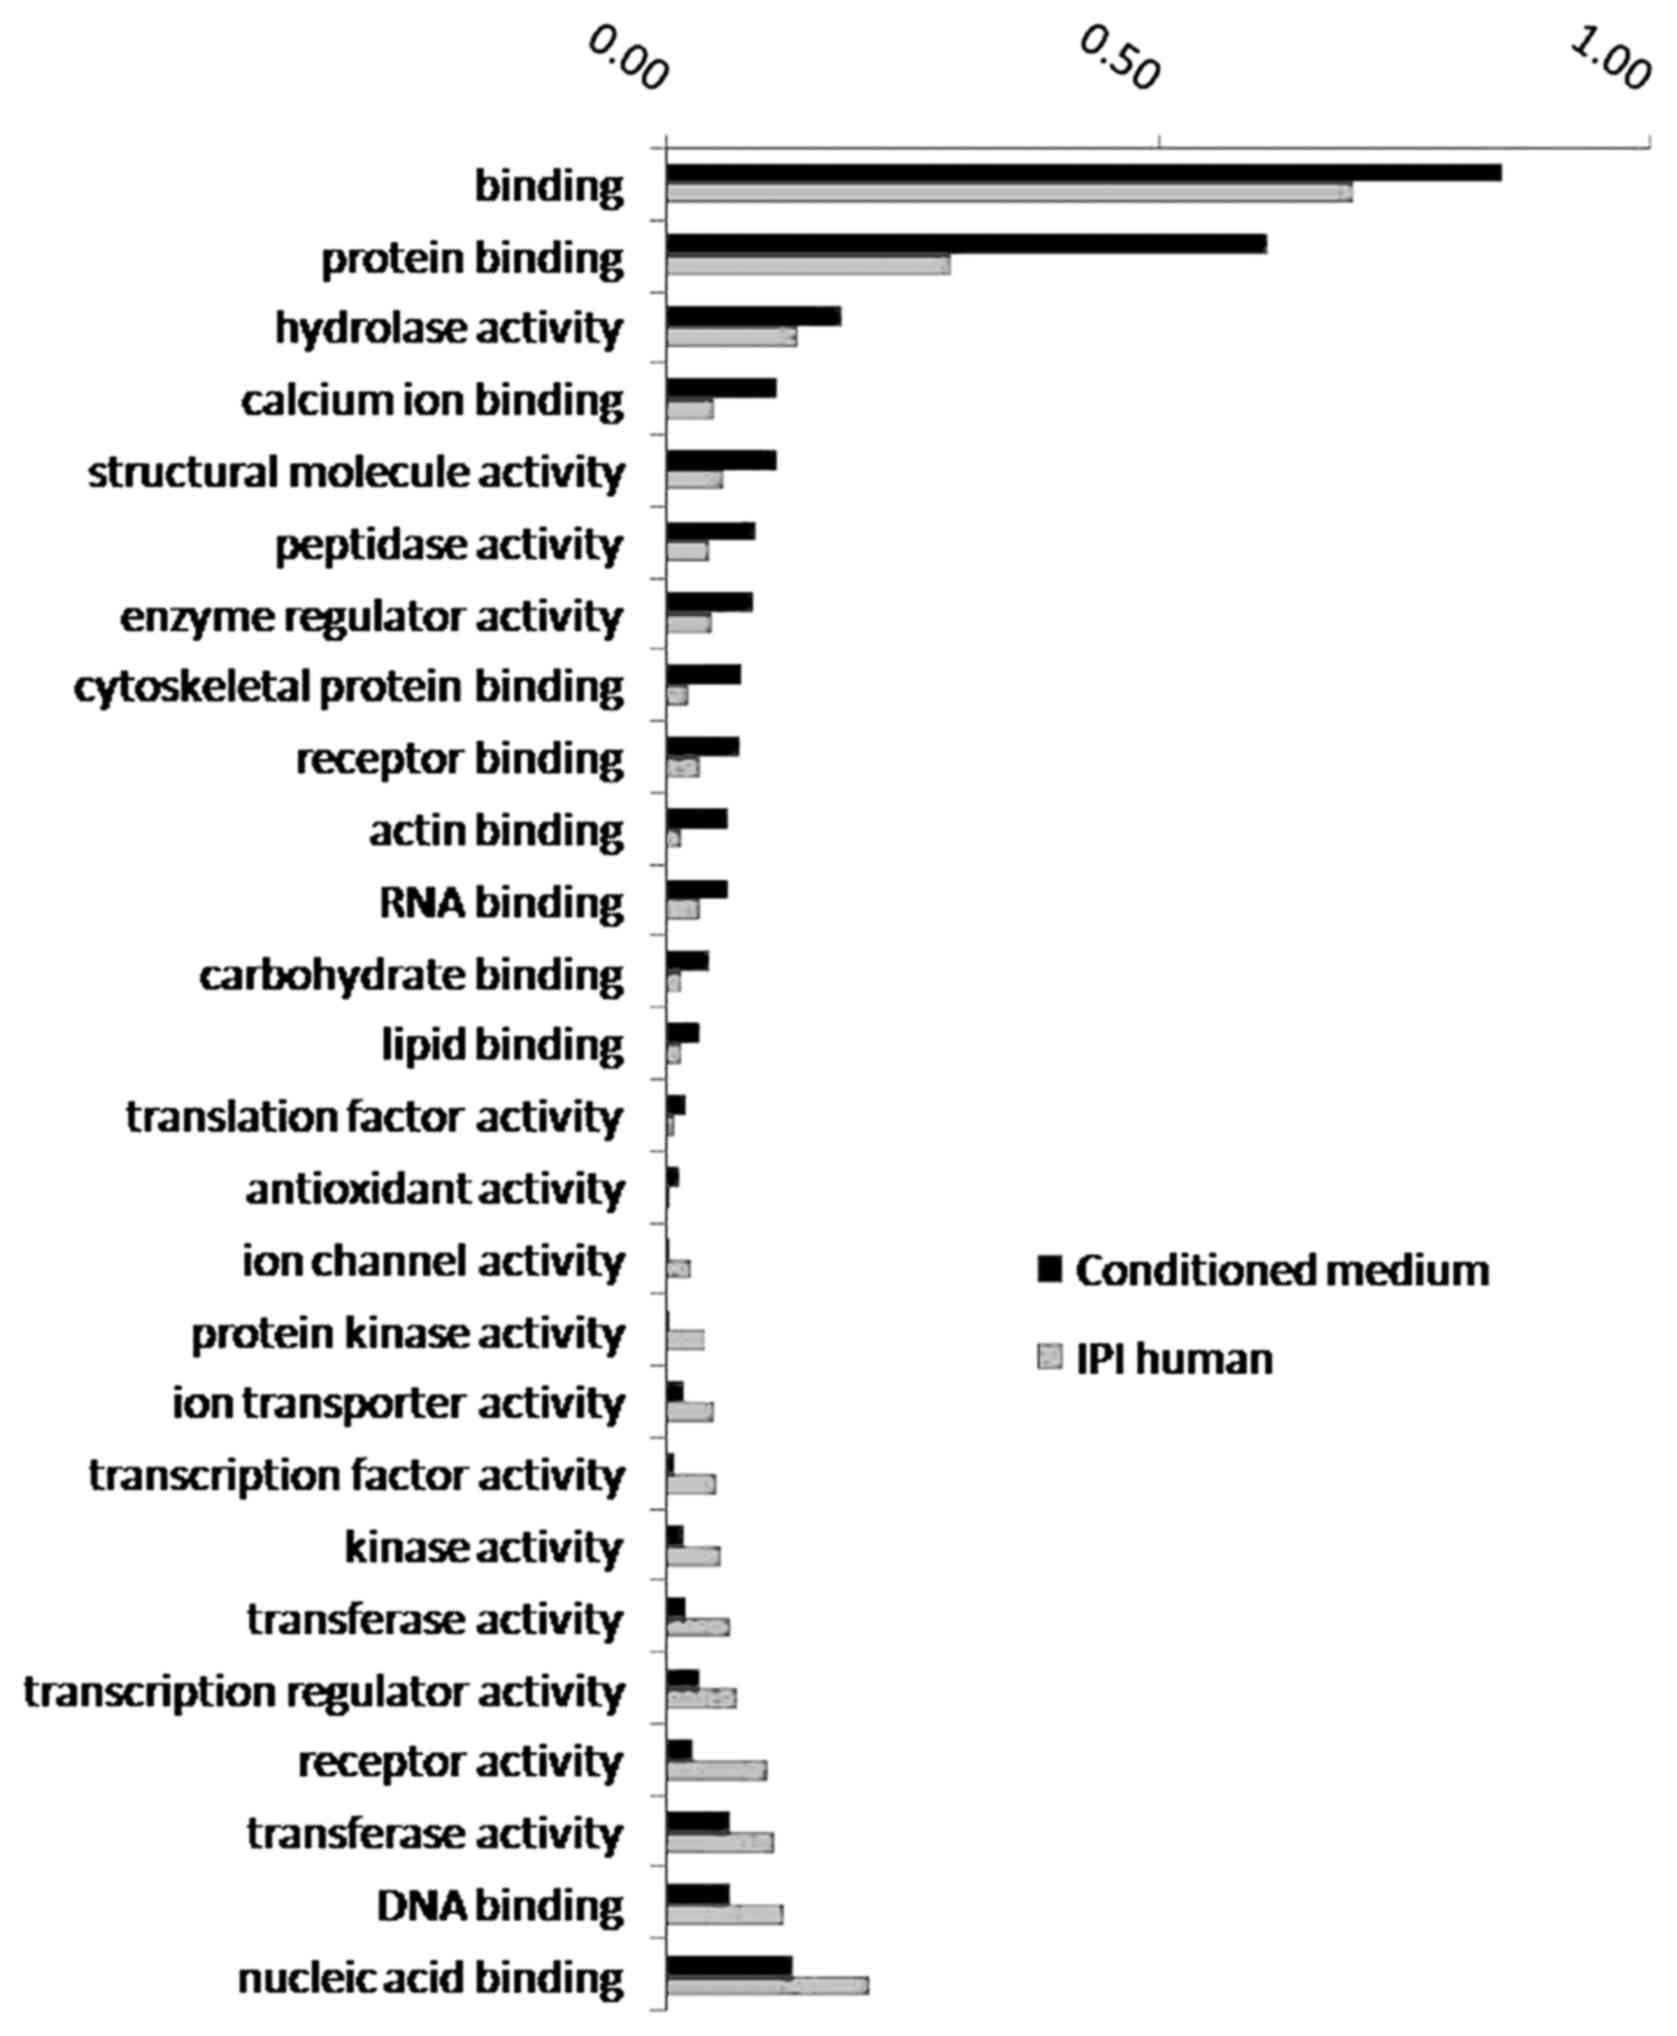 | Figure 2.GO enrichment analysis of biological
processes involving proteins in the CM. The proportion of proteins
involved in 15 biological processes, such as protein binding,
hydrolase activity, and other biological processes, increased
significantly in the conditioned medium. The proportion of proteins
involved in 11 biological processes, such as nucleic acid binding,
DNA binding, and other biological processes, decreased
significantly in the conditioned medium. GO, Gene Ontology; CM,
conditioned medium. |
Proteins involved in biological processes such as
protein binding, hydrolase activity, calcium ion binding and
cytoskeletal protein binding showed significantly elevated ratios
in the CM, and those involved in biological processes such as
nucleic acid binding, DNA binding and transferase activity
demonstrated significantly reduced ratios in the CM.
Differential CM proteins identified by
label-free quantitative proteomic technology
To improve the accuracy of the data, we used the
standard of appearing in at least two samples to screen the 987
proteins and obtained 657 proteins of high confidence. On this
basis, we used the spectral count produced by MS/MS as the
parameter and the total number of spectral counts produced by each
LC-MS/MS identification for each sample as the benchmark to
generate standardized data.
We used the standardized spectral counts of 18
samples as the relative quantitative parameters and used the
Significance Analysis of Microarrays (SAM) algorithm to identify
differential proteins between the CM from tumor tissues and the CM
from paracancerous bronchial tissues. The data were randomly
arranged, the calculations were performed 10,000 times and the
results were corrected based on a false discovery rate (FDR) of
0.10. We identified a total of 143 proteins that demonstrated
significant differences. We calculated the ratios of the average
spectral counts and all the differential proteins showed abundance
changes >1.5 times. A total of 78 proteins showed significantly
increased expression in the CM of the tumor tissue culture
(Table II). These proteins
included KRT19 (Cyfra21-1) and SERPINB4 (SCC), which are the lung
cancer plasma markers currently used in clinical applications. A
total of 65 proteins showed significantly decreased expression in
the CM of the tumor tissue culture (Table III).
| Table II.Seventy-eight proteins with increased
expression in the CM of primary cultures of lung cancer. |
Table II.
Seventy-eight proteins with increased
expression in the CM of primary cultures of lung cancer.
| IPI accession
no. | Gene symbol | Gene
description | Fold change
(T/N) | Cover (%) |
|---|
| IPI00012165.3 | MUC5B | Mucin 5B,
oligomeric mucus/gel-forming | 16.59 | 0.47 |
| IPI00031564.1 | C7orf24 | Chromosome 7 open
reading frame 24 | 8.38 | 20.74 |
| IPI00009943.2 | TPT1 | Tumor protein,
translationally-controlled 1 | 5.49 | 15.43 |
| IPI00171834.3 | KRT19 | Keratin 19 | 4.45 | 51.43 |
| IPI00550640.2 | IGHG4 |
| 4.27 | 15.64 |
| IPI00024638.3 | LOC100133623 |
| 4.18 | 17.03 |
| IPI00549574.2 | OTUB1 | OTU domain,
ubiquitin aldehyde binding 1 | 4.11 | 18.45 |
| IPI00419384.1 | PRKCSH | Protein kinase C
substrate 80 K-H | 4.08 | 4.36 |
| IPI00386327.1 | MUC5AC | Mucin 5AC,
oligomeric mucus/gel-forming | 4.07 | 3.73 |
| IPI00604523.1 | MRCL3 | Myosin regulatory
light chain MRCL3 | 3.94 | 21.47 |
| IPI00022792.3 | MFAP4 |
Microfibrillar-associated protein 4 | 3.84 | 17.25 |
| IPI00025110.3 | MSLN | Mesothelin | 3.65 | 15.92 |
| IPI00477225.1 | PLS3 | Plastin 3 (T
isoform) | 3.56 | 8.13 |
| IPI00396378.3 | HNRNPA2B1 | Heterogeneous
nuclear ribonucleoprotein A2/B1 | 3.49 | 20.11 |
| IPI00295386.6 | CBR1 | Carbonyl reductase
1 | 3.34 | 10.51 |
| IPI00472610.2 | IGHM |
| 3.14 | 21.34 |
| IPI00100160.3 | CAND1 | Cullin-associated
and neddylation-dissociated 1 | 3.03 | 14.15 |
| IPI00215747.4 | FABP7 | Fatty acid binding
protein 7, brain | 3 | 63.36 |
| IPI00012887.1 | CTSL1 | Cathepsin L1 | 2.97 | 10.51 |
| IPI00027341.1 | CAPG | Capping protein
(actin filament), gelsolin-like | 2.86 | 7.18 |
| IPI00465248.4 | ENO1 | Enolase 1,
(alpha) | 2.86 | 32.56 |
| IPI00555616.1 | SOD2 | Superoxide
dismutase 2, mitochondrial | 2.81 | 19.37 |
| IPI00001639.2 | KPNB1 | Karyopherin
(importin) beta 1 | 2.78 | 9.36 |
| IPI00514931.1 | THBS2 | Thrombospondin
2 | 2.69 | 9.47 |
| IPI00478493.1 | HP | Haptoglobin | 2.67 | 14.78 |
| IPI00219219.2 | LGALS1 | Lectin,
galactoside-binding, soluble, 1 (galectin 1) | 2.65 | 23.13 |
| IPI00552325.1 | HLA-C | Major
histocompatibility complex, class I, C | 2.59 | 19.95 |
| IPI00329200.4 | RANBP5 | RAN binding protein
5 | 2.55 | 8.68 |
| IPI00012007.5 | AHCY |
S-adenosylhomocysteine hydrolase | 2.53 | 17.40 |
| IPI00013933.1 | DSP | Desmoplakin | 2.46 | 4.18 |
| IPI00219018.5 | GAPDH |
Glyceraldehyde-3-phosphate
dehydrogenase | 2.45 | 22.09 |
| IPI00216746.1 | HNRPK | Heterogeneous
nuclear ribonucleoprotein K | 2.43 | 7.54 |
| IPI00215911.2 | APEX1 | APEX nuclease
(multifunctional DNA repair enzyme) 1 | 2.41 | 11.04 |
| IPI00413112.2 | ANXA8 | Annexin A8 | 2.38 | 26.20 |
| IPI00169383.2 | PGK1 | Phosphoglycerate
kinase 1 | 2.36 | 20.91 |
| IPI00383237.3 | PKM2 | Pyruvate kinase,
muscle | 2.34 | 11.32 |
| IPI00102821.3 | MGC29506 | Hypothetical
protein MGC29506 | 2.31 | 28.04 |
| IPI00105407.1 | AKR1B10 | Aldo-keto reductase
family 1, member B10 (aldose reductase) | 2.3 | 49.05 |
| IPI00031008.1 | TNC | Tenascin C
(hexabrachion) | 2.3 | 24.35 |
| IPI00186290.5 | EEF2 | Eukaryotic
translation elongation factor 2 | 2.3 | 38.39 |
| IPI00025512.2 | HSPB1 | Heat shock 27 kDa
protein 1 | 2.3 | 61.95 |
| IPI00009342.1 | IQGAP1 | IQ motif containing
GTPase activating protein 1 | 2.28 | 31.80 |
| IPI00418262.3 | ALDOC | Aldolase C,
fructose-bisphosphate | 2.28 | 25.34 |
| IPI00008527.1 | RPLP1 | Ribosomal protein,
large, P1 | 2.24 | 51.75 |
| IPI00479191.1 | HNRPH1 | Heterogeneous
nuclear ribonucleoprotein H1 (H) | 2.21 | 11.65 |
| IPI00019502.1 | MYH9 | Myosin, heavy chain
9, non-muscle | 2.21 | 11.33 |
| IPI00215901.1 | AK2 | Adenylate kinase
2 | 2.21 | 28.03 |
| IPI00216691.4 | PFN1 | Profilin 1 | 2.2 | 11.51 |
| IPI00024466.1 | UGCGL1 | UDP-glucose
ceramide glucosyltransferase-like 1 | 2.19 | 6.11 |
| IPI00018352.1 | UCHL1 | Ubiquitin
carboxyl-terminal esterase L1 (ubiquitin thiolesterase) | 2.13 | 38.57 |
| IPI00024067.1 | CLTC | Clathrin, heavy
chain (Hc) | 2.13 | 10.81 |
| IPI00028091.1 | ACTR3 | ARP3 actin-related
protein 3 homolog (yeast) | 2.12 | 10.53 |
| IPI00183626.7 | PTBP1 | Polypyrimidine
tract binding protein 1 | 2.11 | 19.21 |
| IPI00219525.9 | PGD | Phosphogluconate
dehydrogenase | 2.09 | 15.56 |
| IPI00382428.4 | FBLN5 | Fibulin 5 | 2.06 | 8.07 |
| IPI00219025.2 | GLRX | Glutaredoxin
(thioltransferase) | 2.06 | 11.43 |
| IPI00216171.2 | ENO2 | Enolase 2 (gamma,
neuronal) | 1.99 | 25.87 |
| IPI00107831.3 | PTPRF | Protein tyrosine
phosphatase, receptor type, F | 1.99 | 2.27 |
| IPI00218836.1 | DBI | Diazepam binding
inhibitor (GABA receptor modulator, acyl-Coenzyme A binding
protein) | 1.99 | 34.62 |
| IPI00465028.5 | TPI1 | Triosephosphate
isomerase 1 | 1.98 | 42.17 |
| IPI00399265.1 | TPD52L2 | Tumor protein
D52-like 2 | 1.98 | 27.51 |
| IPI00003881.3 | HNRPF | Heterogeneous
nuclear ribonucleoprotein F | 1.96 | 20.00 |
| IPI00060715.1 | KCTD12 | Potassium channel
tetramerisation domain containing 12 | 1.95 | 15.08 |
| IPI00000875.5 | EEF1G | Eukaryotic
translation elongation factor 1 gamma | 1.94 | 16.28 |
| IPI00465430.4 | XRCC6 | X-ray repair
complementing defective repair in Chinese hamster cells 6 (Ku
autoantigen, 70 kDa) | 1.92 | 10.18 |
| IPI00514090.1 | LTA4H | Leukotriene A4
hydrolase | 1.91 | 25.93 |
| IPI00010303.1 | SERPINB4 | Serpin peptidase
inhibitor, clade B (ovalbumin), member 4 | 1.91 | 41.28 |
| IPI00011937.1 | PRDX4 | Peroxiredoxin
4 | 1.9 | 9.23 |
| IPI00550363.1 | TAGLN2 | Transgelin 2 | 1.89 | 25.63 |
| IPI00008524.1 | PABPC1 | Poly(A) binding
protein, cytoplasmic 1 | 1.89 | 13.68 |
| IPI00005969.1 | CAPZA1 | Capping protein
(actin filament) muscle Z-line, alpha 1 | 1.89 | 23.08 |
| IPI00003269.1 | DKFZp686D0972 | Similar to RIKEN
cDNA 4732495G21 gene | 1.87 | 16.49 |
| IPI00395676.1 | UGP2 | UDP-glucose
pyrophosphorylase 2 | 1.86 | 17.71 |
| IPI00294578.1 | TGM2 | Transglutaminase 2
(C polypeptide, protein-glutamine-gamma-glutamyltransferase) | 1.86 | 10.19 |
| IPI00020672.3 | DPP3 |
Dipeptidyl-peptidase 3 | 1.83 | 10.05 |
| IPI00479733.1 | ERO1L | ERO1-like (S.
cerevisiae) | 1.78 | 13.86 |
| IPI00007423.1 | ANP32B | Acidic
(leucine-rich) nuclear phosphoprotein 32 family, member B | 1.76 | 20.32 |
| IPI00023648.3 | ISLR | Immunoglobulin
superfamily containing leucine-rich repeat | 1.62 | 7.01 |
| Table III.Sixty-five proteins with
significantly decreased expression in the CM of the tumor tissue
culture. |
Table III.
Sixty-five proteins with
significantly decreased expression in the CM of the tumor tissue
culture.
| IPI accession
no. | Gene symbol | Gene
description | Fold change
(T/N) | Cover (%) |
|---|
| IPI00001508.1 | INS | Insulin
precursor | 0.55 | 25.45 |
| IPI00179357.1 | TTN | Titin | 0.54 | 0.08 |
| IPI00299155.5 | PSMA4 | Proteasome subunit
alpha type 4 | 0.53 | 17.62 |
| IPI00020091.1 | ORM2 | Alpha-1-acid
glycoprotein 2 precursor | 0.52 | 12.94 |
| IPI00008164.1 | PREP | Prolyl
endopeptidase | 0.50 | 4.93 |
| IPI00401264.5 | TXNDC4 | Thioredoxin domain
containing protein 4 precursor | 0.50 | 16.50 |
| IPI00004656.1 | B2M |
Beta-2-microglobulin precursor | 0.50 | 26.89 |
| IPI00006114.4 | SERPINF1 | Pigment
epithelium-derived factor precursor | 0.49 | 15.31 |
| IPI00293867.6 | DDT | D-dopachrome
tautomerase | 0.48 | 17.95 |
| IPI00292936.4 | CXCL5 | Small inducible
cytokine B5 precursor | 0.46 | 10.53 |
| IPI00298406.3 | HADH | 3-hydroxyacyl-CoA
dehydrogenase, isoform 2 | 0.46 | 13.33 |
| IPI00219682.5 | STOM | Erythrocyte band 7
integral membrane protein | 0.46 | 12.54 |
| IPI00014572.1 | SPARC | SPARC
precursor | 0.46 | 25.74 |
| IPI00472112.1 | LOC730410 | Splice Isoform 2 of
HLA class I histocompatibility antigen, A-11 alpha chain
precursor | 0.45 | 8.36 |
| IPI00024993.4 | ECHS1 | Enoyl-CoA
hydratase, mitochondrial precursor | 0.45 | 19.31 |
| IPI00556607.1 | PSMB4 | Proteasome
(Prosome, macropain) subunit, beta type, 4 | 0.44 | 17.42 |
| IPI00479877.3 | ALDH9A1 |
4-trimethylaminobutyraldehyde
dehydrogenase | 0.44 | 5.67 |
| IPI00003818.1 | KYNU | Kynureninase | 0.42 | 16.99 |
| IPI00218323.1 | TPD52 | N8 protein long
isoform | 0.42 | 10.08 |
| IPI00012119.1 | DCN | Splice Isoform A of
Decorin precursor | 0.41 | 20.61 |
| IPI00295400.1 | WARS | Tryptophanyl-tRNA
synthetase | 0.41 | 14.86 |
| IPI00008561.1 | MMP1 | Interstitial
collagenase precursor | 0.41 | 8.96 |
| IPI00218163.1 | MUC1 | Splice Isoform 2 of
Mucin-1 precursor | 0.40 | 2.22 |
| IPI00219910.1 | BLVRB | Flavin
reductase | 0.40 | 18.01 |
| IPI00027463.1 | S100A6 | Calcyclin | 0.40 | 51.11 |
| IPI00024284.4 | HSPG2 | Basement
membrane-specific heparan sulfate proteoglycan core protein
precursor | 0.40 | 3.83 |
| IPI00395488.2 | VASN | Vasorin | 0.39 | 8.02 |
| IPI00304840.3 | COL6A2 | Splice Isoform 2C2
of Collagen alpha 2(VI) chain precursor | 0.39 | 2.45 |
| IPI00299738.1 | PCOLCE | Procollagen
C-proteinase enhancer protein precursor | 0.38 | 4.68 |
| IPI00413959.2 | CLSTN1 | Calsyntenin-1
precursor | 0.37 | 11.01 |
| IPI00183508.2 | TWF1 | Twinfilin isoform
1 | 0.36 | 11.46 |
| IPI00031030.1 | APLP2 | Splice Isoform 1 of
Amyloid-like protein 2 precursor | 0.35 | 4.33 |
| IPI00003590.1 | QSOX1 | Quiescin Q6 | 0.35 | 9.37 |
| IPI00032293.1 | CST3 | Cystatin C
precursor | 0.34 | 25.34 |
| IPI00555841.1 | H2AFV | H2A histone family,
member V isoform 1 variant | 0.34 | 15.33 |
| IPI00102165.1 | H2AFJ | Hypothetical
protein FLJ10903 | 0.33 | 18.06 |
| IPI00166866.3 | IGHV3OR16-13 | MGC27165
protein | 0.33 | 13.43 |
| IPI00015102.1 | ALCAM | CD166 antigen
precursor | 0.33 | 7.38 |
| IPI00218816.6 | HBB | Hemoglobin beta
chain | 0.32 | 87.76 |
| IPI00007047.1 | S100A8 | Calgranulin A | 0.31 | 20.43 |
| IPI00465260.1 | GARS | GARS protein | 0.31 | 4.79 |
| IPI00026944.1 | NID1 | Nidogen
precursor | 0.30 | 3.53 |
| IPI00022078.3 | NDRG1 | NDRG1 protein | 0.30 | 20.56 |
| IPI00216138.5 | TAGLN | Transgelin | 0.28 | 26.00 |
| IPI00007427.1 | AGR2 | Anterior gradient
protein 2 homolog precursor | 0.28 | 22.29 |
| IPI00298237.4 | TPP1 | Splice Isoform 1 of
Tripeptidyl-peptidase I precursor | 0.28 | 7.99 |
| IPI00410714.2 | HBA1 | Alpha 2 globin
variant | 0.25 | 30.28 |
| IPI00305461.2 | ITIH2 | Inter-alpha-trypsin
inhibitor heavy chain H2 precursor | 0.25 | 7.29 |
| IPI00022463.1 | TF | Serotransferrin
precursor | 0.25 | 13.47 |
| IPI00299547.2 | LCN2 | Lipocalin 2 | 0.24 | 24.50 |
| IPI00297646.2 | COL1A1 | AlphA 1 type I
collAgen preproprotein | 0.24 | 2.80 |
| IPI00020986.2 | LUM | Lumican
precursor | 0.23 | 20.71 |
| IPI00006663.1 | ALDH2 | Aldehyde
dehydrogenase, mitochondrial precursor | 0.20 | 8.51 |
| IPI00465084.5 | DES | Desmin | 0.19 | 14.71 |
| IPI00029723.1 | FSTL1 | Follistatin-related
protein 1 precursor | 0.16 | 11.36 |
| IPI00027782.1 | MMP3 | Stromelysin-1
precursor | 0.15 | 12.58 |
| IPI00216644.3 | GSTA1 | Glutathione
S-transferase A1 | 0.15 | 48.87 |
| IPI00400826.1 | CLU | Clusterin isoform
1 | 0.14 | 13.57 |
| IPI00176193.5 | COL14A1 | Splice Isoform 1 of
Collagen alpha 1(XIV) chain precursor | 0.14 | 7.41 |
| IPI00025426.1 | PZP | Pregnancy zone
protein precursor | 0.12 | 2.83 |
| IPI00218414.4 | CA2 | Carbonic anhydrase
II | 0.10 | 13.51 |
| IPI00478003.1 | A2M |
Alpha-2-macroglobulin precursor | 0.10 | 6.24 |
| IPI00025465.1 | OGN | Mimecan
precursor | 0.08 | 8.72 |
| IPI00550991.1 | SERPINA3 |
Alpha-1-antichymotrypsin precursor | 0.04 | 26.12 |
| IPI00019038.1 | LYZ | Lysozyme C
precursor | 0.03 | 31.08 |
Exploration of proteins in the
microenvironment associated with lung cancer invasion and
metastasis from the perspective of developmental biology
Enrichment of the full spectrum of
proteins in the lung cancer tissue culture CM in data from
different stages of the placenta
Winn et al (12) used an Affy HG-U133A microarray and
analyzed 36 placental-maternal interface specimens, including 9
specimens from placentas from full-term delivery and 27 specimens
from second trimester placentas, leading to a set of differential
gene expression profiles closely associated with placental
invasion. In the present study, we identified 828 high-confidence
proteins from the CM of the tissue culture corresponding to 9 cases
of lung cancer, wherein 511 proteins were present for at least two
cases and 427 proteins had corresponding gene IDs in the gene bank.
We used the GSEA software to conduct enrichment analysis of the 427
proteins based on the differential gene expression profiles of
specimens from the placental-maternal interface at different
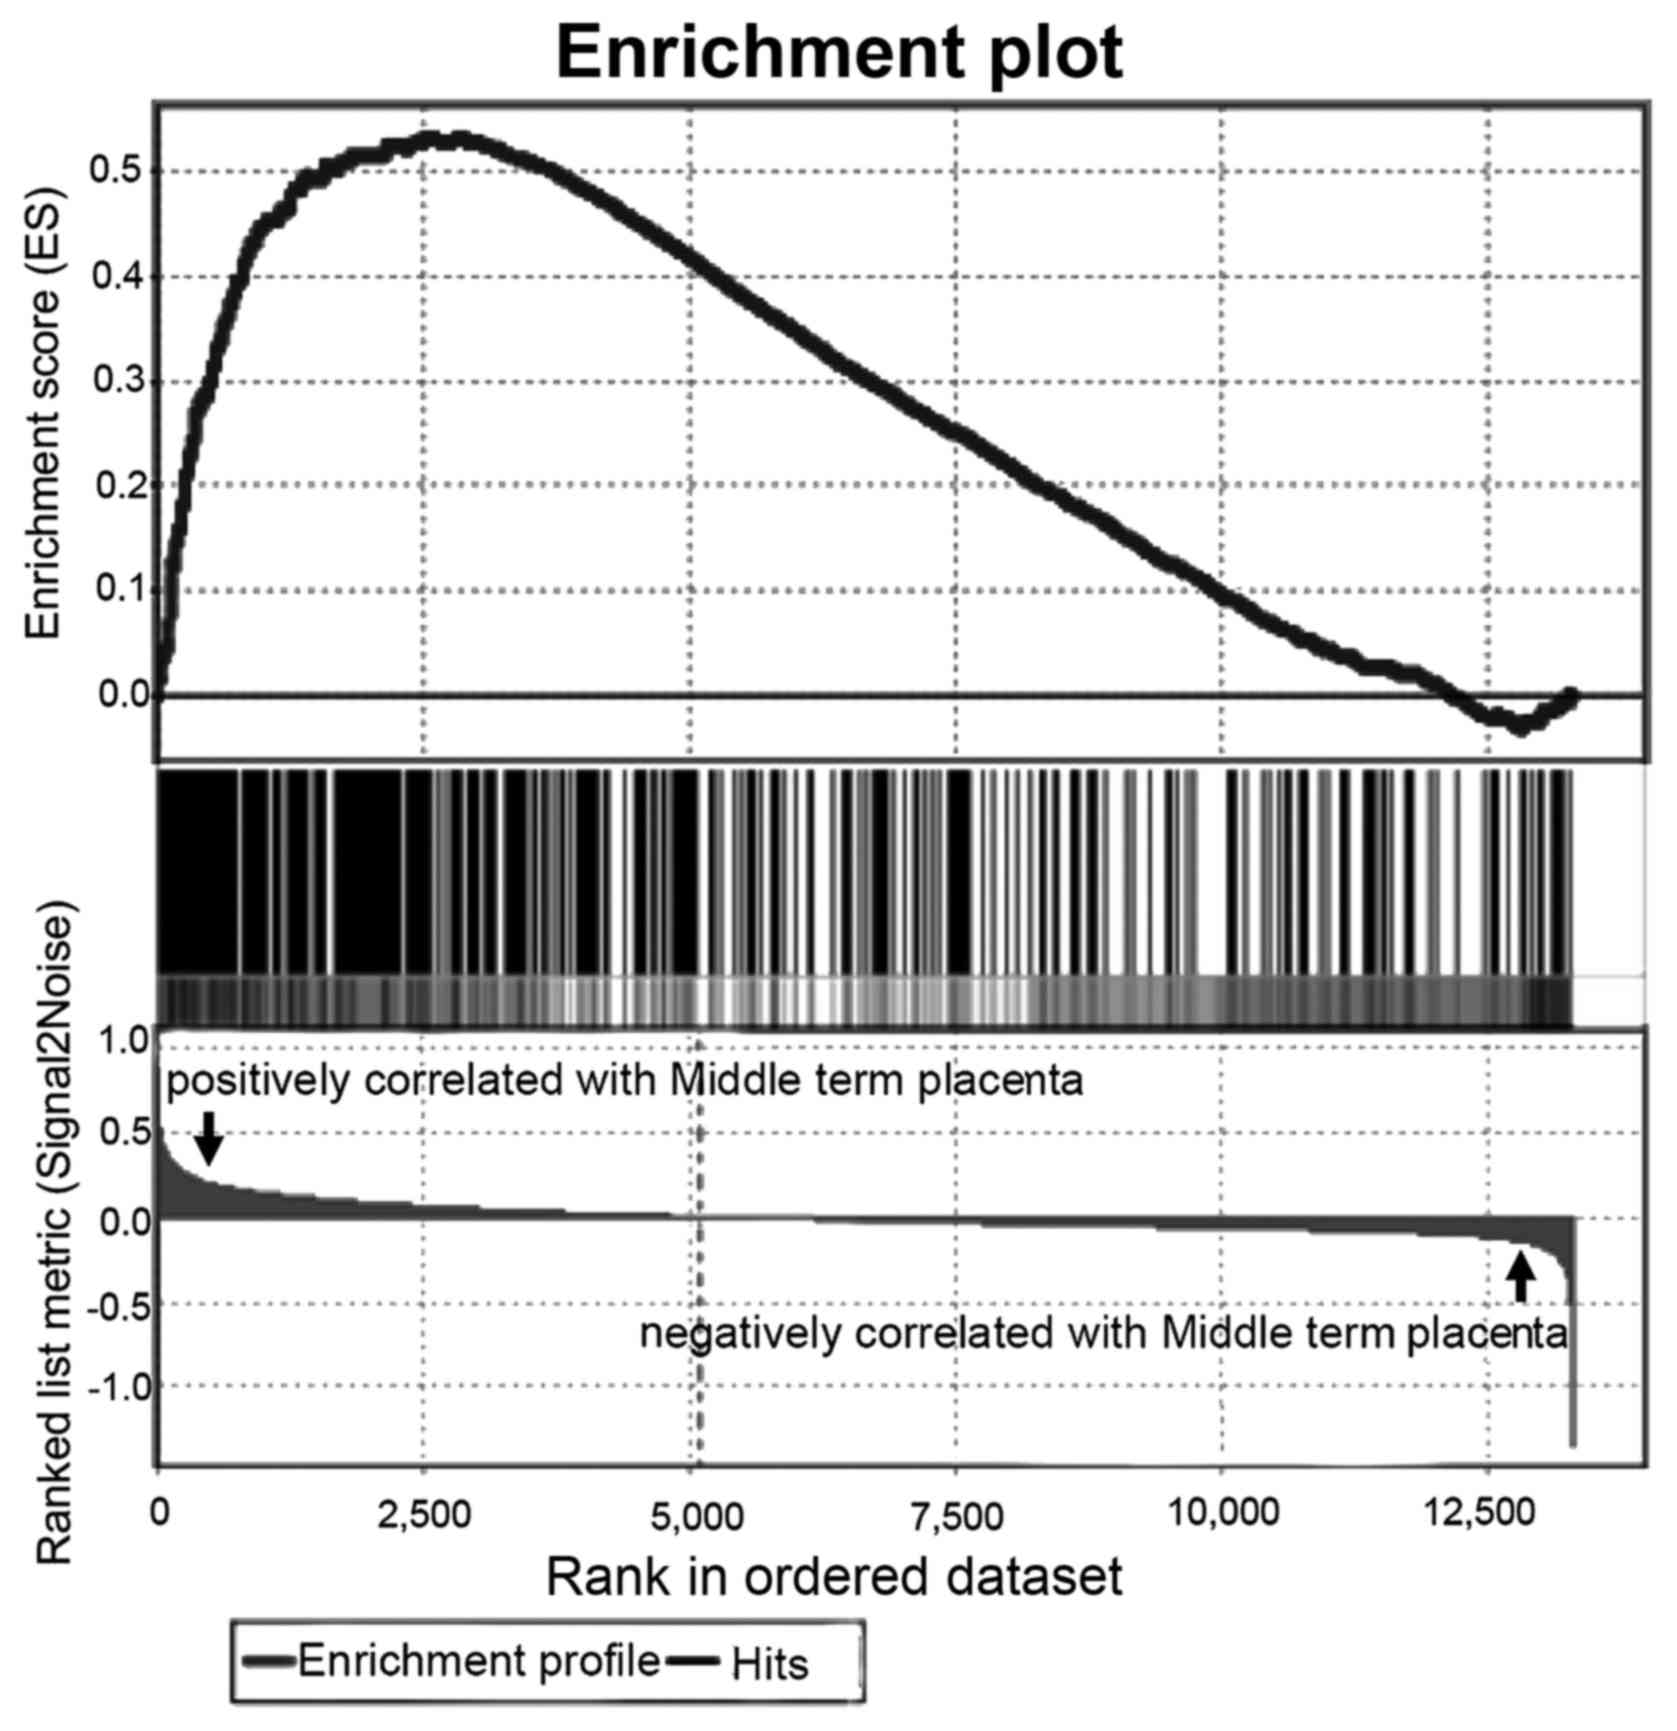
stages. The results indicated that these free proteins had
significant enrichment in the gene expression profile of the
mid-term placenta of stronger invasiveness (Fig. 3), in which 197 proteins contributed
significantly to the enrichment score (ES) (P=0.031, Table IV).
| Table IV.One hundred and ninety-seven free
proteins enriched in tumor tissue CM based on the midterm
maternal-placental interface expression profile. |
Table IV.
One hundred and ninety-seven free
proteins enriched in tumor tissue CM based on the midterm
maternal-placental interface expression profile.
| IPI accession
no. | Gene symbol | Gene
description | Cover (%) |
|---|
| IPI00218914.4 | ALDH1A1 | Aldehyde
dehydrogenase 1 family, member A1 | 6.40 |
| IPI00021891.5 | FGG | Fibrinogen gamma
chain | 7.88 |
| IPI00297284.1 | IGFBP2 | Insulin-like growth
factor binding protein 2, 36 kDa | 11.99 |
| IPI00027341.1 | CAPG | Capping protein
(actin filament), gelsolin-like | 7.18 |
| IPI00027350.1 | PRDX2 | Peroxiredoxin
2 | 14.65 |
| IPI00022200.2 | COL6A3 | Collagen, type VI,
alpha 3 | 5.42 |
| IPI00014230.1 | C1QBP | Complement
component 1, q subcomponent binding protein | 21.63 |
| IPI00027780.1 | MMP2 | Matrix
metallopeptidase 2 (gelatinase A, 72 kDa gelatinase, 72 kDa type IV
collagenase) | 12.58 |
| IPI00031420.1 | UGDH | UDP-glucose
dehydrogenase | 8.70 |
| IPI00028908.3 | NID2 | Nidogen 2
(osteonidogen) | 5.06 |
| IPI00028564.1 | GBP1 | Guanylate binding
protein 1, interferon-inducible, 67 kDa | 5.57 |
| IPI00556478.1 | SH3BGRL | SH3 domain binding
glutamic acid-rich protein like | 12.28 |
| IPI00029658.1 | EFEMP1 | EGF-containing
fibulin-like extracellular matrix protein 1 | 8.33 |
| IPI00465248.4 | ENO1 | Enolase 1,
(alpha) | 32.56 |
| IPI00218493.6 | HPRT1 | Hypoxanthine
phosphoribosyltransferase 1 (Lesch-Nyhan syndrome) | 24.42 |
| IPI00009802.1 | VCAN | Versican | 1.39 |
| IPI00219219.2 | LGALS1 | Lectin,
galactoside-binding, soluble, 1 (galectin 1) | 23.13 |
| IPI00411706.1 | ESD | Esterase
D/formylglutathione hydrolase | 19.50 |
| IPI00020986.2 | LUM | Lumican | 20.71 |
| IPI00556088.1 | LGALS3 | Lectin,
galactoside-binding, soluble, 3 | 15.66 |
| IPI00550991.1 | SERPINA3 | Serpin peptidase
inhibitor, clade A (alpha-1 antiproteinase, antitrypsin), member
3 | 26.12 |
| IPI00219525.9 | PGD | Phosphogluconate
dehydrogenase | 15.56 |
| IPI00012119.1 | DCN | Decorin | 31.40 |
| IPI00382428.4 | FBLN5 | Fibulin 5 | 8.07 |
| IPI00027223.2 | IDH1 | Isocitrate
dehydrogenase 1 (NADP+), soluble | 27.05 |
| IPI00017601.1 | CP | Ceruloplasmin
(ferroxidase) | 4.51 |
| IPI00024284.4 | HSPG2 | Heparan sulfate
proteoglycan 2 | 3.83 |
| IPI00021000.1 | SPP1 | Secreted
phosphoprotein 1 (osteopontin, bone sialoprotein I, early
T-lymphocyte activation 1) | 19.18 |
| IPI00400826.1 | CLU | CLU | 13.57 |
| IPI00010133.1 | CORO1A | Coronin, actin
binding protein, 1A | 11.71 |
| IPI00216298.5 | TXN | Thioredoxin | 32.94 |
| IPI00220362.4 | HSPE1 | Heat shock 10 kDa
protein 1 (chaperonin 10) | 25.74 |
| IPI00218836.1 | DBI | Diazepam binding
inhibitor (GABA receptor modulator, acyl-Coenzyme A binding
protein) | 34.62 |
| IPI00017696.1 | C1S | Complement
component 1, s subcomponent | 5.06 |
| IPI00028091.1 | ACTR3 | ARP3 actin-related
protein 3 homolog (yeast) | 10.53 |
| IPI00026199.1 | GPX3 | Glutathione
peroxidase 3 (plasma) | 13.72 |
| IPI00295741.3 | CTSB | Cathepsin B | 9.14 |
| IPI00011937.1 | PRDX4 | Peroxiredoxin
4 | 9.23 |
| IPI00021841.1 | APOA1 | Apolipoprotein
A-I | 15.73 |
| IPI00024095.2 | ANXA3 | Annexin A3 | 36.34 |
| IPI00001699.1 | PYCARD | PYD and CARD domain
containing | 22.46 |
| IPI00301579.3 | NPC2 | Niemann-Pick
disease, type C2 | 25.83 |
| IPI00021033.1 | COL3A1 | Collagen, type III,
alpha 1 (Ehlers-Danlos syndrome type IV, autosomal dominant) | 6.71 |
| IPI00027497.4 | GPI | Glucose phosphate
isomerase | 5.75 |
| IPI00021842.1 | APOE | Apolipoprotein
E | 17.35 |
| IPI00215911.2 | APEX1 | APEX nuclease
(multifunctional DNA repair enzyme) 1 | 11.04 |
| IPI00018219.1 | TGFBI | Transforming growth
factor, beta-induced, 68 kDa | 18.89 |
| IPI00027444.1 | SERPINB1 | Serpin peptidase
inhibitor, clade B (ovalbumin), member 1 | 15.57 |
| IPI00216134.2 | TPM1 | Tropomyosin 1
(alpha) | 13.03 |
| IPI00018146.1 | YWHAQ | Tyrosine
3-monooxygenase/tryptophan 5-monooxygenase activation protein,
theta polypeptide | 10.61 |
| IPI00021828.1 | CSTB | Cystatin B (stefin
B) | 12.24 |
| IPI00017292.1 | CTNNB1 | Catenin
(cadherin-associated protein), beta 1, 88 kDa | 6.27 |
| IPI00032292.1 | TIMP1 | TIMP
metallopeptidase inhibitor 1 | 17.87 |
| IPI00022810.1 | CTSC | Cathepsin C | 7.56 |
| IPI00176903.2 | PTRF | Polymerase I and
transcript release factor | 11.67 |
| IPI00217966.5 | LDHA | Lactate
dehydrogenase A | 30.42 |
| IPI00011229.1 | CTSD | Cathepsin D | 5.83 |
| IPI00304692.1 | RBMX | RNA binding motif
protein, X-linked | 6.91 |
| IPI00397526.1 | MYH10 | Myosin, heavy chain
10, non-muscle | 2.99 |
| IPI00465038.2 | FBLN2 | Fibulin 2 | 3.09 |
| IPI00465315.5 | CYCS | Cytochrome c,
somatic | 19.23 |
| IPI00019755.3 | GSTO1 | Glutathione
S-transferase omega 1 | 32.22 |
| IPI00003817.1 | ARHGDIB | Rho GDP
dissociation inhibitor (GDI) beta | 15.42 |
| IPI00005161.3 | ARPC2 | Actin related
protein 2/3 complex, subunit 2, 34 kDa | 16.00 |
| IPI00011654.2 | TUBB | Tubulin, beta | 38.51 |
| IPI00553177.1 | SERPINA1 | Serpin peptidase
inhibitor, clade A (alpha-1 antiproteinase, antitrypsin), member
1 | 7.66 |
| IPI00031812.1 | YBX1 | Y box binding
protein 1 | 11.18 |
| IPI00555616.1 | SOD2 | Superoxide
dismutase 2, mitochondrial | 19.37 |
| IPI00023673.1 | LGALS3BP | Lectin,
galactoside-binding, soluble, 3 binding protein | 10.60 |
| IPI00302592.1 | FLNA | Filamin A, alpha
(actin binding protein 280) | 5.25 |
| IPI00216691.4 | PFN1 | Profilin 1 | 11.51 |
| IPI00009904.1 | PDIA4 | Protein disulfide
isomerase family A, member 4 | 8.22 |
| IPI00299547.2 | LCN2 | Lipocalin 2
(oncogene 24p3) | 24.50 |
| IPI00219217.2 | LDHB | Lactate
dehydrogenase B | 21.02 |
| IPI00433214.1 | CKAP4 |
Cytoskeleton-associated protein 4 | 6.70 |
| IPI00006114.4 | SERPINF1 | Serpin peptidase
inhibitor, clade F (alpha-2 antiplasmin, pigment epithelium derived
factor), member 1 | 15.31 |
| IPI00220301.4 | PRDX6 | Peroxiredoxin
6 | 49.78 |
| IPI00013079.1 | EMILIN1 | Elastin microfibril
interfacer 1 | 5.71 |
| IPI00329633.5 | TARS | Threonyl-tRNA
synthetase | 8.02 |
| IPI00022733.1 | PLTP | Phospholipid
transfer protein | 18.14 |
| IPI00477225.1 | PLS3 | Plastin 3 (T
isoform) | 8.10 |
| IPI00375676.2 | FTL | Ferritin, light
polypeptide | 13.39 |
| IPI00015361.1 | PFDN5 | Prefoldin subunit
5 | 33.77 |
| IPI00013508.3 | ACTN1 | Actinin, alpha
1 | 13.68 |
| IPI00472102.1 | HSPD1 | Heat shock 60 kDa
protein 1 (chaperonin) | – |
| IPI00220271.2 | AKR1A1 | Aldo-keto reductase
family 1, member A1 (aldehyde reductase) | 23.15 |
| IPI00024993.4 | ECHS1 | Enoyl Coenzyme A
hydratase, short chain, 1, mitochondrial | 19.31 |
| IPI00307162.2 | VCL | Vinculin | 23.02 |
| IPI00419237.1 | LAP3 | Leucine
aminopeptidase 3 | 13.10 |
| IPI00022434.2 | ALB | Albumin | 44.84 |
| IPI00029260.2 | CD14 | CD14 molecule | 30.67 |
| IPI00298406.3 | HADH |
Hydroxyacyl-Coenzyme A dehydrogenase | 13.33 |
| IPI00219018.5 | GAPDH |
Glyceraldehyde-3-phosphate
dehydrogenase | 22.09 |
| IPI00013976.1 | LAMB1 | Laminin, beta
1 | 7.78 |
| IPI00554634.1 | CUTA | CutA divalent
cation tolerance homolog (E. coli) | 32.96 |
| IPI00028004.2 | PSMB3 | Proteasome
(prosome, macropain) subunit, beta type, 3 | 16.59 |
| IPI00289334.1 | FLNB | Filamin B, beta
(actin binding protein 278) | 14.24 |
| IPI00025084.2 | CAPNS1 | Calpain, small
subunit 1 | 11.80 |
| IPI00219446.4 | PEBP1 |
Phosphatidylethanolamine binding protein
1 | 15.59 |
| IPI00020672.3 | DPP3 |
Dipeptidyl-peptidase 3 | 10.05 |
| IPI00514377.3 | HSPA1A | Heat shock 70 kDa
protein 1A | 15.29 |
| IPI00003815.1 | ARHGDIA | Rho GDP
dissociation inhibitor (GDI) alpha | 38.24 |
| IPI00514090.1 | LTA4H | Leukotriene A4
hydrolase | 25.93 |
| IPI00005159.2 | ACTR2 | ARP2 actin-related
protein 2 homolog (yeast) | 18.05 |
| IPI00007853.1 | IFI30 | Interferon,
gamma-inducible protein 30 | 32.18 |
| IPI00032140.2 | SERPINH1 | Serpin peptidase
inhibitor, clade H (heat shock protein 47), member 1, (collagen
binding protein 1) | 33.73 |
| IPI00012726.3 | PABPC4 | Poly(A) binding
protein, cytoplasmic 4 (inducible form) | 6.97 |
| IPI00027933.1 | PSMB10 | Proteasome
(prosome, macropain) subunit, beta type, 10 | 19.05 |
| IPI00419258.3 | HMGB1 | High-mobility group
box 1 | 16.36 |
| IPI00298497.3 | FGB | Fibrinogen beta
chain | 6.11 |
| IPI00003590.1 | QSOX1 | Quiescin Q6
sulfhydryl oxidase 1 | 11.59 |
| IPI00183695.6 | S100A10 | S100 calcium
binding protein A10 | 40.62 |
| IPI00554482.1 | NPM1 | Nucleophosmin
(nucleolar phosphoprotein B23, numatrin) | 11.41 |
| IPI00017672.2 | NP | Nucleoside
phosphorylase | 53.58 |
| IPI00180675.4 | TUBA1A | Tubulin, alpha
1a | 7.76 |
| IPI00026781.2 | FASN | Fatty acid
synthase | 4.90 |
| IPI00329200.4 | RANBP5 | RAN binding protein
5 | – |
| IPI00465260.1 | GARS | Glycyl-tRNA
synthetase | 4.79 |
| IPI00550073.1 | CALM3 | Calmodulin 3
(phosphorylase kinase, delta) | 22.45 |
| IPI00376005.1 | EIF5A | Eukaryotic
translation initiation factor 5A | 23.53 |
| IPI00219622.2 | PSMA2 | Proteasome
(prosome, macropain) subunit, alpha type, 2 | 17.60 |
| IPI00005087.1 | TMOD3 | Tropomodulin 3
(ubiquitous) | 16.19 |
| IPI00419262.1 | PPIB | Peptidylprolyl
isomerase B (cyclophilin B) | – |
| IPI00290279.1 | ADK | Adenosine
kinase | 13.81 |
| IPI00007427.1 | AGR2 | Anterior gradient
homolog 2 (Xenopus laevis) | 22.29 |
| IPI00413451.1 | SERPINB6 | Serpin peptidase
inhibitor, clade B (ovalbumin, member 6 | 20.00 |
| IPI00031461.1 | GDI2 | GDP dissociation
inhibitor 2 | 8.54 |
| IPI00028931.1 | DSG2 | Desmoglein 2 | 3.13 |
| IPI00026216.4 | NPEPPS | Aminopeptidase
puromycin sensitive | 6.42 |
| IPI00550363.1 | TAGLN2 | Transgelin 2 | 25.63 |
| IPI00418262.3 | ALDOC | Aldolase C,
fructose-bisphosphate | 25.34 |
| IPI00008527.1 | RPLP1 | Ribosomal protein,
large, P1 | 51.75 |
| IPI00299155.5 | PSMA4 | Proteasome
(prosome, macropain) subunit, alpha type, 4 | 17.62 |
| IPI00479786.1 | KHSRP | KH-type splicing
regulatory protein (FUSE binding protein 2) | 4.37 |
| IPI00303318.2 | FAM49B | Family with
sequence similarity 49, member B | 28.70 |
| IPI00555900.1 | FKSG30 | Kappa-actin | 12.00 |
| IPI00176193.5 | COL14A1 | Collagen, type XIV,
alpha 1 (undulin) | 7.47 |
| IPI00413959.2 | CLSTN1 | Calsyntenin 1 | 11.01 |
| IPI00021440.1 | ACTG1 | Actin, gamma 1 | 17.60 |
| IPI00556607.1 | PSMB4 | Proteasome
(prosome, macropain) subunit, beta type, 4 | 17.42 |
| IPI00025861.2 | CDH1 | Cadherin 1, type 1,
E-cadherin (epithelial) | 9.10 |
| IPI00220644.6 | PKM2 | Pyruvate kinase,
muscle | 14.75 |
| IPI00257882.5 | PEPD | Peptidase D | 11.76 |
| IPI00106642.4 | SDF2L1 | Stromal
cell-derived factor 2-like 1 | 6.46 |
| IPI00013698.1 | ASAH1 | N-acylsphingosine
amidohydrolase (acid ceramidase) 1 | 9.25 |
| IPI00032293.1 | CST3 | Cystatin C (amyloid
angiopathy and cerebral hemorrhage) | 25.34 |
| IPI00298281.3 | LAMC1 | Laminin, gamma 1
(formerly LAMB2) | 5.97 |
| IPI00026185.4 | CAPZB | Capping protein
(actin filament) muscle Z-line, beta | 24.25 |
| IPI00298547.3 | PARK7 | Parkinson disease
(autosomal recessive, early onset) 7 | 30.16 |
| IPI00297646.2 | COL1A1 | Collagen, type I,
alpha 1 | 2.80 |
| IPI00298853.5 | GC | Group-specific
component (vitamin D binding protein) | 22.36 |
| IPI00553185.2 | CCT3 | Chaperonin
containing TCP1, subunit 3 (gamma) | 11.38 |
| IPI00292771.3 | NUMA1 | Nuclear mitotic
apparatus protein 1 | 1.80 |
| IPI00293867.6 | DDT | D-dopachrome
tautomerase | 17.95 |
| IPI00008561.1 | MMP1 | Matrix
metallopeptidase 1 (interstitial collagenase) | 8.96 |
| IPI00298994.3 | TLN1 | Talin 1 | 1.65 |
| IPI00002460.2 | ANXA7 | Annexin A7 | 9.02 |
| IPI00297550.7 | F13A1 | Coagulation factor
XIII, A1 polypeptide | 6.16 |
| IPI00465439.4 | ALDOA | Aldolase A,
fructose-bisphosphate | 7.16 |
| IPI00004656.1 | B2M |
Beta-2-microglobulin | 26.89 |
| IPI00216318.4 | YWHAB | Tyrosine
3-monooxygenase/tryptophan 5-monooxygenase activation protein, beta
polypeptide | 20.00 |
| IPI00296534.1 | FBLN1 | Fibulin 1 | 14.20 |
| IPI00003818.1 | KYNU | Kynureninase
(L-kynurenine hydrolase) | 16.99 |
| IPI00008223.3 | RAD23B | RAD23 homolog B (S.
cerevisiae) | 7.33 |
| IPI00440493.2 | ATP5A1 | ATP synthase, H+
transporting, mitochondrial F1 complex, alpha subunit 1, cardiac
muscle | 5.42 |
| IPI00219445.1 | PSME3 | Proteasome
(prosome, macropain) activator subunit 3 (PA28 gamma; Ki) | 16.48 |
| IPI00016862.1 | GSR | Glutathione
reductase | 12.26 |
| IPI00220991.2 | AP2B1 | Adaptor-related
protein complex 2, beta 1 subunit | – |
| IPI00215965.1 | HNRNPA1 | Heterogeneous
nuclear ribonucleoprotein A1 | 11.88 |
| IPI00010740.1 | SFPQ | Splicing factor
proline/glutamine-rich (polypyrimidine tract binding protein
associated) | 5.08 |
| IPI00027626.2 | CCT6A | Chaperonin
containing TCP1, subunit 6A (zeta 1) | 6.42 |
| IPI00398779.3 | PLEC1 | Plectin 1,
intermediate filament binding protein 500 kDa | 0.49 |
| IPI00027463.1 | S100A6 | S100 calcium
binding protein A6 | 51.11 |
| IPI00026087.1 | BANF1 | Barrier to
autointegration factor 1 | 29.21 |
| IPI00305969.1 | EEF1D | Eukaryotic
translation elongation factor 1 delta (guanine nucleotide exchange
protein) | 4.35 |
| IPI00177728.3 | CNDP2 | CNDP dipeptidase 2
(metallopeptidase M20 family) | 26.53 |
| IPI00021347.1 | UBE2L3 |
Ubiquitin-conjugating enzyme E2L 3 | 21.43 |
| IPI00414676.5 | HSP90AB1 | Heat shock protein
90 kDa alpha (cytosolic), class B member 1 | 7.33 |
| IPI00216319.2 | YWHAH | Tyrosine
3-monooxygenase/tryptophan 5-monooxygenase activation protein, eta
polypeptide | 11.84 |
| IPI00013890.1 | SFN | Stratifin | 41.53 |
| IPI00556148.1 | CFH | Complement factor
H | 4.14 |
| IPI00329801.10 | ANXA5 | Annexin A5 | 40.62 |
| IPI00455315.3 | ANXA2 | Annexin A2 | 48.52 |
| IPI00009771.4 | LMNB2 | Lamin B2 | 4.33 |
| IPI00299000.1 | PA2G4 |
Proliferation-associated 2G4, 38 kDa | 16.24 |
| IPI00297779.6 | CCT2 | Chaperonin
containing TCP1, subunit 2 (beta) | 13.67 |
| IPI00168184.5 | PPP2R1A | Protein phosphatase
2 (formerly 2A), regulatorysubunit A, alpha isoform | 12.93 |
| IPI00012074.2 | HNRNPR | Heterogeneous
nuclear ribonucleoprotein R | 4.40 |
| IPI00018768.1 | TSN | Translin | 27.19 |
| IPI00005614.4 | SPTBN1 | Spectrin, beta,
non-erythrocytic 1 | 10.77 |
| IPI00008524.1 | PABPC1 | Poly (A) binding
protein, cytoplasmic 1 | 15.90 |
| IPI00013895.1 | S100A11 | S100 calcium
binding protein A11 | 56.19 |
| IPI00010796.1 | P4HB |
Procollagen-proline, 2-oxoglutarate
4-dioxygenase (proline 4-hydroxylase), beta polypeptide | 18.31 |
| IPI00100160.3 | CAND1 | Cullin-associated
and neddylation-dissociated 1 | 16.38 |
| IPI00007752.1 | TUBB2C | Tubulin, beta
2C | 45.17 |
| IPI00007118.1 | SERPINE1 | Serpin peptidase
inhibitor, clade E (nexin, plasminogen activator inhibitor type 1),
member 1 | 23.38 |
| IPI00451401.2 | TPI1 | Triosephosphate
isomerase 1 | 42.17 |
HPRT1 exhibits the most significant
enrichment among the 197 enriched proteins and is associated with
worse DFS and OS
Hypoxanthine-guanine phosphoribosyltransferase
(HPRT) is a housekeeping gene involved in nervous system
development. HPRT deficiency causes the dysregulation of many
cellular functions, including cell cycle control, proliferation,
RNA metabolism, DNA replication and DNA repair (13). In the present study, HPRT1 exhibited
the most significant enrichment among the 197 aforementioned
proteins (Table IV).
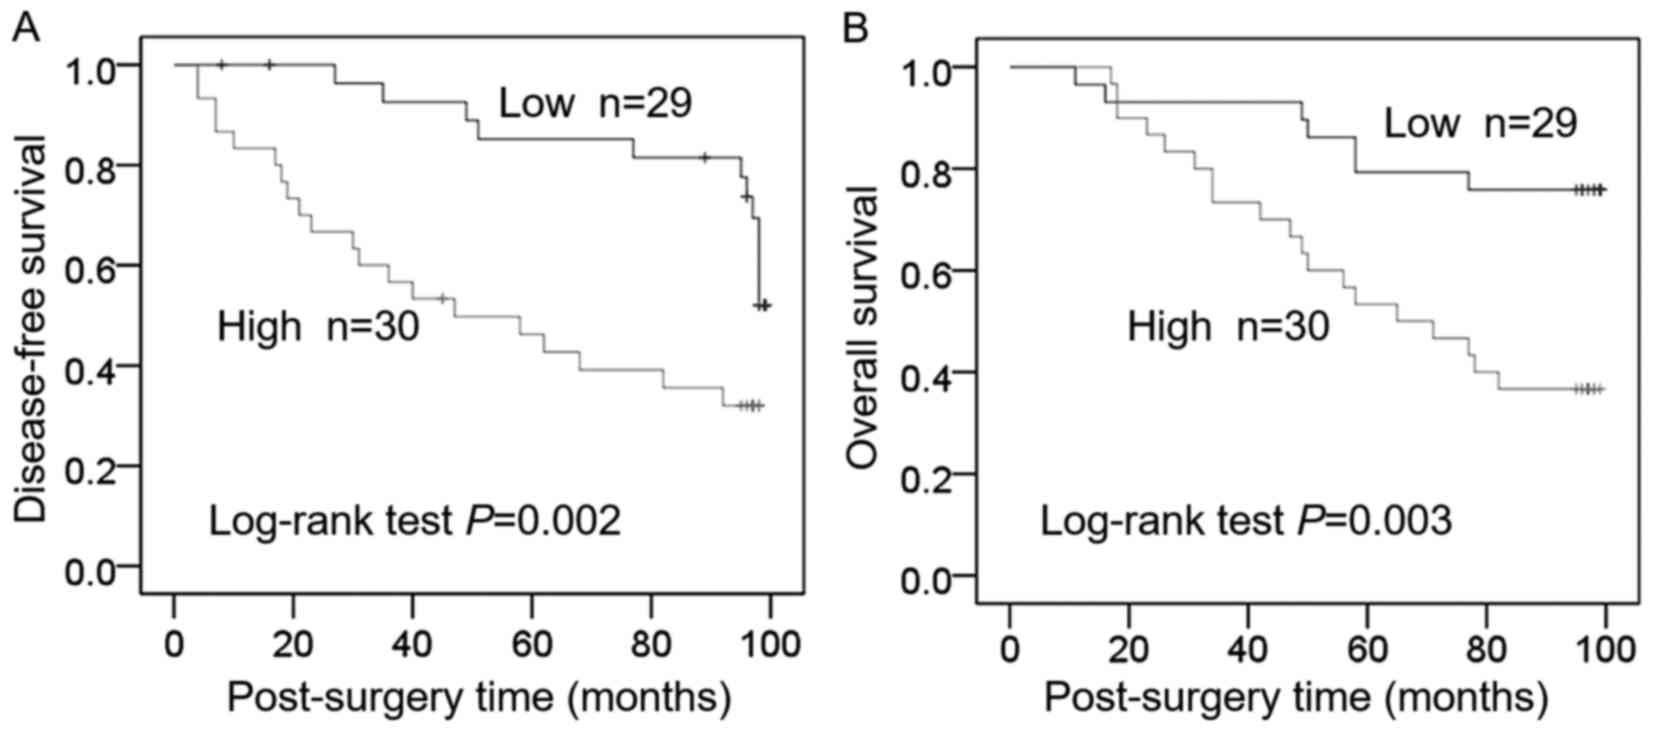
Elevated plasma levels of HPRT1 protein were
associated with poor prognosis. The median HPRT1 concentration
(0.50 ng/ml) was defined as a cutoff point. The patients were
divided into a low HPRT1 group (n=29) and a high HPRT1 group
(n=30). Comparisons of Kaplan-Meier curves revealed lower DFS and
OS among patients with high HPRT1 (P=0.002 and P=0.003,
respectively) (Fig. 4).
Discussion
In the present study, after a brief in vitro
culture of lung cancer and normal bronchial tissues, we analyzed
proteins that were released into serum-free CM (all ingredients are
known). This system can accurately reflect the tumor
microenvironment. We used LTQ MS with the characteristics of high
scanning speed to identify the full spectrum of the total protein
in CM samples and completed the initial establishment of a lung
cancer-associated free protein database. The primary organ culture
model eliminates the interference from high-abundance proteins,
reduces the dynamic range of the full spectrum of proteins, and is
suitable for label-free quantitative proteomics. Therefore, we
introduced a label-free quantitative parameter, spectral count, to
identify differential free proteins in the CM while obtaining the
full spectrum of proteins. The use of biostatistics and
bioinformatics enables us to standardize MS data, identify
differential proteins and establish differential protein profiles
that can correctly distinguish cancer and paracancerous normal
tissues. We used protein annotation, as well as GO, network and
pathway analysis, to investigate the signaling pathways underlying
changes in free proteins in the lung cancer microenvironment.
In the present study, the proteins in the lung
cancer CM were significantly enriched in gene clusters associated
with the midterm maternal-placental interface of strong
invasiveness. Similar to the trophoblast cell-mediated invasion
that occurs in the maternal-placental interface, tumor invasion
occurs at the boundary where the tumor and host interact, and the
exchange of cytokines and related proteases between tumor cells and
stromal cells further facilitates tumor cell migration (14). We identified that the full spectrum
of tumor tissue CM likely reflects the dynamic change in this
microenvironment. It is noteworthy that compared with the
heterogeneity and multiple genetic changes in tumor occurrence and
development, the individual difference in embryonic development is
much smaller. It may be possible to simplify the interpretation of
tumor invasion from the perspective of developmental biology.
Since Lobstein et al introduced the concept
of the embryonic origin of tumors in 1829, the similarities in
biological behaviors between embryo implantation and tumor
invasion/metastasis have received increasing attention. Embryo
implantation is under the complex regulatory network involving
hormones, cytokines, the immune system and genes, and implantation
is a precise physiological process with strict temporal and spatial
regulation, whereas invasion is a malignant pathological life
phenomenon of malignancies with deregulated temporal and spatial
control. During the embryonic implantation process, ‘false
malignant’ trophoblast cells of blastocysts show striking
similarities with cancer cells in terms of cell proliferation and
differentiation, signal transduction pathways for invasion,
vascular erosion and angiogenesis, immune escape and apoptosis
(15). Research on embryo
implantations has revealed that during the process of embryonic
implantation into the endometrium, a large number of oncogenes are
expressed that are also expressed during the process of tumor
formation. These oncogenes include c-Met, c-fms, c-Ki, FGF-2 and
Src (15). Numerous studies have
revealed that matrix metalloproteinases (MMPs), the ECM and
numerous cell adhesion molecules are also involved in the
implantation of early embryonic trophoblast cells into the
endometrium and in the process of tumor invasion and metastasis
(17,18).
Winn et al (12) used chips to analyze
placental-maternal interface specimens and obtained differential
gene expression profiles that were closely associated with
placental invasion. We identified a total of 828 high-confidence
proteins in the CM from the tumor tissue culture corresponding to 9
cases of lung cancer, wherein 511 proteins were present for at
least two cases, and 427 proteins had corresponding gene IDs in the
gene bank. We used the GSEA software to conduct enrichment analysis
of the 427 proteins based on the differential expression profiles
of placental-maternal interfaces at different stages. The results
indicated that 197 free proteins had significant enrichment in the
gene expression profiles of the midterm placenta. We also performed
a further in-depth study of the SPP1, TIMP-1 and YWHAB expression
in NSCLC. Using the lung cancer tissue microarray constructed in
our laboratory, we assessed the expression of these proteins for
samples corresponding to 318 cases of NSCLC. The results revealed
that the expression levels of SPP1 (19), TIMP-1 and YWHAB (20) in lung tumor tissues and lymph node
metastatic foci were significantly higher than those in normal lung
tissues and the expression of these proteins was correlated to
lymph node metastasis and clinical stage. In addition,
overexpression of SPP1 promoted ECM invasion by lung cancer
cells.
HPRT1 exhibited the most significant enrichment
among the 197 significantly enriched proteins and was associated
with worse DFS and OS for the lung cancer patients included in the
present study. Several studies have demonstrated that HPRT1
mutations are associated with the exposure of lung epithelial cells
to particles, which induces massive neutrophil recruitment and is
correlated with tumor formation (21,22).
The in vitro coincubation of rat lung epithelial cells with
bronchoalveolar lavage (BAL) cells isolated from particle-treated
rats increased mutation frequency in the HPRT gene (23). The downregulation of
etoposide-induced p38 mitogen-activated protein kinase
(MAPK)-mediated expression of excision repair cross-complementary 1
(ERCC1) could reduce significant increases in etoposide-induced
HPRT gene mutation frequency and decrease the cellular ability to
repair DNA damage in etoposide-exposed human NSCLC cells (24). In secondhand smoke research, human
lung cancer cells exposed to sidestream smoke for 24 h exhibited
significantly elevated levels of oxidative DNA damage to HPRT,
which contributed to lung carcinogenesis (25).
In conclusion, embryonic development and tumor
formation demonstrate similar behaviors and underlying molecular
mechanisms, and tumors can be considered a special ‘organ’ due to
an abnormal regulation of organ formation (26). Accordingly, the present study
investigated lung cancer based on an embryonic development model
and combined systems biology and developmental biology to simplify
the tumor analysis model and thus identify the protein profiles
associated with lung cancer invasion and metastasis.
Acknowledgements
The authors thank Professor Wantao Ying and Dr Wei
Jia, for their technical support of LC-MS analysis.
Funding
The present study was funded by the CAMS Innovation
Fund for Medical Sciences (CIFMS) (grant no. 2016-I2M-1-001) and
the National Basic Research Program of China (grant no.
2014CBA02004).
Availability of data and materials
The datasets used during the present study are
available from the corresponding author upon reasonable
request.
Authors' contributions
LF and TX conceived and designed the study. LF, YY,
ML and JS performed the experiments. TX and ML wrote the paper. LF,
YG, JS and SC reviewed and edited the manuscript and were also
involved in the conception of this study. All authors read and
approved the manuscript and agree to be accountable for all aspects
of the research in ensuring that the accuracy or integrity of any
part of the work are appropriately investigated and resolved.
Ethics approval and consent to
participate
All patients provided written informed consent
before surgery, and treatments were performed in accordance with
current ethical principles of the Independent Ethics Committee,
Cancer Hospital, Chinese Academy of Medical Sciences.
Patient consent for publication
Not applicable.
Competing interests
The authors state that they have no competing
interests.
References
|
1
|
Siegel RL, Miller KD and Jemal A: Cancer
statistics, 2015. CA Cancer J Clin. 64:5–29. 2015. View Article : Google Scholar
|
|
2
|
Torre LA, Bray F, Siegel RL, Ferlay J,
Lortet-Tieulent J and Jemal A: Global cancer statistics, 2012. CA
Cancer J Clin. 65:87–108. 2015. View Article : Google Scholar : PubMed/NCBI
|
|
3
|
Krebs ET: Cancer and the embryonal
hypothesis. Calif Med. 66:270–271. 1947.PubMed/NCBI
|
|
4
|
Pierce GB: The cancer cell and its control
by the embryo. Rous-Whipple Award lecture. Am J Pathol.
113:117–124. 1983.
|
|
5
|
Holtan SG, Creedon DJ, Haluska P and
Markovic SN: Cancer and pregnancy: Parallels in growth, invasion,
and immune modulation and implications for cancer therapeutic
agents. Mayo Clin Proc. 84:985–1000. 2009. View Article : Google Scholar : PubMed/NCBI
|
|
6
|
Rozhok AI and DeGregori J: Toward an
evolutionary model of cancer: Considering the mechanisms that
govern the fate of somatic mutations. Proc Natl Acad Sci USA.
112:8914–8921. 2015. View Article : Google Scholar : PubMed/NCBI
|
|
7
|
Sell S, Nicolini A, Ferrari P and Biava
PM: Cancer: A problem of developmental biology; scientific evidence
for reprogramming and differentiation therapy. Curr Drug Targets.
17:1103–1110. 2015. View Article : Google Scholar
|
|
8
|
Xiao T, Ying W, Li L, Hu Z, Ma Y, Jiao L,
Ma J, Cai Y, Lin D, Guo Si, et al: An approach to studying lung
cancer-related proteins in human blood. Mol Cell Proteomics.
4:1480–1486. 2005. View Article : Google Scholar : PubMed/NCBI
|
|
9
|
Skinner J, Kotliarov Y, Varma S, Mine KL,
Yambartsev A, Simon R, Huyen Y and Morgun A: Construct and compare
gene coexpression networks with DAPfinder and DAPview. BMC
Bioinformatics. 12:2862011. View Article : Google Scholar : PubMed/NCBI
|
|
10
|
Mootha VK, Lindgren CM, Eriksson KF,
Subramanian A, Sihag S, Lehar J, Puigserver P, Carlsson E,
Ridderstråle M, Laurila E, et al: PGC-1alpha-responsive genes
involved in oxidative phosphorylation are coordinately
downregulated in human diabetes. Nat Genet. 34:267–273. 2003.
View Article : Google Scholar : PubMed/NCBI
|
|
11
|
Subramanian A, Tamayo P, Mootha VK,
Mukherjee S, Ebert BL, Gillette MA, Paulovich A, Pomeroy SL, Golub
TR, Lander ES, et al: Gene set enrichment analysis: A
knowledge-based approach for interpreting genome-wide expression
profiles. Proc Natl Acad Sci USA. 102:15545–15550. 2005. View Article : Google Scholar : PubMed/NCBI
|
|
12
|
Winn VD, Haimov-Kochman R, Paquet AC, Yang
YJ, Madhusudhan MS, Gormley M, Feng KT, Bernlohr DA, McDonagh S,
Pereira L, et al: Gene expression profiling of the human
maternal-fetal interface reveals dramatic changes between
midgestation and term. Endocrinology. 148:1059–1079. 2007.
View Article : Google Scholar : PubMed/NCBI
|
|
13
|
Kang TH, Park Y, Bader JS and Friedmann T:
The housekeeping gene hypoxanthine guanine
phosphoribosyltransferase (HPRT) regulates multiple developmental
and metabolic pathways of murine embryonic stem cell neuronal
differentiation. PLoS One. 8:e749672013. View Article : Google Scholar : PubMed/NCBI
|
|
14
|
Hofmann UB, Eggert AA, Blass K, Bröcker EB
and Becker JC: Expression of matrix metalloproteinases in the
microenvironment of spontaneous and experimental melanoma
metastases reflects the requirements for tumor formation. Cancer
Res. 63:8221–8225. 2003.PubMed/NCBI
|
|
15
|
Murray MJ and Lessey BA: Embryo
implantation and tumor metastasis: Common pathways of invasion and
angiogenesis. Semin Reprod Endocrinol. 17:275–290. 1999. View Article : Google Scholar : PubMed/NCBI
|
|
16
|
Dvorak P, Dvorakova D and Hampl A:
Fibroblast growth factor signaling in embryonic and cancer stem
cells. FEBS Lett. 580:2869–2874. 2006. View Article : Google Scholar : PubMed/NCBI
|
|
17
|
Xu P, Wang Y, Piao Y, Bai S, Xiao Z, Jia
Y, Luo S and Zhuang L: Effects of matrix proteins on the expression
of matrix metalloproteinase-2, −9, and −14 and tissue inhibitors of
metalloproteinases in human cytotrophoblast cells during the first
trimester. Biol Reprod. 65:240–246. 2001. View Article : Google Scholar : PubMed/NCBI
|
|
18
|
Umezawa M, Saito Y, Tanaka-Hattori N,
Takeda K, Ihara T and Sugamata M: Expression profile of
extracellular matrix and adhesion molecules in the development of
endometriosis in a mouse model. Reprod Sci. 19:1365–1372. 2012.
View Article : Google Scholar : PubMed/NCBI
|
|
19
|
Hu Z, Lin D, Yuan J, Xiao T, Zhang H, Sun
W, Han N, Ma Y, Di X, Gao M, et al: Overexpression of osteopontin
is associated with more aggressive phenotypes in human non-small
cell lung cancer. Clin Cancer Res Clin Cancer Res. 11:4646–4652.
2005. View Article : Google Scholar : PubMed/NCBI
|
|
20
|
Liu Y, Lin D, Xiao T, Ma Y, Hu Z, Zheng H,
Zheng S, Liu Y, Li M, Li L, et al: An immunohistochemical
analysis-based decision tree model for estimating the risk of
lymphatic metastasis in pN0 squamous cell carcinomas of the lung.
Histopathology. 59:882–891. 2011. View Article : Google Scholar : PubMed/NCBI
|
|
21
|
Borm PJ and Driscoll K: Particles,
inflammation and respiratory tract carcinogenesis. Toxicol Lett.
88:109–113. 1996. View Article : Google Scholar : PubMed/NCBI
|
|
22
|
Driscoll KE: Role of inflammation in the
development of rat lung tumors in response to chronic particle
exposure. Inhalation Toxicology. 8:139–153. 1996.
|
|
23
|
Driscoll KE, Deyo LC, Carter JM, Howard
BW, Hassenbein DG and Bertram TA: Effects of particle exposure and
particle-elicited inflammatory cells on mutation in rat alveolar
epithelial cells. Carcinogenesis. 18:423–430. 1997. View Article : Google Scholar : PubMed/NCBI
|
|
24
|
Tsai MS, Weng SH, Chen HJ, Chiu YF, Huang
YC, Tseng SC, Kuo YH and Lin YW: Inhibition of p38 MAPK-dependent
excision repair cross-complementing 1 expression decreases the DNA
repair capacity to sensitize lung cancer cells to etoposide. Mol
Cancer Ther. 11:561–571. 2012. View Article : Google Scholar : PubMed/NCBI
|
|
25
|
Sarker AH, Chatterjee A, Williams M, Lin
S, Havel C, Jacob P III, Boldogh I, Hazra TK, Talbot P and Hang B:
NEIL2 protects against oxidative DNA damage induced by sidestream
smoke in human cells. PloS One. 9:e902612014. View Article : Google Scholar : PubMed/NCBI
|
|
26
|
Reya T, Morrison SJ, Clarke MF and
Weissman IL: Stem cells, cancer, and cancer stem cells. Nature.
414:105–111. 2001. View
Article : Google Scholar : PubMed/NCBI
|