Introduction
Over 350,000 individuals are diagnosed with renal
cell carcinomas (RCC) every year, with ~140,000 mortalities
(1,2). Cancer statistics from 2015 estimated
that >38,270 males and 23,290 females were diagnosed with tumors
of the kidney and renal pelvis (3).
The main type of malignant kidney cancer is clear cell RCC (ccRCC),
which accounts for nearly 70% of cases (4). However, relative symptoms of RCC are
not obvious. To date, no precise tumor biomarkers have been found
to be specific for its diagnosis or prognosis (5). RCCs can be diagnosed by imaging
studies, including computed tomography and ultrasound, and a number
of cases are now found on routine tests (6). RCC has a higher risk of recurring
between 3–5 years after resection, and the 5-year survival rate of
metastatic RCC is <10% (7,8).
Certain biomarkers for kidney cancer have been noted
in recent years. B7H4 is expressed in the endothelium of tumor
cells and tumor blood vessels, but not in the normal renal tissues.
Therefore, low B7H4 expression is a relatively positive predictor
of overall survival in patients with kidney cancer (9–11).
However, high sensitivity and specific biomarkers are still lacking
in patients with metastatic RCC. Therefore, the investigation of
complex interactions among prognostic factors and the comprehensive
evaluation based on clinical information of patients with ccRCC is
crucial for the selection of treatment options and prognosis.
Due to the high specificity of long-chain non-coding
RNAs (lncRNAs) in tissues, serum, plasma, urine and saliva, the
focus on the study of lncRNAs in cancer continues (12). Previous studies showed that certain
lncRNAs were also potential diagnostic and prognostic biomarkers
for RCC (13–16). However, these were mainly small
sample studies that concentrated on the association between a
single lncRNA and prognosis. Small sample studies lack a
comprehensive analysis based on large sample size genome sequencing
data, which fails to explain comprehensively whether abnormal
lncRNAs are associated with sex, survival or other clinical
features.
In recent years, The Cancer Genome Atlas (TCGA)
database has introduced a novel approach for this genomic analysis
(17). The aim of the present study
was to find novel lncRNA tags for the prognosis of ccRCC through
data mining in TCGA database. By constructing an integrated lncRNA
expression profile, combining the clinical features, a novel
candidate signature was identified for the overall survival (OS)
prediction of ccRCC patients.
Materials and methods
Patients and data collection
RNA sequencing data (level 3) of 537 individuals
with ccRCC were extracted from TCGA (http://cancergenome.nih.gov) database up to May 26,
2016. First, the following inclusion criteria were applied: i) A
histological diagnosis of ccRCC. The following exclusion criteria
were then applied: i) patients with ccRCC plus other malignancies;
ii) tissue samples without complete RNA sequencing data; and iii)
patients who received radiotherapy and chemotherapy prior to
surgery. As a result, 454 patients with RNA sequencing data and
corresponding clinical features were listed. Also, the lncRNA
expression profile of normal tissue samples was available in 72
patients. Based on the seventh American Joint Committee on Cancer
TNM staging system (18), among all
the patients, there were 209 with tumor stage I, 51 with tumor
stage II, 114 with tumor stage III and 80 with tumor stage IV.
Furthermore, specimens and paired adjacent non-tumor
tissues were obtained from 17 ccRCC patients from Jiangsu Cancer
Hospital (Nanjing, Jiangsu, China). None of these patients have
received preoperative chemoradiation. Adjacent non-tumor tissues
were located >5 cm away from the edge of the tumor. Tissue
samples were stored in RNAlater (Ambion; Thermo Fisher Scientific,
Inc., Waltham, MA, USA) and frozen at −80°C until use (17). The study was approved by the Ethics
Committee of Zhongda Hospital of Southeast University (Nanjing,
Jiangsu, China). Informed consent was obtained from all individual
participants included in the study.
Data mining and analysis of
differentially expressed lncRNA
All lncRNA sequencing original reads were
post-processed using TCGA RNASeqv2 system and normalized (19). In the present study, lncRNAs with
their description from NCBI (https://www.ncbi.nlm.nih.gov/gene/) and Ensemble
(http://www.ensembl.org/index.html)
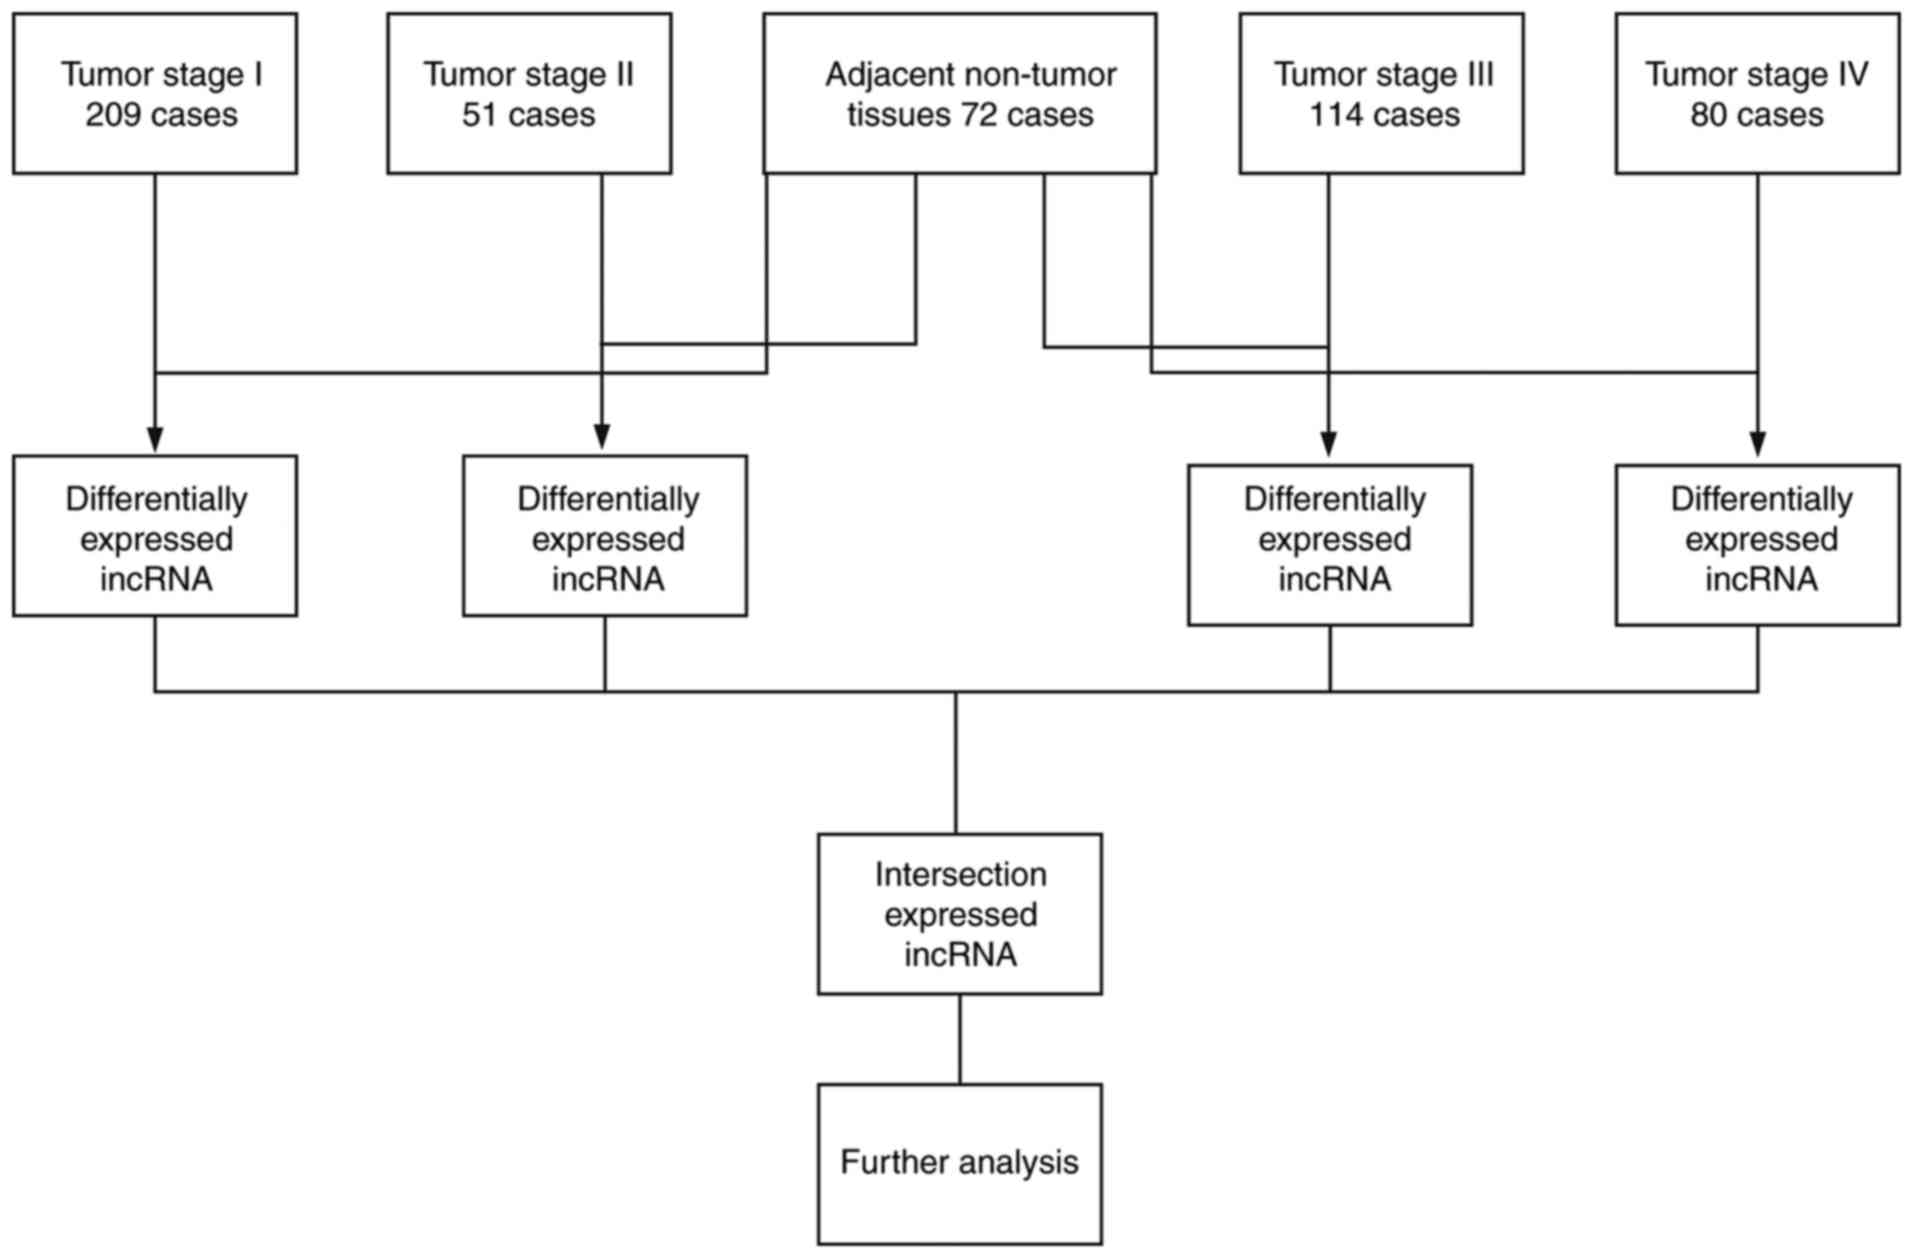
were selected for further research. To identify the expression of
the different lncRNAs, the patients were divided into four clusters
according to the seventh American Joint Committee on Cancer TNM
staging system, and the data was compared with that of adjacent
non-tumor tissues (Fig. 1).
Abnormally expressed lncRNAs with level 3 RNA sequencing data were
compared [fold-change, >2; P<0.05 and false discovery rate
(FDR) <0.05], and the expression status was intersected and
further analyzed.
The expression profile of each lncRNA was normalized
by log2-conversion, and then lncRNAs with values of 0 in >10% of
all samples were eliminated. Next, the univariate Cox proportional
hazards regression model was used to analyze the association
between each differentially expressed lncRNA and the OS time of
patients with ccRCC. Using the multivariate Cox proportional
hazards regression model, further analysis was performed to assess
the prognostic value of the lncRNAs that were screened out as
aforementioned (20). This study is
in full compliance with NIH guidelines and TCGA data access
policies.
Construction of lncRNA based
prognostic biomarkers of ccRCC
For further analysis, a prognosis-related risk score
model was developed that was based on each target lncRNA, which was
weighted by a regression coefficient derived from the multivariate
Cox regression model (β) with the following formula, as previously
reported (21,22): Risk score = explncRNA1 ×
βlncRNA1 + explncRNA2 × βlncRNA2 +
…explncRNAn × βlncRNAn.
Patients were divided into two groups by the mean
risk score (23). Through the
Kaplan-Meier and log-rank methods (Mantel-Haenszel test), the
differences between two groups were presented. Univariate Cox
proportional hazards regression model and multivariate Cox
proportional hazards regression model were used to further
investigate the association between clinical features and OS time
in patients with ccRCC. To assess the accuracy and predictive value
of the risk score model, a 5-year time-dependent receiver operating
characteristic (ROC) curve analysis was performed (24). The hazard ratio and 95% confidence
interval were obtained. Data were assessed by Kaplan-Meier survival
curves and log-rank test with IBM SPSS Statistics 21 (IBM Corp.,
Armonk, NY, USA).
Functional enrichment analysis
To analyze the biological features of target
lncRNAs, the genes that were highly correlated with the expression
of these lncRNAs (Pearson |R|>0.5) in the TCGA database were
investigated. Through the application of the Database for
Annotation, Visualization and Integrated Discovery (https://david.ncifcrf.gov/), the Kyoto Encyclopedia of
Genes and Genomes (KEGG) and Gene Ontology (GO) enrichment analyses
of these lncRNAs were conducted (25,26).
P<0.05 was considered to indicate a statistically significant
difference.
Total RNA extraction and RT-qPCR
verification
A total of 5 target lncRNAs were randomly selected
for the verification of the reliability of the analysis by means of
a random number table from Microsoft Excel software (Microsoft
Corporation, Redmond, WA, USA). Total RNA was extracted from tissue
samples using TRIzol reagent (Invitrogen; Thermo Fisher Scientific,
Inc.). RNA purity was detected by NanoDrop 2000 spectrometer
(Thermo Fisher Scientific, Inc.). According to the manufacturer's
protocol, the two-step reverse transcription reactions were
performed using the A214 reverse transcription system kit (GenStar,
Beijing, China). RNA samples (1 µg) were pre-denatured (5 min at
65°C and held at 4°C). Next, 9 µl mixture (2 µl 5× RT buffer, 0.5
µl RT Enzyme mix, 0.5 µl RNA-specific RT primers and 6 µl
RNase-free water) was added to 1 µg pre-denatured RNA (15 min at
37°C, 5 min at 98°C and subsequently held at 4°C).
qPCR was conducted to measure the expression levels
of selected lncRNAs with the StepOneplus Real-Time PCR system
(Applied Biosystems; Thermo Fisher Scientific, Inc.). The PCR
components comprised 1 µl cDNA, 5 µl Thunderbird SYBR qPCR mix, 0.3
µl PCR primers and 3.4 µl RNase-free water. Next, a two-step
protocol (95°C for 1 min, followed by 40 cycles of 95°C for 15 sec,
60°C for 30 sec and 72°C for 30 sec) was undertaken. All RNA
primers were obtained from Generay Biotech Co., Ltd. (Shanghai,
China). The primer sequences of the 5 target lncRNAs and the
reference gene were as follows: COL18A1-AS1 sense,
5′-CCTCGGCCTTCCATTTCTTAA-3′ and antisense,
5′-GGCGACTCACAGATGCCTTTT-3′; GK3P sense,
5′-CAACCCATTGACTTCATCACA-3′ and antisense,
5′-TGCAGCTACAAGCAGACATTC-3′; TINCR sense,
5′-CCACTGTCATCTCCCCTCTTT-3′ and antisense,
5′-TCTCCCTCCCTATCTTCCATT-3′; URB1-AS1 sense,
5′-TGTTCATAACAGTCCCAAGGA-3′ and antisense,
5′-AGGAGAAGACCAAACGAAGTAA-3′; ZNF542P sense,
5′-CCTTTACCTCCTCCATTATCC-3′ and antisense,
5′-GCCTGACCTAGTTCTGCTTTT-3′; and GAPDH sense,
5′-GGACCTGACCTGCCGTCTAG-3′ and antisense,
5′-GTAGCCCAGGATGCCCTTGA-3′.
Statistical analysis
The statistical significance of RT-qPCR results was
analyzed by fold-change and Student's t-test using GraphPad Prism
7.0 (GraphPad Software, Inc., La Jolla, CA, USA). All data are
expressed as the mean ± standard deviation. The comparative Cq
method was used to measure the relative expression of candidate
lncRNAs. The result of each sample was calculated through
2−∆∆Cq method (27):
∆∆Cq = (CqlncRNA - CqGAPDH)tumor -
(CqlncRNA - CqGAPDH)adjacent non-tumor
tissues. Fold-changes were used to screen differentially
expressed lncRNAs, and the threshold values were fold-change >2,
P<0.05 and FDR <0.05. The threshold of the P-value was set as
0.05 to evaluate the null hypothesis.
Results
Patient clinical information
A total of 454 ccRCC patients and 72 normal controls
with recorded clinical features were available from TCGA database.
Patients were divided into four groups according to the tumor stage
(I, II, III or IV). Clinical information about the patients is
presented in Table I. For the total
cohort, the mean age (± standard deviation) was 60.209±11.909
years. The OS time of these patients was 1,329.588±976.723 days,
and 149 out of 454 patients (32.819%) succumbed.
 | Table I.Clinical features of clear cell renal
cell carcinoma patients (n=454) from TCGA database. |
Table I.
Clinical features of clear cell renal
cell carcinoma patients (n=454) from TCGA database.
| Variables | Patients, n |
|---|
| Ethnicity |
|
Caucasian | 396 |
| African
descent | 44 |
|
Asian | 8 |
| Sex |
|
Female | 163 |
|
Male | 291 |
| Age, years |
|
≤65 | 307 |
|
>65 | 147 |
| TNM stage |
| I | 209 |
| II | 51 |
|
III | 114 |
| IV | 80 |
| T stage |
| T1 | 215 |
| T2 | 63 |
| T3 | 165 |
| T4 | 11 |
| N stage |
| N0 | 351 |
| N1 | 14 |
| M stage |
| M0 | 378 |
| M1 | 76 |
| Histological
stage |
| G1 | 12 |
| G2 | 188 |
| G3 | 178 |
| G4 | 68 |
| Laterality |
|
Left | 210 |
|
Right | 244 |
| Primary treatment
outcome |
| CR | 91 |
| PR | 2 |
| SD | 7 |
| PD | 14 |
| Person neoplasm
cancer status |
|
Tumor-free | 302 |
| With
tumor | 138 |
| Neoadjuvant
treatment |
|
Yes | 8 |
| No | 446 |
| Hemoglobin
result |
|
Low | 217 |
|
Normal | 161 |
|
Elevated | 5 |
| Serum calcium
result |
|
Low | 169 |
|
Normal | 130 |
|
Elevated | 9 |
| White cell count
result |
|
Low | 7 |
|
Normal | 232 |
|
Elevated | 132 |
Identification of differentially
expressed lncRNAs
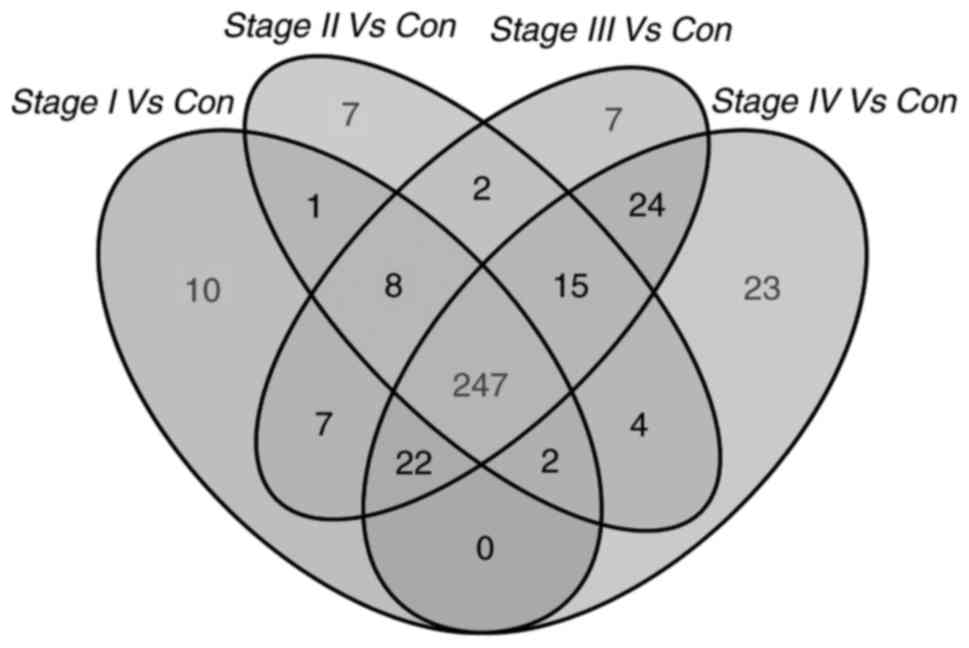
In the present study, the expression profile of
1,801 lncRNAs of ccRCC patients (n=454) was compared with that of
normal non-tumor tissues (n=72). Differently expressed lncRNAs
(fold-change >2; P<0.05; FDR<0.05) were selected. Next,
297 lncRNAs were obtained that were differentially expressed
between stage I ccRCC tumor tissues and adjacent non-tumor tissues.
A total of 286 lncRNAs were differentially expressed between stage
II ccRCC tumor tissues and adjacent non-tumor tissues, 332 lncRNAs
were differentially expressed between stage III ccRCC tumor tissues
and adjacent non-tumor tissues, and 337 lncRNAs were differentially
expressed between stage IV ccRCC tumor tissues and adjacent
non-tumor tissues. Finally, 247 overlapping differentially
expressed lncRNAs were selected for further analysis (Fig. 2).
Using the univariate Cox proportional hazards
regression model, results of the comprehensive analysis of 247
differentially expressed lncRNAs and clinical information from TCGA
database indicated that 106 lncRNAs were significantly associated
with OS time (P<0.05). Next, using the multivariate Cox
proportional hazards regression model, the association between the
aforementioned lncRNAs and the OS time of ccRCC patients was
calculated. Finally, 19 intersecting key lncRNAs (LOC606724,
SCART1, SNORA8, LOC728024, HAVCR1P1, FCGR1CP, LINC00240, LINC00894,
GK3P, SNHG3, KIAA0125, URB1-AS1, ZNF542P, TINCR, LINC00926,
PDXDC2P, COL18A1-AS1, LINC00202-1, and LINC00937) were identified
to be significantly associated with OS time (P<0.05), which was
an independent biomarker (Table
II).
| Table II.Prognostic value of the
differentially expressed lncRNAs according to multivariate cox
regression analysis. |
Table II.
Prognostic value of the
differentially expressed lncRNAs according to multivariate cox
regression analysis.
| lncRNA | Estimate | SthErr | χ2 | P-value | HR (95% CI) |
|---|
| LOC606724 | −0.639 | 0.250 | 6.517 | 0.011a | 0.528
(0.323–0.862) |
| SCART1 | −0.941 | 0.299 | 9.887 | 0.002a | 0.390
(0.217–0.702) |
| SNORA8 | 0.693 | 0.311 | 4.957 | 0.026a | 1.999
(1.086–3.678) |
| LOC728024 | −0.495 | 0.209 | 5.614 | 0.018a | 0.610
(0.405–0.918) |
| HAVCR1P1 | 0.670 | 0.196 | 11.689 | 0.001a | 1.954
(1.331–2.869) |
| FCGR1CP | 0.568 | 0.209 | 7.365 | 0.007a | 1.766
(1.171–2.662) |
| LINC00240 | −0.575 | 0.208 | 7.652 | 0.006a | 0.563
(0.374–0.846) |
| LINC00894 | 0.803 | 0.358 | 5.033 | 0.025a | 2.232
(1.107–4.503) |
| GK3P | −0.770 | 0.233 | 10.863 | 0.001a | 0.463
(0.293–0.732) |
| SNHG3 | 0.682 | 0.255 | 7.173 | 0.007a | 1.979
(1.201–3.260) |
| KIAA0125 | −0.431 | 0.206 | 4.350 | 0.037a | 0.650
(0.434–0.974) |
| URB1AS1 | 0.774 | 0.200 | 15.031 | 0.000a | 2.168
(1.466–3.207) |
| ZNF542P | −0.537 | 0.215 | 6.264 | 0.012a | 0.584
(0.384–0.890) |
| TINCR | 0.843 | 0.216 | 15.302 | 0.000a | 2.323
(1.523–3.544) |
| LINC00926 | 0.930 | 0.261 | 12.673 | 0.000a | 2.535
(1.519–4.232) |
| PDXDC2P | −0.929 | 0.360 | 6.664 | 0.010a | 0.395
(0.195–0.800) |
| COL18A1AS1 | −0.594 | 0.202 | 8.685 | 0.003a | 0.552
(0.372–0.820) |
| LINC002021 | −0.577 | 0.290 | 3.952 | 0.047a | 0.561
(0.318–0.992) |
| LINC00937 | 0.806 | 0.251 | 10.335 | 0.001a | 2.239
(1.370–3.659) |
Construction of an lncRNA-based
prognostic signature
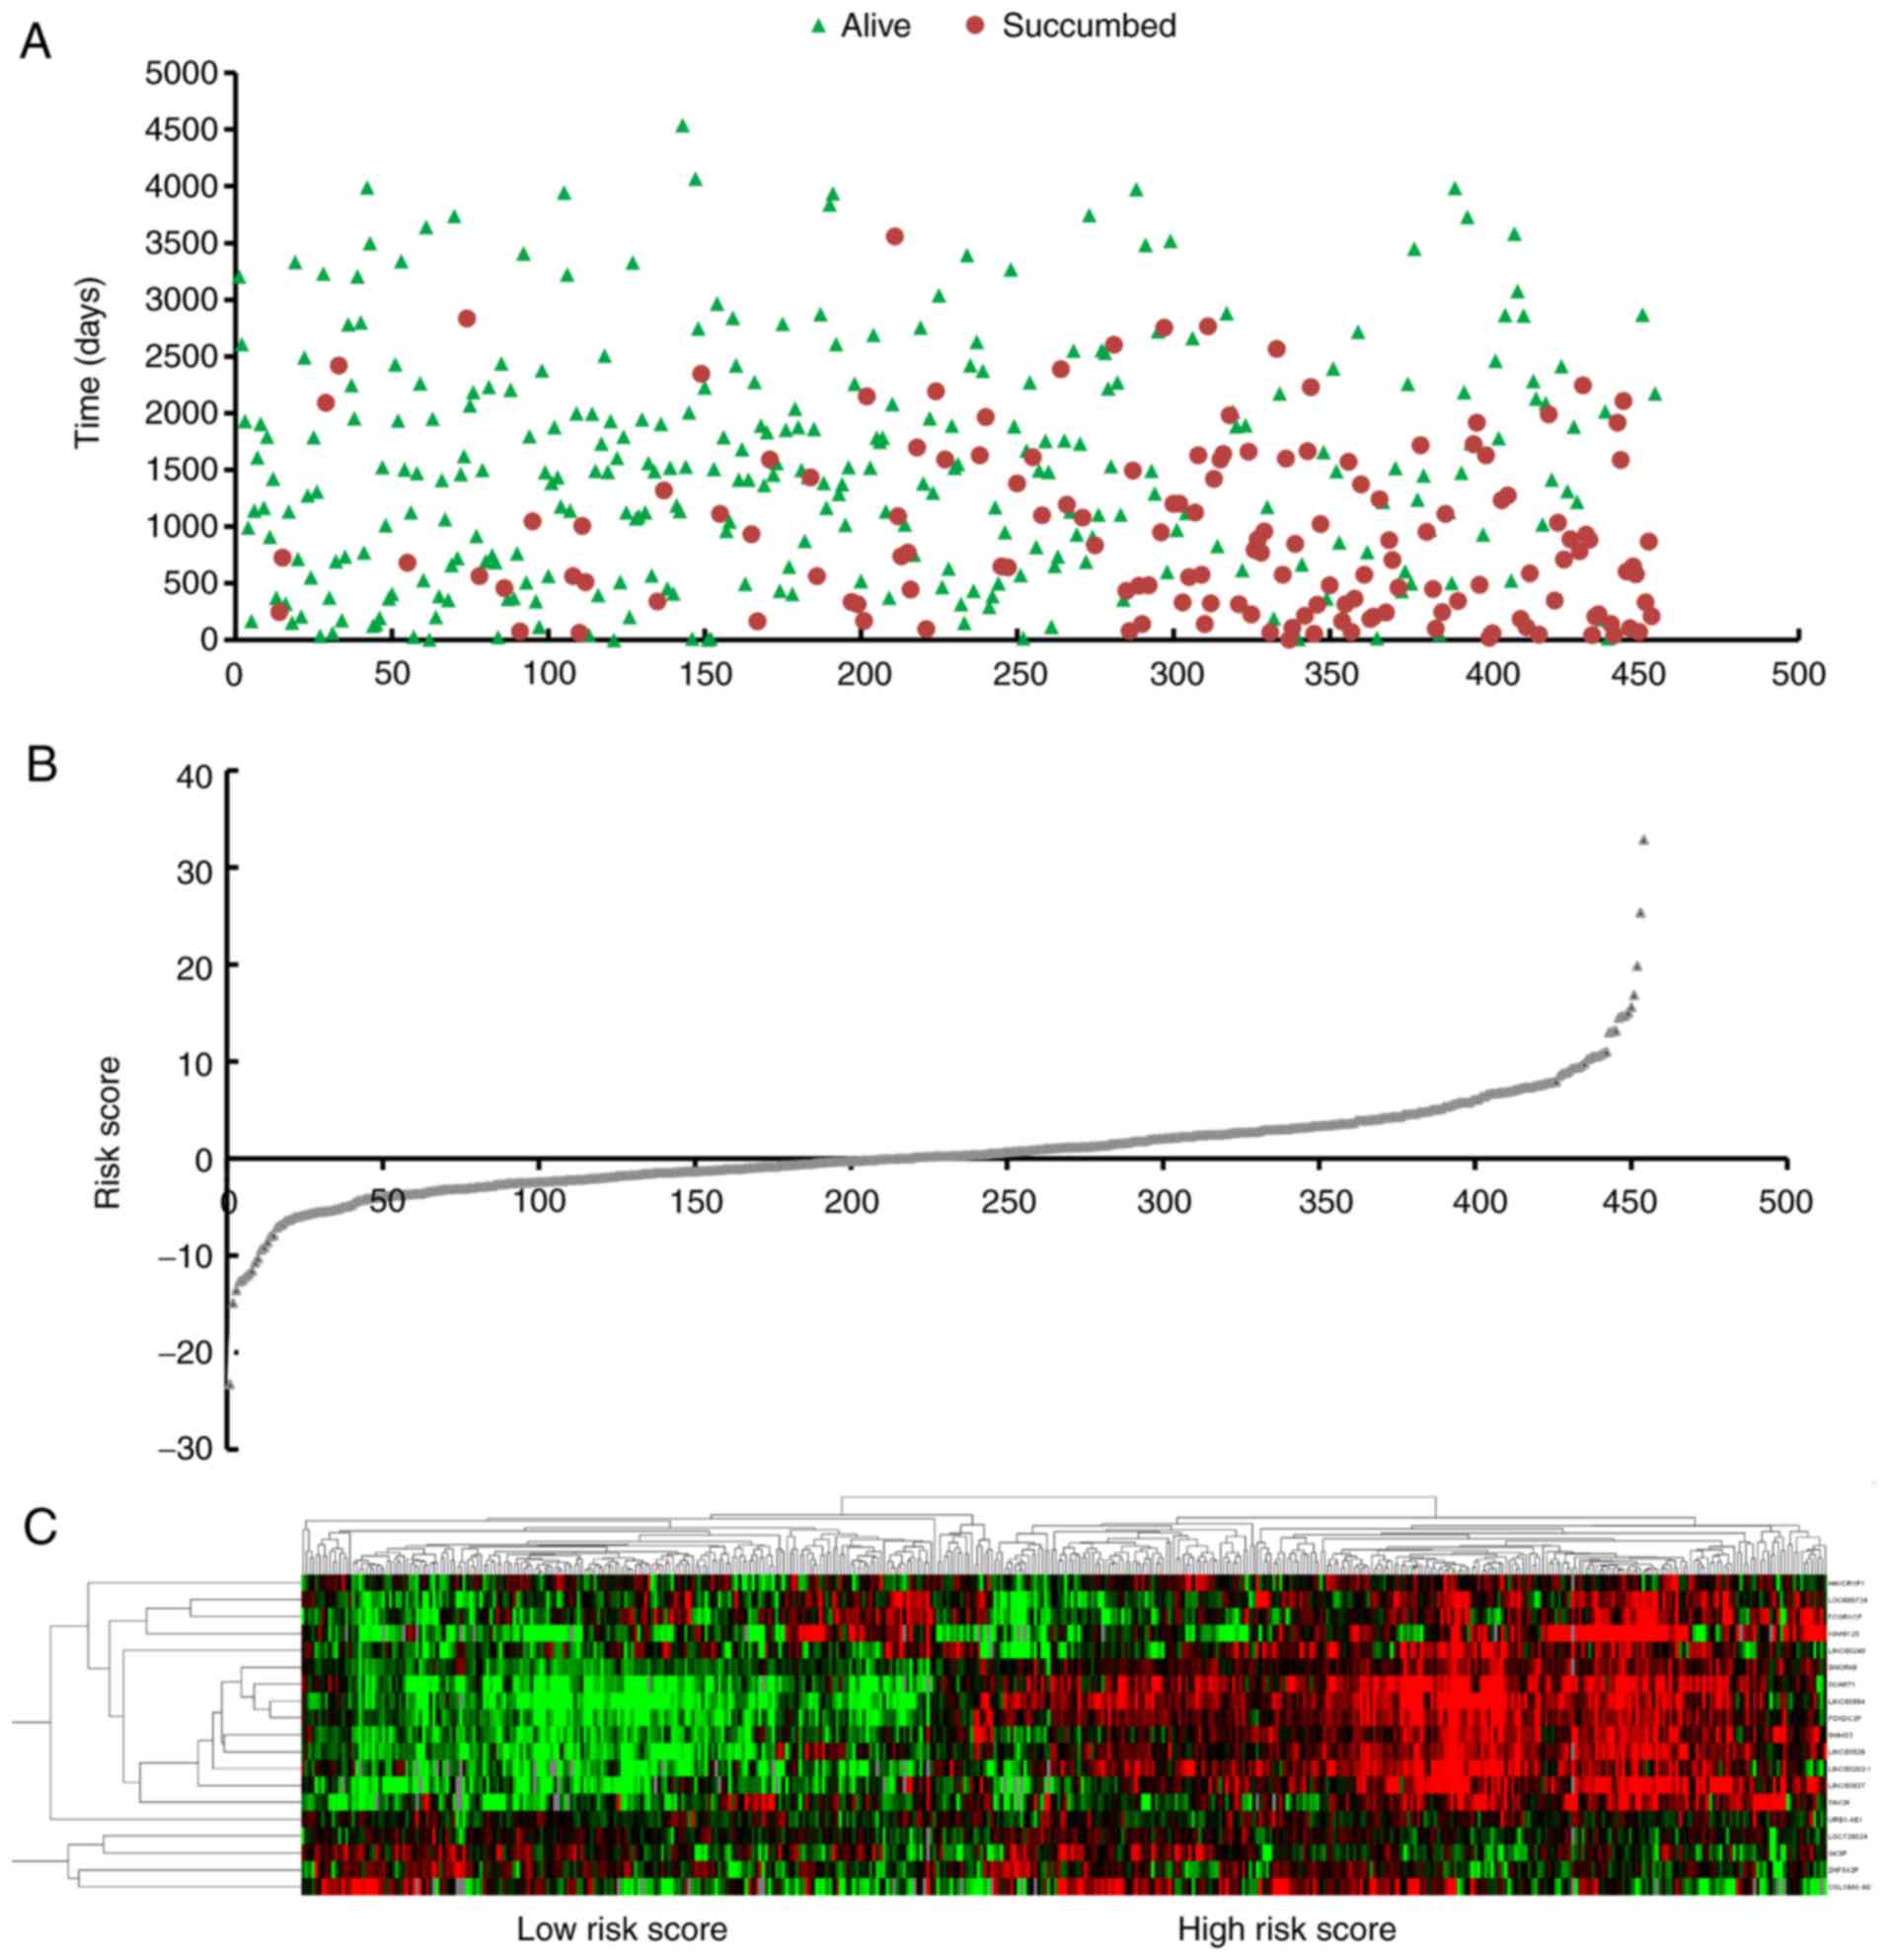
Next, the risk score model for predicting OS time
was constructed with the following formula: Risk score =
(expLOC606724 × −0.639) + (expSCART1 × −0.941) + (expSNORA8 ×
0.693) + (expLOC728024 × −0.495) + (expHAVCR1P1 × 0.670) +
(expFCGR1CP × 0.568) + (expLINC00240 × −0.575) + (expLINC00894 ×
0.803) + (expGK3P × −0.770) + (expSNHG3 × 0.682) + (expKIAA0125 ×
−0.431) + (expURB1AS1 × 0.774) + (expZNF542P × −0.537) + (expTINCR
× 0.843) + (expLINC00926 × 0.930) + (expPDXDC2P × −0.929) +
(expCOL18A1AS1 × −0.594) + (expLINC002021 × −0.577) + (expLINC00937
× 0.806). Based on the risk score, patients were separated into two
groups (high-risk group, n=227, and low-risk group, n=227) through
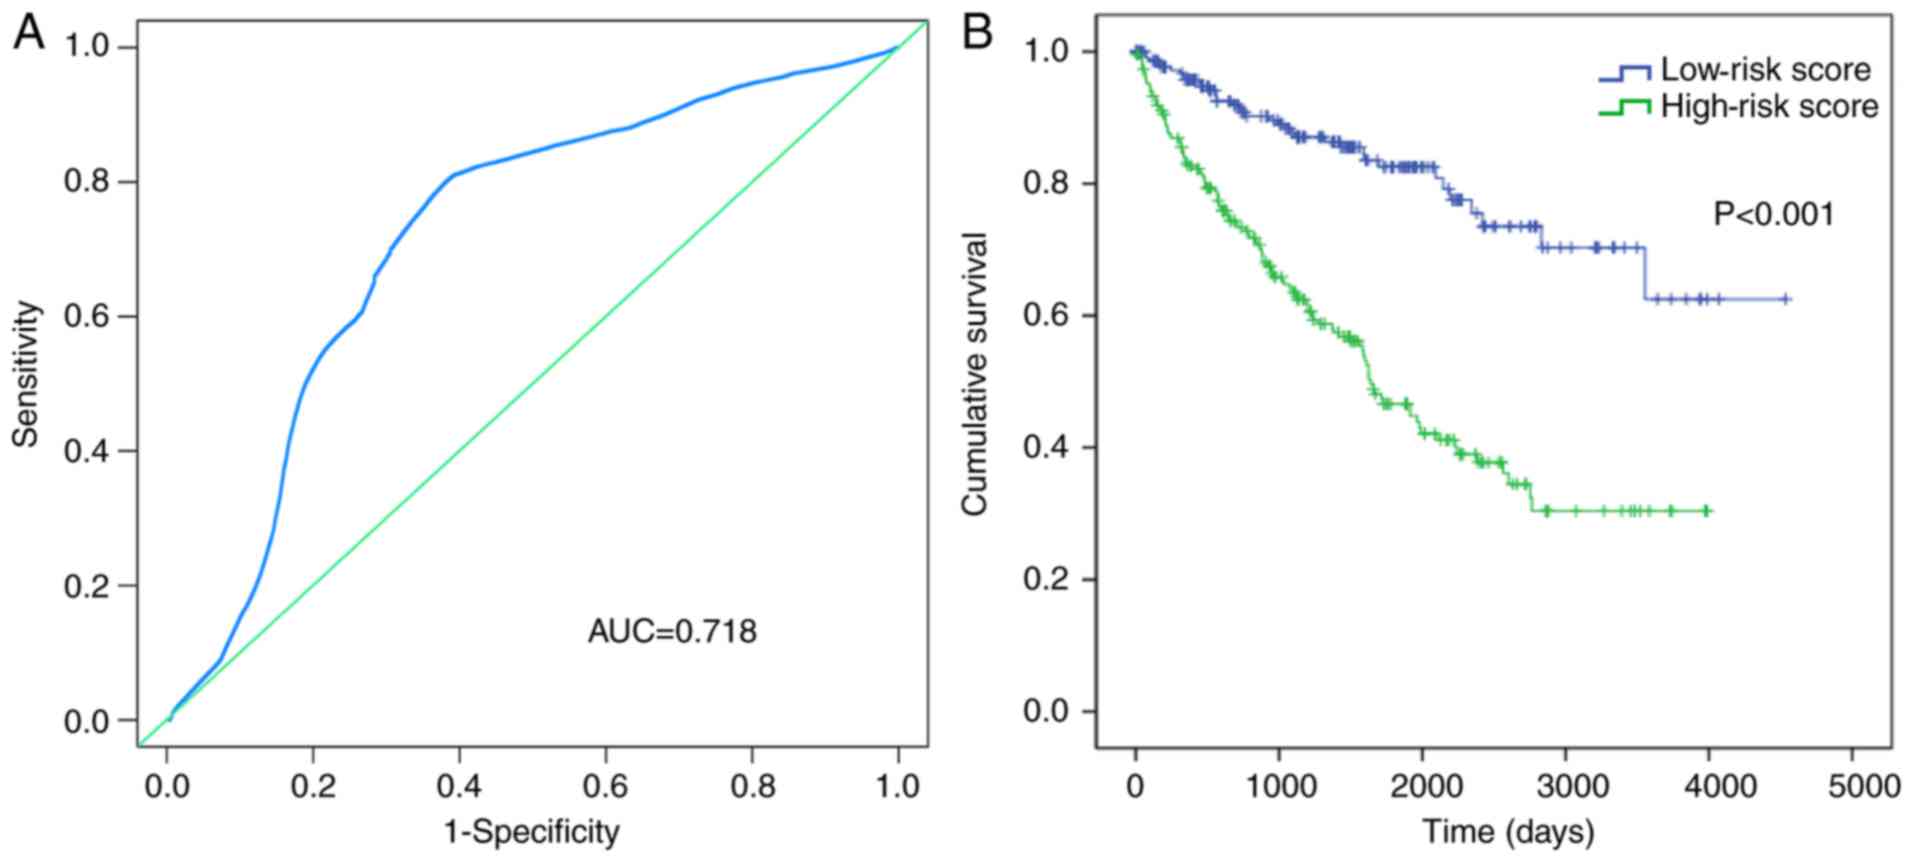
the cut-off value of the median risk score (Fig. 3). Results showed that the area under
the curve (AUC) was 0.718 (Fig.
4A), which verified the predictive value of the aforementioned
risk score. The Kaplan-Meier curve indicated that the survival time
of the patients in the low-risk score group (1,425.996±1,000.008
days) was longer than that of the patients in the high-risk score
group (1,233.181±945.223 days) (P=0.001; Fig. 4B).
Additionally, to verify whether the prognostic value
of the constructed lncRNA signatures was independent of other
clinical characteristics, the risk score and other clinical
features were systematically analyzed using the univariate Cox
proportional hazards regression model and the multivariate Cox
proportional hazards regression model. The clinical characteristics
of age, TNM stage according to the seventh American Joint Committee
on Cancer TNM staging system (1), T
stage, N stage, M stage, laterality, neoplasm cancer, the elevated
serum calcium result, neoadjuvant treatment, hemoglobin result and
risk score, all showed some predictive value through the univariate
Cox proportional hazards regression analysis. However, following
the analysis of the multivariate Cox proportional hazards
regression model, only the neoplasm cancer (P<0.001) and risk
score (P=0.004) were independent prognostic factors of ccRCC
(Table III).
| Table III.Predicted values of clinical features
and risk score. |
Table III.
Predicted values of clinical features
and risk score.
|
| Univariate
analysis | Multivariate
analysis |
|---|
|
|
|
|
|---|
| Variables | HR (95% CI) | P-value | HR (95% CI) | P-value |
|---|
| Ethnicity |
|
Caucasian | 1.000
(reference) |
|
|
|
| African
descent | 1.179
(0.617–2.252) | 0.617 |
|
|
|
Asian | 0.532
(0.074–3.811) | 0.529 |
|
|
| Sex |
|
Male | 1.000
(reference) |
|
|
|
|
Female | 0.899
(0.646–1.249) | 0.525 |
|
|
| Age, years |
|
≤65 | 1.000
(reference) |
|
|
|
|
>65 | 1.804
(1.305–2.495) |
<0.001a |
|
|
| Tumor stage |
| I | 1.000
(reference) |
| 1.000
(reference) |
|
| II | 1.218
(0.061–2.433) | 0.576 | 9.408
(1.385–63.905) | 0.022 |
|
III | 2.788
(1.748–4.444) |
<0.001a | 4.978
(0.990–25.035) | 0.051 |
| IV | 7.749
(5.022–11.956) |
<0.001a | 12.099
(2.650–55.037) | 0.001 |
| T stage |
| T1 | 1.000
(reference) |
| 1.000
(reference) |
|
| T2 | 1.547
(0.884–2.706) |
0.126a | 0.109
(0.019–0.639) | 0.014 |
| T3 | 3.497
(2.358–5.186) |
<0.001a | 0.358
(0.078–1.650) | 0.188 |
| T4 | 11.150
(5.504–22.587) |
<0.001a | 0.334
(0.063–1.784) | 0.200 |
| N stage |
| N0 | 1.000
(reference) |
| 1.000
(reference) |
|
| N1 |
|
<0.001a |
| 0.493 |
| M stage |
| M0 | 1.000
(reference) |
| 1.000
(reference) |
|
| M1 | 4.882
(3.523–6.765) |
<0.001a | 0.724
(0.076–6.899) | 0.779 |
| Histological
stage |
| G1 | 1.000
(reference) |
|
|
|
| G2 | 2,448.345
(0.000–6.607×1037) | 0.847 |
|
|
| G3 | 4,767.788
(0.000–1.286×1038) | 0.834 |
|
|
| G4 | 13,172.972
(0.000–3.554×1038) | 0.815 |
|
|
| Laterality |
|
| 1.000
(reference) |
|
Left | 1.000
(reference) |
|
|
|
|
Right | 0.710
(0.514–0.980) |
0.037a | 0.949
(0.610–1.475) | 0.815 |
| Primary treatment
outcome |
| CR | 1.000
(reference) |
|
|
|
| PR | 0.000 | 0.997 |
|
|
| SD | 6.667
(1.777–25.014) |
0.005a |
|
|
| PD | 0.000 | 0.989 |
|
|
| Person neoplasm
cancer status |
|
Tumor-free | 1.000
(reference) |
| 1.000
(reference) |
|
| With
tumor | 6.140
(4.284–8.800) |
<0.001a | 3.527
(2.160–5.759) |
<0.001a |
| Neoadjuvant
treatment |
|
Yes | 1.000
(reference) |
|
|
|
| No | 2.675
(1.252–5.715) |
0.011a |
|
|
| Hemoglobin
result |
|
Normal | 1.000
(reference) |
| 1.000
(reference) |
|
|
Low | 2.142
(1.468–3.123) |
<0.001a | 1.588
(0.983–2.565) | 0.059 |
|
Elevated | 5.471
(1.682–17.798) |
0.011a | 6.386
(0.838–48.686) | 0.074 |
| Serum calcium
result |
|
Normal | 1.000
(reference) |
| 1.000
(reference) |
|
|
Low | 0.774
(0.533–1.126) | 0.180 |
|
|
|
Elevated | 3.742
(1.771–7.907) |
0.001a | 0.004
(0.000–7.946×10¹⁹) | 0.833 |
| White cell count
result |
|
Normal | 1.000
(reference) |
|
|
|
|
Low | 1.451
(0.533–3.952) | 0.467 |
|
|
|
Elevated | 0.751
(0.509–1.107) | 0.148 |
|
|
| Risk score |
|
| 1.000
(reference) |
|
|
Low | 1.000
(reference) |
|
|
|
|
High | 3.557
(2.443–5.178) |
<0.001a | 2.097
(1.264–3.478) |
0.004a |
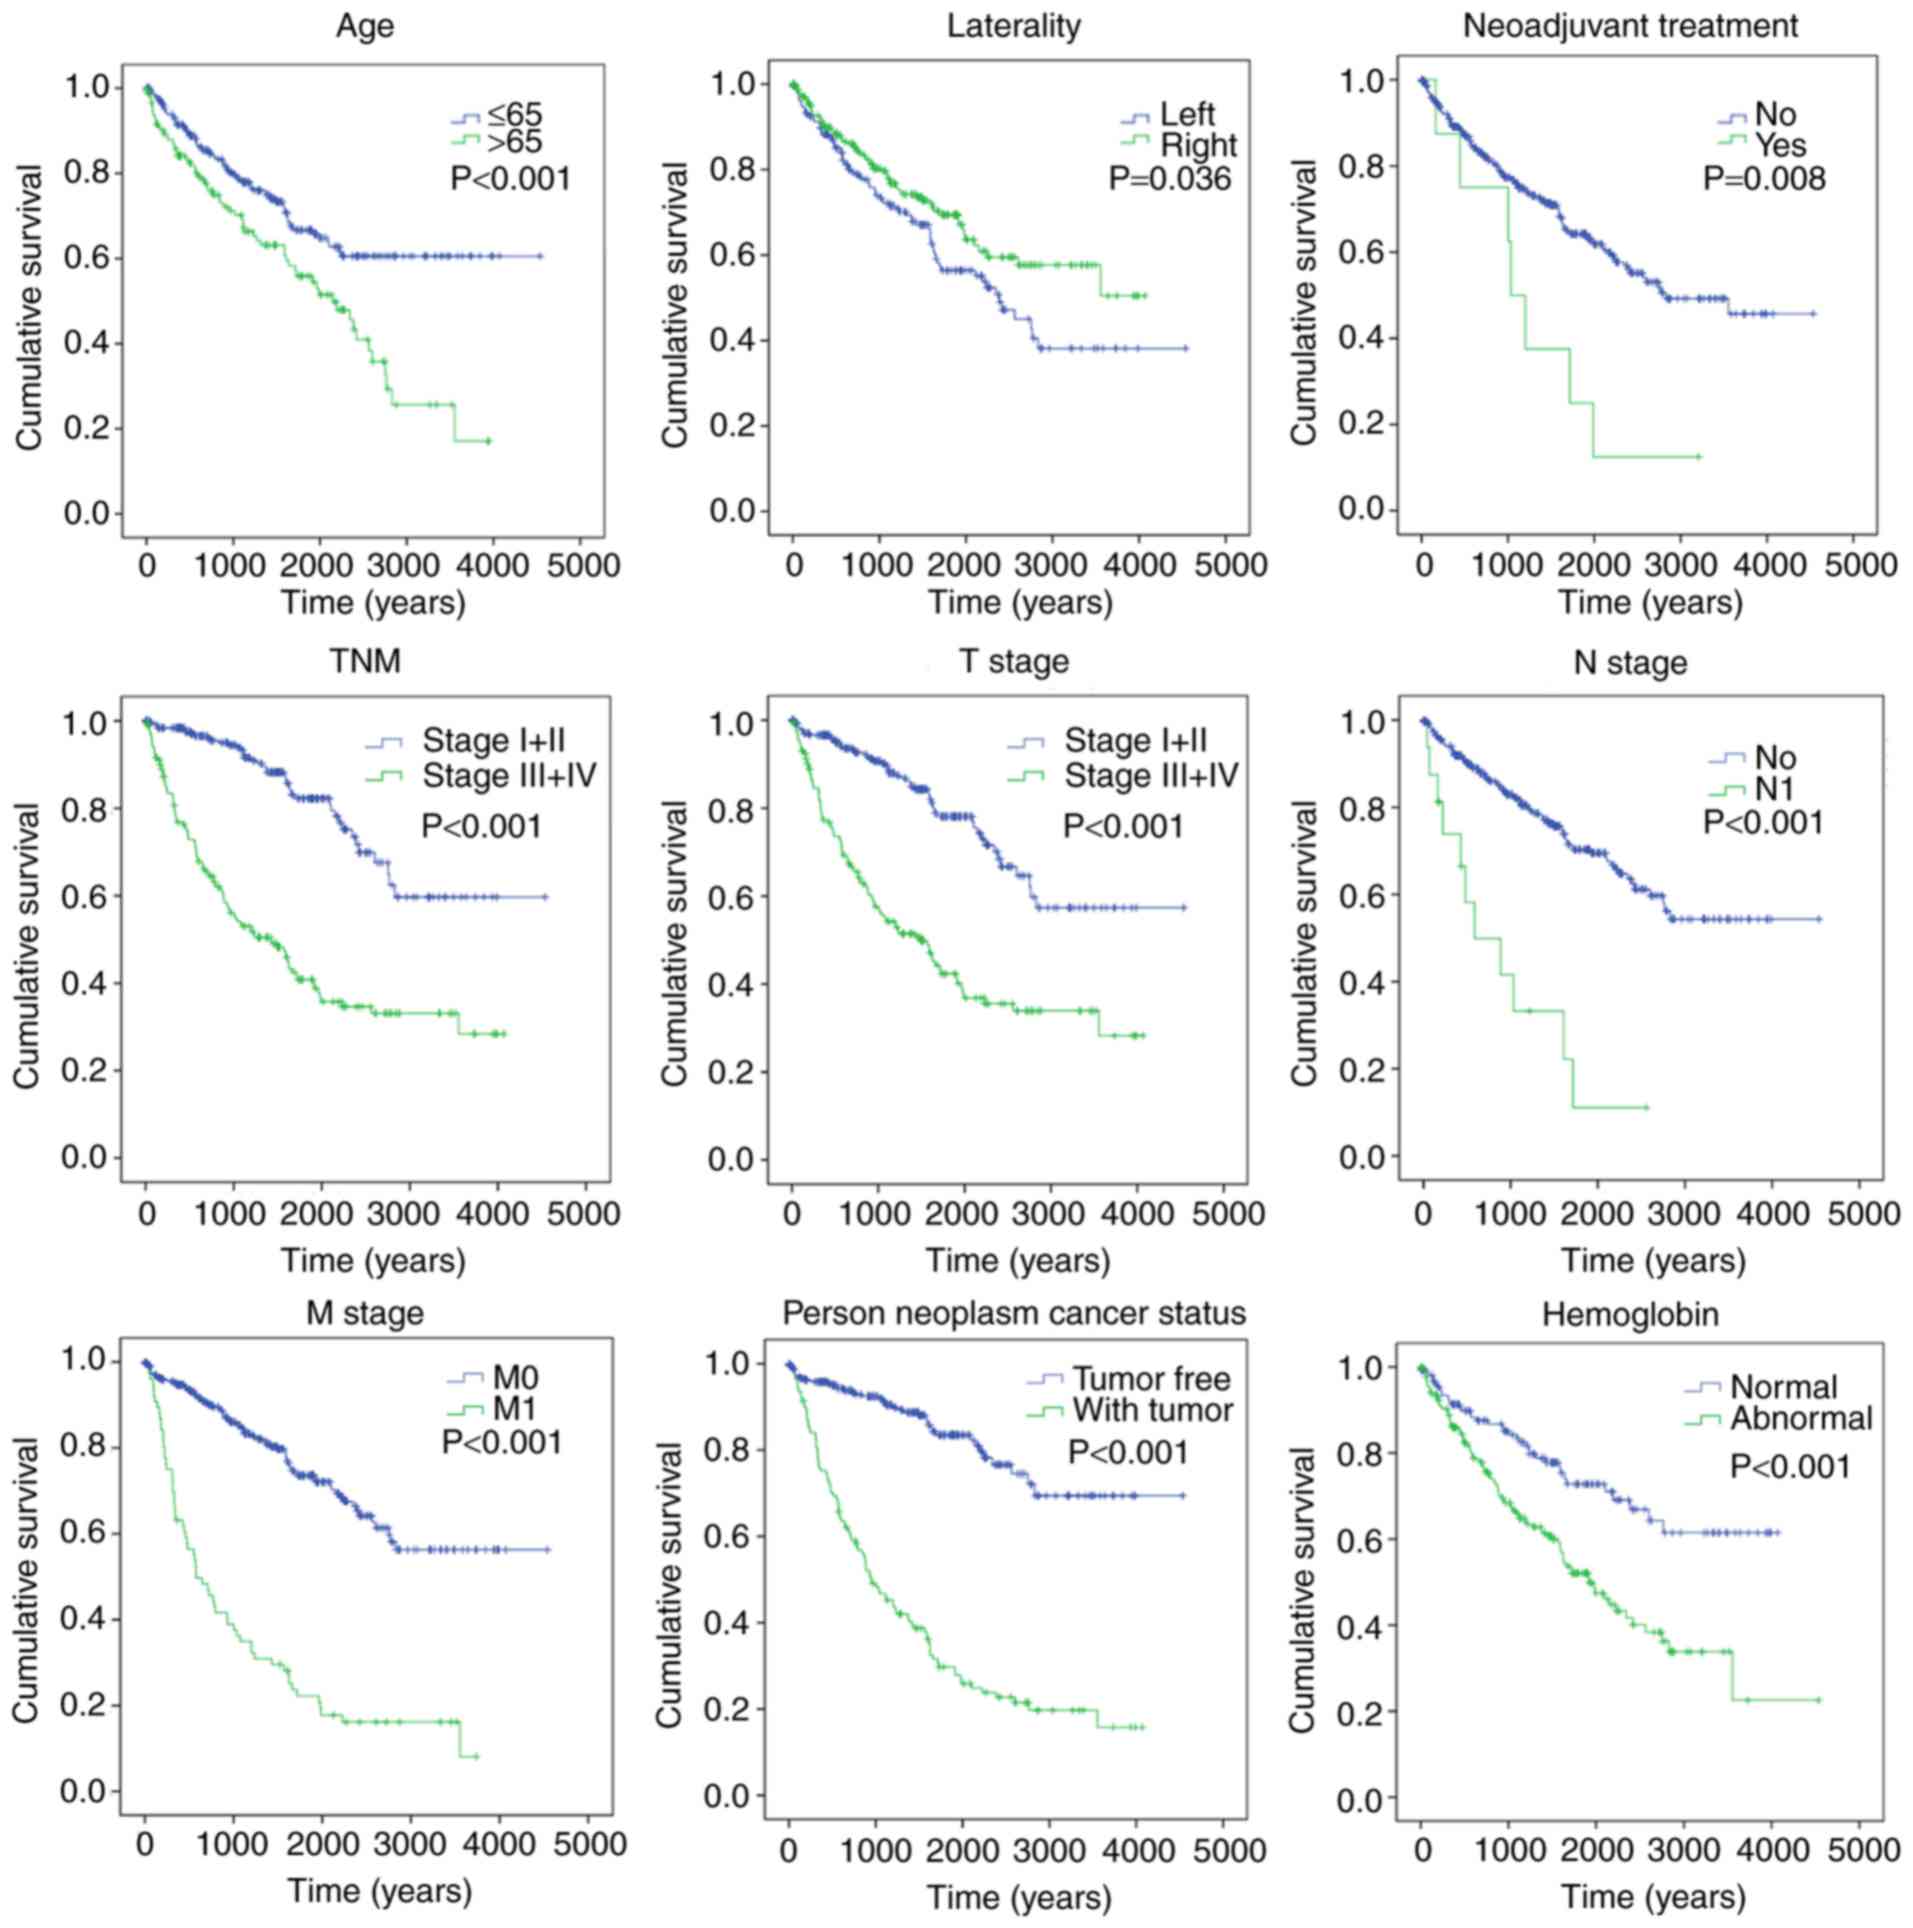
Kaplan-Meier curves revealed that clinical features,
including age (>65 years) (P<0.001), TNM stage (III+IV)
(P<0.001), T stage (III+IV) (P<0.001), N stage (N1)
(P<0.001), M stage (M1) (P<0.001), laterality (P=0.036),
neoplasm cancer (with tumor) (P<0.001), neoadjuvant treatment
(yes) (P=0.008), hemoglobin result (abnormal) (P<0.001) and risk
score (high) (P<0.001), were significantly associated with poor
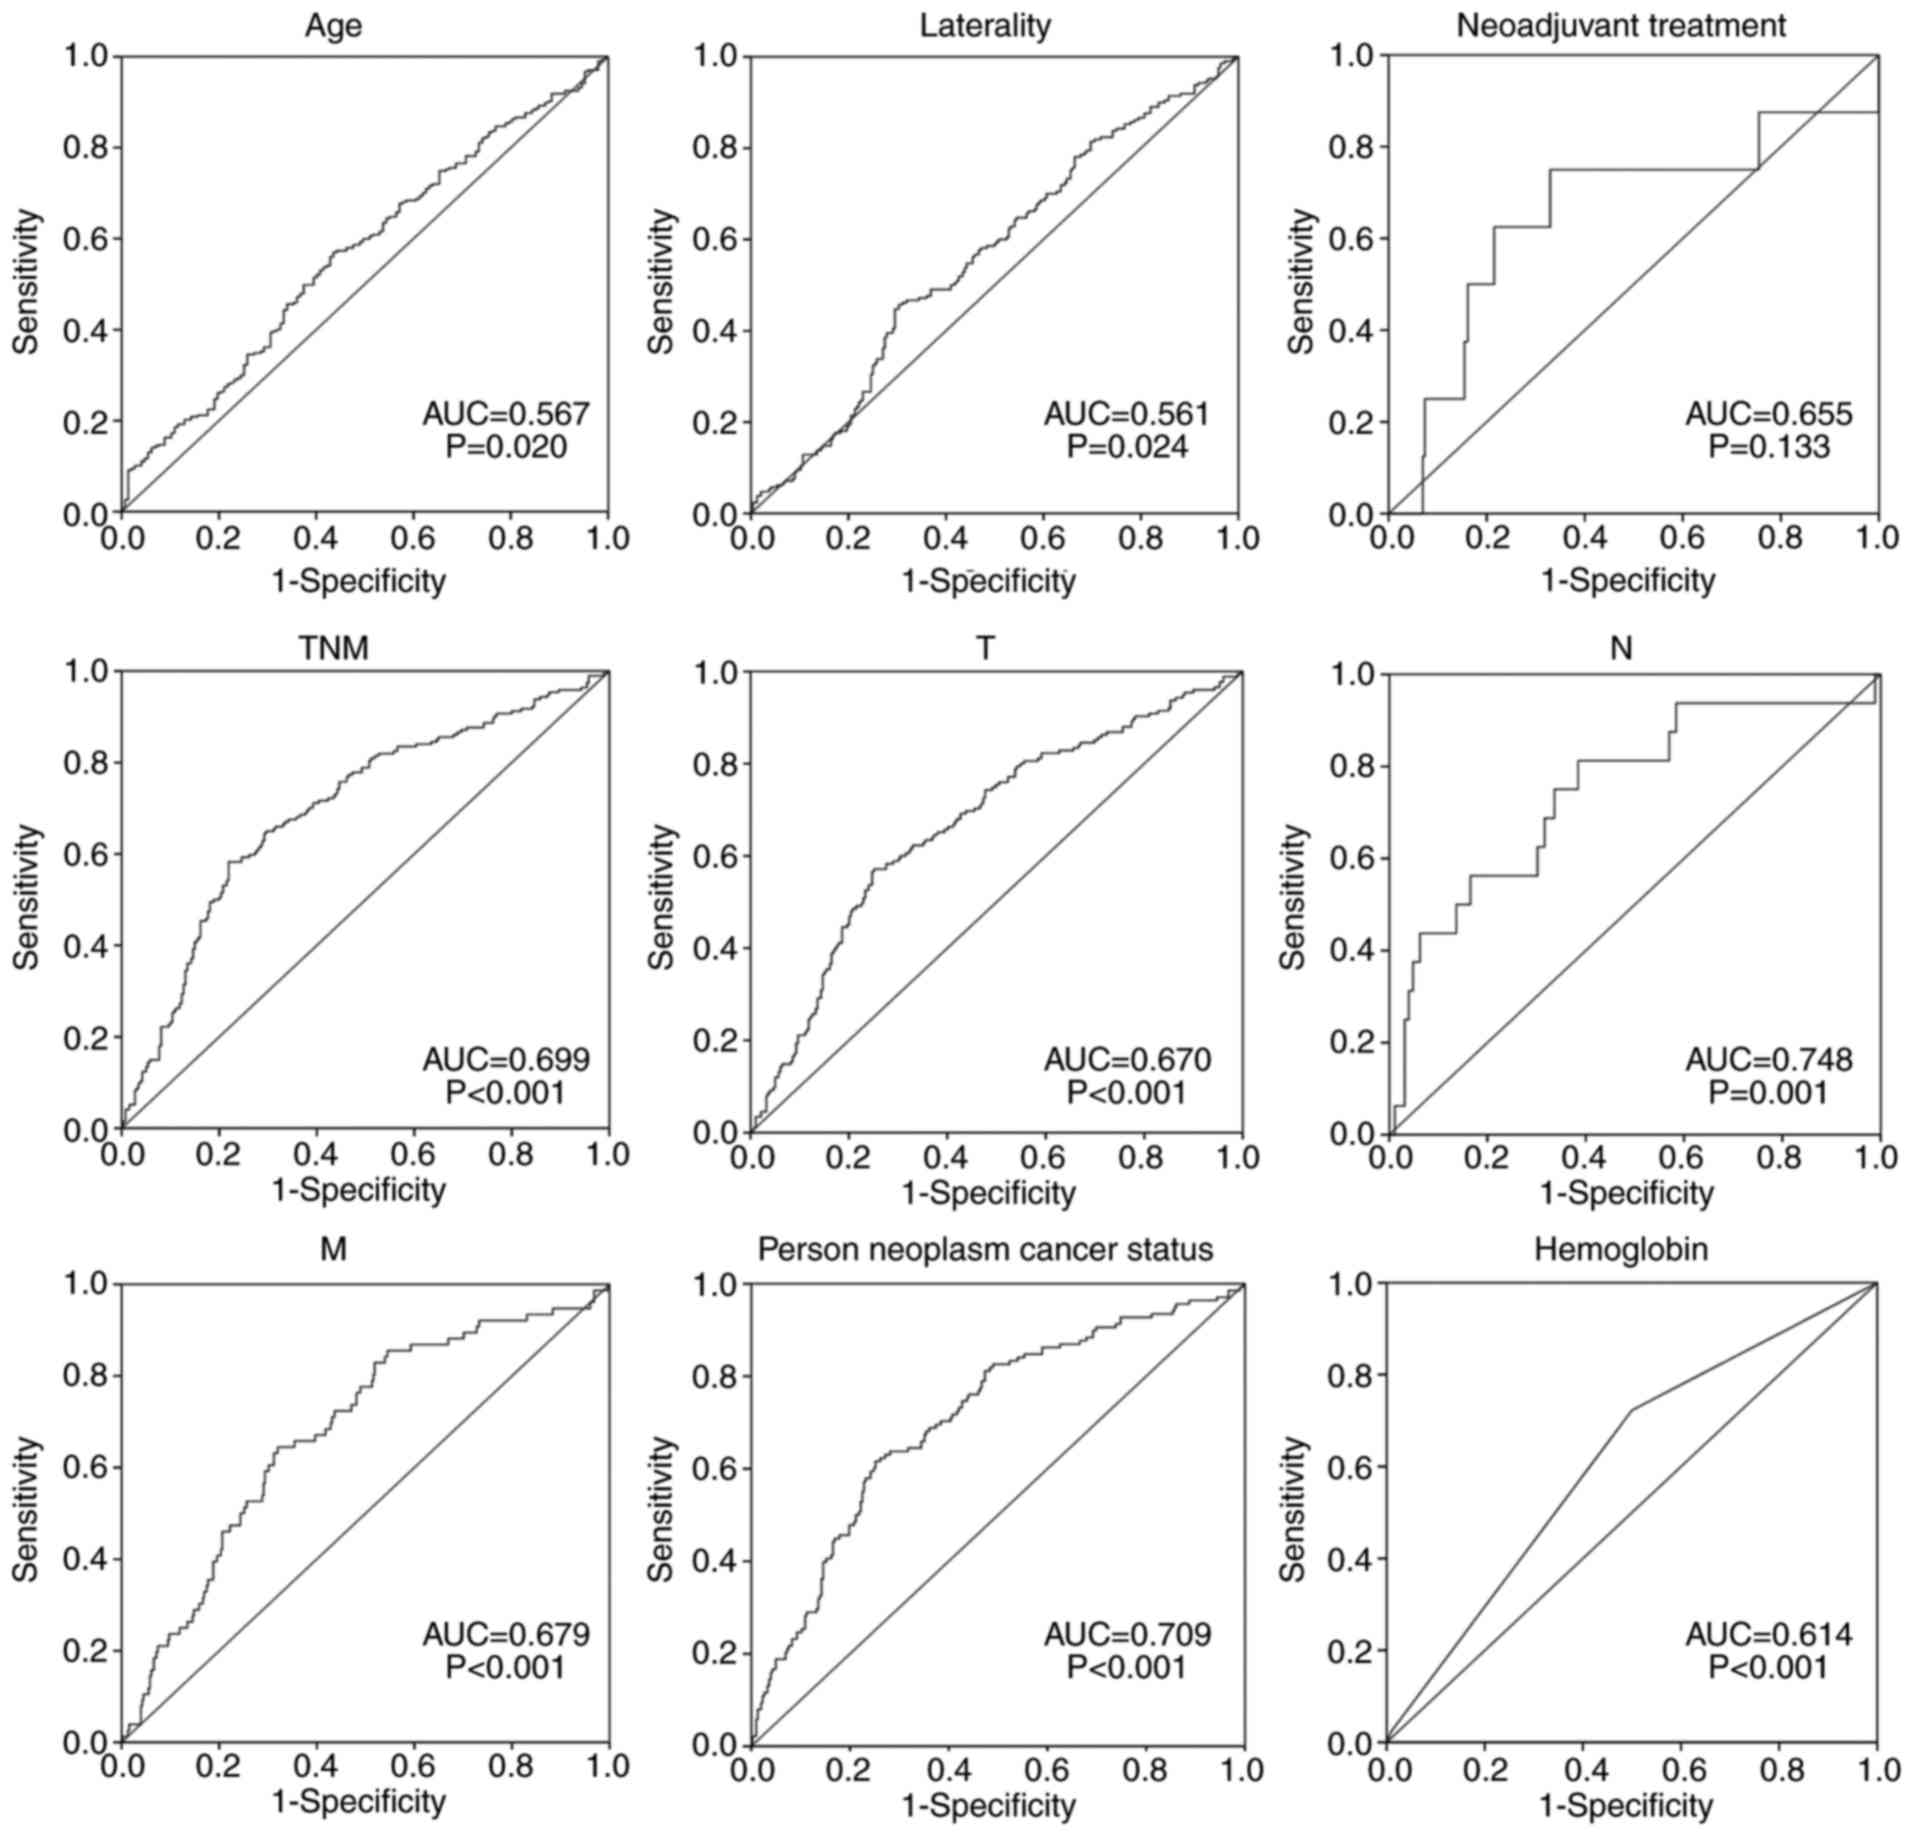
OS time (Fig. 5). To evaluate the
predictive power of the risk score model (AUC=0.718), the
prognostic value of other clinical features was compared (Fig. 6). Results indicated that the risk
score conferred a prognostic value for prediction.
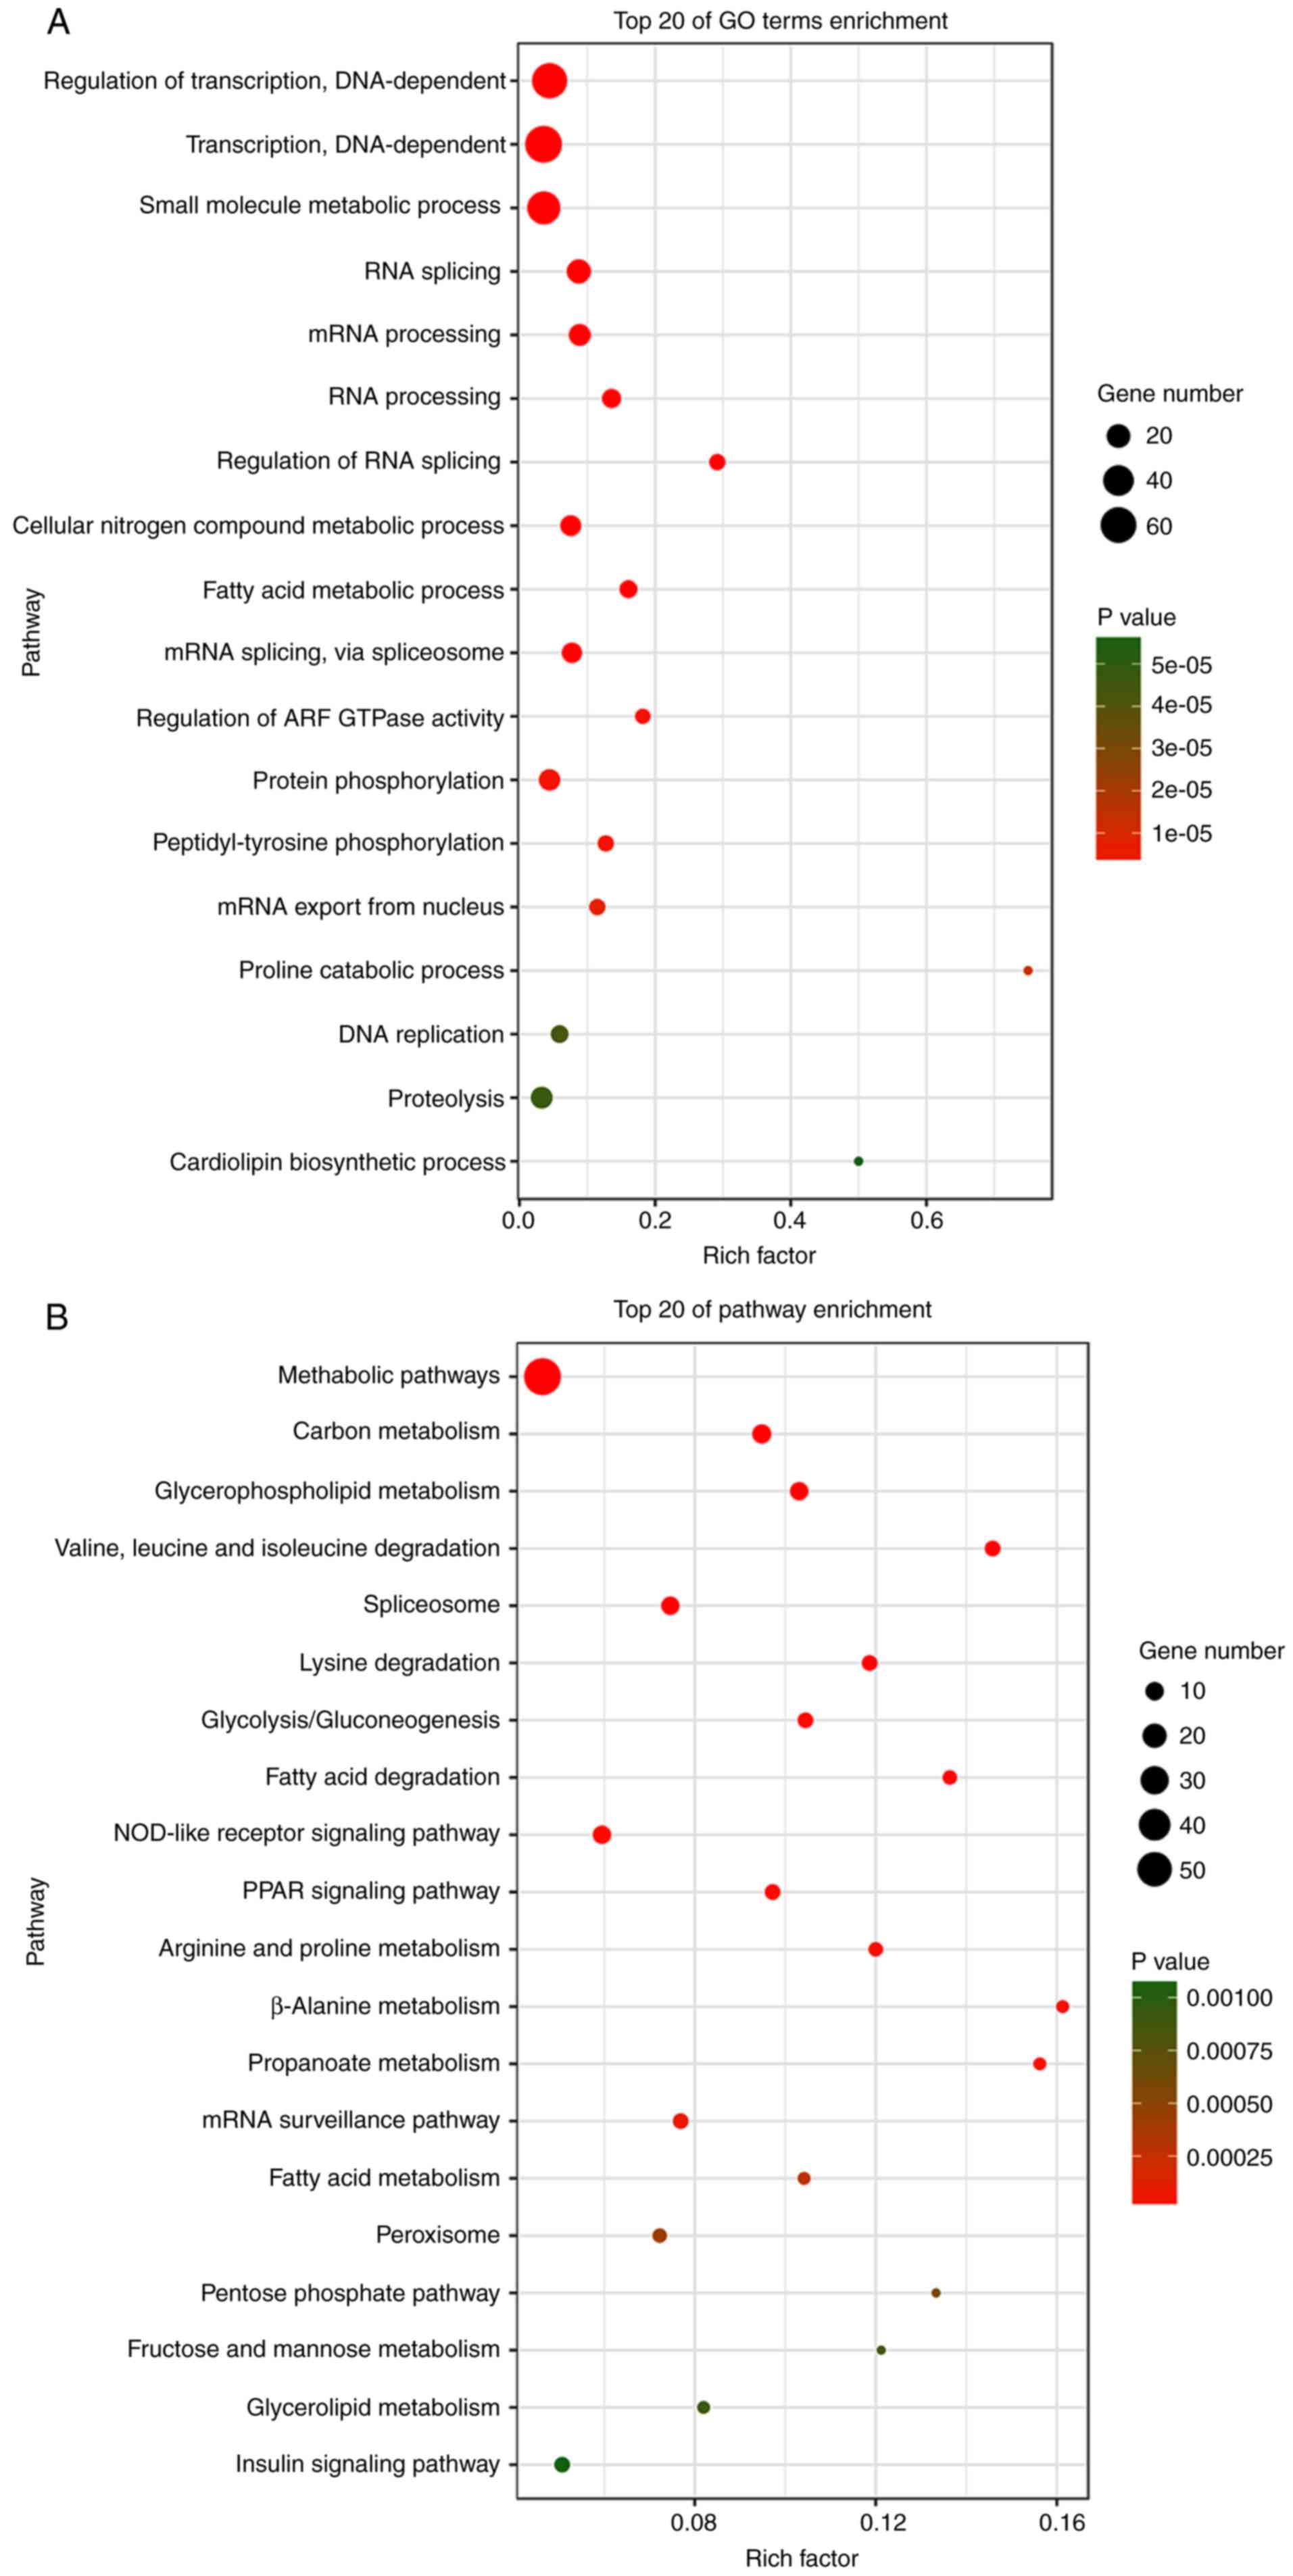
Functional enrichment analysis
In total, 1,149 genes were identified from TCGA
database, which were co-expressed with the aforementioned 19
lncRNAs (Pearson |R|>0.5). A total of 62 pathways were indicated
by KEGG analysis, and 222 GO terms (P<0.05 and enrichment >2)
were identified by enrichment of these genes. The result revealed
that the highest enriched GO terms were ‘regulation of
transcription, DNA-dependent’ (GO: 0006355), ‘transcription,
DNA-dependent’ (GO: 0006351) and ‘small molecule metabolic process’
(GO: 0044281) (Fig. 7A).
Furthermore, KEGG analysis indicated that the most significant
pathways of co-expressed genes were ‘metabolic pathways’ (path ID:
01100), ‘carbon metabolism’ (path ID: 01200) and
‘glycerophospholipid metabolism’ (path ID: 00564) (Fig. 7B).
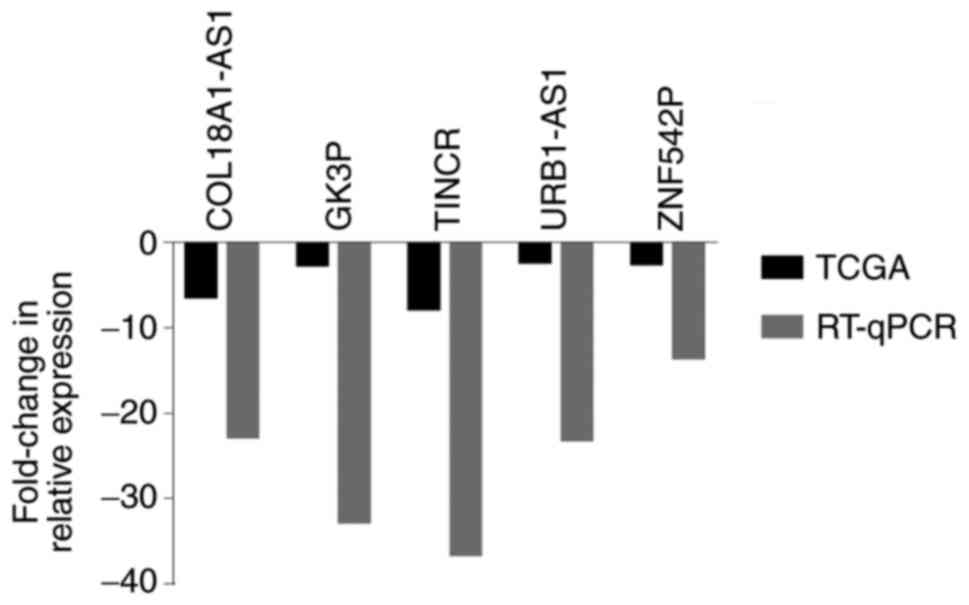
RT-qPCR verification
To verify the bioinformatics analysis results, 5
lncRNAs were randomly selected and their expression was analyzed in
17 pairs of ccRCC tissue samples. The results demonstrated that
these 5 lncRNAs (COL18A1-AS1, GK3P, TINCR, URB1-AS1 and ZNF542P)
were consistently downregulated compared with those in the adjacent
non-tumor tissue (P<0.05) (Fig.
8). The results suggested that there was a consistent trend of
experimental verification and TCGA database analysis.
Discussion
RCC is one of the most common cancer types. In the
United States, RCC causes nearly 64,000 new cancer cases and
>13,000 mortalities annually (28). The early diagnosis and treatment of
RCC have increased the prospects for patients, with a positive
impact. Molecular markers can assist in improving the effectiveness
of early diagnosis and prognosis prediction, although they have not
yet become clinically routine (29). Recently, novel molecular markers
have been investigated, and some of these markers show clinical
prognostic potential. For example, mannosyl (α-1,6-)-glycoprotein
β-1,6-N-acetyl-glucosaminyltransferase is a potentially independent
prognostic biomarker of patients with ccRCC subsequent to
nephrectomy (30), and
protocadherin 8 methylation is correlated with adverse clinical
features (31). However, the
majority of studies focus on a single biomarker or a small sample
set. Based on a large dataset provided by TCGA public database, a
large number of studies have evaluated the prognostic value of
lncRNAs in various cancer types, including lung, gastric and breast
cancer (32–34).
In the present study, a novel lncRNA signature for
ccRCC prognosis was identified by screening differently expressed
lncRNAs from four different groups of patients depending on tumor
stages. Analysis of the univariate Cox proportional hazards
regression models showed that 106 lncRNAs were significantly
associated with OS time (P<0.05). Using the multivariate Cox
proportional hazards regression analysis, 19 key lncRNAs were then
identified (P<0.05) (LOC606724, SCART1, SNORA8, LOC728024,
HAVCR1P1, FCGR1CP, LINC00240, LINC00894, GK3P, SNHG3, KIAA0125,
URB1-AS1, ZNF542P, TINCR, LINC00926, PDXDC2P, COL18A1-AS1,
LINC00202-1 and LINC00937). Next, an lncRNA prognostic signature
was constructed based on a risk score model, which was a
combination of the expression profiles of 19 lncRNAs weighted by
the coefficients obtained by the multivariate Cox analysis. The
results showed that this lncRNA tag could independently predict the
OS time of patients with ccRCC. The efficacy of individual markers
is limited, while multi-level markers could improve the prognostic
value. The innovation of this study is tantamount to construct a
risk score model and combine TCGA sequencing data with clinical
features for comprehensive analysis. To the best of our knowledge,
this is the first study to analyze not only lncRNAs associated with
ccRCC prognosis using a risk score model, but also to include
experimental validation.
The majority of previous studies have been based on
the association between an individual lncRNA and ccRCC prognosis.
Yao et al (35) used small
interfering RNA to evaluate the biological function of CADM1-AS1
in vitro, and the results showed CADM1-AS1 to be a novel
tumor suppressor in ccRCC. Using RT-qPCR, Xue et al
(36) detected the expression
pattern of NBAT-1 in patients with ccRCC and in renal cancer cell
lines, and analyzed the correlation with clinicopathological
features. The study found significantly decreased expression of
NBAT-1 in the ccRCC tissues and renal cancer cells compared with
that in the adjacent normal tissues, and that this low level was
associated with advanced features and a poor prognosis. Also, a
number of similar studies screened lncRNAs associated with tumor
prognoses in ccRCC, including LOC389332, SPRY4-IT1 and MFI2-AS114
(15,37,38).
One similar study screened 5 lncRNAs and constructed a signature of
ccRCC (39). The difference is the
fact that the present study screened for differently expressed
lncRNAs based on the tumor stages compared with the adjacent
non-tumor tissue. A risk scoring model was constructed based on
each target lncRNA and combined TCGA sequencing data with clinical
features for comprehensive analysis. Furthermore, RT-qPCR
validation was performed on specimens from 17 ccRCC and paired
adjacent non-tumor tissues, and the results showed the consistency
of TCGA data analysis.
In the present study, a 19-lncRNA signature was
identified based on lncRNA expression, and the prognostic power of
this lncRNA signature was assessed by the time series ROC curve.
The result of the risk score model indicated that this 19-lncRNA
signature has independent prognostic value. Also, the function of
these key lncRNAs is not completely understood. Therefore, genes
were screened for that are closely associated with these key
lncRNAs (Pearson |R|>0.5). These genes were mainly enriched in
‘metabolic pathways’, ‘carbon metabolism’ and ‘glycerophospholipid
metabolism’. These results may lay the groundwork for further
studies.
The results of the present study may have potential
clinical significance, but it cannot be denied that there are also
certain limitations in this study. For example, the lncRNAs were
identified through the tumor stage of ccRCC, but tumor metastasis
was not considered. Due to the limited number of samples, further
molecular studies of these lncRNAs are also lacking.
In conclusion, to the best of our knowledge, the
present study is the first to use TCGA public database to identify
and comprehensively analyze lncRNAs that are significantly
associated with ccRCC prognosis. A 19-lncRNA signature was
identified and the joint prognostic power was evaluated, confirming
this may be a potential biomarker for the prognosis of ccRCC.
However, further studies are required to investigate the functions
and molecular mechanisms of these lncRNAs in ccRCC.
Acknowledgements
The authors would like to thank Mr. Donglin Cheng
from Nanjing Genemap Co., Ltd., (Nanjing, Jiangsu, China) for
providing technical assistance to the project.
Funding
The present study was supported by the National
Natural Science Foundation of China (grant nos. 81673132 and
81472939), the Scientific Research Foundation of Graduate School of
Southeast University (YBJJ1796), and the Fundamental Research Funds
for the Central Universities and Innovative Research Project for
postgraduates in Colleges of Jiangsu province.
Availability of data and materials
The datasets generated and analyzed during the
current study are available in TCGA repository (http://cancergenome.nih.gov).
Authors' contributions
TL and GYL conceived and designed the study. TL and
JS performed the experiments. YZ and XMZ performed tissue sample
collection for patients with ccRCC. WJW, SY, SYX, WWH, HP analyzed
and interpreted the results. LHY and YPP assisted with study design
and provided advice. TL performed analysis and quality control, and
was a major contributor in writing the manuscript. All authors read
and approved the final manuscript.
Ethics approval and consent to
participate
All procedures performed in the study that involved
human participants were in accordance with the ethical standards of
the institutional and national research committee and with the 1964
Helsinki declaration and its later amendments or comparable ethical
standards.
Patient consent for publication
Informed consent was obtained from all individual
participants included in the study.
Competing interests
The authors declare that they have no competing
interests.
Glossary
Abbreviations
Abbreviations:
|
RCC
|
renal cell carcinomas
|
|
ccRCC
|
clear cell RCC
|
|
lncRNA
|
long-chain non-coding RNA
|
|
TCGA
|
The Cancer Genome Atlas
|
|
OS
|
overall survival
|
|
TNM
|
Tumor-Node-Metastasis
|
|
AUC
|
area under the curve
|
|
GO
|
Gene Ontology
|
|
ROC
|
receiver operating characteristic
|
|
KEGG
|
Kyoto Encyclopedia of Genes and
Genomes
|
|
RT-qPCR
|
reverse transcription-quantitative
polymerase chain reaction
|
References
|
1
|
Capitanio U and Montorsi F: Renal cancer.
Lancet. 387:894–906. 2015. View Article : Google Scholar : PubMed/NCBI
|
|
2
|
Ferlay J, Shin HR, Bray F, Forman D,
Mathers C and Parkin DM: Estimates of worldwide burden of cancer in
2008: GLOBOCAN 2008. Int J Cancer. 127:2893–2917. 2010. View Article : Google Scholar : PubMed/NCBI
|
|
3
|
Siegel RL, Miller KD and Jemal A: Cancer
statistics, 2015. CA Cancer J Clin. 65:5–29. 2015. View Article : Google Scholar : PubMed/NCBI
|
|
4
|
Baldewijns MM, van Vlodrop IJ, Schouten
LJ, Soetekouw PM, de Bruïne AP and van Engeland M: Genetics and
epigenetics of renal cell cancer. Biochim Biophys Acta.
1785:133–155. 2008.PubMed/NCBI
|
|
5
|
Arsanious A, Bjarnason GA and Yousef GM:
From bench to bedside: Current and future applications of molecular
profiling in renal cell carcinoma. Mol cancer. 8:202009. View Article : Google Scholar : PubMed/NCBI
|
|
6
|
Cohen HT and McGovern FJ: Renal-cell
carcinoma. N Engl J Med. 353:2477–2490. 2005. View Article : Google Scholar : PubMed/NCBI
|
|
7
|
Lam JS, Shvarts O, Leppert JT, Pantuck AJ,
Figlin RA and Belldegrun AS: Postoperative surveillance protocol
for patients with localized and locally advanced renal cell
carcinoma based on a validated prognostic nomogram and risk group
stratification system. J Urol. 174:466–472; quiz 801. 2005.
View Article : Google Scholar : PubMed/NCBI
|
|
8
|
Tsui KH, Shvarts O, Smith RB, Figlin RA,
deKernion JB and Belldegrun A: Prognostic indicators for renal cell
carcinoma: A multivariate analysis of 643 patients using the
revised 1997 TNM staging criteria. J Urol. 163:1090–1095; quiz
1295. 2000. View Article : Google Scholar : PubMed/NCBI
|
|
9
|
Thompson RH, Gillett MD, Cheville JC,
Lohse CM, Dong H, Webster WS, Krejci KG, Lobo JR, Sengupta S, Chen
L, et al: Costimulatory B7-H1 in renal cell carcinoma patients:
Indicator of tumor aggressiveness and potential therapeutic target.
Proc Natl Acad Sci USA. 101:17174–17179. 2004. View Article : Google Scholar : PubMed/NCBI
|
|
10
|
Harshman LC, Choueiri TK, Drake C and
Stephen Hodi F Jr: Subverting the B7-H1/PD-1 pathway in advanced
melanoma and kidney cancer. Cancer J. 20:272–280. 2014. View Article : Google Scholar : PubMed/NCBI
|
|
11
|
Thompson RH and Kwon ED: Significance of
B7-H1 overexpression in kidney cancer. Clinical Genitourin Cancer.
5:206–211. 2006. View Article : Google Scholar
|
|
12
|
Chandra Gupta S and Nandan Tripathi Y:
Potential of long non-coding RNAs in cancer patients: From
biomarkers to therapeutic targets. Int J Cancer. 140:1955–1967.
2017. View Article : Google Scholar : PubMed/NCBI
|
|
13
|
Wang L, Cai Y, Zhao X, Jia X, Zhang J, Liu
J, Zhen H, Wang T, Tang X, Liu Y, et al: Down-regulated long
non-coding RNA H19 inhibits carcinogenesis of renal cell carcinoma.
Neoplasma. 62:412–418. 2015. View Article : Google Scholar : PubMed/NCBI
|
|
14
|
Hirata H, Hinoda Y, Shahryari V, Deng G,
Nakajima K, Tabatabai ZL, Ishii N and Dahiya R: Long noncoding RNA
MALAT1 promotes aggressive renal cell carcinoma through Ezh2 and
interacts with miR-205. Cancer Res. 75:1322–1331. 2015. View Article : Google Scholar : PubMed/NCBI
|
|
15
|
Zhang HM, Yang FQ, Yan Y, Che JP and Zheng
JH: High expression of long non-coding RNA SPRY4-IT1 predicts poor
prognosis of clear cell renal cell carcinoma. Int J Clin Exp
Pathol. 7:5801–5809. 2014.PubMed/NCBI
|
|
16
|
Song S, Wu Z, Wang C, Liu B, Ye X, Chen J,
Yang Q, Ye H, Xu B and Wang L: RCCRT1 is correlated with prognosis
and promotes cell migration and invasion in renal cell carcinoma.
Urology. 84:730.e1–e7. 2014. View Article : Google Scholar
|
|
17
|
Li CY, Liang GY, Yao WZ, Sui J, Shen X,
Zhang YQ, Peng H, Hong WW, Ye YC, Zhang ZY, et al: Identification
and functional characterization of microRNAs reveal a potential
role in gastric cancer progression. Clin Transl Oncol. 19:162–172.
2017. View Article : Google Scholar : PubMed/NCBI
|
|
18
|
Chan AC, Fan ST, Poon RT, Cheung TT, Chok
KS, Chan SC and Lo CM: Evaluation of the seventh edition of the
American Joint Committee on Cancer tumour-node-metastasis (TNM)
staging system for patients undergoing curative resection of
hepatocellular carcinoma: Implications for the development of a
refined staging system. HPB. 15:439–448. 2013. View Article : Google Scholar : PubMed/NCBI
|
|
19
|
Sui J, Li YH, Zhang YQ, Li CY, Shen X, Yao
WZ, Peng H, Hong WW, Yin LH, Pu YP, et al: Integrated analysis of
long non-coding RNAassociated ceRNA network reveals potential
lncRNA biomarkers in human lung adenocarcinoma. Int J Oncol.
49:2023–2036. 2016. View Article : Google Scholar : PubMed/NCBI
|
|
20
|
Miao Y, Sui J, Xu SY, Liang GY, Pu YP and
Yin LH: Comprehensive analysis of a novel four-lncRNA signature as
a prognostic biomarker for human gastric cancer. Oncotarget.
8:75007–75024. 2017. View Article : Google Scholar : PubMed/NCBI
|
|
21
|
Zeng JH, Liang L, He RQ, Tang RX, Cai XY,
Chen JQ, Luo DZ and Chen G: Comprehensive investigation of a novel
differentially expressed lncRNA expression profile signature to
assess the survival of patients with colorectal adenocarcinoma.
Oncotarget. 8:16811–16828. 2017.PubMed/NCBI
|
|
22
|
Zhao Q and Sun J: Cox survival analysis of
microarray gene expression data using correlation principal
component regression. Stat Appl Genet Mol Biol. 6:Article 16. 2007.
View Article : Google Scholar : PubMed/NCBI
|
|
23
|
Zhou X, Huang Z, Xu L, Zhu M, Zhang L,
Zhang H, Wang X, Li H, Zhu W, Shu Y, et al: A panel of 13-miRNA
signature as a potential biomarker for predicting survival in
pancreatic cancer. Oncotarget. 7:69616–69624. 2016.PubMed/NCBI
|
|
24
|
Heagerty PJ, Lumley T and Pepe MS:
Time-dependent ROC curves for censored survival data and a
diagnostic marker. Biometrics. 56:337–344. 2000. View Article : Google Scholar : PubMed/NCBI
|
|
25
|
Liu Z, Shao W and Shen Y, Ji M, Chen W, Ye
Y and Shen Y: Characterization of new microsatellite markers based
on the transcriptome sequencing of Clematis finetiana. Hereditas.
155:232018. View Article : Google Scholar : PubMed/NCBI
|
|
26
|
Sho S, Court CM, Winograd P, Russell MM
and Tomlinson JS: A prognostic mutation panel for predicting cancer
recurrence in stages II and III colorectal cancer. J Surg Oncol.
116:996–1004. 2017. View Article : Google Scholar : PubMed/NCBI
|
|
27
|
Livak KJ and Schmittgen TD: Analysis of
relative gene expression data using real-time quantitative PCR and
the 2−ΔΔCT method. Methods. 25:402–408. 2001. View Article : Google Scholar : PubMed/NCBI
|
|
28
|
Krishnan B, Rose TL, Kardos J, Milowsky MI
and Kim WY: Intrinsic genomic differences between African American
and white patients with clear cell renal cell carcinoma. JAMA
Oncol. Mar 24–2016.(Epub ahead of print). doi:
10.1001/jamaoncol.2016.0005. View Article : Google Scholar : PubMed/NCBI
|
|
29
|
Eichelberg C, Junker K, Ljungberg B and
Moch H: Diagnostic and prognostic molecular markers for renal cell
carcinoma: A critical appraisal of the current state of research
and clinical applicability. Eur Urol. 55:851–863. 2009. View Article : Google Scholar : PubMed/NCBI
|
|
30
|
Liu Y, Liu H, Liu W, Zhang W, An H and Xu
J: β1,6-N-acetylglucosaminyltransferase V predicts recurrence and
survival of patients with clear-cell renal cell carcinoma after
surgical resection. World J Urol. 33:1791–1799. 2015. View Article : Google Scholar : PubMed/NCBI
|
|
31
|
Lin YL, Wang YL, Fu XL and Ma JG: Aberrant
methylation of PCDH8 is a potential prognostic biomarker for
patients with clear cell renal cell carcinoma. Med Sci Monit.
20:2380–2385. 2014. View Article : Google Scholar : PubMed/NCBI
|
|
32
|
Zhang Y, Wang DL, Yan HY, Liao JY, He JH,
Hu KS, Deng WX, Wang YJ, Xing HT, Koeffler HP, et al: Genome-wide
study of ER-regulated lncRNAs shows AP000439.3 may function as a
key regulator of cell cycle in breast cancer. Oncol Rep.
38:3227–3237. 2017. View Article : Google Scholar : PubMed/NCBI
|
|
33
|
Li CY, Liang GY, Yao WZ, Sui J, Shen X,
Zhang YQ, Peng H, Hong WW, Ye YC, Zhang ZY, et al: Integrated
analysis of long non-coding RNA competing interactions reveals the
potential role in progression of human gastric cancer. Int J Oncol.
48:1965–1976. 2016. View Article : Google Scholar : PubMed/NCBI
|
|
34
|
Zheng S, Zheng D, Dong C, Jiang J, Xie J,
Sun Y and Chen H: Development of a novel prognostic signature of
long non-coding RNAs in lung adenocarcinoma. J Cancer Res Clin
Oncol. 143:1649–1657. 2017. View Article : Google Scholar : PubMed/NCBI
|
|
35
|
Yao J, Chen Y, Wang Y, Liu S, Yuan X, Pan
F and Geng P: Decreased expression of a novel lncRNA CADM1-AS1 is
associated with poor prognosis in patients with clear cell renal
cell carcinomas. Int J Clin Exp Pathol. 7:2758–2767.
2014.PubMed/NCBI
|
|
36
|
Xue S, Li QW, Che JP, Guo Y, Yang FQ and
Zheng JH: Decreased expression of long non-coding RNA NBAT-1 is
associated with poor prognosis in patients with clear cell renal
cell carcinoma. Int J Clin Exp Pathol. 8:3765–3774. 2015.PubMed/NCBI
|
|
37
|
Flippot R, Mouawad R, Spano JP, Rouprêt M,
Compérat E, Bitker MO, Parra J, Vaessen C, Allanic F, Manach Q, et
al: : Expression of long non-coding RNA MFI2-AS1 is a strong
predictor of recurrence in sporadic localized clear-cell renal cell
carcinoma. Sci Rep. 7:85402017. View Article : Google Scholar : PubMed/NCBI
|
|
38
|
Jin P, Wang J and Liu Y: Downregulation of
a novel long non-coding RNA, LOC389332, is associated with poor
prognosis and tumor progression in clear cell renal cell carcinoma.
Exp Ther Med. 13:1137–1142. 2017. View Article : Google Scholar : PubMed/NCBI
|
|
39
|
Shi D, Qu Q, Chang Q, Wang Y, Gui Y and
Dong D: A five-long non-coding RNA signature to improve prognosis
prediction of clear cell renal cell carcinoma. Oncotarget.
8:58699–58708. 2017.PubMed/NCBI
|