Introduction
There were 4,292,000 new cases of cancer and
2,814,000 cases of cancer-associated mortality reported in 2015 in
China (1). Among all types of
cancer, prostate cancer (PCa) was diagnosed in ~603,000 men, and
over 26,000 men succumbed to this disease (1). Although the incidence and mortality
rates of PCa remain lower in China than in Western countries, they
are increasing rapidly. Thus, PCa has become one of the major
healthy issues for men in China.
RNA-binding motif 3 (RBM3) was originally found in
the human fetal brain by Danno et al (2). The RBM3 gene is located at chromosome
Xp11.23 and belongs to a highly conserved cold stress protein
family. RBM3 was primarily reported as an RNA chaperone that
preserves the translation of mRNAs at low temperatures. Recently,
it was reported that the expression of RBM3 was also altered in
response to other environmental stresses, including hypoxia,
radiation, cellular apoptosis and necrosis (3). Additionally, RBM3 was found to be
associated with brain development and may serve an important role
in the differentiation of nerve cells (4). Although there have been a number of
studies showing that RBM3 is upregulated in multiple cancer types,
including ovarian cancer, breast cancer, melanoma, bladder cancer,
colorectal cancer and PCa, the increased expression level of RBM3
in tumor samples was largely associated with a good prognosis
(3,5–10).
However, the role of RBM3 in PCa remains controversial. For
example, Grupp et al (11)
found that RBM3 was highly expressed in poorly differentiated and
more invasive PCa, and could be used as an independent prognostic
factor to predict the early recurrence of tumors. On the other
hand, Jonsson et al (10)
reported that in PCa tissue samples from another patient cohort,
the high expression of RBM3 protein, particularly RBM3 in the
nucleus, was associated with a good prognosis, which may be due to
the involvement of RBM3 in regulating a variety of cellular
processes to maintain DNA integrity (10).
Our previous study found that the overexpression of
RBM3 in PCa cells could suppress the expression of CD44 molecule
(Indian blood group) (CD44) alternative splicing variant CD44v8-10;
this suppression resulted in the cancer cells losing stem cell-like
features, such as proliferating in soft agar or growing under the
skin of nude mice. Thus, the loss of the expression of RBM3
enhances cell survival under stress and may favor the development
of advanced cancer types (12).
RBM3 may serve a different role in different types of cancer, and
this possible role led to further investigation of the molecular
relevance of RBM3 in PCa cells in the present study.
The present study analyzed the impact of RBM3
expression on the whole transcriptome of PCa cells using
high-throughput RNA sequencing (RNA-seq). Through Gene Ontology
(GO) analysis, pathway analysis and differentially expressed gene
(DEG) interaction network analysis, the potential association
between these DEGs and RBM3 regulation was investigated in an
attempt to determine the molecular mechanisms underlying the impact
of RBM3 on PCa development.
Materials and methods
Cell culture
The human prostate tumor PC3 cell line was purchased
from the American Type Culture Collection (ATCC; Manassas, VA,
USA). Cells were cultured in RPMI-1640 supplemented with 10% fetal
bovine serum and 1% penicillin-streptomycin (all from HyClone; GE
Healthcare Life Sciences, Logan, UT, USA) at 37°C in a humidified
air incubator with 5% CO2.
Plasmid and transfection
pCMV6-RBM3-GFP and pCMV6-AC-GFP, which were
constructed previously (12), were
transfected into PC3 cells at a final concentration of 1 µg/ml
using Lipofectamine® 3000 (P3000™; Thermo Fisher
Scientific, Inc., Waltham, MA, USA) according to the manufacturer's
protocols. The cell medium was replaced with complete medium after
6 h of transfection, and the transfection efficiency was estimated
48 h later. The stably transduced PC3 cells were selected by
culturing cells in medium supplemented with puromycin for 20 days,
and the PC3-RBM3#1-GFP (PC3-R1) clone that overexpressed RBM3 and
the PC3-AC-GFP (PC3-GFP) clone that was constructed as the control
vector were chosen for further experiments.
Three pairs of short interfering RNAs (siRNAs)
specific for RBM3 were synthesized by General Biosystems (Chuzhou,
China). siRNA was transfected with PC-3 cells at 100 nM total oligo
concentration, using P3000 (Thermo Fisher Scientific, Inc.)
according to the manufacturer's protocols. Briefly, the P3000
reagent and RNA were incubated for 5 min, and then the RNA-lipid
complex was added to the cells. The cell medium was replaced with
complete medium after 6 h of transfection, and the transfection
efficiency was measured 48 h later. The siRNA with the highest
knockdown efficacy was chosen for further experiments. All the
subsequent experiments were performed within 48–72 h of
transfection. The sequences of the siRNAs were as follows:
si-RBM3-1 forward, 5′-CAUGUCCUCUGAAGAAGGAdTdT-3′ and reverse,
5′-UCCUUCUUCAGAGGACAUGdTdT-3′; si-RBM3-2 forward,
5′-GGUUUCAUCACCUUCACCAdTdT-3′ and si-RBM3-2 reverse,
5′-UGGUGAAGGUGAUGAAACCdTdT-3′; si-RBM3-3 forward,
5′-GAGACUAUAAUGGCAGAAAdTdT-3′ and reverse,
5′-UUUCUGCCAUUAUAGUCUCdTdT-3′; si-NC forward,
5′-UUCUCCGAACGUGUCACGUdTdT-3′ and reverse,
5′-ACGUGACACGUUCGGAGAAdTdT-3′.
Western blotting
Cells were harvested in radioimmunoprecipitation
assay lysis buffer (Beyotime Institute of Biotechnology, Shenzhen,
China) and heated for 10 min at 90°C. Protein concentrations were
measured using the bicinchoninic acid assay. A total of 50 µg per
lane of protein extracts was then separated by 10%
SDS-polyacrylamide gel electrophoresis (SDS-PAGE) and transferred
to polyvinylidene fluoride membranes (EMD Millipore, Billerica, MA,
USA). The membranes were blocked with Tris-buffered saline plus
Tween-20 (TBS-T; 0.1% Tween-20) with 5% (w/v) skimmed milk for 1 h
at 37°C and then incubated with either RBM3 antibody (cat. no.
AMAb90655; Atlas Antibodies AB, Stockholm, Sweden) that was diluted
to 1:1,000 in TBS-T, or β-actin antibody (cat. no. A2228;
Sigma-Aldrich; Merck KGaA, Damstadt, Germany) that was diluted to
1:5,000 in TBS-T, at 4°C overnight. Subsequent to being washed
three times with TBS-T for 15 min each time, the membranes were
incubated with the rabbit anti-mouse unconjugated IgG (cat. no.
ab46540; Abcam, Cambridge, MA, USA) for 1.5 h at 37°C. Subsequent
to three washes with TBS-T for 15 min each time, the immuno bands
were visualized using Enhanced Chemiluminescence reagents (Transgen
Biotech, Co., Ltd., Beijing, China) on a MicroChemi™
Chemiluminescent Imaging system (DNR Bio-Imaging Systems, Ltd.,
Mahale HaHamisha, Israel). β-actin (Sigma-Aldrich; Merck KGaA) was
used as an internal control for total protein measurement.
RNA extraction and high-throughput
sequencing
Total RNA was extracted using the SV total RNA
Isolation kit (Promega Corporation, Madison, WI, USA) according to
the manufacturer's protocols. The quality and quantity of the
purified RNA were determined by measuring the absorbance at 260/280
nm using a Smartspec™ Plus spectrophotometer (Bio-Rad Laboratories,
Inc., Hercules, CA, USA). RNA integrity was further verified by
electrophoresis on a 1.5% agarose gel.
For each sample, 10 µg total RNA was used for
RNA-seq library preparation using an RNA-Seq Library Preparation
kit for Whole Transcriptome Discovery (Gnomegen, San Diego, CA,
USA). Polyadenylated mRNAs were purified and concentrated with
oligo(dT)-conjugated magnetic beads (Thermo Fisher Scientific,
Inc.) prior to use for directional RNA-seq library preparation.
Purified mRNAs were iron fragmented at 95°C followed by end repair
and 5′-adaptor ligation. Next, reverse transcription was performed
with reverse transcription (RT) primer harboring a 3′-adaptor
sequence and randomized hexamer using RT Master mix (Gnomegen) with
the following reaction conditions: 25°C for 10 min, 42°C for 40 min
and 70°C for 15 min, followed by cooling to 4°C. The cDNAs were
purified and amplified, and polymerase chain reaction (PCR) was
performed using 2X HiFi PCR Master mix (Gnomegen) with the
following reaction conditions: 98°C for 45 sec, 98°C for 15 sec,
60°C for 30 sec and 72°C for 30 sec, for 15 cycles. PCR products
corresponding to 200–500 bps were collected by Size Selector
(Gnomegen), and quantified and stored at −80°C until used for
sequencing.
For high-throughput sequencing, the libraries were
prepared following the manufacturer's protocols and applied to an
Illumina NextSeq 500 system (Illumina, Inc., San Diego, CA, USA)
for 151 nt pair-end sequencing by ABLife, Inc. (Wuhan, China).
RT-quantitative PCR (RT-qPCR)
cDNA was synthesized using PrimeScript™ RT Master
mix (Takara Biotechnology Co., Ltd., Dalian, China), and RT-qPCR
was performed using SYBR Premix EX Taq™ (Takara, Dalian, China) and
the LightCycler™ 480 II system (Roche Diagnostics, Basel,
Switzerland). PCR cycling conditions were 95°C for 30 sec, then
95°C for 5 sec, 60°C for 30 sec and 72°C for 30 sec, for 40 cycles.
A housekeeping gene β-actin was used as the internal control for
each gene. The primers for all genes were purchased from Sangon
Biotech, Co., Ltd. (Shanghai, China). The sequences of the forward
(F) and reverse (R) primers of selected genes were as follows
(remainder are available upon request): PLA2G2A (F),
5′-ATGAAGACCCTCCTACTGTTGG-3′ and PLA2G2A (R),
5′-GCTTCCTTTCCTGTCGTCAACT-3′; GNG5 (F),
5′-ACTCAACCGCGTAAAAGTTTCC-3′ and GNG5 (R),
5′-GGGTCTGAAGGGATTTGTACTTG-3′; EDN1 (F),
5′-AGAGTGTGTCTACTTCTGCCA-3′ and EDN1 (R),
5′-CTTCCAAGTCCATACGGAACAA-3′; NOS3 (F), 5′-TGATGGCGAAGCGAGTGAAG-3′
and NOS3 (R), 5′-ACTCATCCATACACAGGACCC-3′; GAL (F),
5′-CCGGCCAAGGAAAAACGAG-3′ and GAL (R), 5′-GAGGCCATTCTTGTCGCTGA-3′;
ACE (F), 5′-CCACGTCCCGGAAATATGAAG-3′ and ACE (R),
5′-AGTCCCCTGCATCTACATAGC-3′; CD38 (F), 5′-CAACTCTGTCTTGGCGTCAGT-3′
and CD38 (R), 5′-CCCATACACTTTGGCAGTCTACA-3′; MCHR2 (F),
5′-GCAGCAGCATTAACCCTTTTC-3′ and MCHR2 (R),
5′-TCTCAGTCGCTCTTCTTTGGAT-3′; PTGDR2 (F),
5′-AAAAGGCTCGGGAAGGTTAAATG-3′ and PTGDR2 (R),
5′-ACCGGGGAACCAAGAGAGAG-3′; RBM3 (F), 5′-CTTCAGCAGTTTCGGACCTA-3′
and RBM3 (R), 5′-ACCATCCAGAGACTCTCCGT-3′; and β-actin (F),
5′-CATGTACGTTGCTATCCAGGC-3′ and β-actin (R),
5′-CTCCTTAATGTCACGCACGAT-3′. The relative expression level (defined
as a fold-change) of each target gene (2−ΔΔCq) was
normalized to the β-actin reference (ΔCq) (13). The final expression level of each
gene was presented as the ratio of that in the experimental group
to that in the control sample. Three independent experiments were
performed and each sample was tested three times.
Analysis of transcriptional data
GO analysis
In general, GO analyzes the following aspects:
Integrating the protein group information from different organisms,
determining the function of the protein domain; identifying the
functional similarity of the abnormal expression of the gene in the
disease or in aging; and predicting the genes associated with a
disease. In the present study, GO analysis was performed to confirm
the biological implications of the expression of specific genes in
significant or representative profiles of genes that were
differentially expressed, The data of the GO annotations, including
the distribution of biological process (BP), cellular component
(CC) and molecular function (MF) were downloaded from the GO
Consortium (http://www.geneontology.org/) and the Database for
Annotation, Visualization and Integrated Discovery (https://david.ncifcrf.gov/). Fisher's exact test was
used to identify significant GO categories, and the false discovery
rate (FDR) was used to correct the P-values.
Pathway analysis and pathway
interaction network
Pathway analysis was used to confirm the significant
pathways of the DEGs according to the Kyoto Encyclopedia of Genes
and Genomes (KEGG) database (14),
which is a database resource for understanding high-level functions
and utilities of the biological system. Fisher's exact test was
applied to select significant pathways, and the threshold of
significance was defined according to the P-value and FDR.
P<0.05 was determined to indicate a statistically significant
difference. The unique genes enriched in those biological pathways
with P<0.05 (Fisher's exact test) were selected to be applied to
ClueGO ver 2.3.3 (15) and the
plug-in of Cytoscape ver 3.5.1 (16) to graphically represent pathways,
namely the pathway interaction network. ClueGO is a Cytoscape
plug-in that visualizes the biological terms for amount of genes in
a functionally grouped network. In the network, the colour of the
node could be switched between functional groups and cluster
distribution easily.
Gene-action network
All the DEGs were analyzed to determine the
association among them using the Search Tool for the Retrieval of
Interacting Genes/Proteins (STRING; http://string-db.org/). STRING is a database of known
and predicted protein-protein interactions (PPIs). The interaction
association provided by STRING is mainly based on confidence score
(reliability index) and other subsidiary information. The
associations among the DEGs are included into the categories of
‘neighborhood’, ‘experiment’, ‘databases’, ‘co-occurrence’,
‘co-expression’, ‘gene-fusion’, ‘textmining’ and ‘homology’. The
STRING database was assigned according to the score of each
directory, and then the combined score was drawn according to each
assignment. The scores with a confidence interval of >0.4 were
considered to be highly reliable and could represent the degree of
interactions between DEGs.
Statistical analysis
Statistical analysis was performed using SPSS
version 21.0 (IBM, Corp., Armonk, NY, USA). Experimental data are
presented as the mean ± standard deviation. Multigroup comparisons
were conducted by one-way analysis of variance, and the difference
was further analyzed by a Student-Newman-Keuls post hoc test.
Pearson's correlation analysis was used to compare the correlation
between the expression of genes in PC3-siR1 and PC3-siN cells.
Fisher's exact test was applied to select significant altered
pathways of DEGs. P<0.05 was considered to indicate a
statistically significant difference.
Results
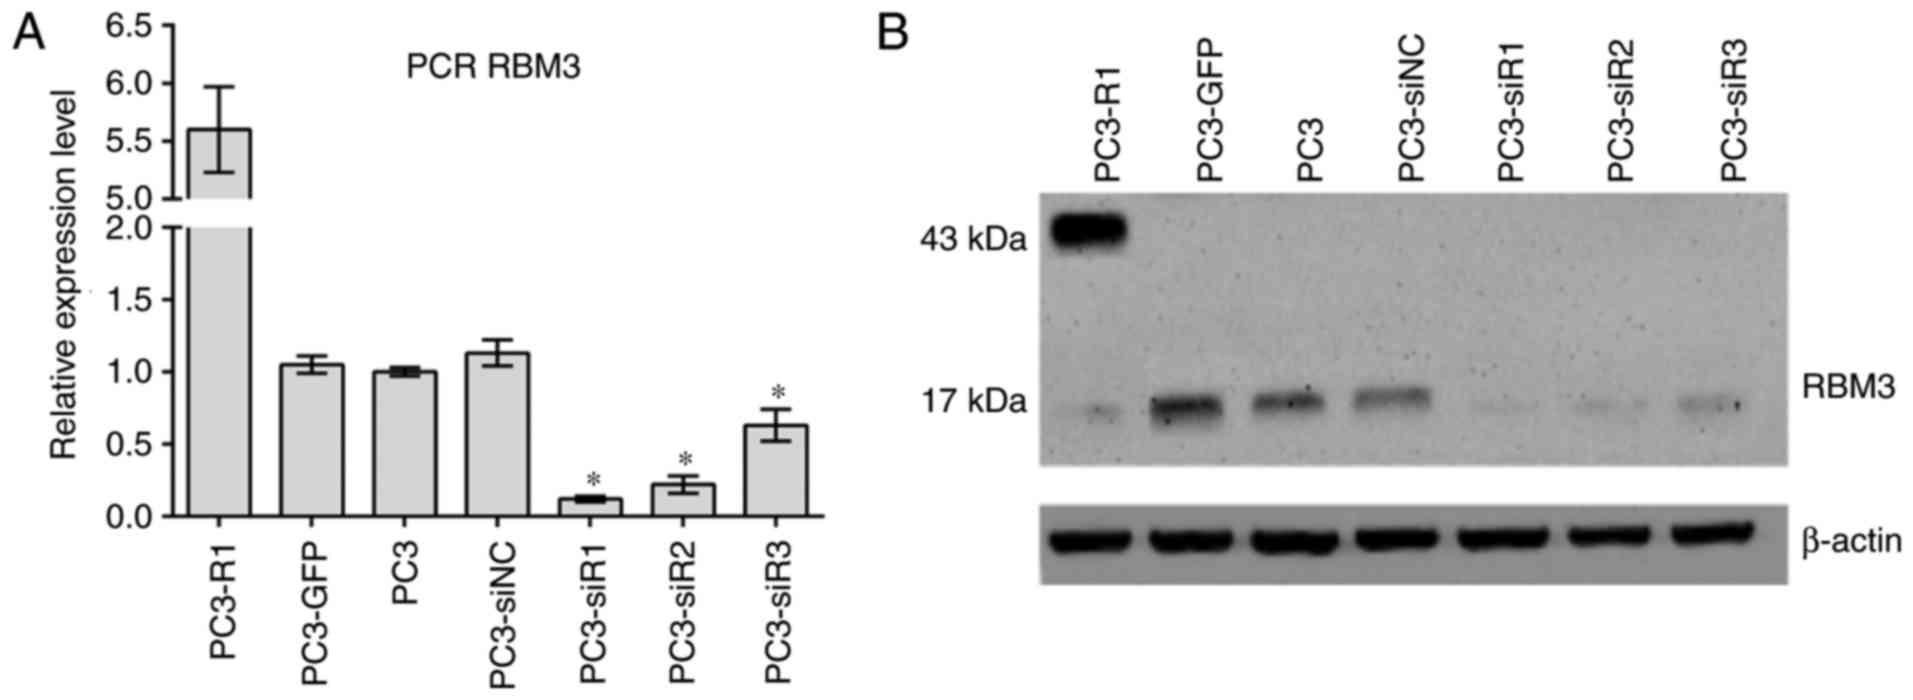
Expression of RBM3 in cell lines
The expression of RBM3 in each cell line used in the
study was detected by western blotting and RT-qPCR. As shown in
Fig. 1, GFP-tagged RBM3 was
strongly expressed in the RBM3-overexpressing PC3-R1 cell line,
while endogenous RBM3 was markedly decreased in the si-RBM3-treated
cells at the protein and mRNA levels. Among the three
si-RBM3-treated cells, si-RBM3-1-treated cells (PC3-siR1) showed
the largest decrease in the expression of RBM3. Thus, the PC3-siR1
cells were chosen for further RNA sequencing.
Display of RNA-seq analysis data
Total RNA isolated from PC3 cells treated with
non-targeting control siRNA (PC3-siNC) or RBM3 siRNA (PC3-siR1) was
subjected to RNA-seq. The decreased expression of RBM3 was verified
in the sequencing data, and the high quality clean reads obtained
in the sequencing data are available upon request.
GO analysis
The DEGs between the PC3-siNC and PC3-siR1 cells
were screened out by edgeR. First, the data obtained in RNA-seq was
evaluated for reliability. A total of 698 significantly DEGs were
obtained; 446 genes were upregulated and 252 genes were
downregulated in PC3-siR1 compared with that in PC3-siNC (Fig. 2). A volcano plot was created to show
the overall changes in gene expression that were associated with
RBM3-knockdown.
To further analyze the potential association between
these DEGs and RBM3 regulation in PC3 cells, all the obtained DEGs
were subjected to GO analysis (Fig.
3). A total of 36 GO terms were enriched in BP layout among all
the DEGs, including ‘membrane depolarization’,
‘phosphatidylethanolamine acyl-chain remodeling’,
‘phosphatidylcholine acyl-chain remodeling’, ‘synaptic
transmission’ and ‘blood circulation’, among others (data not
shown). Among the upregulated DEGs, 17 GO terms were enriched in BP
layout, including ‘multicellular organismal development’,
‘cartilage development’, ‘epidermis development’,
‘phototransduction’, ‘visible light’ and ‘cell differentiation’,
while among the downregulated DEGs, 10 GO terms were enriched in BP
layout, including ‘cell-cell signaling’, ‘transport’,
‘transmembrane transport’, ‘synaptic transmission’ and ‘response to
drug’. In the 36 GO terms among all the DEGs, several terms were
closely associated with lipid metabolism, including
‘glycerophospholipid biosynthetic process’, ‘phospholipid metabolic
process’, ‘lipid catabolic process’, ‘phosphatidylethanolamine
acyl-chain remodeling’ and ‘phosphatidylcholine acyl-chain
remodeling’. The most associated genes were phospholipase A2 group
IVC (PLA2G4C), PLA2G2A, PLA2G3, phospholipase B domain containing 1
and PLA2G2F.
Pathway analysis
The KEGG database was applied to annotate the
screened DEGs. The pathway terms that were significant based on
Fisher's exact test (P<0.05) were screened.
A total of 362 genes were included in the pathway
category analysis, and they were significantly enriched in 14
signal pathways, which were distributed in three main processes,
namely, ‘organismal systems’, ‘metabolism’ and ‘human diseases’
(Fig. 4A). Next, a signal path
interaction diagram (pathway interaction) was constructed through
the ClueGO plug-in of Cytoscape (Fig.
4B). The entries with similar functions consisted of three
major channel networks. The most abundant network included the
pathways covering ether ‘lipid metabolism’, ‘linoleic acid
metabolism’, ‘alpha-linolenic acid metabolism’, ‘vascular smooth
muscle contraction’, ‘pancreatic secretion’ and ‘fat digestion and
absorption’, while the other two major outlined networks were those
containing the pathways of ‘GABAergic synapse’ and ‘morphine
addiction and nicotine addiction’, and those containing the
pathways of ‘cardiac muscle contraction’ and ‘hypertrophic
cardiomyopathy’. In addition, three pathways that are involved in
‘glutamatergic synapse’, ‘hematopoietic cell lineage’ and
‘long-term depression’ also partially intersected with the three
major networks.
Notably, PLA2G2A, PLA2G2F, PLA2G3, PLA2G4C and
phospholipase D1 (PLD1) were enriched in the cross points of
several pathways, including ‘ether lipid metabolism’, ‘linoleic
acid metabolism’, ‘alpha-linolenic acid metabolism’, ‘pancreatic
secretion’ and ‘fat digestion and absorption’. Notably, these
pathways are all closely associated with lipid metabolism, which
has been shown to serve an important role in the development of PCa
(17–19). The top five enrichment signal
pathways for all DEGs are listed in Table I. Notably, the most listed DEGs,
including PLA2G2A, PLA2G4C, PLA2G2F, γ-aminobutyric acid type A
receptor γ3 subunit, calcium voltage-gated channel subunit α1B
(CACNA1B) and G protein subunit γ5 (GNG5), are involved in multiple
pathways, suggesting their important role in cellular
processes.
 | Table I.Top five enrichment signal pathways
based on the Kyoto Encyclopedia of Genes and Genomes database for
all differentially expressed genes. |
Table I.
Top five enrichment signal pathways
based on the Kyoto Encyclopedia of Genes and Genomes database for
all differentially expressed genes.
| ID | Pathway | Count | P-value | Genes |
|---|
| hsa04727 | GABAergic
synapse | 6 |
1.00×10⁻³ | CACNA1A, CACNA1B,
GABRG3, GNG5, SLC38A5, SLC6A13 |
| hsa00565 | Ether lipid
metabolism | 5 |
1.40×10⁻³ | PLA2G2A, PLA2G2F,
PLA2G3, PLA2G4C, PLD1 |
| hsa04270 | Vascular smooth
muscle contraction | 7 |
1.70×10⁻³ | AVPR1B, GUCY1B3,
NPR2, PLA2G2A, PLA2G2F, PLA2G3, PLA2G4C |
| hsa05033 | Nicotine
addiction | 4 |
2.20×10⁻³ | CACNA1A, CACNA1B,
GABRG3, GRIN3A |
| hsa04724 | Glutamatergic
synapse | 6 |
3.20×10⁻³ | CACNA1A, GNG5,
GRIK2, GRIN3A, PLA2G4C, PLD1 |
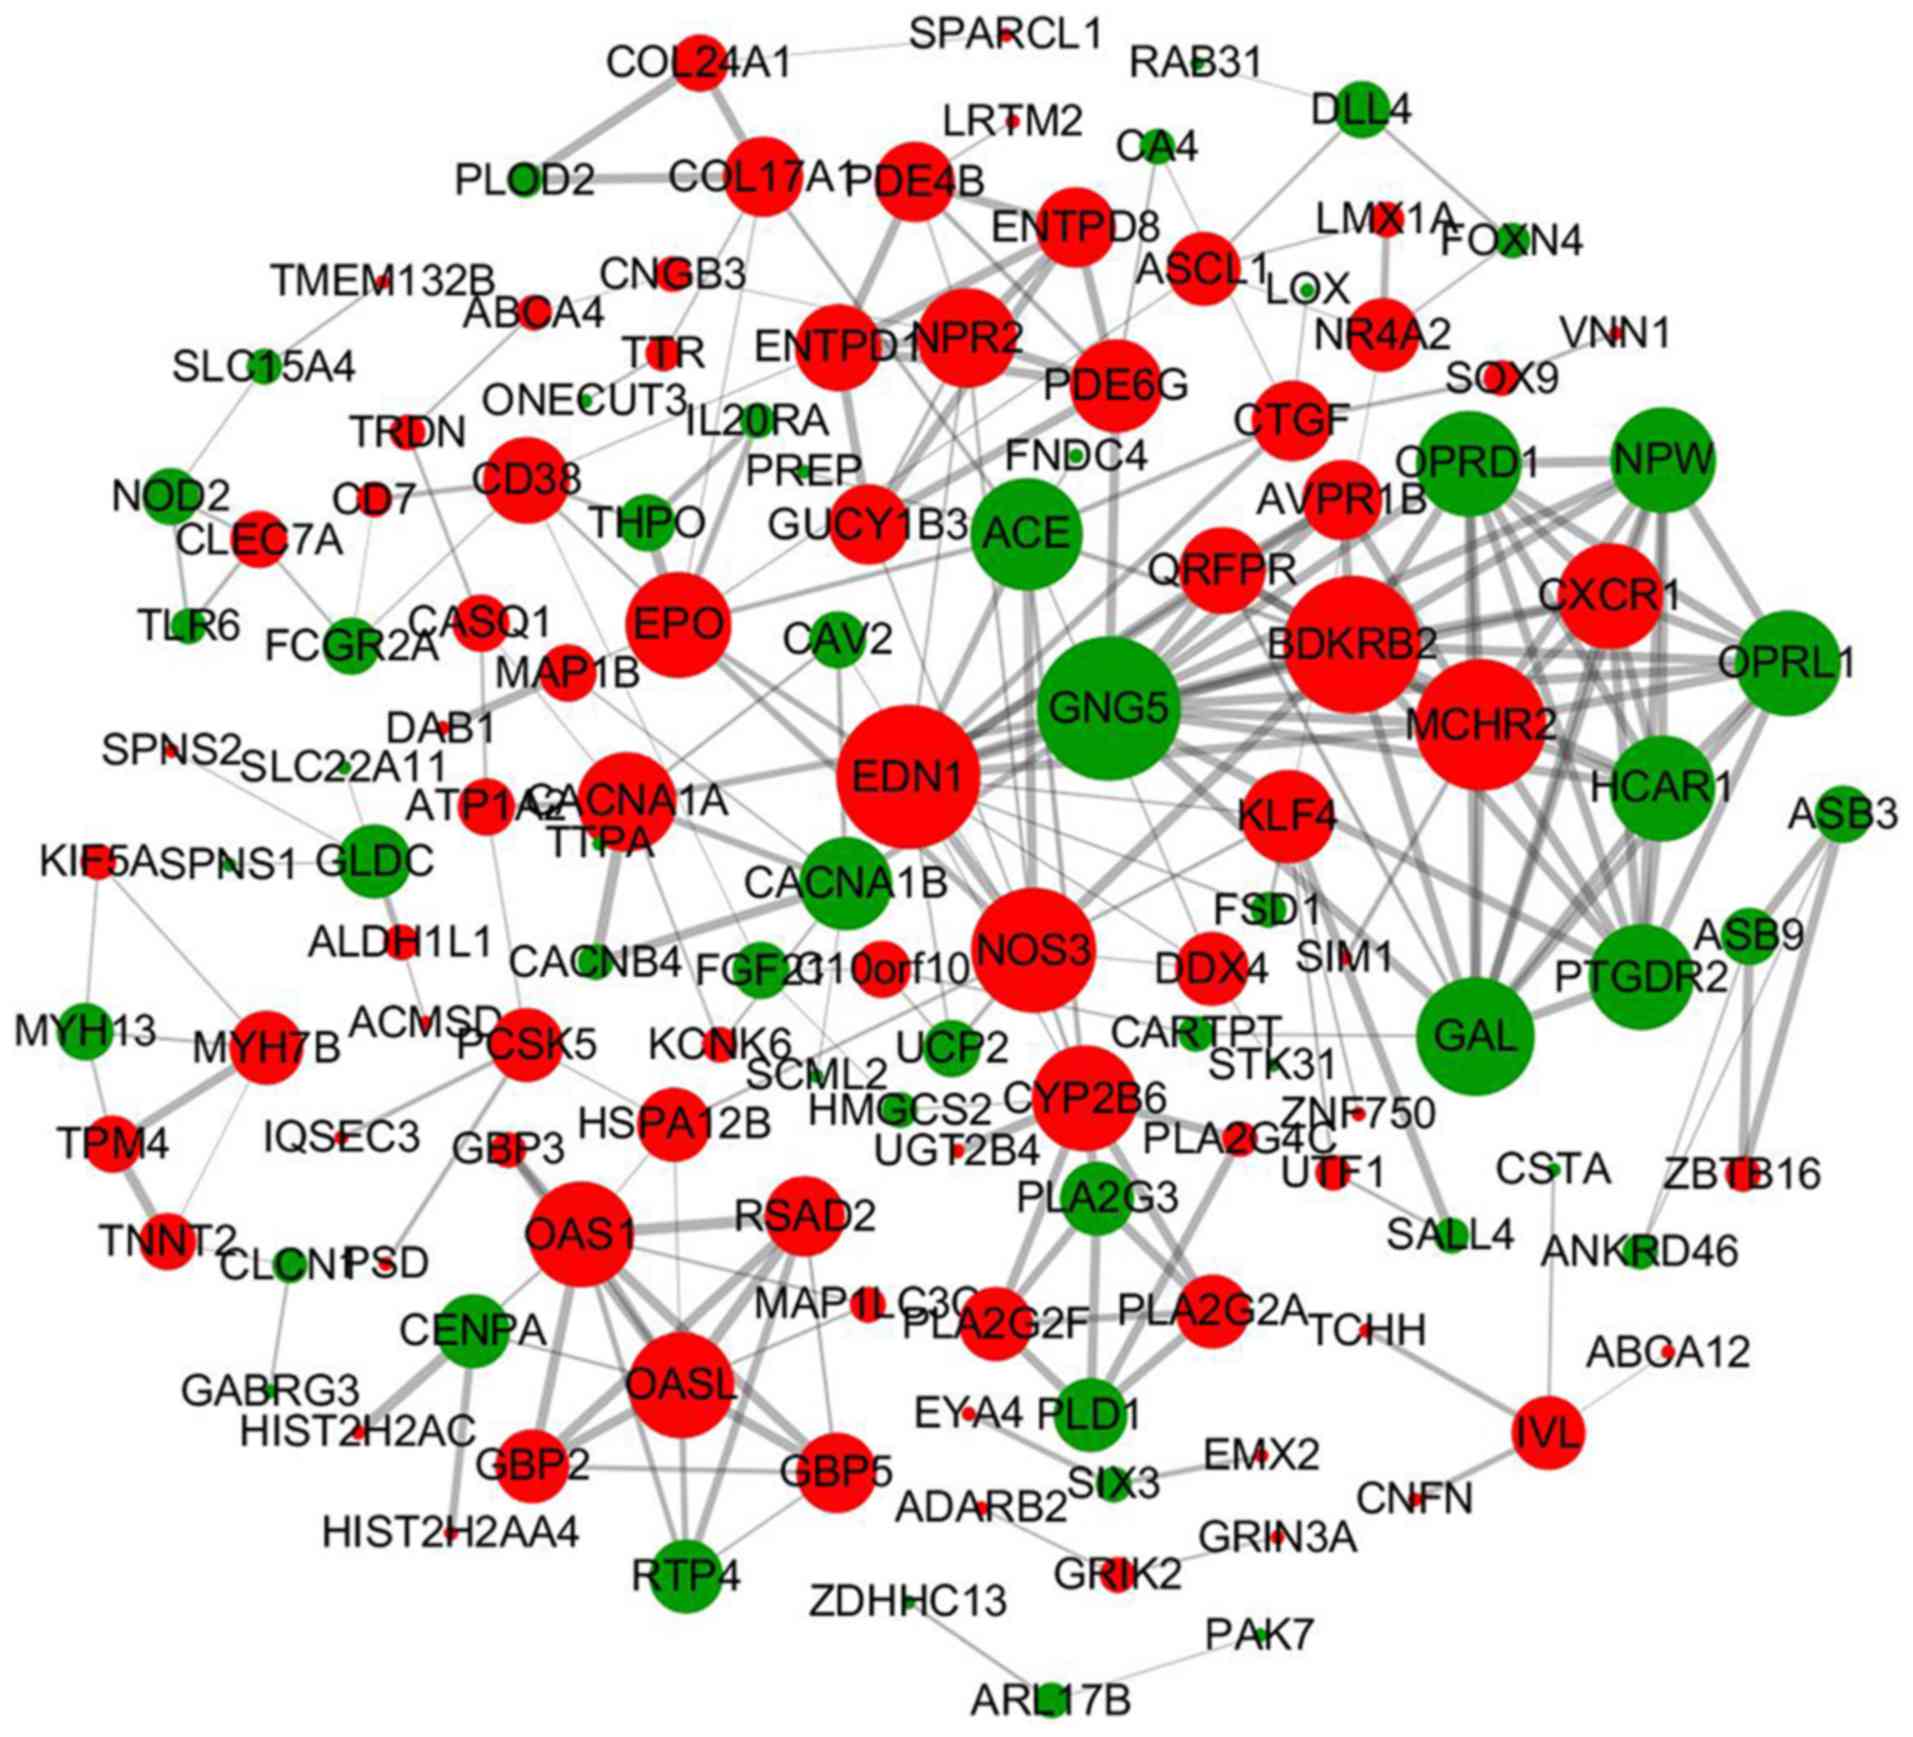
PPI network based on DEGs
To further investigate the potential regulation of
RBM3 on the transcriptome of PCa cells, a PPI network was
constructed based on DEGs through the STRING online database
(https://string-db.org/). Based on functional
relevance, the associations of different genes in the database are
described as ‘neighborhood’, ‘experiment’, ‘databases’,
‘co-occurrence’, ‘co-expression’, ‘gene-fusion’, ‘textmining’ and
‘homology’. Scores were calculated based on the characteristic of
each type of association. Thus, the weight of each association
between two genes could be evaluated by the final comprehensive
score. Only associated genes with scores of >0.4 were included
in the network.
Notably, the majority of the upregulated DEGs that
were identified in RNA-seq are closely associated with each other
in the PPI network. As shown in Fig.
5, endothelin 1 (EDN1) and GNG5 have the highest degree nodes
in the whole network, and they apparently locate centrally and have
the most extensive associations with other DEGs. It is worth
mentioning that PLA2G2A, PLA2G2F and PLA2G3, which were frequently
enriched in the pathway analysis or GO analysis, showed a close PPI
as well, highlighting the fact that RBM3-knockdown significantly
impacts the cellular network beyond isolated molecules. Similar
interactions were observed among other DEGs, for example,
natriuretic peptide receptor 2 (NPR2), ectonucleoside triphosphate
diphosphohydrolase 1 (ENTPD1), ENTPD8, phosphodiesterase 6G
(PDE6G), guanylate cyclase 1 soluble subunit β1 (GUCY1B3) and
PDE4B.
RT-qPCR validation of the DEGs
The changes in the DEGs that were found by RNA-Seq
were verified using RT-qPCR. The expression of 37 genes was
examined in cell lines either overexpressing RBM3 or with
RBM3-knockdown, as well as in control cells. Among the 37 genes, 21
were found to be associated with the expression levels of RBM3
exactly in the same pattern that had been shown in the RNA-seq,
namely, either upregulated or downregulated upon RBM3-knockdown.
The 18 genes that were upregulated by reducing RBM3 expression
according to qPCR and RNA-seq were as follows: PLA2G2A, EDN1,
nitric oxide synthase 3 (NOS3), CD38 molecule (CD38),
2′-5′-oligoadenylate synthetase-like (OASL), OAS1, guanylate
binding protein 2, erythropoietin, radical S-adenosyl methionine
domain containing 2, PLA2G2F, GUCY1B3, PDE6G,
calcium/calmodulin-dependent protein kinase II inhibitor 1,
glutamate ionotropic receptor kainate type subunit 2, troponin T2
cardiac type, Kruppel-like factor 4, PDE4B and connective tissue
growth factor. At the same time, three genes were found to be
downregulated in qPCR and RNA-seq. These genes were GNG5, galanin
and GMAP prepropeptide and angiotensin I converting enzyme
(Fig. 6). Moreover, there were
another 10 genes, including receptor transporter protein 4, PLD1,
hydroxycarboxylic acid receptor 1, cytochrome P450 family 2
subfamily B member 6, CACNA1A, CACNA1B, ENTPD1, ENTPD8, SRY-box 9
and tropomyosin 4, showing the same trends as the RNA-seq data in
cells expressing different levels of RBM3, but these differences
were not statistically significant (P>0.05) (data not shown).
Additionally, there were 6 genes that showed an inconsistent
association with the expression of RBM3 between the qPCR and the
RNA-seq experiments (data not shown). Taken together, using the
separate RT-qPCR experiments, the changes in the majority of DEGs
that were indicated in the RNA-seq could be confirmed; these genes
may be representive of typical transcriptional regulation by RBM3
in the present PC3 cells and warrant further studies.
Discussion
The involvement of RBM3 in tumor development and
progression has recently become a research focus. Accumulating data
have shown that RBM3 is upregulated in various human tumors, but is
associated with a good prognosis, although this finding remains
controversial (3,5–10).
However, the association between RBM3 and PCa remains unexplored.
This association prompted the use of high-throughput RNA sequencing
in the present study in an attempt to profile the impact of RBM3 on
the transcriptome of PCa cells.
It has been shown that the deregulation of important
signaling pathways serves a central role in the development of
cancer (20). In the present study,
it was found that subsequent to knocking down RBM3, the expression
of 698 genes involved in a number of important cancer-related
signaling pathways was significantly altered. GO analysis showed
that the DEGs were mainly enriched in tumor-related or nerve
conduction-related signaling pathways, including ‘membrane
depolarization’, ‘phosphatidylethanolamine acyl-chain remodeling’,
‘synaptic transmission’ and ‘G-protein coupled receptor signaling
pathway’. To further analyze the functional enrichment, all DEGs
were input into each of the three categories, namely, BP, MF and
CC. It was found that the pathways, including ‘synaptic
transmission’, ‘G-protein coupled receptor signaling pathway’,
‘elevation of cytosolic calcium ion concentration’, ‘signal
transduction’ and ‘response to drugs’ remained among the top
pathways on the list. Consistent with other studies, RBM3
apparently participates in a variety of biological processes,
including ‘signal transduction’, ‘synaptic transmission’ and ‘drug
reactions’.
To examine how RBM3 regulates pathways from another
perspective, pathway analyses and the pathway interaction network
were used. The significantly enriched signal pathway contained 14
items and 3 major networks. Notably, it was found that the pathways
in the center of the major regulation network were all associated
with metabolism. This finding is consistent with the results of
GO_BP analysis, in which the ‘lipid catabolic process’ and the
‘phospholipid metabolic process’ were tightly associated with
RBM3-regulation. This outcome suggests RBM3, as a cold-shock
protein that mediates the stress response, may function through
regulating a group of metabolic pathways.
The genes that were most frequently enriched in
these networks include PLA2G2A, PLA2G2F, PLA2G3, PLA2G4C, PLD1,
arginine vasopressin receptor 1B, GUCY1B3, NPR2, ATPase
Na+/K+ transporting subunit α2 and CD38. In
particular, PLA2G2A, PLA2G2F, PLA2G3 and PLA2G4C are enriched
repeatedly by multiple pathways. All these genes belong to the PLA2
family, in which the secretory PLA2G2A is the key enzyme of
arachidonic acid metabolism and is involved in numerous
pathophysiology processes (21),
including inflammation, lipid metabolism, and phospholipid
metabolism, as well as the regulation of insulin (22,23).
It has been shown that PLA2G2A is upregulated in LNCaP cells
compared with certain other androgen-independent PCa cell lines.
PLA2G2A protein was also found to be increased in the serum of PCa
patients and is associated with high tumor stages and grades
(24). Given that a low expression
level of RBM3 was largely reported to be associated with a poor
prognosis or aggressive progression in a number of cancer types,
including PCa, the increased PLA2G2A following RBM3-knockdown shown
in the present study may favor tumor progression to a certain
extent, and PLA2G2A may therefore be among the downstream effectors
of RBM3-mediated regulation in cancer.
On the other hand, Su et al (25) found that PLA2G2A was involved in the
astrocyte-mediated inflammatory response through a transcriptome
study, indicating that PLA2G2A may be functionally associated with
central nervous system homeostasis. Notably, it has been well
documented that RBM3 serves a critical role in the neuroprotective
effect of synaptic loss (4). In
support of this claim, in the present study, pathways closely
associated with synaptic transmission, including ‘Glutamatergic
synapse’ and ‘GABAergic synapse’, were found to be associated with
RBM3 regulation in pathway analysis and pathway interaction
networks. Thus, in the present study, PLA2G2A and its family show
their importance in mediating RBM3 regulation not only in cancer
development, but also in neuroprotection. Further study of the
regulation of RBM3 in a series of metabolic pathways, particularly
those involving the PLA2 family, is clearly required.
In addition to metabolism and the PLA2 family,
several other signaling pathways and gene families were found to be
closely associated with RBM3 regulation in the present study; for
example, GNG5 and the G protein pathway (26), EDN1 and the angiogenesis pathway
(27), NOS3 and the NO synthesis
pathway (28), CD38 and the signal
transduction pathway (29), and
CYP2B6 and the response to drug pathway (30). These pathways have all been reported
to be important for cancer development. Thus, these particular gene
families and signaling pathways may represent the potential
regulatory network of RBM3 on cancer development and therefore
warrant further study.
Acknowledgements
Not applicable.
Funding
This study was partially supported by the National
Natural Science Foundation of China (grant nos. 81372766 and
81572532), and the Liaoning ‘Climbing’ scholarship.
Availability of data and materials
The datasets used and/or analyzed during the current
study are available from the corresponding author on reasonable
request.
Authors' contributions
Conception and design: YZ and CF. Development of
methodology: QD, CL and ZY. Analysis and interpretation of data
(e.g., statistical analysis, biostatistics and computational
analysis): QD, CL, ZY and GZ. Writing, review and/or critical
revision of the manuscript: QD, CK and YZ. Administrative,
technical or material support (i.e., reporting or organizing data,
and constructing databases): QD, CK and CL. Study supervision: YZ
and QD. All authors read and approved the final manuscript.
Ethics approval and consent to
participate
Not applicable.
Patient consent for publication
Not applicable.
Competing interests
The authors declare that they have no competing
interests.
References
|
1
|
Chen W, Zheng R, Baade PD, Zhang S, Zeng
H, Bray F, Jemal A, Yu XQ and He J: Cancer statistics in China,
2015. CA Cancer J Clin. 66:115–132. 2016. View Article : Google Scholar : PubMed/NCBI
|
|
2
|
Danno S, Nishiyama H, Higashitsuji H,
Yokoi H, Xue JH, Itoh K, Matsuda T and Fujita J: Increased
transcript level of RBM3, a member of the glycine-rich RNA-binding
protein family, in human cells in response to cold stress. Biochem
Biophys Res Commun. 236:804–807. 1997. View Article : Google Scholar : PubMed/NCBI
|
|
3
|
Wellmann S, Truss M, Bruder E, Tornillo L,
Zelmer A, Seeger K and Bührer C: The RNA-binding protein RBM3 is
required for cell proliferation and protects against serum
deprivation-induced cell death. Pediatr Res. 67:35–41. 2010.
View Article : Google Scholar : PubMed/NCBI
|
|
4
|
Peretti D, Bastide A, Radford H, Verity N,
Molloy C, Martin MG, Moreno JA, Steinert JR, Smith T, Dinsdale D,
et al: RBM3 mediates structural plasticity and protective effects
of cooling in neurodegeneration. Nature. 518:236–239. 2015.
View Article : Google Scholar : PubMed/NCBI
|
|
5
|
Ehlén Å, Nodin B, Rexhepaj E, Brändstedt
J, Uhlén M, Alvarado-Kristensson M, Pontén F, Brennan DJ and
Jirström K: RBM3-regulated genes promote DNA integrity and affect
clinical outcome in epithelial ovarian cancer. Transl Oncol.
4:212–221. 2011. View Article : Google Scholar : PubMed/NCBI
|
|
6
|
Jögi A, Brennan DJ, Rydén L, Magnusson K,
Fernö M, Stål O, Borgquist S, Uhlen M, Landberg G, Påhlman S, et
al: Nuclear expression of the RNA-binding protein RBM3 is
associated with an improved clinical outcome in breast cancer. Mod
Pathol. 22:1564–1574. 2009. View Article : Google Scholar : PubMed/NCBI
|
|
7
|
Nodin B, Fridberg M, Jonsson L, Bergman J,
Uhlén M and Jirström K: High MCM3 expression is an independent
biomarker of poor prognosis and correlates with reduced RBM3
expression in a prospective cohort of malignant melanoma. Diagn
Pathol. 7:822012. View Article : Google Scholar : PubMed/NCBI
|
|
8
|
Florianova L, Xu B, Traboulsi S, Elmansi
H, Tanguay S, Aprikian A, Kassouf W and Brimo F: Evaluation of
RNA-binding motif protein 3 expression in urothelial carcinoma of
the bladder: An immunohistochemical study. World J Surg Oncol.
13:3172015. View Article : Google Scholar : PubMed/NCBI
|
|
9
|
Melling N, Simon R, Mirlacher M, Izbicki
JR, Stahl P, Terracciano LM, Bokemeyer C, Sauter G and Marx AH:
Loss of RNA-binding motif protein 3 expression is associated with
right-sided localization and poor prognosis in colorectal cancer.
Histopathology. 68:191–198. 2016. View Article : Google Scholar : PubMed/NCBI
|
|
10
|
Jonsson L, Gaber A, Ulmert D, Uhlén M,
Bjartell A and Jirström K: High RBM3 expression in prostate cancer
independently predicts a reduced risk of biochemical recurrence and
disease progression. Diagn Pathol. 6:912011. View Article : Google Scholar : PubMed/NCBI
|
|
11
|
Grupp K, Wilking J, Prien K, Hube-Magg C,
Sirma H, Simon R, Steurer S, Budäus L, Haese A, Izbicki J, et al:
High RNA-binding motif protein 3 expression is an independent
prognostic marker in operated prostate cancer and tightly linked to
ERG activation and PTEN deletions. Eur J Cancer. 50:852–861. 2014.
View Article : Google Scholar : PubMed/NCBI
|
|
12
|
Zeng Y, Wodzenski D, Gao D, Shiraishi T,
Terada N, Li Y, Vander GDJ, Luo J, Kong C, Getzenberg RH, et al:
Stress-response protein RBM3 attenuates the stem-like properties of
prostate cancer cells by interfering with CD44 variant splicing.
Cancer Res. 73:4123–4133. 2013. View Article : Google Scholar : PubMed/NCBI
|
|
13
|
Livak KJ and Schmittgen TD: Analysis of
relative gene expression data using real-time quantitative PCR and
the 2−ΔΔCT method. Methods. 25:402–408. 2001.
View Article : Google Scholar : PubMed/NCBI
|
|
14
|
Kanehisa M and Goto S: KEGG: Kyoto
encyclopedia of genes and genomes. Nucleic Acids Res. 28:27–30.
2000. View Article : Google Scholar : PubMed/NCBI
|
|
15
|
Bindea G, Mlecnik B, Hackl H, Charoentong
P, Tosolini M, Kirilovsky A, Fridman WH, Pagès F, Trajanoski Z and
Galon J: ClueGO: A Cytoscape plug-in to decipher functionally
grouped gene ontology and pathway annotation networks.
Bioinformatics. 25:1091–1093. 2009. View Article : Google Scholar : PubMed/NCBI
|
|
16
|
Shannon P, Markiel A, Ozier O, Baliga NS,
Wang JT, Ramage D, Amin N, Schwikowski B and Ideker T: Cytoscape: A
software environment for integrated models of biomolecular
interaction networks. Genome Res. 13:2498–2504. 2003. View Article : Google Scholar : PubMed/NCBI
|
|
17
|
Ferro M, Terracciano D, Buonerba C,
Lucarelli G, Bottero D, Perdonà S, Autorino R, Serino A, Cantiello
F, Damiano R, et al: The emerging role of obesity, diet and lipid
metabolism in prostate cancer. Future Oncol. 13:285–293. 2017.
View Article : Google Scholar : PubMed/NCBI
|
|
18
|
Butler LM, Centenera MM and Swinnen JV:
Androgen control of lipid metabolism in prostate cancer: Novel
insights and future applications. Endocr Relat Cancer.
23:R219–R227. 2016. View Article : Google Scholar : PubMed/NCBI
|
|
19
|
Al KO, Traka MH, Melchini A, Troncoso-Rey
P, Jurkowski W, Defernez M, Pachori P, Mills RD, Ball RY and Mithen
RF: Increased transcriptional and metabolic capacity for lipid
metabolism in the peripheral zone of the prostate may underpin its
increased susceptibility to cancer. Oncotarget. 8:84902–84916.
2017.PubMed/NCBI
|
|
20
|
Yamamoto S, Tomita Y, Hoshida Y, Takiguchi
S, Fujiwara Y, Yasuda T, Doki Y, Yoshida K, Aozasa K, Nakamura H,
et al: Expression of hepatoma-derived growth factor is correlated
with lymph node metastasis and prognosis of gastric carcinoma. Clin
Cancer Res. 12:117–122. 2006. View Article : Google Scholar : PubMed/NCBI
|
|
21
|
Fijneman RJ and Cormier RT: The roles of
sPLA2-IIA (Pla2g2a) in cancer of the small and large intestine.
Front Biosci. 13:4144–4174. 2008. View
Article : Google Scholar : PubMed/NCBI
|
|
22
|
Kuefner MS, Pham K, Redd JR, Stephenson
EJ, Harvey I, Deng X, Bridges D, Boilard E, Elam MB and Park EA:
Secretory phospholipase A2 group IIA modulates insulin sensitivity
and metabolism. J Lipid Res. 58:1822–1833. 2017. View Article : Google Scholar : PubMed/NCBI
|
|
23
|
Six DA and Dennis EA: The expanding
superfamily of phospholipase A2 enzymes: Classification
and characterization. Biochim Biophys Acta. 1488:1–19. 2000.
View Article : Google Scholar : PubMed/NCBI
|
|
24
|
Lu S and Dong Z: Overexpression of
secretory phospholipase A2-IIa supports cancer stem cell phenotype
via HER/ERBB-elicited signaling in lung and prostate cancer cells.
Int J Oncol. 50:2113–2122. 2017. View Article : Google Scholar : PubMed/NCBI
|
|
25
|
Su Y and Wang Y, Zhou Y, Zhu Z, Zhang Q,
Zhang X, Wang W, Gu X, Guo A and Wang Y: Macrophage migration
inhibitory factor activates inflammatory responses of astrocytes
through interaction with CD74 receptor. Oncotarget. 8:2719–2730.
2017.PubMed/NCBI
|
|
26
|
Asano T, Shinohara H, Morishita R, Ueda H,
Kawamura N, Katoh-Semba R, Kishikawa M and Kato K: Selective
localization of G protein gamma5 subunit in the subventricular zone
of the lateral ventricle and rostral migratory stream of the adult
rat brain. J Neurochem. 79:1129–1135. 2001. View Article : Google Scholar : PubMed/NCBI
|
|
27
|
Rosanò L, Spinella F and Bagnato A:
Endothelin 1 in cancer: Biological implications and therapeutic
opportunities. Nat Rev Cancer. 13:637–651. 2013. View Article : Google Scholar : PubMed/NCBI
|
|
28
|
Nikolić ZZ, Pavićević DLj, Romac SP and
Brajušković GN: Genetic variants within endothelial nitric oxide
synthase gene and prostate cancer: A meta-analysis. Clin Transl
Sci. 8:23–31. 2015. View Article : Google Scholar : PubMed/NCBI
|
|
29
|
Benkisser-Petersen M, Buchner M, Dörffel
A, Dühren-von-Minden M, Claus R, Kläsener K, Leberecht K, Burger M,
Dierks C, Jumaa H, et al: Spleen tyrosine kinase is involved in the
CD38 signal transduction pathway in chronic lymphocytic leukemia.
PLoS One. 11:e01691592016. View Article : Google Scholar : PubMed/NCBI
|
|
30
|
Karakurt S and Adali O: Tannic acid
inhibits proliferation, migration, invasion of prostate cancer and
modulates drug metabolizing and antioxidant enzymes. anticancer
agents Med Chem. 16:781–789. 2016. View Article : Google Scholar : PubMed/NCBI
|