Introduction
Ovarian cancer (OC) remains a significant health
problem in women and is the second most common gynecological
malignancy in the female reproductive system. OC is the ranked
first in terms of causing mortality among all the gynecological
tumors and poses a serious threat to human life, although the
incidence of OC is only third after cervical and endometrial cancer
(1,2). Globally, in 2012, >238,700 women
were diagnosed with OC and an estimated 151,900 patients succumbed
to the disease (2). Histologically,
epithelial ovarian carcinoma (EOC) contributes to ~90% of all OC
cases and is diagnosed at advanced stages (3). Despite advancements in treatment
options and molecular studies, the 5-year survival rate for
advanced EOC patients has not been improved and has never exceeded
30% over the past several decades, leading to a poor EOC prognosis
(4). An early diagnosis is the key
to reducing overall mortality and increasing survival. However, the
molecular mechanisms of action behind the aggressive clinical
behaviors of OC are not fully understood, and OC pathogenesis is a
complex biological process that involves gene transcriptional
regulation and epigenetic regulation (5,6). Thus,
a better understanding of the molecular alterations and gene
regulations involved will lead to improvements in OC prevention,
early diagnosis and treatment options.
Human genome sequences show that only ~2% of the
human genome codes for proteins and that the majority of the genome
codes for non-coding RNAs (ncRNAs) (7); however, the functions of these ncRNAs
remain to be determined. Accumulating evidence has shown that these
ncRNAs could regulate gene expression at the transcriptional and
post-transcriptional levels and that they thus serve a critical
role in the majority of biological processes (8). ncRNAs can be further divided into
microRNAs (miRNAs/miRs) and long ncRNAs (lncRNAs) according to
their sequence length (9,10). To date, miRNAs have been well
studied and have demonstrated multiple functions and aberrant
expression in a number of human cancer types, including OC; for
example, the expression of miR-34b, miR-200c and miR-141 was found
to be altered and associated with OC development in previous
studies (11,12).
Molecules of lncRNAs are >200 nucleotides in
length and are typically divided into exonic, intronic, overlapping
and intergenic according to their genomic localization and in
relation to the nearby protein-coding transcripts (13). Initially, due to their poor
evolutionary conservation relative to the protein coding regions of
the genome, they were considered as transcriptional noise; however,
they are currently recognized as novel regulators of gene
expression, as well as the altered expression and function involved
in human diseases such as cancer (14). A number of high-throughput profiling
and RNA sequencing studies have identified a variety of
differentially expressed lncRNAs in different cancer types, which
is a hallmark feature in human cancer (15,16).
Dysregulated expression of lncRNAs was shown to contribute to
cancer development, as the lncRNAs can regulate various cell
processes through epigenetic regulation (5), microRNA silencing (6), DNA damage and cell cycle control
(8,9). Moreover, lncRNAs may also be a
potential strategy as therapeutic targets for human diseases, such
as cancer, or as biomarkers for the early diagnosis and prediction
of prognosis for human cancer (15). Notably, recent studies showed
aberrant expression of lncRNAs in breast (17), hepatocellular (18), ovarian (19), and colorectal (20) cancer.
In the present study, dysregulated lncRNA expression
in OC versus normal ovarian tissues (NT) was profiled using
microarray analysis. Bioinformatic analyses [such as Gene Ontology,
Kyoto Encyclopedia of Genes and Genomes (KEGG) pathway and network
analyses] were then performed to investigate the potential
functions of these target genes of the dysregulated lncRNAs.
Microarray data was also validated using reverse
transcription-quantitative polymerase chain reaction (RT-qPCR) in
another set of tissue samples.
Materials and methods
Study population
This study collected tissue specimens from 30 OC
patients and 20 non-tumor patients from Shengjing Hospital, China
Medical University (Shenyang, Liaoning, China) between January 2013
and December 2015. All OC patients were histologically diagnosed
and classified according to the World Health Organization criteria
(21,22) and had not received any preoperative
chemoradiation. OC samples were collected from women who underwent
cancer resection. NT samples were collected from women of the same
age group who underwent hysterectomy for non-malignant conditions.
This study was approved by the Ethics Committee of Shengjing
Hospital, China Medical University, and each patient provided
written informed consent for the collection of tissue samples that
were obtained during surgery. In the study, 5 OC and 5 NT samples
were randomly selected and used for microarray analysis, and the
remaining 25 OC and 15 NT samples were used for validation
purposes. The clinicopathological data for these patients are shown
in Table I.
 | Table I.Clinicopathological parameters from
patients in the screening and validation cohorts. |
Table I.
Clinicopathological parameters from
patients in the screening and validation cohorts.
|
|
| Validation
cohort |
|---|
|
|
|
|
|---|
| Parameter | Screening cohort
(n=5) | OC (n=25) | NT (n=15) |
|---|
| Age, years |
|
Mean | 52.8 | 55.5 | 56.6 |
|
Min-max | 46-60 | 38-70 | 43-75 |
| Histological type,
n (%) |
| Serous
carcinoma | 2 (40) | 12 (48) | n.a |
|
Mucinous carcinoma | 2 (40) | 8
(32) | n.a |
|
Clear-cell carcinoma | 1 (20) | 3
(12) | n.a |
|
Endometrioid carcinoma | 0 | 2 (8) | n.a |
| Clinical stage, n
(%) |
|
| n.a |
|
I/II | 2 (40) | 7
(28) | n.a |
|
III/IV | 3 (60) | 18 (72) | n.a |
| Grade, n (%) |
|
| n.a |
|
High | 1 (20) | 4
(16) | n.a |
|
Mid-low | 4 (80) | 21 (84) | n.a |
| Lymph node
metastasis, n (%) |
|
| n.a |
| No | 4 (80) | 20 (80) | n.a |
|
Yes | 1 (20) | 5
(20) | n.a |
RNA isolation
Tissue samples were collected, and were snap-frozen
in liquid nitrogen immediately after resection. Hematoxylin and
eosin staining was first performed on the tissue samples to confirm
their histology, and then total RNA was isolated using TRIzol
reagent (Invitrogen; Thermo Fisher Scientific, Inc., Waltham, MA,
USA) according to the manufacturer's protocols. The RNA
concentration and quality were then assessed using NanoDrop
technology (Thermo Fisher Scientific, Inc.) and 1% agarose gel
electrophoresis, respectively. Optical density 260/280 absorbance
ratios were between 1.8 and 2.0 for all the samples.
Microarray analysis
Human lncRNA microarray v2.0 was obtained from
Arraystar Co. (Rockville, MD, USA) for global profiling of human
lncRNAs and protein-coding transcripts. This microarray contains
33,045 lncRNAs and 30,215 mRNA transcripts. For microarray
analysis, the Agilent Array platform (Agilent Technologies, Inc.,
Santa Clara, CA, USA) was utilized to prepare the samples and
microarray hybridization was performed following the manufacturer's
protocols with minor modifications, which was all conducted by
KangChen Biotech Company (Shanghai, China). Briefly, mRNA was
purified from the total RNA samples using the mRNA-ONLY™ Eukaryotic
mRNA Isolation kit (Epicentre; Illumina, Inc., San Diego, CA, USA).
Next, these mRNA samples were amplified and transcribed into
fluorescent cRNA probes without 3′-bias utilization of a randomly
priming method. Furthermore, these labeled cRNA probes were then
purified with the RNeasy Mini kit (Qiagen, Inc., Valencia, CA,
USA). The concentration and activity of the cRNA probes, expressed
as pM Cy3/µg cRNA, were estimated with the NanoDrop ND-1000 (Thermo
Fisher Scientific, Inc.). Next, 1 µg of the labeled cRNA probe was
fragmented and then diluted with 25 µl 2X GE hybridization buffer
(from the Agilent Array platform). For array hybridization,
hybridization solution (50 µl each) was added into the gasket
slides; they were then incubated at 65°C for 17 h. The next day,
the arrays were washed with different buffer (from the Agilent
Array platform) and scanned with the Agilent DNA microarray scanner
(model no. G2505C; Agilent Technologies, Inc.).
Data analysis
The Agilent Feature Extraction software (version
11.0.1.1; Agilent Technologies, Inc.) and GeneSpring GX v12.0
software package (Agilent Technologies, Inc.) were utilized to
analyze the array data for quantile normalization and subsequent
data processing. Next, the expression of lncRNAs and mRNAs with at
least 6 out of 10 samples flagged as a Present or Marginal ‘All
Targets Value’ were subjected to further data analyses. A
statistical difference in the expression of lncRNAs and mRNAs in
normal versus tumor samples was identified using volcano plot
filtering. Hierarchical clustering analysis was then conducted to
obtain the distinguishable expression pattern of lncRNAs and mRNAs
between these tissue samples.
Gene Ontology (GO) analysis
GO terms provide the attribution of gene and gene
product and interactions in a given organism (http://www.geneontology.org). Once GO terms were
obtained, Fisher's exact test was then performed to assess any
overlap between the differentially expressed lncRNA and the GO
annotation list, and P≤0.05 was used to show the significance of
the GO term enrichment.
Kyoto Encyclopedia of Genes and
Genomes (KEGG) gene pathway analysis
Gene pathway enrichment is a functional analysis of
the mapped genes using the KEGG tool. This gene pathway analysis
was used to better understand the underlying biology of the
differentially expressed genes. P-values (Expression Analysis
Systematic Explorer-score, Fisher's P-value or hypergeometric
P-value) were used to show the significance of a pathway associated
with the biological conditions (P≤0.05).
Construction of the coding-non-coding
(CNC) gene co-expression network
The link and association between lncRNAs and their
coding genes was investigated by constructing the CNC co-expression
network for 4 upregulated and downregulated lncRNAs and their
coding genes, respectively. In a given network, the blue nodes
represent an mRNA, a red node represents an upregulated lncRNA and
a green node represents a downregulated lncRNA. The lines between
cycle nodes represent the interactions between an lncRNA and an
mRNA, with solid lines indicating a positive correlation and dashed
lines indicating a negative correlation. Pearson correlation
coefficients between the altered lncRNAs and mRNAs were calculated
with a cut-off P-value of <0.001 and an absolute value of the
correlation coefficient of ≥0.99. The degree values showed the
number of genes with which the gene could interact. Those
lncRNAs/mRNAs were then further selected to draw the network with
Cytoscape (3.1.1) according to a previous study (23).
RT-qPCR
Total RNA samples from tissue samples were reverse
transcribed into cDNA using the SuperScript™ III Reverse
Transcriptase kit (Invitrogen; Thermo Fisher Scientific, Inc.)
according to the manufacturer's protocol. qPCR was then amplified
in the ViiA 7 Real-Time PCR system with the Power SYBR Green PCR
Master mix (both Applied Biosystems; Thermo Fisher Scientific,
Inc.). Briefly, the qPCR mixture was incubated at 95°C for 10 min
and then 40 cycles of 95°C for 10 sec and 60°C for 60 sec. The
levels of mRNA were normalized to GAPDH and calculated with the ΔCq
method. The fold-changes in expression were calculated using the
2−∆∆Cq method (24). The
qPCR primer sequences are shown in Table II. All experiments were performed
in triplicate and repeated at least once.
| Table II.Reverse transcription-quantitative
polymerase chain reaction primer sequences. |
Table II.
Reverse transcription-quantitative
polymerase chain reaction primer sequences.
| Seq. name | Location | Forward primer | Reverse primer |
|---|
| BC041954 | chr3 |
TCTGTAGTTCGTTGTTGGTCGTG |
GCGGTCCTGATTCATTAGCG |
|
ENST00000453838 | chr1 |
GCCGGAGTCCTGTCTTCTTATT |
TCTGGATGCCTCCCATTTCT |
|
ENST00000505048 | chr5 |
ACCCAGGCAGAGGGACAGT |
GGCGGCGGTAGGTAGTGAT |
|
ENST00000502715 | chr4 |
GACAAGTGGTCTGCCCTGTATG |
TGCCTGTTCAACGAGCTATCA |
| AK123324 | chr8 |
GAGGTTGCGGTGAACTACGAT |
CCCATGCTGTGGGATGCT |
| AF087976 | chr3 |
TTCCAAGTTTCCATTTTCTCACC |
AGATTGTTTCTCAGATCCCCAAAT |
| AL832916 | chr2 |
CCCCAAACCACTCCAATAGC |
CAGCAAGGGCAGAAGGTAAGA |
| AF086261 | chr15 |
GCTTTTCTGCTCATGGCTTACA |
TGTTGACACCCACTTCCGACT |
| GAPDH |
|
GGGAAACTGTGGCGTGAT |
GAGTGGGTGTCGCTGTTGA |
Statistical analysis
Differential levels of lncRNA expression were
calculated using fold-change filtration and the independent sample
t-test between two groups, while Fisher's exact test was performed
for data on the GO and KEGG pathway analyses. P≤0.05 was considered
to indicate a statistically significant difference. All statistical
analyses were conducted using SPSS version 20.0 (IBM Corp., Armonk,
NY, USA).
Results
Profiling of differential expression
of lncRNAs in OC
First, differentially expressed lncRNAs in 5 OC and
5 NT samples were profiled using the Arraystar Human LncRNA
Microarray. These differentially expressed lncRNAs were calculated
using the log fold-change between tumor and NT samples, with a
cut-off point of 1:2.5. A positive value indicated the upregulated
genes in the tumor, whereas a negative value indicated
downregulated genes in tumor versus normal samples.
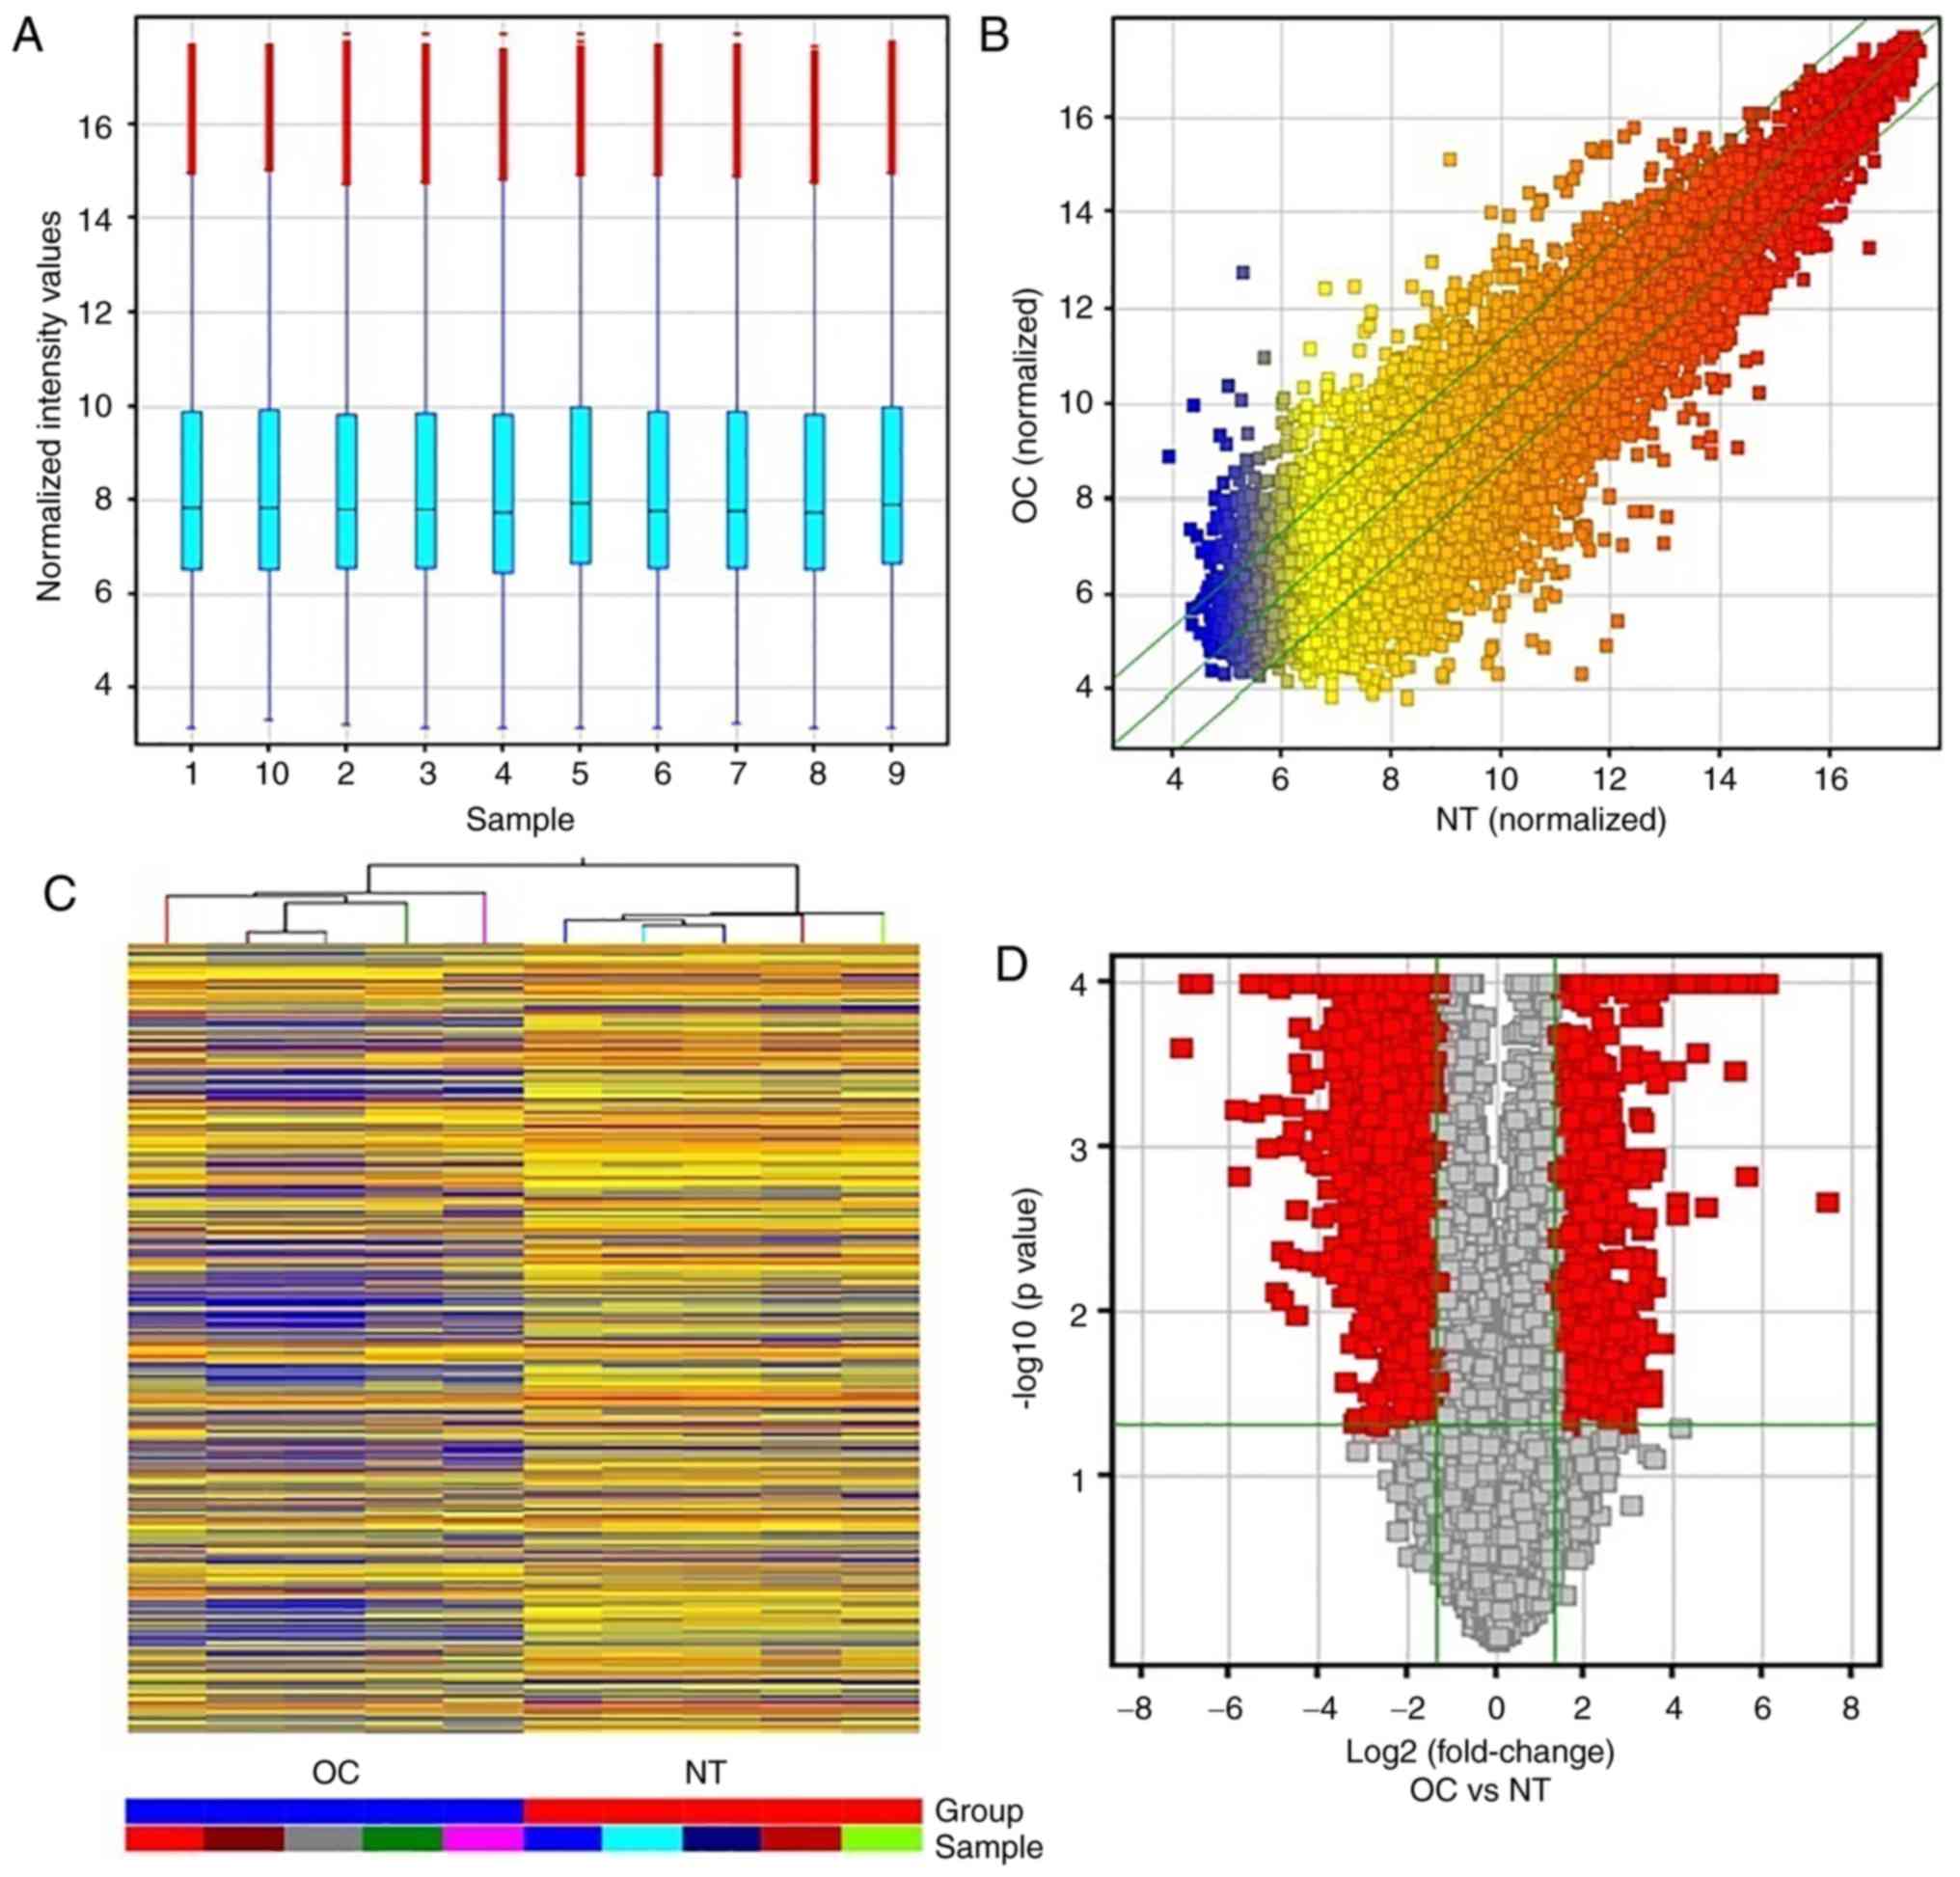
The expression of 25,256 lncRNAs was detected in the
5 paired OC and NT samples, and the box plot view was used to
compare their distributions in the OC and NT samples, as shown in
Fig. 1A, while differentially
expressed lncRNAs in OC samples relative to NT controls are shown
in Fig. 1B. The hierarchical
clustering analysis showed a distinguishable lncRNA expression
profile between the OC and NT samples (Fig. 1C).
Moreover, volcano plots were constructed using
fold-change data, which enabled the visualization of the
association between the fold-change and statistical significance. A
total of 2,870 differentially expressed lncRNAs were identified
between OC and NT (Fig. 1D). Of
these 2,870 dysregulated lncRNAs, 795 were upregulated and 2,075
were downregulated in OC. The top 10 most upregulated lncRNAs in OC
were BC041954, ENST00000423200, uc.428+, BC028018, ENST00000433201,
ENST00000458624, ENST00000453838, CR601061, ENST00000505048 and
ENST00000502715, whereas the top 10 most downregulated lncRNAs in
OC were AK123324, AF087976, NR_001284, ENST00000474313, AL832916,
AF086261, BC070168, uc001zfv.1, NR_023313 and uc002btm.2 (Table III). BC041954 (fold-change of
177.98) was the most significantly upregulated gene, and AK123324
(fold-change of 56.42) was the most significantly downregulated
lncRNA. Overall, upregulated lncRNAs were less common in OC than
downregulated lncRNAs in the microarray data. Next, 4 upregulated
and 4 downregulated lncRNAs were selected for validation (BC041954,
ENST00000453838, ENST00000505048, ENST00000502715, AK123324,
AF087976, AL832916, and AF086261).
| Table III.List of 10 differentially expressed
lncRNAs in ovarian cancer analyzed by the microarray. |
Table III.
List of 10 differentially expressed
lncRNAs in ovarian cancer analyzed by the microarray.
| A, Upregulated
lncRNAs |
|
| lncRNA seq
name | Fold-change | P-value |
|---|
| BC041954 | 177.97792 |
2.160×10⁻³ |
|
ENST00000423200 | 68.051605 |
4.842×10⁻⁶ |
| uc.428+ | 50.279484 |
1.748×10⁻⁵ |
| BC028018 | 34.942886 |
7.128×10⁻⁶ |
|
ENST00000433201 | 26.048214 |
2.346×10⁻³ |
|
ENST00000458624 | 20.718157 |
5.804×10⁻⁷ |
|
ENST00000453838 | 19.044817 |
8.763×10⁻⁶ |
| CR601061 | 18.448626 |
1.821×10⁻⁵ |
|
ENST00000505048 | 17.240042 |
3.885×10⁻⁵ |
|
ENST00000502715 | 17.071527 |
2.145×10⁻³ |
|
| B, Downregulated
lncRNAs |
|
| AK123324 | 56.423824 |
1.524×10⁻³ |
| AF087976 | 40.975834 |
1.436×10⁻⁵ |
| NR_001284 | 36.627293 |
1.017×10⁻³ |
|
ENST00000474313 | 35.2125 |
5.514×10⁻⁴ |
| AL832916 | 31.709267 |
7.592×10⁻³ |
| AF086261 | 29.65302 |
9.410×10⁻⁶ |
| BC070168 | 28.347292 |
8.506×10⁻³ |
| uc001zfv.1 | 25.797493 |
9.822×10⁻⁴ |
| NR_023313 | 24.778913 |
4.815×10⁻³ |
| uc002btm.2 | 24.472792 |
7.887×10⁻⁴ |
Profiling of differential expression
of mRNAs in OC
The array analysis identified 19,362 mRNAs of 30,215
coding transcripts probes (Fig. 2A and
B) between OC and NT, among which 2,658 mRNAs were aberrantly
expressed in OC (Fig. 2C). Of the
2,658 differentially expressed mRNAs in the OC samples, 1,014 mRNA
were found to be upregulated and 1,644 mRNA to be downregulated
compared with those of the NT (Table
IV). The hierarchical clustering analysis showed a significant
association of their expression patterns between the OC and NT
samples (Fig. 2D).
| Table IV.List of 10 differentially expressed
mRNAs in ovarian cancer analyzed by the microarray. |
Table IV.
List of 10 differentially expressed
mRNAs in ovarian cancer analyzed by the microarray.
| A, Upregulated
mRNAs |
|
| Gene symbol | Fold-change | P-value |
|---|
| CLDN3 | 142.23268 |
2.499×10⁻⁴ |
| FOLR1 | 112.25475 |
2.825×10⁻⁴ |
| OVOL2 | 104.51445 |
7.898×10⁻⁶ |
| PVRL4 | 97.82674 |
3.914×10⁻⁵ |
| SMPDL3B | 96.442276 |
6.986×10⁻⁶ |
| CLDN4 | 89.58858 |
8.086×10⁻⁶ |
| BMP7 | 81.024956 |
2.833×10⁻⁵ |
| AQP5 | 77.35999 |
5.248×10⁻⁴ |
| DOK7 | 76.89189 |
5.335×10⁻⁵ |
| SCGB2A1 | 73.11675 |
1.762×10⁻⁵ |
|
| B, Downregulated
mRNAs |
|
| STAR | 242.25418 |
3.644×10⁻⁵ |
| WFIKKN2 | 208.04768 |
1.603×10⁻⁵ |
| VWC2 | 188.6573 |
2.201×10⁻³ |
| PROK1 | 172.80093 |
1.872×10⁻⁶ |
| ASIP | 167.52657 |
5.426×10⁻⁸ |
| FOXL2 | 124.60296 |
3.792×10⁻⁴ |
| CCBE1 | 113.107506 |
1.352×10⁻⁵ |
| FAM150B | 104.271996 |
1.048×10⁻⁷ |
| PCDH11Y | 97.41786 |
1.174×10⁻⁵ |
| GATM | 90.50611 |
3.095×10⁻⁵ |
Identification of genes and gene
pathways using GO and KEGG pathway analyses
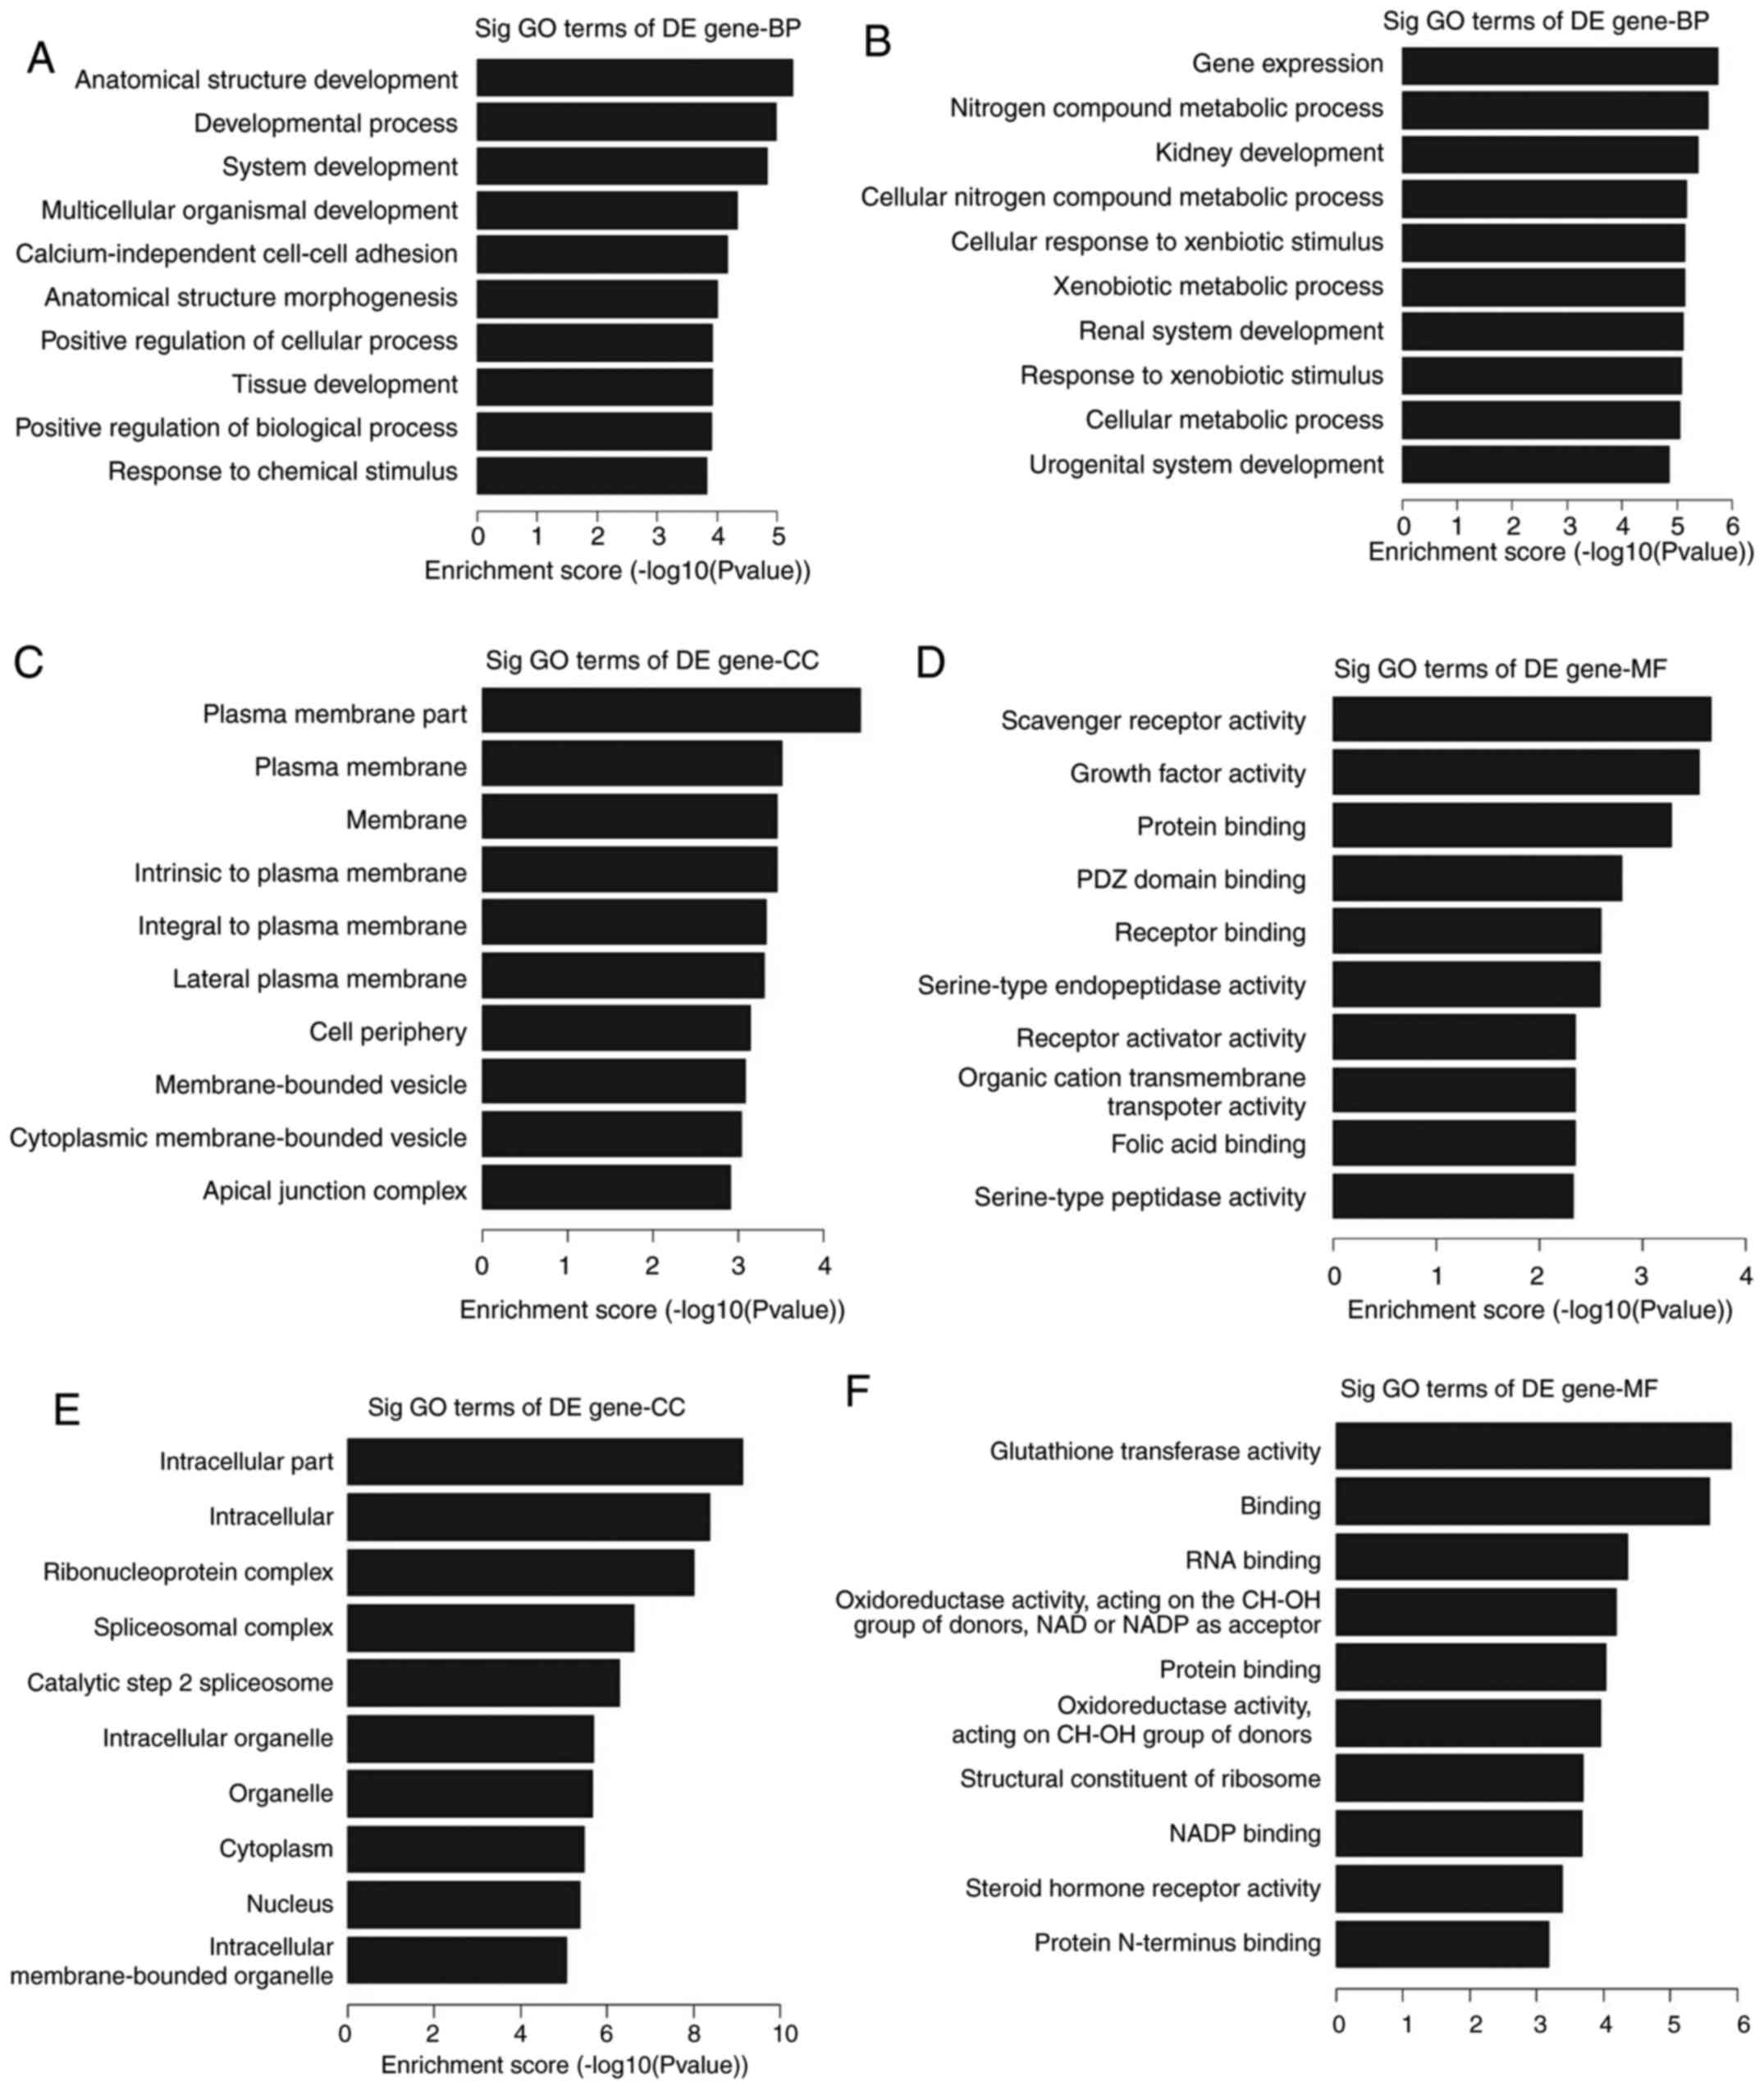
To systematically investigate the potential
functions of these target genes of differentially expressed lncRNAs
in OC, GO and KEGG pathway analyses were performed. The data showed
that these upregulated genes were involved in the development of
the ‘cell anatomical structure’ (GO:0048856;
P=5.46187×10⁻⁶), ‘developmental process’ (GO:0032502;
P=1.04997×10⁻⁵), ‘system development’ (GO:0048731;
P=1.47343×10⁻⁵) and ‘multicellular organismal
development’ (GO:0007275; P=4.63519×10⁻⁵) (Fig. 3A). By contrast, these downregulated
genes were involved in ‘gene expression’ (GO: 0010476;
P=1.8095×10⁻⁶), ‘nitrogen compound metabolic process’
(GO:0006807; P=2.80064×10⁻⁶), ‘kidney development’
(GO:0001822; P=4.23279×10⁻⁶) and ‘cellular nitrogen
compound metabolic processes’ (GO:0034641;
P=6.77475×10⁻⁶) (Fig.
3B). In addition, it was also found that the highest enriched
GO terms in the upregulated transcripts were the ‘plasma membrane
compartment’ (GO:0044459; P=3.68×10⁻⁵) for cellular
components (Fig. 3C) and ‘scavenger
receptor activity’ (GO:0005044; P=2.17×10⁻⁴) for
molecular functions (Fig. 3D). The
highest enriched GO terms in the downregulated transcripts were the
‘intracellular compartment’ (GO:0044424; P=7.26×10⁻¹⁰)
for cellular components (Fig. 3E)
and ‘glutathione transferase activity (GO:0004364;
P=1.22×10⁻⁶) for molecular functions (Fig. 3F).
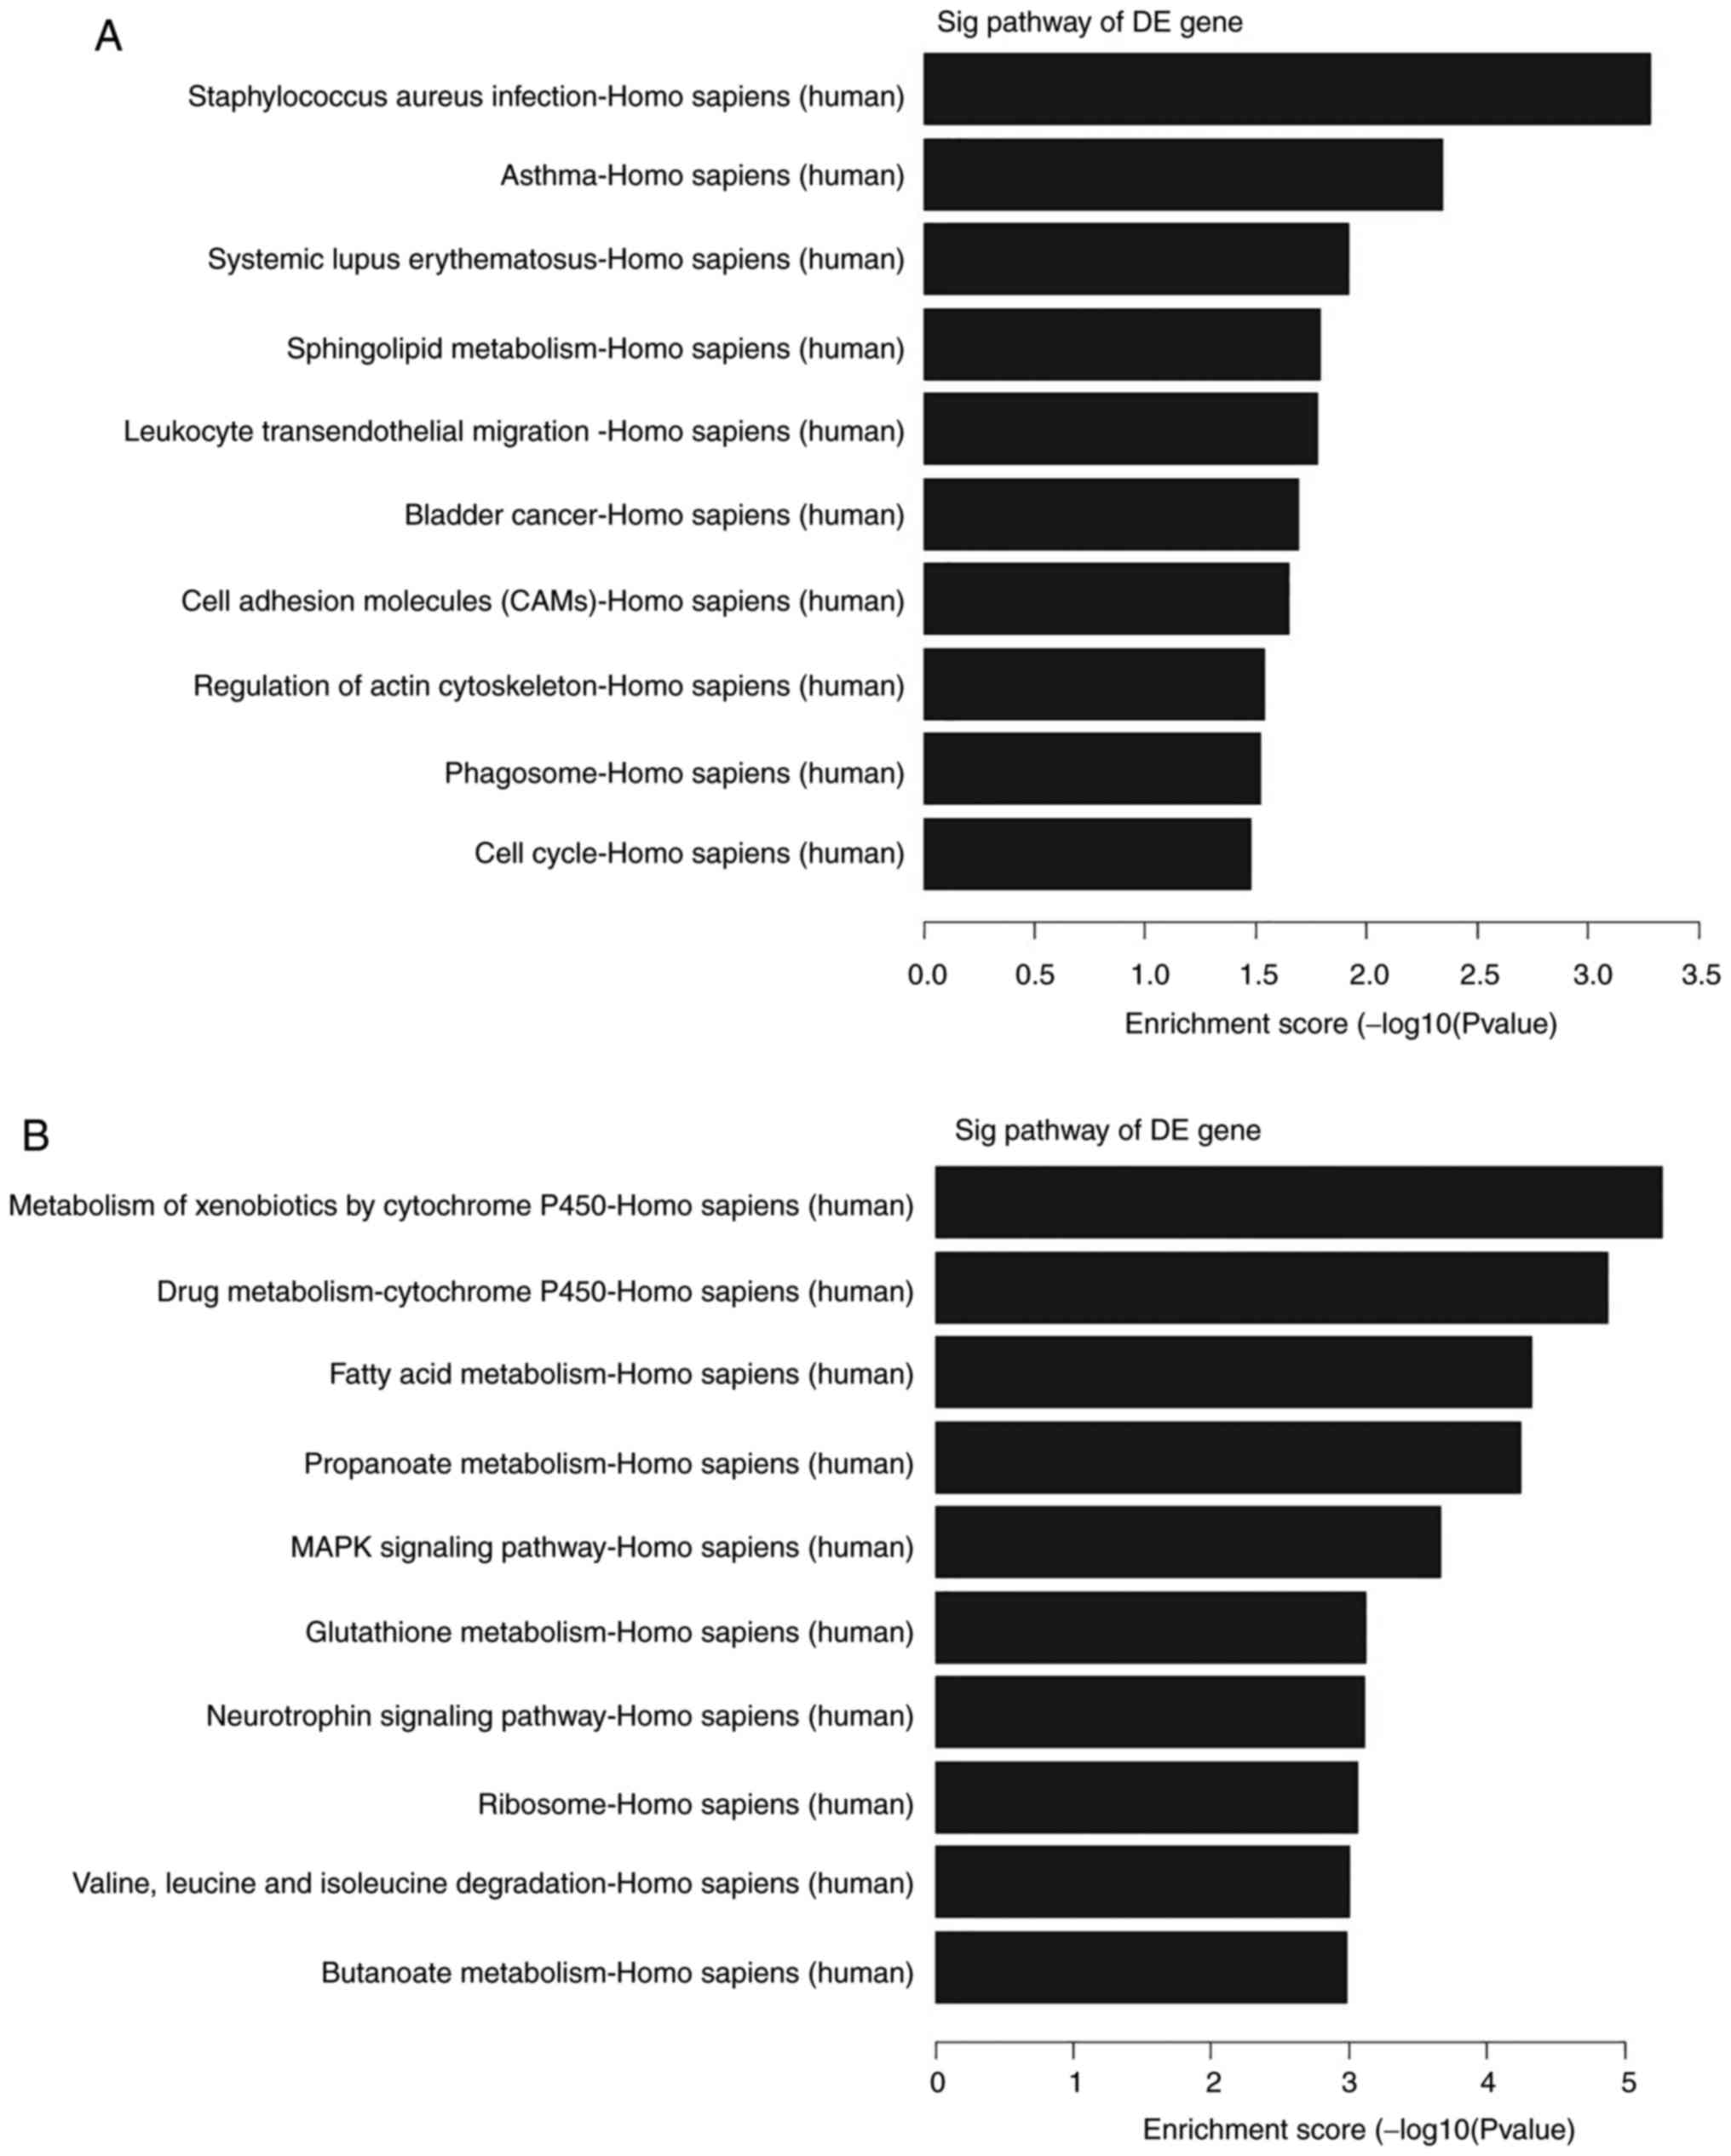
Furthermore, the KEGG gene pathway analysis revealed
that these targeting genes participated in several signaling
pathways; for example, these upregulated transcripts could form 12
gene pathways and were involved and enriched in ‘Staphylococcus
aureus infection’, ‘asthma’, ‘systemic lupus erythematosus’ and
‘sphingolipid metabolism’ (Fig.
4A). By contrast, the downregulated transcripts could form 33
pathways that corresponded to and were primarily enriched in the
‘metabolism of xenobiotics by cytochrome P450’. The other main
pathways included ‘drug metabolism-cytochrome P450’, ‘fatty acid
metabolism’ and ‘propanoate metabolism’ (Fig. 4B).
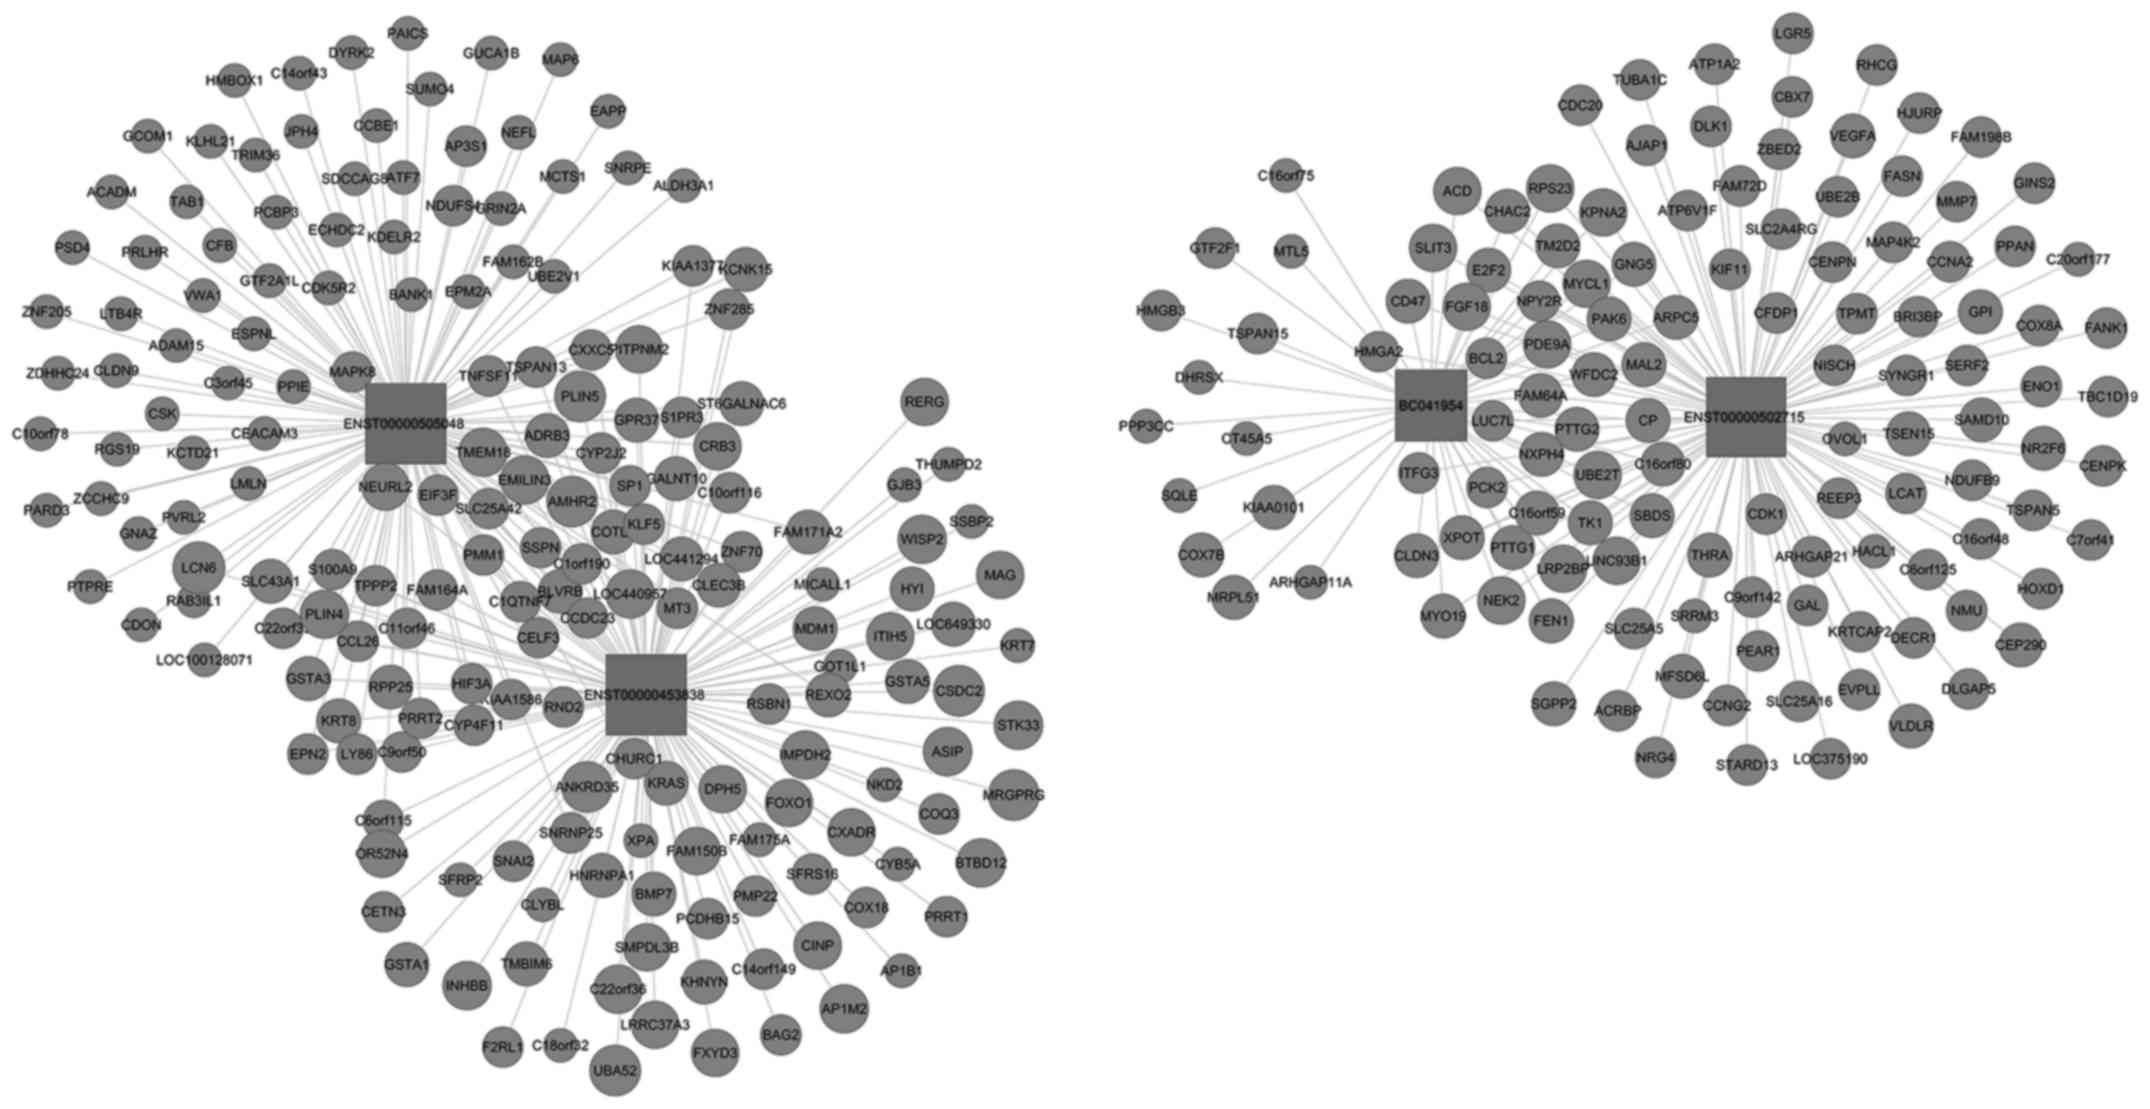
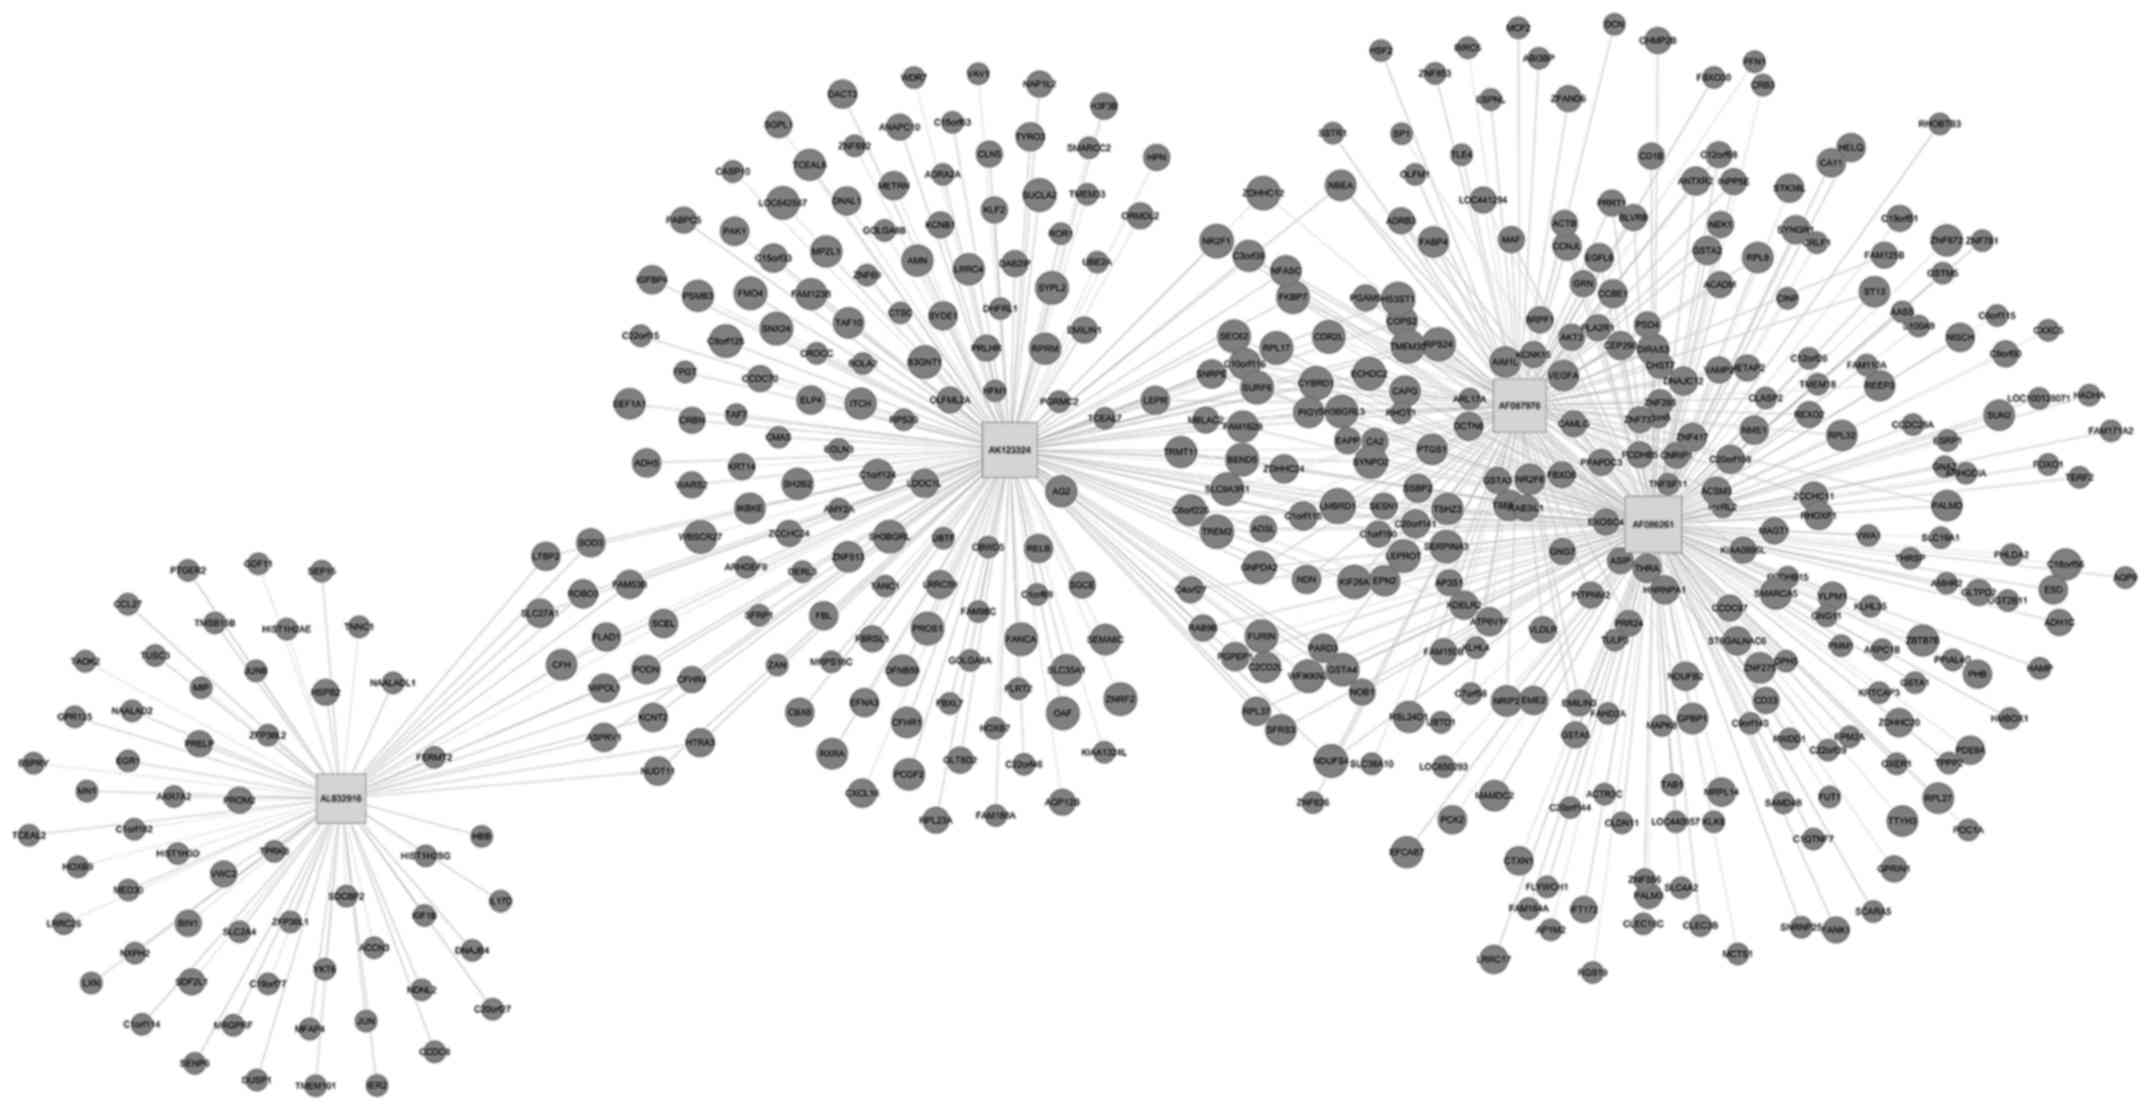
Identification of the CNC gene
co-expression network
To further assess the lncRNAs to directly regulate
the expression of target mRNAs, a CNC gene co-expression network
was generated based on the differentially expressed lncRNA and
targeted genes. Using these 4 upregulated and downregulated
lncRNAs, a CNC network was constructed and it was found that among
the upregulated co-expression network, 4 lncRNAs and 307 mRNAs were
comprised the CNC network nodes, resulting in 202 positive pairs
and 202 negative pairs (Fig. 5).
However, among the downregulated co-expression network, 4 lncRNAs
and 460 mRNAs comprised the CNC network node, leading to 454
positive pairs and 184 negative pairs (Fig. 6). As shown in the figures, the blue
nodes represent mRNA (protein-coding gene), the red nodes represent
the upregulated lncRNA and the green nodes represent the
downregulated lncRNA (the non-coding gene). The lines between the
cycle nodes represent the interactions between lncRNA and mRNA.
Solid lines indicate a positive correlation, whereas dashed lines
indicate a negative correlation. The CNC network indicates the
interregulation of lncRNAs and mRNAs for OC development.
Classification and subgroups of
differentially expressed lncRNAs
These differentially expressed lncRNAs were further
classified and subgrouped into four classes of lncRNA, namely, the
enhancer lncRNA nearby coding gene, HOX cluster, long-intergenic
non-coding RNAs (lincRNAs) nearby coding gene and Rinn lincRNAs.
The enhancer lncRNA nearby coding gene contained the differentially
expressed enhancer-like lncRNAs and their nearby coding genes with
DNA sequence distances of <300 kb, while the HOX cluster lncRNAs
contained four HOX loci targeting 407 discrete transcribed regions
according to a previous study by Rinn et al (25). Moreover, lincRNAs nearby coding
genes contained the differentially expressed lincRNAs, as did
nearby coding gene pairs with a DNA sequence distance of <300
kb. The Rinn lincRNAs profile data contained data for lncRNAs based
on a study by Rinn et al (25). Overall, the current study identified
36 enhancer lncRNAs nearby coding genes, 507 HOX clusters, 90
lincRNAs nearby coding genes and 2,606 Rinn lincRNAs in OC compared
with those of NT.
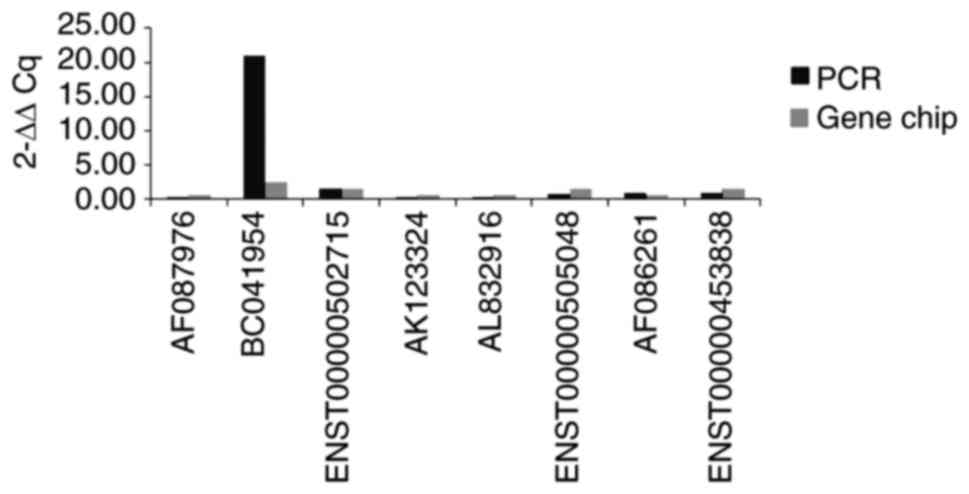
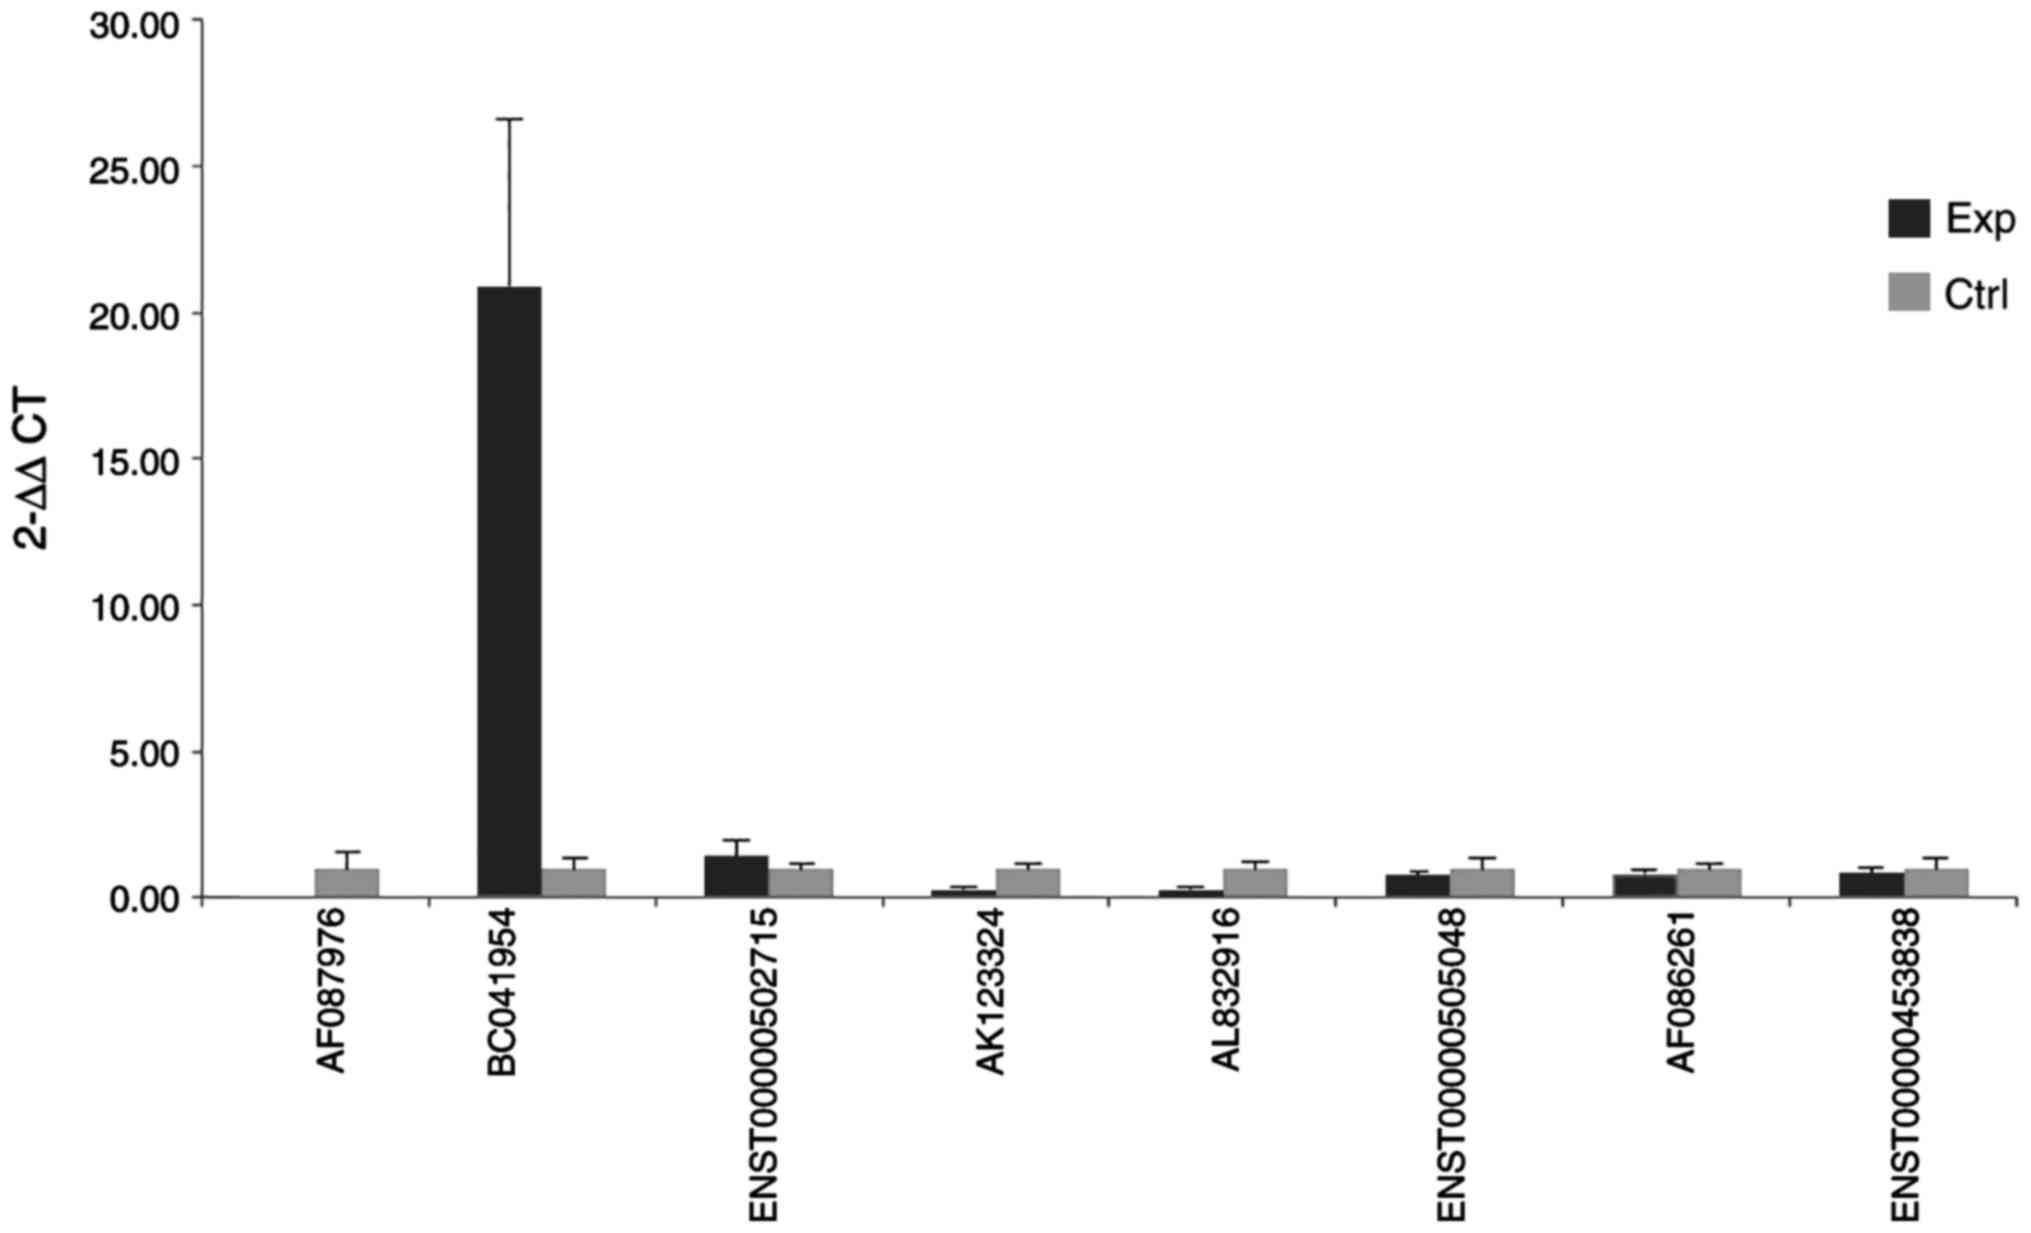
Validation of microarray data
Although microarray data provide a global assessment
of transcriptomic variations, their resolution and accuracy may be
limited at the individual gene level (26). RT-qPCR analysis was thus performed
to validate certain microarray data using this set of tissue
samples. Overall, 4 of the most markedly upregulated (BC041954,
ENST00000453838, ENST00000505048 and ENST00000502715) and
downregulated (AK123324, AF087976, AL832916 and AF086261) lncRNAs
were selected. The results showed that, with the exception of
ENST00000453838 and ENST00000505048, all other lncRNAs were
consistent with those of the microarray data (Figs. 7 and 8).
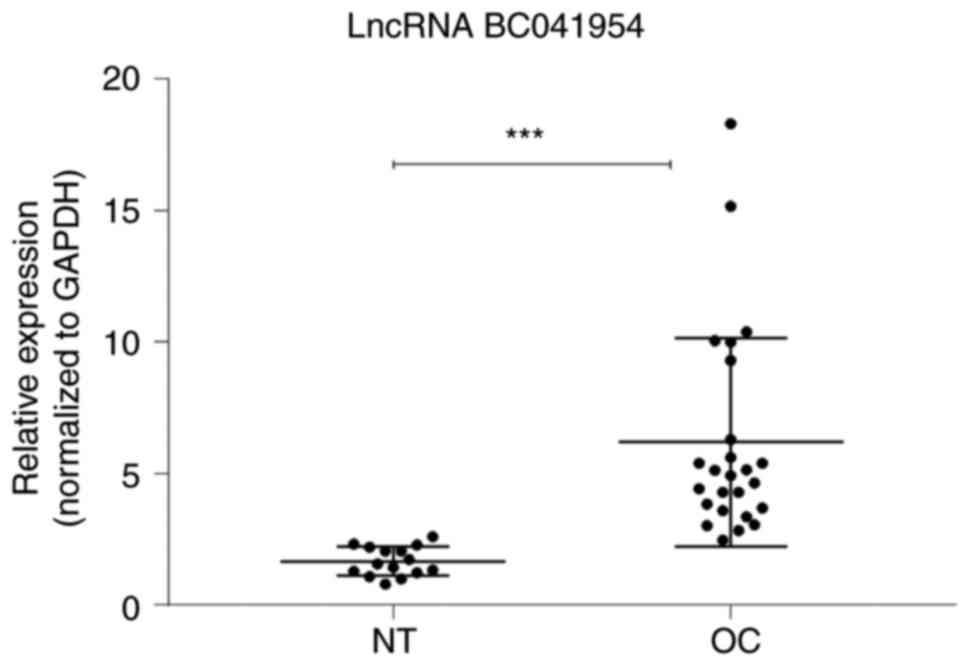
One of these differently expressed lncRNAs
(BC041954) was further assessed using independent tissue samples
containing 25 OC and 15 NT (Fig.
9). The RT-qPCR results further supported the microarray
data.
Discussion
The current study profiled differentially expressed
lncRNAs and mRNAs in OC versus NT and found 2,870 dysregulated
lncRNAs (795 were upregulated and 2,075 were downregulated in OC).
There were 2,658 differentially expressed mRNAs in OC (1,014 were
upregulated and 1,644 were downregulated compared with those of
NT). The RT-qPCR analysis further confirmed the majority of the
microarray data. Furthermore, the GO analysis showed that the
upregulated genes were involved in the development of the ‘cell
anatomical structure’, ‘embryo and system development’, and
‘multicellular organismal development’. By contrast, the
downregulated genes were involved in ‘gene expression’, ‘nitrogen
compound metabolic processes’, ‘kidney development’ and ‘cellular
nitrogen compound metabolic processes’. The KEGG pathway analysis
revealed that the upregulated transcripts could form 12 gene
pathways, but that the downregulated transcripts could form 33
pathways. These differentially expressed lncRNAs could be
classified into four classes of lncRNA, namely, the enhancer lncRNA
nearby coding gene, HOX cluster, lincRNAs nearby a coding gene and
Rinn lincRNAs. The CNC gene co-expression network data showed the
interregulation of lncRNAs and mRNAs for OC development. In
conclusion, the expression of lncRNAs and mRNAs was dysregulated in
OC, and further investigation could provide novel information for
these dysregulated genes as biomarkers, therapeutic targets, and/or
molecular mechanisms of OC.
Notably, lncRNAs are a class of regulatory molecules
for which aberrant expression was associated with malignant
transformation of various normal cells (27). lncRNAs regulate the expression of
their targeting genes and are associated with cancer development
(17–20). Certain lncRNAs function as tumor
oncogenes, whereas others function as tumor suppressors (17,19,20).
In OC, previous studies have shown that lncRNAs serve a crucial
role in malignant OC (10,13,14,16,17).
For example, recent studies showed that hepatocellular carcinoma
upregulated lncRNA could function as an oncogene to target the
expression of autophagy related 7 and integrin subunit β1 (28), and lncRNA Ewing sarcoma-associated
transcript 1 was able to promote OC progression by targeting
miR-330-5p expression (29).
Meanwhile, the lost expression of lncRNA SPRY4 intronic transcript
1 promoted OC cell metastasis partly by inducting tumor cell
epithelial-mesenchymal transition (30) and reducing the expression of lncRNA
tubulin α 4b, which was associated with poor EOC prognosis
(31). Another recent study showed
that an integrated miRNA-lncRNA signature was able to predict
survival in patients with wild-type BRCA1 DNA repair
associated/BRCA2 DNA repair associated OC (32). Moreover, the altered lncRNA
signature may also predict paclitaxel resistance in EOC patients
(33). In addition, the lncRNA
colon cancer-associated transcript 1 was shown to associate with
poor prognosis in EOC patients by promoting tumor metastasis
(34). The current study found a
great number of differentially expressed lncRNAs in OC tissues
versus NT. Notably, previous microarray profiling studies also
showed altered lncRNA expression in OC (35,36).
Thus, detecting aberrant lncRNA expression could potentially be a
novel technique for cancer diagnosis and prognosis.
However, the microarray profile analysis is only
performed to globally assess altered gene expression in samples,
and a validation set of samples is required to verify the
microarray data. The current study confirmed the majority of the
microarray data, as well as the most upregulated and downregulated
lncRNAs in OC tissues, further suggesting that the differently
expressed lncRNAs may be involved in the molecular regulation of OC
development. BC041954 was selected from among the markedly
upregulated lncRNAs for further validation using RT-qPCR in 25 OC
and 15 NT samples, and the data confirmed alterations of lncRNA
expression in OC. Furthermore, GO, KEGG pathway and co-expression
network analyses were utilized to investigate the potential
functions of these target genes of differentially expressed lncRNAs
in OC. It was found that based on the GO analysis, the top GO term
of the upregulated lncRNAs was ‘anatomical structure development’,
whereas the top GO term of the downregulated lncRNAs was ‘gene
expression’. These results indicated that lncRNAs regulate gene
expression for their biological function. In addition, the KEGG
pathway analysis identified 45 pathways that corresponded to
differentially expressed transcripts. Among them, 12 pathways were
in upregulated transcripts and 33 pathways in downregulated
transcripts. The upregulated lncRNAs were correlated with cell
adhesion molecules at the cell surface to regulate the
cell-extracellular matrix and specific cell-cell interactions
(37). Various studies have
reported that adhesion molecules serve critical roles in tumor
development and metastasis (38).
For instance, the lncRNA BC048612 can regulate the expression of
neuronal growth regulator 1 (NEGR1), a cell adhesion molecule, and
a recent study (37) demonstrated
that the lncRNA BC048612 transcribed from the bi-directional
GC-rich promoter of NEGR1 was able to upregulate NEGR1 expression,
whereas the knockdown of BC048612 expression led to the significant
downregulation of NEGR1 expression. Another study (38) showed that the lncRNA LINC00152 could
activate the rapamycin (mechanistic target of rapamycin) pathway by
binding to the epithelial cell adhesion molecule promoter.
Therefore, we speculated that there may be a link between the
dysregulated lncRNAs and adhesion molecules in OC
tumorigenesis.
Furthermore, according to the link between lncRNAs
and their targeting protein-coding genes, lncRNAs can be
characterized as antisense, intergenic, enhancer, bidirectional and
intronic lncRNAs. The present study next conducted a subgroup
analysis and revealed four classes of lncRNA, namely, the enhancer
lncRNA nearby coding gene, HOX cluster, lincRNAs nearby coding gene
and Rinn lincRNAs. Various lncRNAs are able to exert their
biological function as enhancers, i.e., the activation of gene
transcription by serving as cis-regulatory molecules. The
enhancer lncRNA is transcribed from the sequences of the enhancer
regions to actively regulate the transcription of the
protein-coding genes (16). A
recent study demonstrated that a number of enhancer elements were
transcribed and produced RNA molecules, as the enhancer RNAs
(39). By contrast, lincRNAs
include a great number of the non-coding regions interspersed
between genes (10,16,27)
and function in various cell processes, including embryonic stem
cell pluripotency, cell growth, or tumor metastasis (7,23). The
current study revealed that BC041954 was the most significantly
upregulated lncRNA in OC compared with NT. BC041954 is 1,055 bp in
length and localized at chromosome 3 near the Zic family member 4
gene. lncRNA ENST00000423200 is a 342-bp intergenic lncRNA
localized in chromosome 4. lncRNA ENST00000433201 is a 531-bp
intergenic lncRNA localized at chromosome 15, close to the
AC104759.2 gene. By contrast, the current study showed that lncRNA
AK123324, which has 2,568 bp as an intergenic lncRNA at chromosome
8, was the most significantly downregulated in OC, while AF087976
is a 652-bp intergenic lncRNA localized at chromosome 6. The
current study revealed several novel lncRNAs; however, thus far,
they not been found to be altered in OC or other cancer types.
There are certain limitations to the current study;
for example, the profiles of the differentially expressed lncRNAs
varied among the different microarray profiling studies, and the
sample size was relatively small in the current study, which could
lead to such a difference. The expression of various lncRNAs could
be highly tissue-specific and cancer-specific (37). Therefore, the signature of lncRNAs
as a biomarker for tumor diagnosis and prognosis requires further
confirmation with independent larger sample sizes of patients in
future studies. Moreover, more functional analysis of the role of
lncRNAs in OC is required.
In summary, the current study profiled the
differential lncRNA and mRNA expression between OC and NT samples,
and revealed that these lncRNAs and mRNAs may serve a role in OC.
The comprehensive GO and KEGG pathway and CNC network analyses
indicated that certain lncRNAs/mRNAs may serve important roles in
OC pathogenesis. These data may offer novel insights into OC
pathogenesis and could be a promising strategy to dissect the
molecular mechanism of OC. Further studies are warranted to provide
convincing evidence for clarifying the functions of lncRNA in
OC.
Acknowledgements
Not applicable.
Funding
This study was supported in part by grants from
National Natural Science Foundation of China (no. 81001163), The
Natural Science Foundation of Liaoning Province (no. 2015020462)
and Shenyang Science and Technology Project Funds (no.
F13-220-9-46).
Availability of data and materials
The datasets used and/or analyzed during the current
study are available from the corresponding author on reasonable
request.
Authors' contributions
YML: System design, paper writing and modification
of the experimental design. YW: Microarray analysis. SQL:
Collection of ovarian specimens, RT-qPCR and related data analysis.
MYZ: GO analysis, pathway analysis and related data analysis. YRG:
CNC analysis and related data analysis. All authors read and
approved the final manuscript.
Ethics approval and consent to
participate
This study was approved by our Ethics Committee in
Shengjing Hospital, China Medical University (Shenyang, China) and
each patient provided informed consent for the collection of tissue
samples during surgery.
Patient consent for publication
Not applicable.
Competing interests
The authors declare that they have no competing
interests.
References
|
1
|
Manchanda R and Menon U: Setting the
threshold for surgical prevention in women at increased risk of
ovarian cancer. Int J Gynecol Cancer. 28:34–42. 2018. View Article : Google Scholar : PubMed/NCBI
|
|
2
|
Oza AM, Cook AD, Pfisterer J, Embleton A,
Ledermann JA, Pujade-Lauraine E, Kristensen G, Carey MS, Beale P,
Cervantes A, et al: Standard chemotherapy with or without
bevacizumab for women with newly diagnosed ovarian cancer (ICON7):
Overall survival results of a phase 3 randomised trial. Lancet
Oncol. 16:928–936. 2015. View Article : Google Scholar : PubMed/NCBI
|
|
3
|
Prat J: Ovarian carcinomas: Five distinct
diseases with different origins, genetic alterations, and
clinicopathological features. Virchows Arch. 460:237–249. 2012.
View Article : Google Scholar : PubMed/NCBI
|
|
4
|
Siegel RL, Miller KD and Jemal A: Cancer
statistics, 2017. CA Cancer J Clin. 67:7–30. 2017. View Article : Google Scholar : PubMed/NCBI
|
|
5
|
Schuijer M and Berns EM: TP53 and ovarian
cancer. Hum Mutat. 21:285–291. 2003. View Article : Google Scholar : PubMed/NCBI
|
|
6
|
Balch C, Fang F, Matei DE, Huang TH and
Nephew KP: Minireview: Epigenetic changes in ovarian cancer.
Endocrinology. 150:4003–4011. 2009. View Article : Google Scholar : PubMed/NCBI
|
|
7
|
Eddy SR: Non-coding RNA genes and the
modern RNA world. Nat Rev Genet. 2:919–929. 2001. View Article : Google Scholar : PubMed/NCBI
|
|
8
|
Wilusz JE, Sunwoo H and Spector DL: Long
noncoding RNAs: Functional surprises from the RNA world. Genes Dev.
23:1494–1504. 2009. View Article : Google Scholar : PubMed/NCBI
|
|
9
|
Guttman M, Amit I, Garber M, French C, Lin
MF, Feldser D, Huarte M, Zuk O, Carey BW, Cassady JP, et al:
Chromatin signature reveals over a thousand highly conserved large
non-coding RNAs in mammals. Nature. 458:223–227. 2009. View Article : Google Scholar : PubMed/NCBI
|
|
10
|
Mattick JS: The genetic signatures of
noncoding RNAs. PLoS Genet. 5:e10004592009. View Article : Google Scholar : PubMed/NCBI
|
|
11
|
Geretto M, Pulliero A, Rosano C, Zhabayeva
D, Bersimbaev R and Izzotti A: Resistance to cancer
chemotherapeutic drugs is determined by pivotal microRNA
regulators. Am J Cancer Res. 7:1350–1371. 2017.PubMed/NCBI
|
|
12
|
Lu YM, Shang C, Ou YL, Yin D, Li YN, Li X,
Wang N and Zhang SL: miR-200c modulates ovarian cancer cell
metastasis potential by targeting zinc finger E-box-binding
homeobox 2 (ZEB2) expression. Med Oncol. 31:1342014. View Article : Google Scholar : PubMed/NCBI
|
|
13
|
Guttman M and Rinn JL: Modular regulatory
principles of large non-coding RNAs. Nature. 482:339–346. 2012.
View Article : Google Scholar : PubMed/NCBI
|
|
14
|
Wapinski O and Chang HY: Long noncoding
RNAs and human disease. Trends Cell Biol. 21:354–361. 2011.
View Article : Google Scholar : PubMed/NCBI
|
|
15
|
Gutschner T and Diederichs S: The
hallmarks of cancer: A long non-coding RNA point of view. RNA Biol.
9:703–719. 2012. View Article : Google Scholar : PubMed/NCBI
|
|
16
|
Gibb EA, Vucic EA, Enfield KS, Stewart GL,
Lonergan KM, Kennett JY, Becker-Santos DD, MacAulay CE, Lam S,
Brown CJ and Lam WL: Human cancer long non-coding RNA
transcriptomes. PLoS One. 6:e259152011. View Article : Google Scholar : PubMed/NCBI
|
|
17
|
Gupta RA, Shah N, Wang KC, Kim J, Horlings
HM, Wong DJ, Tsai MC, Hung T, Argani P, Rinn JL, et al: Long
non-coding RNA HOTAIR reprograms chromatin state to promote cancer
metastasis. Nature. 464:1071–1076. 2010. View Article : Google Scholar : PubMed/NCBI
|
|
18
|
Yang Z, Zhou L, Wu LM, Lai MC, Xie HY,
Zhang F and Zheng SS: Overexpression of long non-coding RNA HOTAIR
predicts tumor recurrence in hepatocellular carcinoma patients
following liver transplantation. Ann Surg Oncol. 18:1243–1250.
2011. View Article : Google Scholar : PubMed/NCBI
|
|
19
|
Qiu JJ, Lin YY, Ye LC, Ding JX, Feng WW,
Jin HY, Zhang Y, Li Q and Hua KQ: Overexpression of long non-coding
RNA HOTAIR predicts poor patient prognosis and promotes tumor
metastasis in epithelial ovarian cancer. Gynecol Oncol.
134:121–128. 2014. View Article : Google Scholar : PubMed/NCBI
|
|
20
|
Kogo R, Shimamura T, Mimori K, Kawahara K,
Imoto S, Sudo T, Tanaka F, Shibata K, Suzuki A, Komune S, et al:
Long noncoding RNA HOTAIR regulates polycomb-dependent chromatin
modification and is associated with poor prognosis in colorectal
cancers. Cancer Res. 71:6320–6326. 2011. View Article : Google Scholar : PubMed/NCBI
|
|
21
|
Szafron LM, Balcerak A, Grzybowska EA,
Pienkowska-Grela B, Podgorska A, Zub R, Olbryt M, Pamula-Pilat J,
Lisowska KM, Grzybowska E, et al: The putative oncogene, CRNDE, is
a negative prognostic factor in ovarian cancer patients.
Oncotarget. 6:43897–43910. 2015. View Article : Google Scholar : PubMed/NCBI
|
|
22
|
Barber HR, Sommers SC, Synder R and Kwon
TH: Histologic and nuclear grading and stromal reactions as indices
for prognosis in ovarian cancer. Am J Obstet Gynecol. 121:795–807.
1975.PubMed/NCBI
|
|
23
|
Shannon P, Markiel A, Ozier O, Baliga NS,
Wang JT, Ramage D, Amin N, Schwikowski B and Ideker T: Cytoscape: A
software environment for integrated models of biomolecular
interaction networks. Genome Res. 13:2498–2504. 2003. View Article : Google Scholar : PubMed/NCBI
|
|
24
|
Livak KJ and Schmittgen TD: Analysis of
relative gene expression data using real-time quantitative PCR and
the 2(-Delta Delta C(T)) method. Methods. 25:402–408. 2001.
View Article : Google Scholar : PubMed/NCBI
|
|
25
|
Rinn JL, Kertesz M, Wang JK, Squazzo SL,
Xu X, Brugmann SA, Goodnough LH, Helms JA, Farnham PJ, Segal E and
Chang HY: Functional demarcation of active and silent chromatin
domains in human HOX loci by noncoding RNAs. Cell. 129:1311–1323.
2007. View Article : Google Scholar : PubMed/NCBI
|
|
26
|
Qin LX, Beyer RP, Hudson FN, Linford NJ,
Morris DE and Kerr KF: Evaluation of methods for oligonucleotide
array data via quantitative real-time PCR. BMC Bioinformatics.
7:232006. View Article : Google Scholar : PubMed/NCBI
|
|
27
|
Bhan A, Soleimani M and Mandal SS: Long
noncoding RNA and cancer: A new paradigm. Cancer Res. 77:3965–3981.
2017. View Article : Google Scholar : PubMed/NCBI
|
|
28
|
Chen S, Wu DD, Sang XB, Wang LL, Zong ZH,
Sun KX, Liu BL and Zhao Y: The lncRNA HULC functions as an oncogene
by targeting ATG7 and ITGB1 in epithelial ovarian carcinoma. Cell
Death Dis. 8:e31182017. View Article : Google Scholar : PubMed/NCBI
|
|
29
|
Fu X, Zhang L, Dan L, Wang K and Xu Y:
LncRNA EWSAT1 promotes ovarian cancer progression through targeting
miR-330-5p expression. Am J Transl Res. 9:4094–4103.
2017.PubMed/NCBI
|
|
30
|
Yu J, Han Q and Cui Y: Decreased long
non-coding RNA SPRY4-IT1 contributes to ovarian cancer cell
metastasis partly via affecting epithelial-mesenchymal transition.
Tumour Biol. 39:10104283177091292017. View Article : Google Scholar : PubMed/NCBI
|
|
31
|
Zhu FF, Zheng FY, Wang HO, Zheng JJ and
Zhang Q: Downregulation of lncRNA TUBA4B is associated with poor
prognosis for epithelial ovarian cancer. Pathol Oncol Res.
24:419–425. 2018. View Article : Google Scholar : PubMed/NCBI
|
|
32
|
Guo L, Peng Y, Meng Y, Liu Y, Yang S, Jin
H and Li Q: Expression profiles analysis reveals an integrated
miRNA-lncRNA signature to predict survival in ovarian cancer
patients with wild-type BRCA1/2. Oncotarget. 8:68483–68492.
2017.PubMed/NCBI
|
|
33
|
Wang L, Hu Y, Xiang X, Qu K and Teng Y:
Identification of long non-coding RNA signature for
paclitaxel-resistant patients with advanced ovarian cancer.
Oncotarget. 8:64191–64202. 2017.PubMed/NCBI
|
|
34
|
Cao Y, Shi H, Ren F, Jia Y and Zhang R:
Long non-coding RNA CCAT1 promotes metastasis and poor prognosis in
epithelial ovarian cancer. Exp Cell Res. 359:185–194. 2017.
View Article : Google Scholar : PubMed/NCBI
|
|
35
|
Shen L, Liu W, Cui J, Li J and Li C:
Analysis of long non-coding RNA expression profiles in ovarian
cancer. Oncol Lett. 14:1526–1530. 2017. View Article : Google Scholar : PubMed/NCBI
|
|
36
|
Ding Y, Yang DZ, Zhai YN, Xue K, Xu F, Gu
XY and Wang SM: Microarray expression profiling of long non-coding
RNAs in epithelial ovarian cancer. Oncol Lett. 14:2523–2530. 2017.
View Article : Google Scholar : PubMed/NCBI
|
|
37
|
Kaur P, Tan JR, Karolina DS, Sepramaniam
S, Armugam A, Wong PT and Jeyaseelan K: A long non-coding RNA,
BC048612 and a microRNA, miR-203 coordinate the gene expression of
neuronal growth regulator 1 (NEGR1) adhesion protein. Biochim
Biophys Acta. 1863:533–543. 2016. View Article : Google Scholar : PubMed/NCBI
|
|
38
|
Ji J, Tang J, Deng L, Xie Y, Jiang R, Li G
and Sun B: LINC00152 promotes proliferation in hepatocellular
carcinoma by targeting EpCAM via the mTOR signaling pathway.
Oncotarget. 6:42813–42824. 2015. View Article : Google Scholar : PubMed/NCBI
|
|
39
|
Chen H, Du G, Song X and Li L: Non-coding
transcripts from enhancers: New insights into enhancer activity and
gene expression regulation. Genomics Proteomics Bioinformatics.
15:201–207. 2017. View Article : Google Scholar : PubMed/NCBI
|