Introduction
Among women, ovarian cancer is the seventh-most
common cancer and the first-most common cause of death from
gynecological cancers (1). Although
some biomarkers such as CA125-a most frequently used biomarker for
ovarian cancer detection encoded by the MUC16 gene and HE4-a
glycoprotein, overexpressed by epithelial ovarian cancer (EOC) are
used for ovarian cancer screening, diagnosis and prognosis
evaluation, ovarian cancer is rarely diagnosed until it spreads and
advances to later stages (III/IV) (2). Therefore, further investigation of new
factors involved in ovarian cancer is required.
Recently, it has been observed that cancer cells can
downregulate mitochondrial oxidative phosphorylation and increase
glucose consumption and lactate release rates independently of
oxygen availability (Warburg effect) (3,4), and
lactate produced by anaerobic glycolysis is the primary circulating
TCA substrate for cancer cells (5).
This metabolic rewiring is largely believed to favor tumor growth
and survival. Many molecules, such as MYC, the oncogene Kras, and
the tumor suppressor TP53, regulate metabolic glycolysis and
oxidative stress (6), although
their underlying molecular mechanisms are unclear.
Among the enzymes involved in glycolysis, lactate
dehydrogenase (LDH) is an emerging target for possible
pharmacological approaches to cancer therapy (7,8). LDH
has two major subunits, LDH-A and LDH-B, which can reversibly
catalyze the conversion of pyruvate to lactate or lactate to
pyruvate. LDH-A has a higher affinity for pyruvate and is a key
enzyme in the glycolytic pathway (9–11).
Evidence has revealed that lactic acid promotes tumor metastasis,
and that elevated LDH is a negative prognostic biomarker since it
is a key enzyme in cancer metabolism (12–15).
Since glycolytic metabolism contributes to tumor growth in many
cancers, efforts have been made to block tumor glycolysis by
inhibiting LDH and the monocarboxylate transporters (MCTs), which
regulate cancer cell lactate export. Tumor lactate export is
thought to be primarily mediated by monocarboxylate transporter 1
(MCT1), since this family member is the most commonly upregulated
in human cancers (16–18). MCT1 inhibition is thought to block
tumor growth by disrupting lactate transport, glycolysis and
glutathione synthesis, thus inducing cell death (19–21).
SATB1 (special AT-rich-binding protein 1) is a
global genome organizer that changes chromatin architecture to
reprogram gene expression profiles in the genome (22–24).
In our previous study, we revealed that SATB1 was important in
ovarian cancer metastasis, and its high expression was associated
with high metastasis rates and low survival rates in EOC (25). We demonstrated that SATB1 may be a
potential novel prognostic biomarker and therapeutic target for
patients with ovarian cancer. However, the significance of SATB1
expression in ovarian cancer and its regulatory mechanisms have
rarely been reported.
Given that tumor cell metabolism is regulated by
certain genes, and SATB1 serves as a global genome organizer, we
hypothesized that SATB1 promoted ovarian cancer development by
regulating the metabolic enzyme expression levels in the tumor
microenvironment, such as LDH and MCT1. Similar research results
have been poorly reported. The present study explored the
regulatory activity of the SATB1/LDH pathway in the metabolic
reprogramming of EOC cells and the potential molecular mechanism
that promoted cell invasion and metastasis. Correlations between
these clinical parameters and blood serum LDH levels were assessed
in ovarian cancer patients. Our research may provide a theoretical
basis for a new target in the energy metabolic pathway to find new
anticancer therapeutics for ovarian cancer.
Materials and methods
Patients
This retrospective analysis was conducted using
clinical data obtained from ovarian cancer patients who underwent
surgical resection at the Department of Obstetrics and Gynecology,
Shanghai General Hospital, Shanghai Jiaotong University School of
Medicine between January 2011 and March 2016. Records from 133
ovarian cancer patients and 43 normal controls were retrospectively
reviewed. The clinical stage of ovarian cancer was determined based
on the International Federation of Gynecology and Obstetrics (FIGO)
stage. The normal controls were healthy women 35–60 years old. The
present study was reviewed and approved by the Institutional Review
Board and the Research Ethics Committee of Shanghai General
Hospital. All participants provided informed consent to participate
in the study.
Cell lines
The human ovarian serous cystadenocarcinoma cell
line SKOV3 was purchased from the American Type Culture Collection
(ATCC; Manassas, VA, USA) and maintained in RPMI-1640 medium
supplemented with 10% fetal bovine serum (FBS), 100 U/ml
penicillin, and 100 µg/ml streptomycin (all from Invitrogen; Thermo
Fisher Scientific, Inc., Waltham, MA, USA) in a humidified
incubator with 5% CO2 at 37°C.
Transient transfection
To analyze the functional relevance and possible
therapeutic potential of SATB1 inhibition, we used transient
siRNA-mediated knockdown and comprehensively analyzed the cellular
and molecular role of SATB1 in ovarian cancer. siRNAs were
purchased from Sigma-Aldrich (Merck KGaA, Darmstadt, Germany).
Scrambled siRNA was used as a negative control. Prior to
transfection, (5×10⁵) cells were seeded in cell culture
plates and maintained overnight under standard condition (RPMI-1640
medium supplemented with 10% FBS, 100 U/ml penicillin and 100 µg/ml
streptomycin) SKOV3 cells were transfected using
Lipofectamine® 3000 reagent (Thermo Fisher Scientific,
Inc.) according to the manufacturer's instructions. Sequences for
siRNA transfection are listed in Table
I, and the duration for transfection was 48 h.
 | Table I.Sequences for siRNA transfection. |
Table I.
Sequences for siRNA transfection.
| Gene name | Target site | DNA sequences |
|---|
| SATB1 | 620-642 | GGCUAAUCCAGGUUG
GAAA |
|
(NM_001131010.2) | 1339-1361 |
GAGGUGUCUUCCGAAAUCU |
|
| 2373-2395 |
CGAUGUGGCAGAAUAUAAA |
RNA preparation and RT-qPCR
Total RNA was isolated using TRI Reagent®
(Sigma-Aldrich; Merck KGaA) according to the manufacturer's
instructions. A RevertAid™ H Minus First Strand cDNA Synthesis kit
(Thermo Fisher Scientific, Inc.) was used to reverse-transcribe 1
µg of total RNA with random hexamer primers. For quantitative PCR,
a LightCycler® 2.0 (Roche Diagnostics GmbH, Mannheim,
Germany) and the Absolute™ qPCR SYBR®-Green Capillary
Mix (Thermo Fisher Scientific, Inc.) were used as previously
described (26). Primers are listed
in Table II. The cycling
conditions consisted of a denaturation step at 95°C for 10 min, 40
cycles at 95°C for 15 sec, a 45-sec annealing step at 60°C, and
finally a holding temperature at 95°C, for 15 sec, and then at 60°C
for 1 min. Gene expression was quantified based on the ΔΔCq method
(27), with β-actin as the
reference housekeeping gene. Primers were produced by Shanghai
Sangon Biological Engineering Technology and Services Company
(Shanghai, China).
| Table II.Primer sequences of SATB1, MCT1,
LDH-A, MDH1, MDH2, G6PD, TGM1, PFK1 and GAPDH. |
Table II.
Primer sequences of SATB1, MCT1,
LDH-A, MDH1, MDH2, G6PD, TGM1, PFK1 and GAPDH.
| Gene name | Size (bp) | Primer
sequences |
|---|
| SATB1
(NM_001131010.2) | 244 | F: 5′
GGCTCGTATCAACACCTATC 3′ |
|
|
| R: 5′
CCTGCTCGTTTCAGTTCATC 3′ |
| MCT1
(NM_001166496.1) | 107 | F: 5′
GGTGGAGGTCCTATCAGCAGT 3′ |
|
|
| R: 5′
CAGAAAGAAGCTGCAATCAAGC 3′ |
| LDH-A
(NM_002301.4) | 191 | F: 5′
AGAACATGGTGATTCTAGTGTGC 3′ |
|
|
| R: 5′
ACAGTCCAATAGCCCAAGAGG 3′ |
| MDH1
(NM_001199111.1) | 174 | F: 5′
TGCCTTCAAAGACCTGGATG 3′ |
|
|
| R: 5′
TTGGCTGGATTACCCACAAC 3′ |
| MDH2
(NM_001282403.1) | 133 | F: 5′
CCCACGGGTTCATAGTTCAG 3′ |
|
|
| R: 5′
CATCAGGGTTCGGTCAGAAG 3′ |
| G6PD
(NM_000402.4) | 243 | F: 5′
CCTACGGCAACAGATACAAG 3′ |
|
|
| R: 5′
CATACTGGAAACCCACTCTC 3′ |
| TGM1
(NM_000359.2) | 163 | F: 5′
GCCCACGACACAGACACATC 3′ |
|
|
| R: 5′
CCACCTGCCACCCATCAAAG 3′ |
| PFK1
(NM_000289.5) | 190 | F: 5′
TGCCCGTGTCTTCTTTGTCC 3′ |
|
|
| R: 5′
ACGCTTCACCAGGTTGTAGG 3′ |
| GAPDH
(NM_001256799.1) | 110 | F: 5′
CACCCACTCCTCCACCTTTG 3′ |
|
|
| R: 5′
CCACCACCCTGTTGCTGTAG 3′ |
Cell proliferation assay
Cell proliferation was analyzed using Cell Counting
Kit-8 (CCK-8) (Beyotime Institute of Biotechnology, Nantong,
China). SKOV3 cells and si-SATB1 knockout SKOV3 cells were seeded
at a density of 1×10⁵ cells/well in a 96-well culture
plate. Cell proliferation was detected at 24, 48 and 72 h.
Subsequenlty, 100 µl of serum-free culture medium and 10 µl of
CCK-8 solution were added to each well and incubated with cells at
37°C for 1 h. The optical density at 450 nm was determined on an
ELx800 microplate reader (BioTek Instruments, Inc., Winooski, VT,
USA).
Western blotting
A dilution of 5×10⁵ SKOV3 cells were
seeded in 6-well plates and transfected as aforementioned.
Following 48 h of transfection, the cells were washed with PBS and
lysed. Cellular protein was quantified with a Bradford assay
(Bio-Rad Laboratories, Inc., Hercules, CA, USA), and 50 µg of the
cleared lysates were separated on a 12% SDS-PAGE gel and
electrotransferred onto PVDF membranes (EMD Millipore, Billerica,
MA, USA). GAPDH was used as an equal loading control. PVDF
membranes were blocked in Tris-buffered saline containing 0.1%
Tween-20 (TBST) with 5% non-fat dry milk for 2 h and incubated with
polyclonal rabbit anti-human SATB1 antibody (1:100; cat. no.
ab92307) and anti-human MCT1 antibody (1:100; cat. no. ab90582;
both from Abcam, Cambridge, UK). The membranes were then washed 3
times for 5 min in PBST and incubated with goat anti-rabbit IgG
H&L (HRP) (1:200; cat. no. ab205718; Abcam) in PBST for 1 h.
Following 3 washes with PBST, the bands were developed using an
enhanced chemiluminescence (ECL) detection system (Pierce Biotech
Inc.; Thermo Fisher Scientific, Inc.) according to the
manufacturer's instructions. The software that was used for
densitometry was Image-Pro Plus (version 6.0; Media Cybernetics,
Rockville, MD, USA).
LDH activity assay
LDH activity was detected using an LDH
Quantification kit (A020-1; Nanjing Jiancheng Bioengineering
Institute, Nanjing, China) according to the manufacturer's
instructions. Briefly, a dilution of 5×10⁵ SKOV3 cells
were seeded in 6-well plates and transfected as aforementioned.
Cell cultured-supernatants were harvested and then the cells were
harvested and cell lysates were prepared by sonication; LDH
activity was determined by calculating the pyruvic acid transferred
by LDH. For tissue, one unit of LDH activity (U/gprot) meant that 1
g of tissue protein reacted with the substrates at 37°C for 15 min
to produce 1 µmol of pyruvate in the reaction system. For serum or
fluid sample, one unit of LDH activity (U/l) meant that 1,000 ml of
serum (or fluid) reacted with the substrates at 37°C for 15 min to
produce 1 µmol of pyruvate in the reaction system. The optical
levels at 440 nm were determined on an ELX-800 microplate reader
(Bio-Tek Instruments, Inc.) and experiments were performed in
triplicate.
Lactate detection
A dilution of 5×10⁵ SKOV3 cells were
seeded in 6-well plates and transfected as aforementioned. Cell
cultured-supernatants were harvested and then the cells were
harvested and cell lysates were prepared by sonication. Lactate of
the cell supernatants and cell lysates was quantified using a
Lactate Assay kit (A019-2; Nanjing Jiancheng Bioengineering
Institute) according to the manufacturer's protocol, which was
quantified by a colorimetric change at 570 nm. The amount of
lactate in the supernatant was quantified by comparison with a
standard curve.
LDH activity detection in patient
sera
According to the manufacturer's instructions,
briefly, about 20 µl of patient sera was dripped on VITROS™
Chemistry Products LDH Slides (Thermo Fisher Scientific, Inc.), and
then enzyme complex calibrator (VITROS™ Chemistry Products
Calibrator kit 3) and the automatic biochemical immunoanalyzer
(VITROS™ 5600) were used to determine LDH activity. We determined
LDH activity by monitoring the rate of conversion from
NAD+ to NADH, which was quantified by a colorimetric
change at 340 nm.
Statistical analysis
All statistical analyses were performed using SPSS
version 22.0 software (IBM Corp., Armonk, NY, USA). T-test was used
to analyze the data for two independent groups. To account for
their effects on the relationship between LDH and cancer stage and
grade and lymphatic metastasis, all variables were analyzed with
Spearman's rank correlation coefficient analysis. Medcalc version
17.9 software (MedCalc Software bvba, Ostend, Belgium) was used for
AUC comparison of LDH and CA125. P<0.05 was considered to
indicate a statistically significant difference.
Results
Inhibitory effect of SATB1 knockdown
on cell proliferation
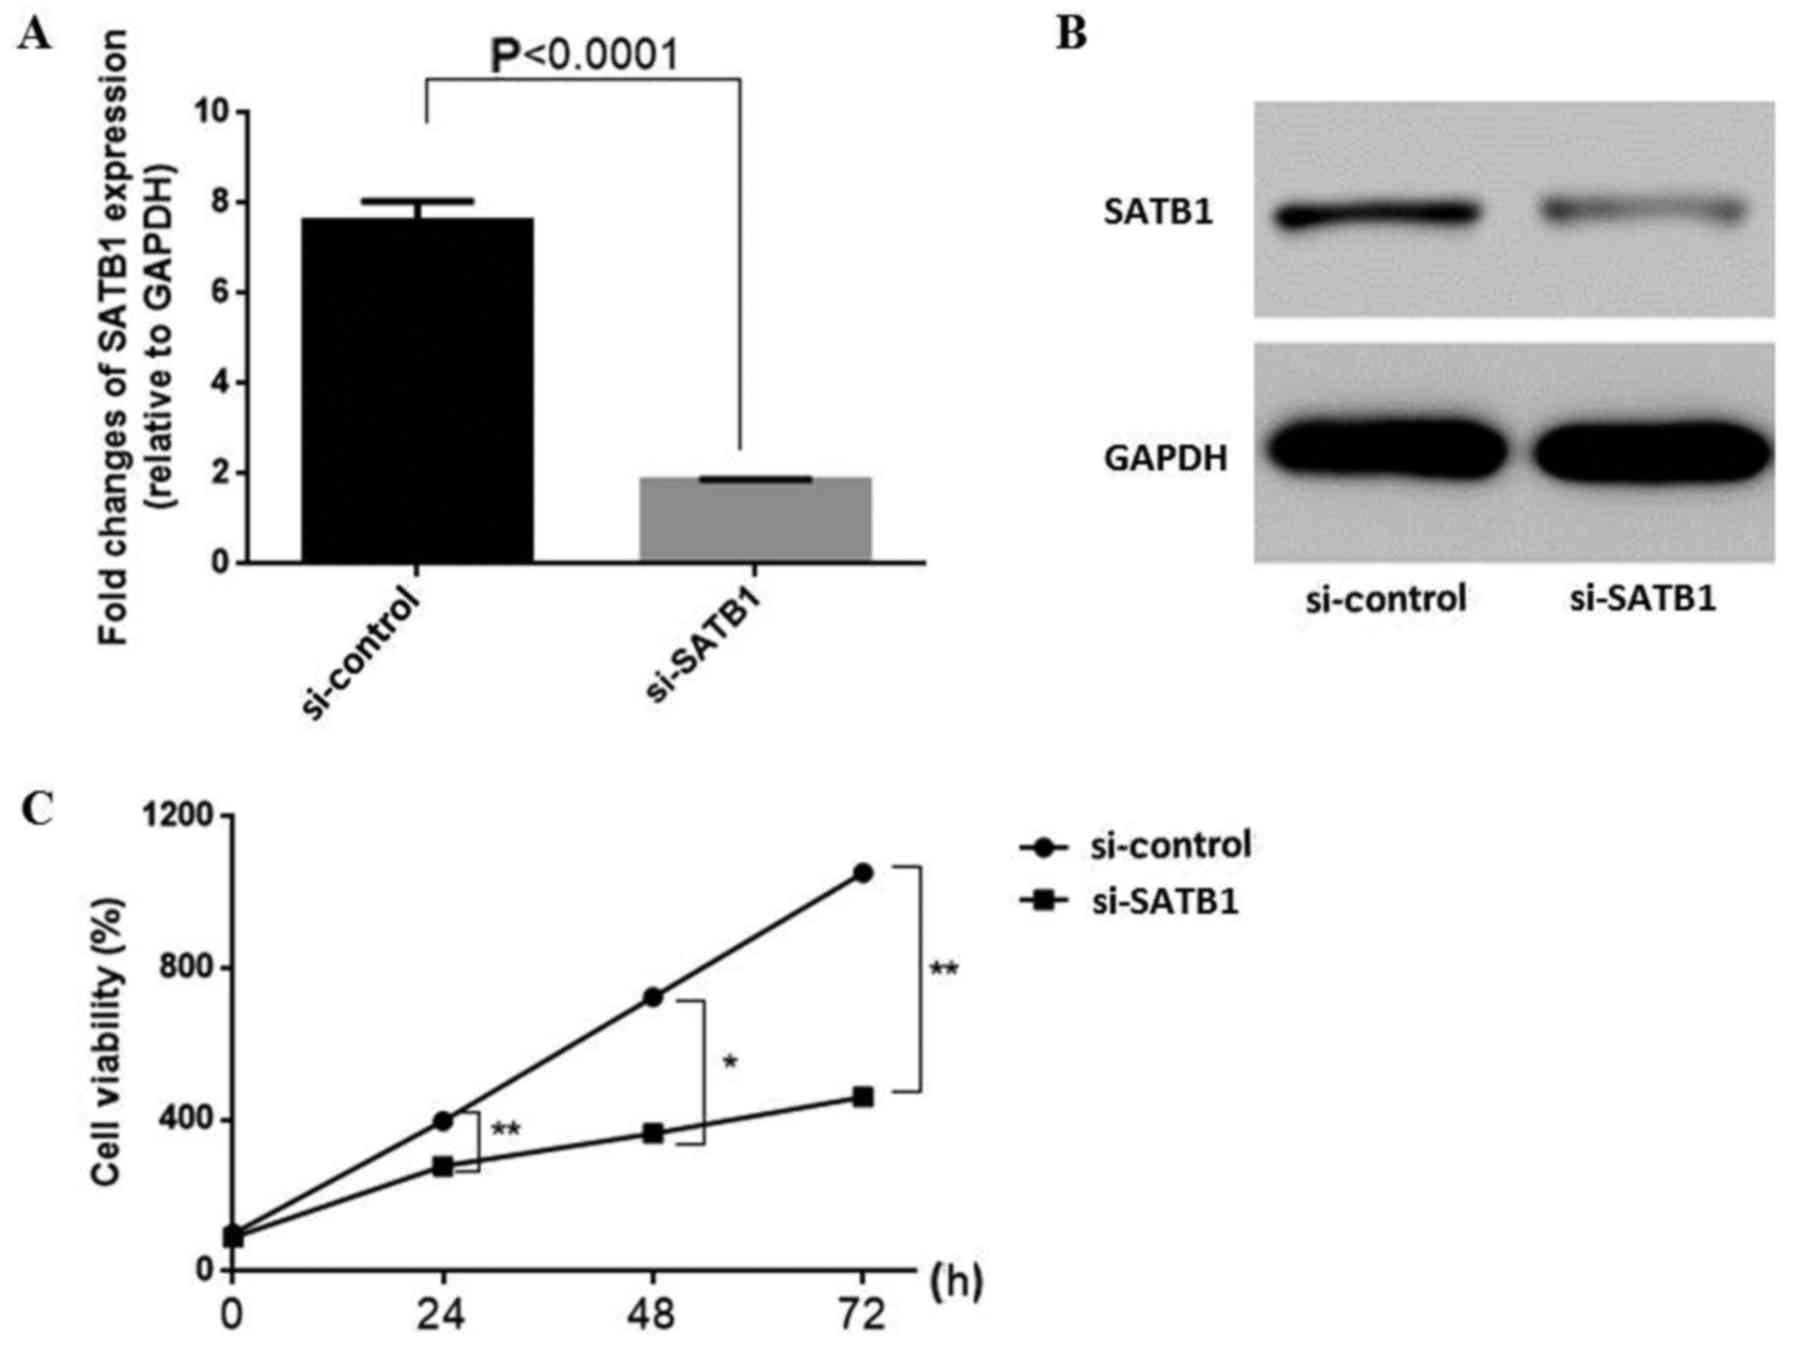
To validate siRNA interference efficiency, we used
RT-qPCR and western blot assays. Primers are listed in Table II. The results revealed that SATB1
expression was significantly decreased by siRNA at both the RNA
(Fig. 1A) and protein levels
(Fig. 1B) compared with the control
group (RNA: 1.00±0.09 vs. 2.92±0.03, P<0.001). To initially
explore the effects of SATB1 knockdown on ovarian cancer cell
proliferation and viability, CCK-8 proliferation assays were
performed. Growth curves revealed a significantly reduced cell
proliferation upon transfection of SKOV3 cells with si-SATB1
(Fig. 1C) (si-SATB1 vs. si-Control,
at 24 h: 321±12.73 vs. 398.56±10.02, P<0.01; at 48 h: 345±8.36
vs.785.09±12.32, P<0.05 at 72 h: 418.44±9.47 vs. 1,314.87±14.73,
P<0.01). Cell proliferation was reduced by >80%, indicating
that SATB1 knockdown greatly affected ovarian cancer cell
proliferation.
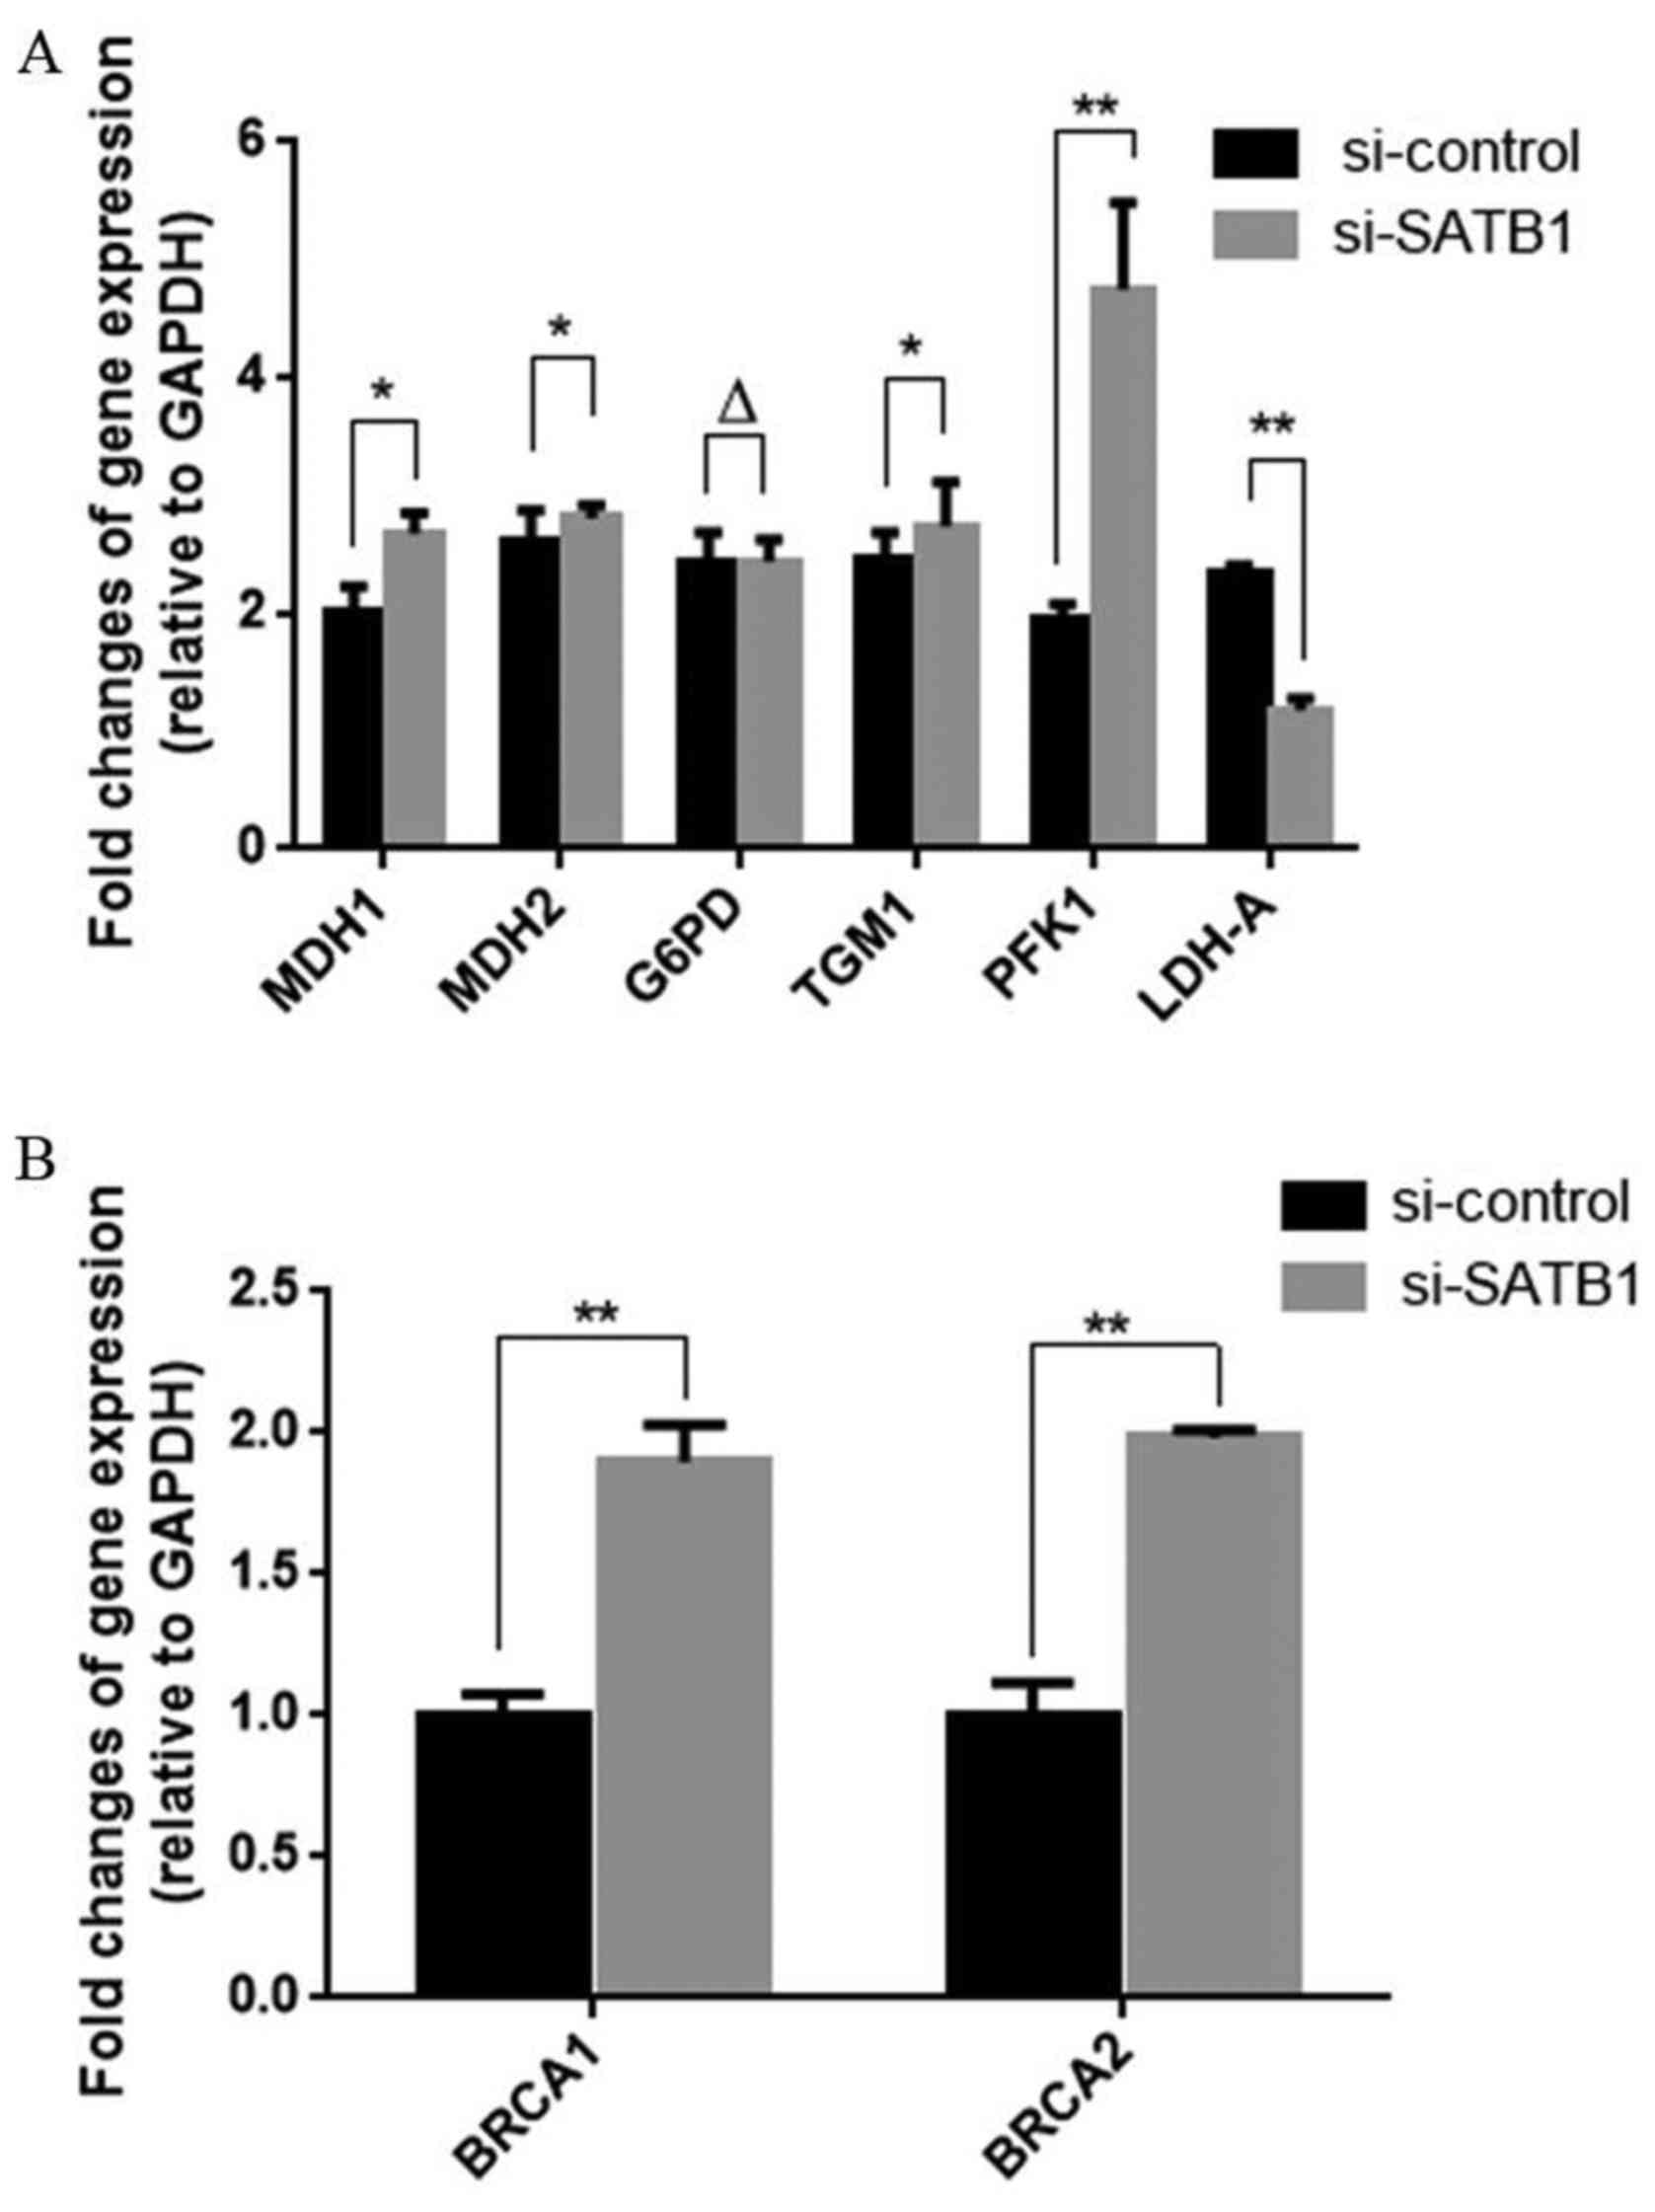
SATB1 regulates the expression of key
glucose metabolism-related molecules
Phosphofructokinase-1 (PFK1) catalyzes the important
‘committed’ step of glycolysis, converting glucose to pyruvate,
which is a substrate for both anaerobic and aerobic glycolysis.
Malate dehydrogenase 1 (MDH1) and 2 (MDH2) are key enzymes in the
TCA cycle (aerobic glycolysis), while LDH, which converts pyruvic
acid back to lactate is an important enzyme in anaerobic
glycolysis. Glucose-6-phosphate dehydrogenase (G6PD) is important
in the pentose phosphate pathway, another glucose
metabolism-related pathway parallel to glycolysis. siRNA-mediated
knockdown of SATB1 affected the expression levels of many of these
molecules, as detected at the mRNA level by quantitative RT-PCR.
The results revealed that SATB1 knockdown significantly inhibited
LDH-A expression in ovarian cancer and increased the RNA expression
of MDH1, MDH2, PFK1, BRCA1 and BRCA2 (Fig. 2 and Table III).
| Table III.SATB1 regulates the expression of key
glucose metabolism-related molecules and BRCA1/BRCA2. |
Table III.
SATB1 regulates the expression of key
glucose metabolism-related molecules and BRCA1/BRCA2.
|
| si-Control | si-SATB1 | P-value
(t-test) |
|---|
| MDH1 | 0.98±0.10 | 1.29±0.08 | <0.05 |
| MDH2 | 1.25±0.11 | 1.47±0.05 | <0.05 |
| G6PD | 1.13±0.16 | 1.15±0.10 | >0.05 |
| TGM1 | 1.16±0.13 | 1.31±0.17 | <0.05 |
| PFK1 | 0.88±0.09 | 2.17±0.08 | <0.001 |
| LDH-A | 1.12±0.13 | 0.14±0.11 | <0.001 |
| BRCA1 | 0.19±0.10 | 1.12±0.08 | <0.01 |
| BRCA2 | 0.19±0.13 | 1.18±0.02 | <0.01 |
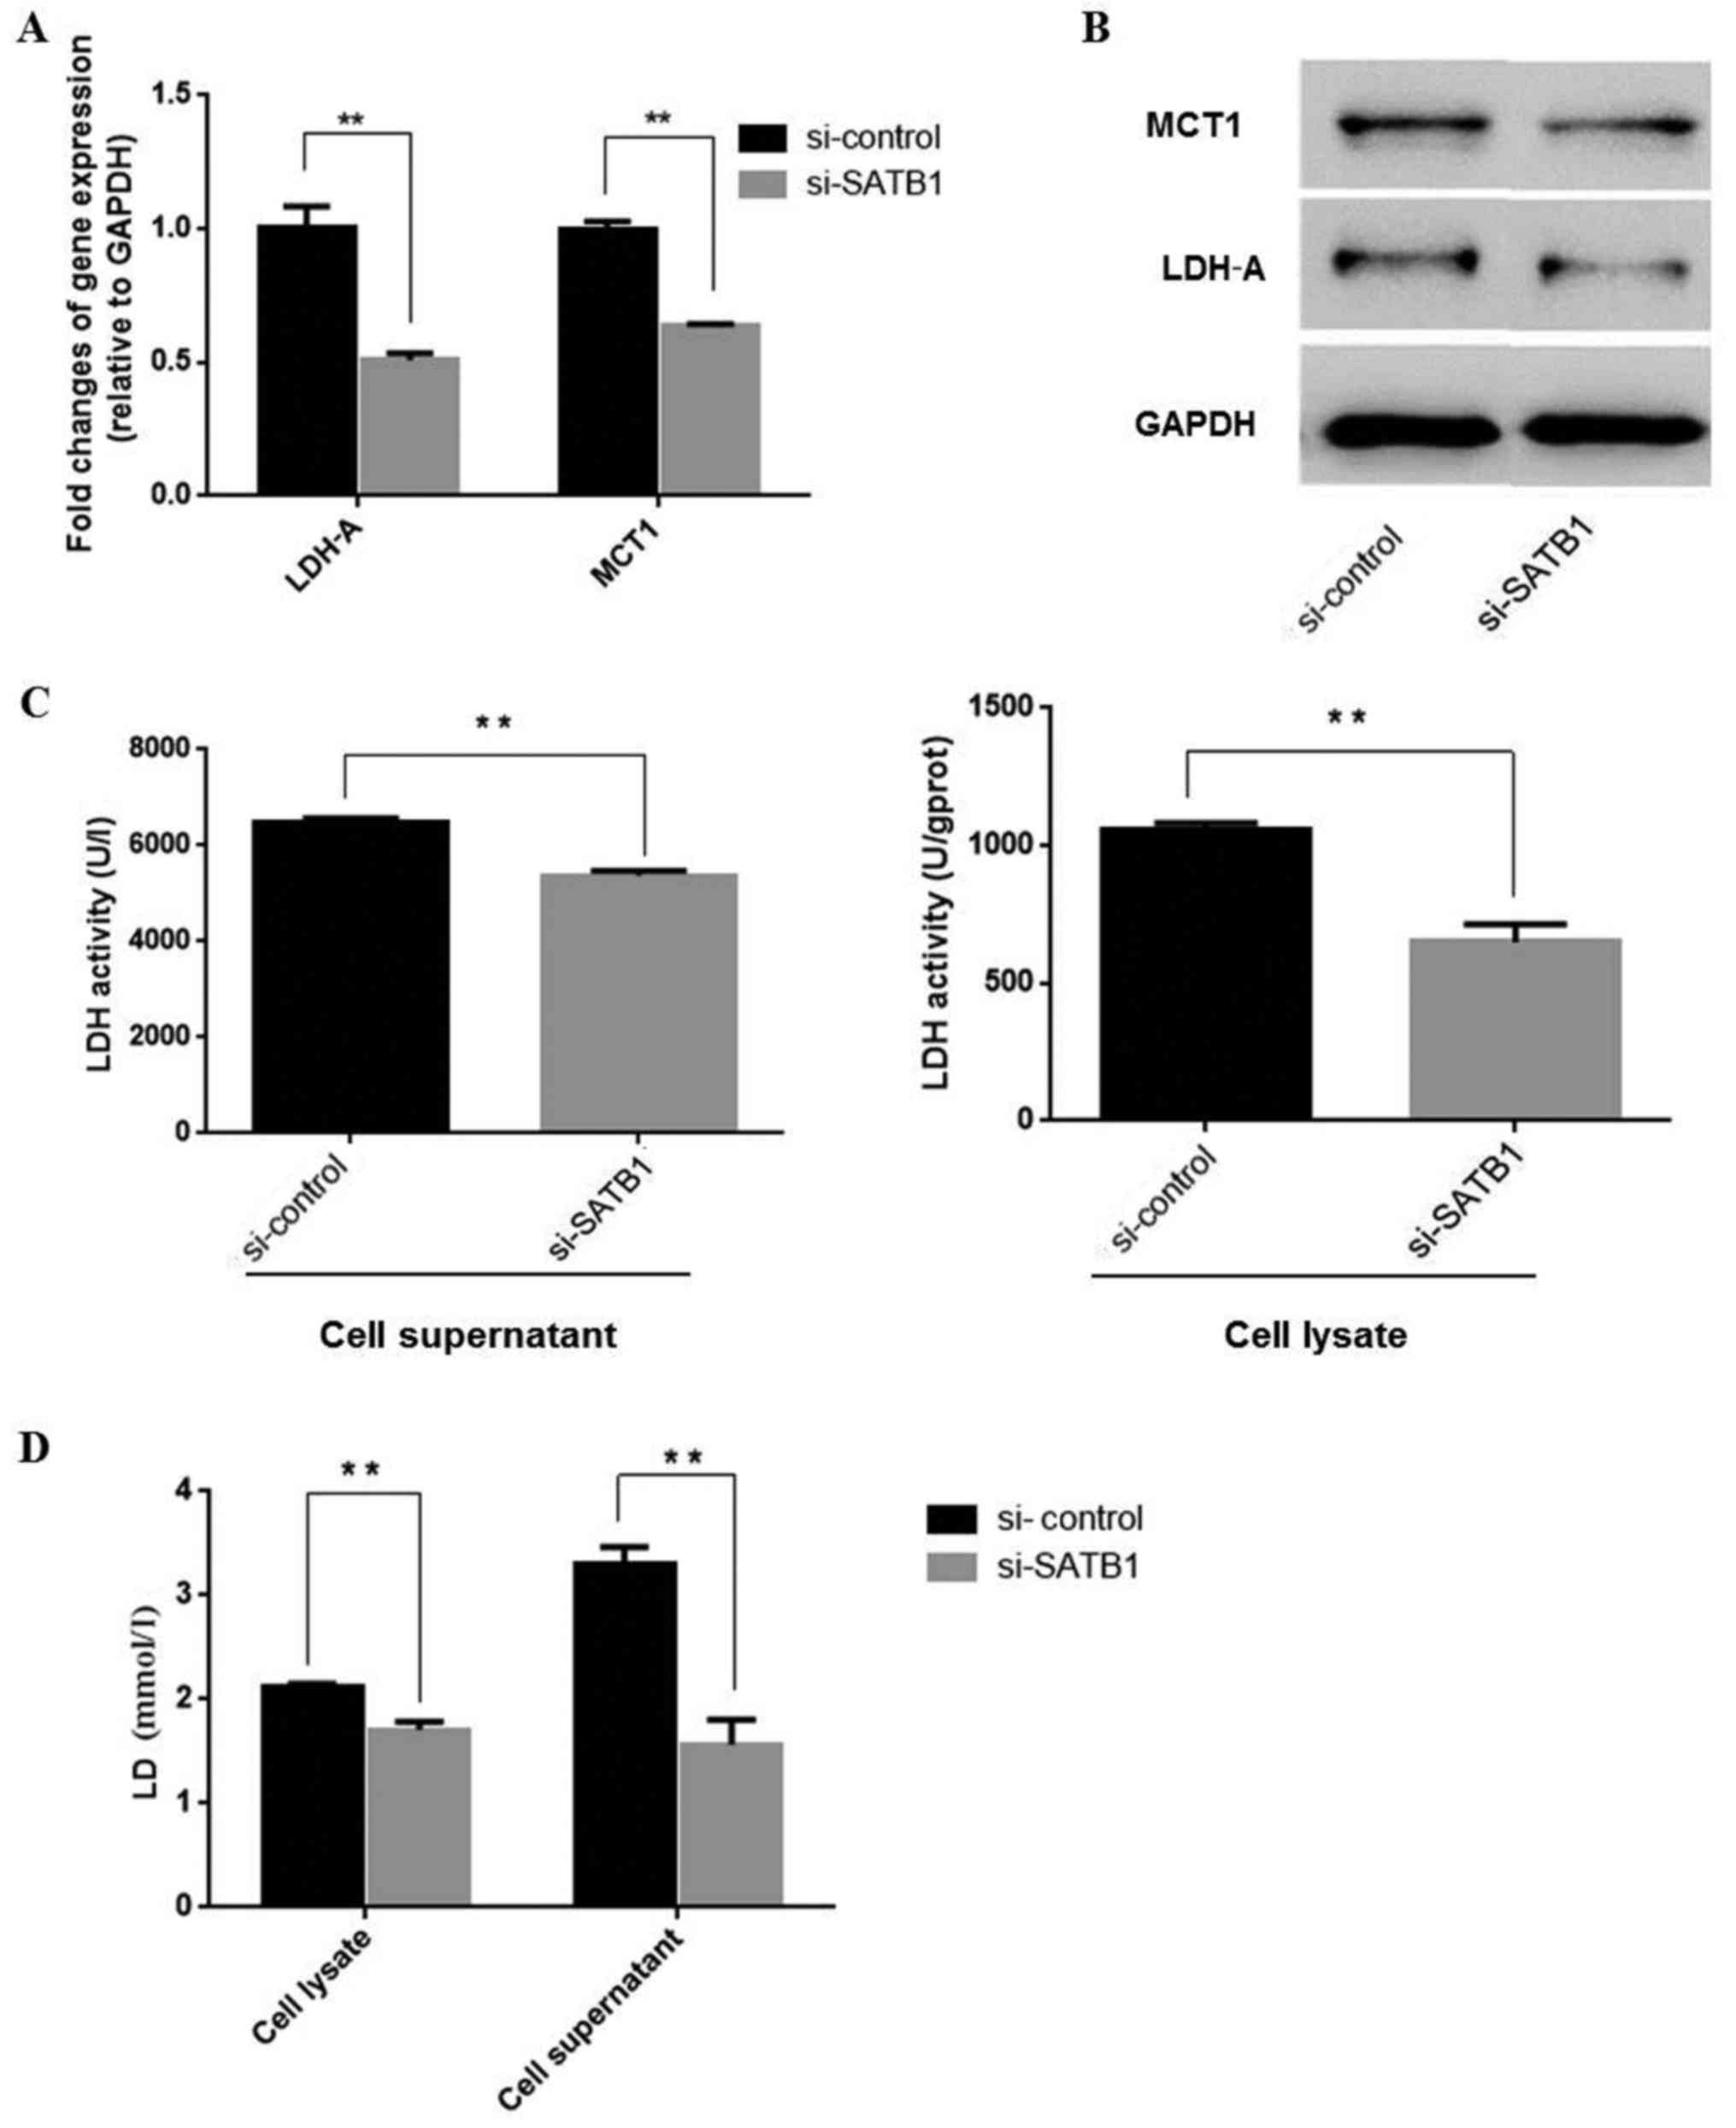
SATB1 regulates anaerobic glycolysis
by stimulating LDH and MCT1 expression and lactate production
As aforementioned, SATB1 may stimulate LDH-A
expression. LDH-A converts pyruvic acid back to lactate, making it
an important enzyme in anaerobic glycolysis. Therefore, we further
investigated whether SATB1 regulated lactate production. MCT1
functions as a lactate/H+ symport system to transport
lactate across the cell membrane. We detected MCT1 and lactate
levels in SKOV3 cells following transfection with si-SATB1 and
found that si-SATB1 decreased LDH-A mRNA (Fig. 3A and Table IV) and protein expression levels
(Fig. 3B), inhibiting LDH enzyme
activities (Fig. 3C and Table V) and lactate production (Fig. 3D and Table V). Thus, SATB1 may be important in
reprogramming ovarian cancer energy metabolism by regulating LDH
and MCT1 levels.
| Table IV.SATB1 inhibits the expression of LDH
and MCT1. |
Table IV.
SATB1 inhibits the expression of LDH
and MCT1.
|
| si-Control | si-SATB1 | P-value
(t-test) |
|---|
| LDH | 1.12±0.17 | 0.14±0.10 | <0.01 |
| MCT1 | 1.12±0.04 | 0.47±0.02 | <0.01 |
| Table V.SATB1 inhibits LDH activity and LD
production of ovarian cancer cells. |
Table V.
SATB1 inhibits LDH activity and LD
production of ovarian cancer cells.
|
| si-Control | si-SATB1 | P-value
(t-test) |
|---|
| LDH (U/gprot) |
|
|
|
| Cell
lysate | 1,053±29.03 | 648.96±67.04 | <0.05 |
|
Supernatant | 6,499.23±75.19 |
5,367.44±107.28 | <0.05 |
| LD
(mmol/gprot) |
|
|
|
| Cell
lysate | 2.11±0.04 | 1.88±0.14 | <0.05 |
|
Supernatant | 3.31±0.16 | 1.73±0.44 | <0.05 |
LDH of anaerobic glycolysis is
associated with poor prognosis in EOC
Lactate, which is converted from pyruvate by LDH in
anaerobic glycolysis, is the primary circulating TCA substrate for
cancer cells. To verify the importance of LDH in EOC, we
retrospectively analyzed the LDH expression level in EOC patients.
Patient baseline characteristics are displayed in Table VI. Serous adenocarcinoma was the
most common subtype (65.41%), and histological grade 3 was the most
frequent grade (42.86%) in our cohort. In total, 37 (27.82%), 27
(20.30%), 65 (48.87%) and 4 (3.01%) patients had stage I, II, III
and IV diseases, respectively. Additionally, 22 (16.54%) patients
had lymphatic metastasis. Optimal debulking was performed in 127
(95.49%) patients.
| Table VI.The clinical baseline characteristics
of ovarian patients. |
Table VI.
The clinical baseline characteristics
of ovarian patients.
| Variable | n (%) |
|---|
| Age (years) | Median, 53.27
(range, 20–82) |
| Histological
type | 133 (100) |
|
Serous | 87 (65.41) |
|
Mucinous | 14 (10.53) |
|
Endometrioid | 10 (7.52) |
| Clear
cell | 5 (3.76) |
|
Undifferentiated | 17 (12.78) |
|
Differentiation | 133 (100) |
| G1 | 24 (18.04) |
| G2 | 52 (39.10) |
| G3 | 57 (42.86) |
| Stage | 133 (100) |
| I | 37 (27.82) |
| II | 27 (20.30) |
|
III | 65 (48.87) |
| IV | 4 (3.01) |
| Lymphatic
metastasis | 133 (100) |
|
Negative | 111 (83.46) |
|
Positive | 22 (16.54) |
| Optimal
debulking | 133 (100) |
| No | 6 (4.51) |
|
Yes | 127 (95.49) |
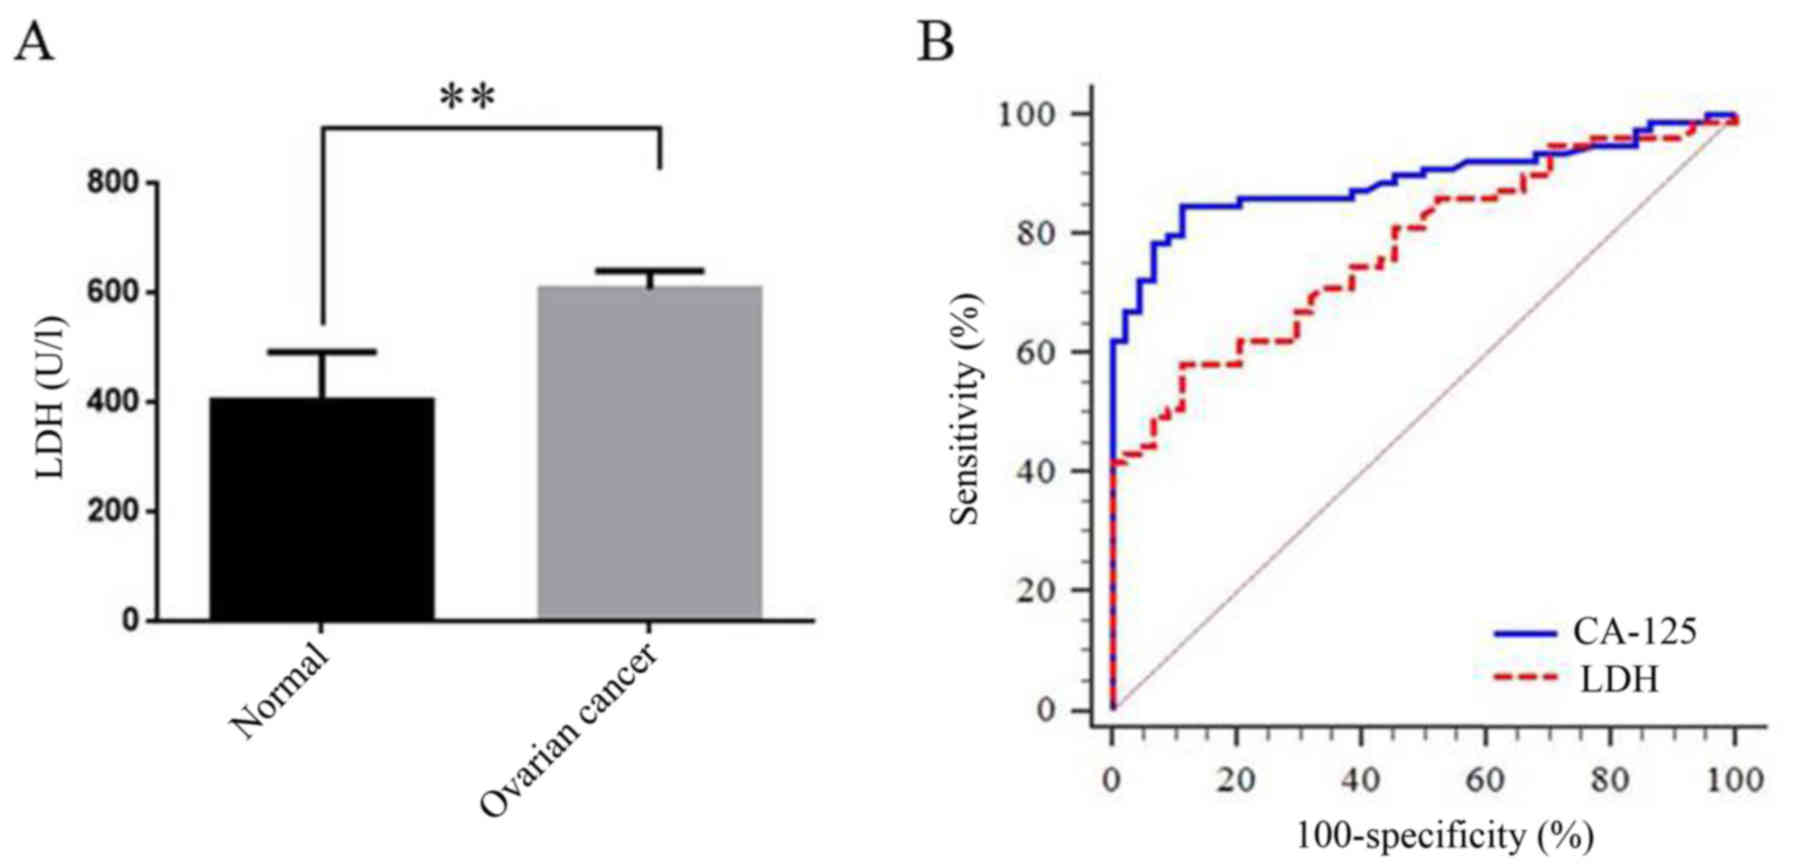
First, we compared the LDH level between normal and
these EOC patients. LDH was significantly increased in EOC patients
compared with the control (398.67±45.89 vs. 589.33±12.67,
P<0.001; Fig. 4A). We then drew
a ROC curve to investigate the role of LDH in diagnosis of EOC
(AUC=0.78, 95% CI: 0.70–0.86, P<0.001; Fig. 4B, Table VII). It revealed that the LDH
level could be a useful tool for EOC diagnosis, though the
diagnostic performance of LDH was still lower than CA125 (Table VII). In addition, we also observed
a statistically positive correlation between LDH and CA125, or LDH
and HE4, which still indicated an important role of LDH in EOC
diagnosis and prognosis (Table
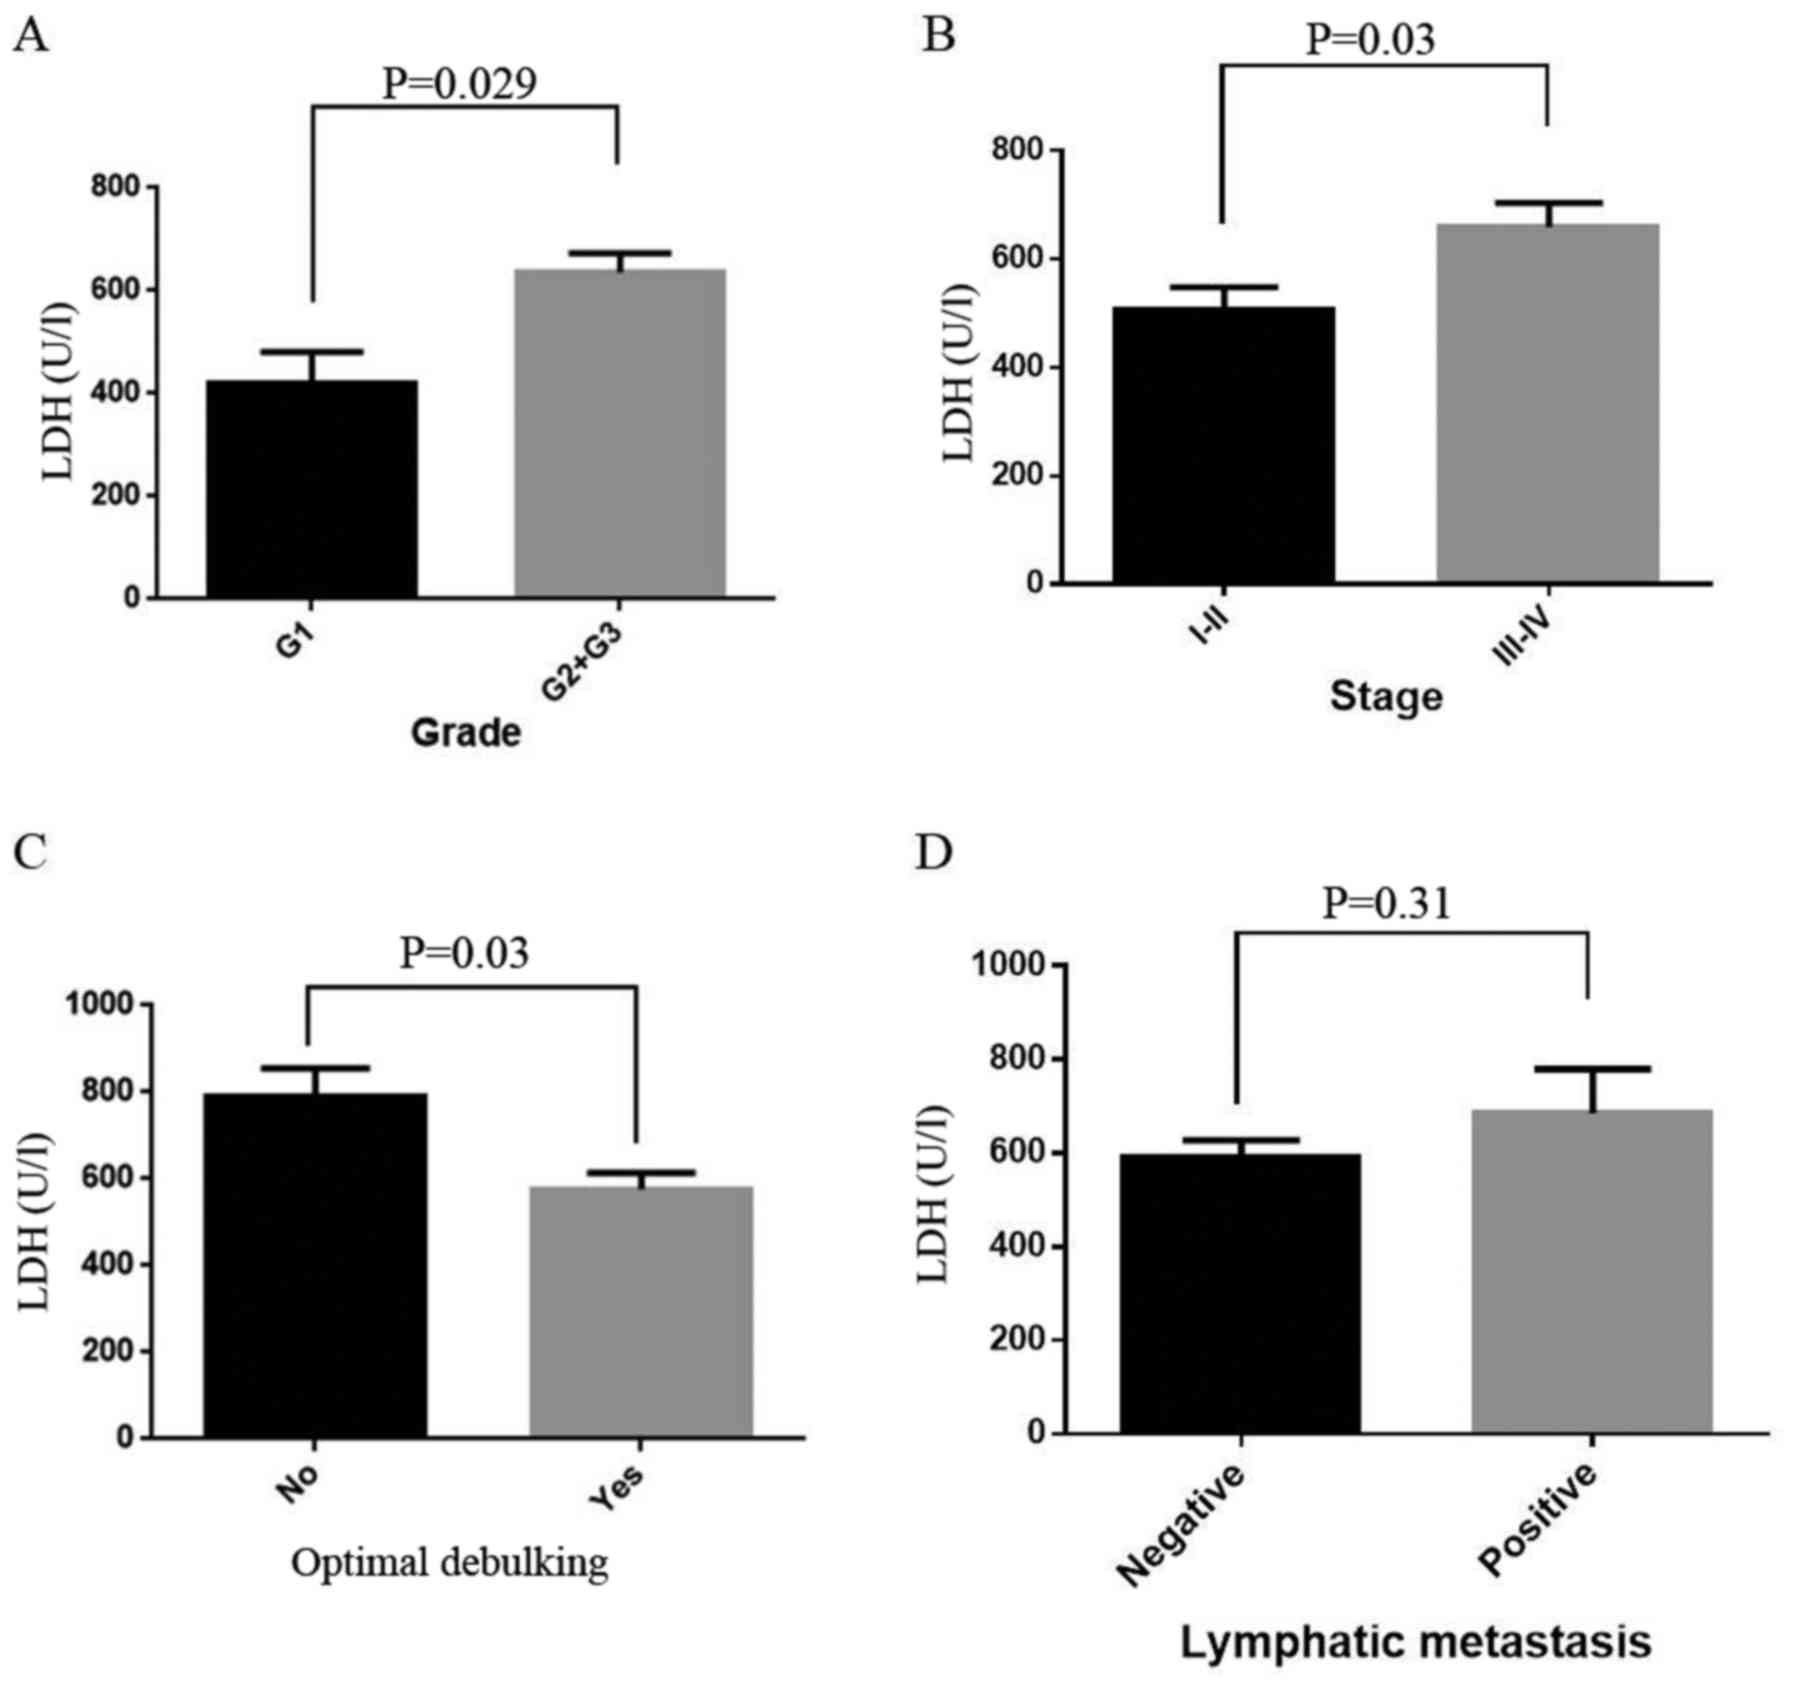
VIII). Last, we observed that in EOC patients, LDH was also
statistically increased in high grade, high stage and non-optimal
debulking (OD) cancer patients (P=0.029, 0.03 and 0.03,
respectively; Fig. 5A-C). However,
there was no difference between negative and positive lymphatic
metastasis patients (P=0.31, Fig.
5D). Further analysis revealed that LDH level was positively
correlated with stage and grade and negatively correlated with OD
and survival days (Table
VIII).
| Table VII.Sensitivity of LDH for the diagnosis
of EOC (vs. CA125). |
Table VII.
Sensitivity of LDH for the diagnosis
of EOC (vs. CA125).
|
| Area under the
curve (AUC) |
| Z statistic |
|---|
|
|
|
|
|
|---|
|
| n | Area | 95%CI | P-value | Z score | P-value |
|---|
| LDH | 133 | 0.78 | 0.70–0.86 | <0.001 | 2.59 | 0.01 |
| CA125 | 133 | 0.89 | 0.83–0.95 | <0.001 |
|
|
| Table VIII.Spearman's correlation analysis of
the LDH level and the related biochemical measurements. |
Table VIII.
Spearman's correlation analysis of
the LDH level and the related biochemical measurements.
|
| Stage | Grade | CA125 | HE4 | Lymphatic
metastasis | OD | Survival days |
|---|
| Correlation
coefficient | 0.27 | 0.32 | 0.37 | 0.35 | 0.11 | −0.39 | −0.34 |
| P-value | 0.014 | 0.04 | 0.01 | 0.04 | 0.34 | <0.001 | 0.011 |
| n | 133 | 133 | 133 | 133 | 133 | 133 | 133 |
Discussion
SATB1 is associated with poor
prognosis in ovarian cancer
Previous research has revealed that SATB1 is
upregulated in human cancer tissue samples compared with matched
non-cancerous adjacent tissues, and high expression of SATB1 is
associated with poor patient survival (28–30).
Our initial investigations also demonstrated that SATB1 regulated
gene expression via the acetylation pathway, and its high
expression was associated with a high metastasis rate and low
survival rate in EOC. SATB1 levels have been found to be
significantly associated with histological grade and poor survival
and have been described in low- and high-grade ovarian cancer
(25). In the present study, we
employed a transient siRNA-mediated knockdown strategy to avoid
possible adaptive processes upon constitutive knockdown or
overexpression. We further demonstrated that SATB1 upregulated
BRCA1 and BRCA2 expression in ovarian cancer (data not shown). Our
results demonstrated that knockdown of SATB1, a gene organizer,
significantly inhibited ovarian cancer cell proliferation in
vivo. These results were consistent with those from other
research.
SATB1 reprograms ovarian cancer energy
metabolism
In the present study, we revealed that SATB1, a
nuclear architectural protein that organizes chromatin structure
(31,32), plays an important role in
reprogramming the energy metabolism of ovarian cancer cells by
regulating the expression levels of LDH and MCT1. The present
findings demonstrated that stable knockdown of SATB1 expression
using siRNA inhibited ovarian cancer cell proliferation by
downregulating both LDH and MCT1 expression. Previous studies on
reducing expression also indicated that LDH is involved in tumor
initiation, but its regulation mechanism in tumors has not been
established. LDH converts pyruvate to lactate. Research has shown
that lactate, a glycolysis end-product, is a pleiotropic tumor
growth-promoting factor responsible for metabolic symbiosis in
tumors. The effect of lactate primarily depends on its uptake, a
process facilitated by the lactate-proton symporter MCT1. LDH and
MCT1 are often overexpressed in tumor cells and are associated with
high metastasis rates and poor prognosis (33). The relationship between SATB1 and
these metabolism enzymes in cancer proliferation and metastasis
have never been reported. In the present study, we found that SATB1
knockdown downregulated both LDH and MCT1 levels in ovarian cancer
cells. A SATB1/LDH regulation pathway may exist in EOC. SATB1
regulated LDH and then reprogramed ovarian cancer cell energy
metabolism and increased anaerobic glycolysis to promote ovarian
cancer metastasis.
LDH predicts poor prognosis of ovarian
cancer patients
LDH, the key enzyme in the anaerobic glycolysis
pathway, converts pyruvate to lactate in cancer cells and likely
other highly-proliferating cells. Therefore, a high LDH level is
commonly observed in cancer cells (34,35).
Approximately 90% of women with advanced ovarian cancer have
elevated levels of CA-125 in their blood serum, making CA-125 a
popular useful tool for detecting ovarian cancer. However, CA-125
has limited specificity for ovarian cancer since elevated CA-125
levels can be found in individuals without ovarian cancer (36).
Previously, we found that LDH promoted ovarian
cancer cell proliferation and metastasis, and high LDH expression
was associated with poor patient survival (37). LDH may be a promising molecular
predictor of EOC prognosis, providing an optional therapeutic
regimen for ovarian cancer. In other words, the combination of
CA-125 and LDH may be a promising factor, which warrants further
study. Similarly, in the present study, we observed that LDH was
significantly increased in EOC, and its expression level increased
with increasing clinical stage and histological grade. Higher LDH
expression was associated with a lower survival rate. A strong
point of this study is that it is the first to evaluate the
predictive value of LDH in ovarian cancer.
However, in the present study, we only presented the
phenomenon of LDH level differences in ovarian cancer, which
warrants further investigation. Therefore, further studies about
the mechanism of LDH regulation of ovarian cancer need to be
conducted in the future.
In conclusion, the present study was the first to
assess the predictive value of LDH in ovarian cancer. We
hypothesized that there may be a SATB1/LDH regulation pathway
involved in metabolic reprogramming in EOC. We found that stable
knockdown of SATB1 expression using siRNA inhibited ovarian cancer
cell proliferation by downregulating both LDH and MCT1 expression.
Additionally, we demonstrated that high LDH expression was
statistically and positively correlated with stage, pathological
grade, but negatively with OD. Therefore, LDH may be a clinically
reliable and useful indicator to accurately predict ovarian cancer
initiation and patient prognosis.
Acknowledgements
Not applicable.
Funding
The present study was supported from the National
Natural Science Foundation of China (no. 81001154 to YH), the
project of the Shanghai Rising-Star Program by Science and
Technology Commission of Shanghai Municipality (no. 11QA1405200, to
YH), the Shanghai Nature Science Foundation (no. 13ZR1459600 to
LZ), and the Shanghai Natural Science Foundation of China (no.
16ZR1427900 to YH).
Availability of data and materials
The datasets used during the present study are
available from the corresponding author upon reasonable
request.
Authors' contributions
YH designed the study. JX, SL and GZ contributed to
the conception of the study. JX, LZ, YZ, YS, ZZ and GZ contributed
to the drafting of the study. LZ, JZ and ZZ contributed to the
acquisition of the data. LZ, JZ and ZZ contributed to the analysis
of the data. YZ, YS and YH contributed to the interpretation of
data for the work. JX, LZ, JZ, SL and YH revised the study
critically for important intellectual content. All authors read and
approved the manuscript and agree to be accountable for all aspects
of the research in ensuring that the accuracy or integrity of any
part of the work are appropriately investigated and resolved.
Ethics approval and consent to
participate
The present study was reviewed and approved by the
Institutional Review Board and the Research Ethics Committee of
Shanghai General Hospital. All participants provided informed
consent to participate in the study.
Patient consent for publication
All participants provided informed consent to
participate in the study.
Competing interests
The authors declare that they have no competing
interests.
References
|
1
|
Siegel RL, Miller KD and Jemal A: Cancer
statistics, 2017. CA Cancer J Clin. 67:7–30. 2017. View Article : Google Scholar : PubMed/NCBI
|
|
2
|
Rossing MA, Wicklund KG, Cushing-Haugen KL
and Weiss NS: Predictive value of symptoms for early detection of
ovarian cancer. J Natl Cancer Inst. 102:222–229. 2010. View Article : Google Scholar : PubMed/NCBI
|
|
3
|
Vander Heiden MG, Cantley LC and Thompson
CB: Understanding the Warburg effect: The metabolic requirements of
cell proliferation. Science. 324:1029–1033. 2009. View Article : Google Scholar : PubMed/NCBI
|
|
4
|
Tennant DA, Durán RV and Gottlieb E:
Targeting metabolic transformation for cancer therapy. Nat Rev
Cancer. 10:267–277. 2010. View
Article : Google Scholar : PubMed/NCBI
|
|
5
|
Hui S, Ghergurovich JM, Morscher RJ, Jang
C, Teng X, Lu W, Esparza LA, Reya T, Le Zhan, Guo Yanxiang J, et
al: Glucose feeds the TCA cycle via circulating lactate. Nature.
551:115–118. 2017. View Article : Google Scholar : PubMed/NCBI
|
|
6
|
DeBerardinis RJ and Chandel NS:
Fundamentals of cancer metabolism. Sci Adv. 2:e16002002016.
View Article : Google Scholar : PubMed/NCBI
|
|
7
|
Hirschhaeuser F, Sattler UG and
Mueller-Klieser W: Lactate: A metabolic key player in cancer.
Cancer Res. 71:6921–6925. 2011. View Article : Google Scholar : PubMed/NCBI
|
|
8
|
Doherty JR and Cleveland JL: Targeting
lactate metabolism for cancer therapeutics. J Clin Invest.
123:3685–3692. 2013. View
Article : Google Scholar : PubMed/NCBI
|
|
9
|
Lu H, Li X, Luo Z, Liu J and Fan Z:
Cetuximab reverses the Warburg effect by inhibiting HIF-1-regulated
LDH-A. Mol Cancer Ther. 12:2187–2199. 2013. View Article : Google Scholar : PubMed/NCBI
|
|
10
|
Zhao D, Xiong Y, Lei QY and Guan KL: LDH-A
acetylation: Implication in cancer. Oncotarget. 4:802–803. 2013.
View Article : Google Scholar : PubMed/NCBI
|
|
11
|
Zhang Y, Zhang X, Wang X, Gan L, Yu G,
Chen Y, Liu K, Li P, Pan J, Wang J, et al: Inhibition of LDH-A by
lentivirus-mediated small interfering RNA suppresses
intestinal-type gastric cancer tumorigenicity through the
downregulation of Oct4. Cancer Lett. 321:45–54. 2012. View Article : Google Scholar : PubMed/NCBI
|
|
12
|
Romero-Garcia S, Moreno-Altamirano MM,
Prado-Garcia H and Sánchez-García FJ: Lactate contribution to the
tumor microenvironment: Mechanisms, effects on immune cells and
therapeutic relevance. Front Immunol. 7:522016. View Article : Google Scholar : PubMed/NCBI
|
|
13
|
Zhou S, Liu R, Yuan K, Yi T, Zhao X, Huang
C and Wei Y: Proteomics analysis of tumor microenvironment:
Implications of metabolic and oxidative stresses in tumorigenesis.
Mass Spectrom Rev. 32:267–311. 2013. View Article : Google Scholar : PubMed/NCBI
|
|
14
|
Martinez-Outschoorn U, Sotgia F and
Lisanti MP: Tumor microenvironment and metabolic synergy in breast
cancers: Critical importance of mitochondrial fuels and function.
Semin Oncol. 41:195–216. 2014. View Article : Google Scholar : PubMed/NCBI
|
|
15
|
Justus CR, Sanderlin EJ and Yang LV:
Molecular connections between cancer cell metabolism and the tumor
microenvironment. Int J Mol Sci. 16:11055–11086. 2015. View Article : Google Scholar : PubMed/NCBI
|
|
16
|
Miranda-Gonçalves V, Granja S, Martinho O,
Honavar M, Pojo M, Costa BM, Pires MM, Pinheiro C, Cordeiro M,
Bebiano G, et al: Hypoxia-mediated upregulation of MCT1 expression
supports the glycolytic phenotype of glioblastomas. Oncotarget.
7:46335–46353. 2016. View Article : Google Scholar : PubMed/NCBI
|
|
17
|
Lamb R, Harrison H, Hulit J, Smith DL,
Lisanti MP and Sotgia F: Mitochondria as new therapeutic targets
for eradicating cancer stem cells: Quantitative proteomics and
functional validation via MCT1/2 inhibition. Oncotarget.
5:11029–11037. 2014. View Article : Google Scholar : PubMed/NCBI
|
|
18
|
Diehl K, Dinges LA, Helm O, Ammar N,
Plundrich D, Arlt A, Röcken C, Sebens S and Schäfer H: Nuclear
factor E2-related factor-2 has a differential impact on MCT1 and
MCT4 lactate carrier expression in colonic epithelial cells: A
condition favoring metabolic symbiosis between colorectal cancer
and stromal cells. Oncogene. 37:39–51. 2018. View Article : Google Scholar : PubMed/NCBI
|
|
19
|
Hong CS, Graham NA, Gu W, Camacho
Espindola C, Mah V, Maresh EL, Alavi M, Bagryanova L, Krotee PA,
Gardner BK, et al: MCT1 modulates cancer cell pyruvate export and
growth of tumors that co-express MCT1 and MCT4. Cell Rep.
14:1590–1601. 2016. View Article : Google Scholar : PubMed/NCBI
|
|
20
|
Doherty JR, Yang C, Scott KE, Cameron MD,
Fallahi M, Li W, Hall MA, Amelio AL, Mishra JK, Li F, et al:
Blocking lactate export by inhibiting the Myc target MCT1 disables
glycolysis and glutathione synthesis. Cancer Res. 74:908–920. 2014.
View Article : Google Scholar : PubMed/NCBI
|
|
21
|
Halestrap AP and Wilson MC: The
monocarboxylate transporter family-role and regulation. IUBMB Life.
64:109–119. 2012. View
Article : Google Scholar : PubMed/NCBI
|
|
22
|
Kakugawa K, Kojo S, Tanaka H, Seo W, Endo
TA, Kitagawa Y, Muroi S, Tenno M, Yasmin N, Kohwi Y, et al:
Essential roles of SATB1 in specifying T lymphocyte subsets. Cell
Rep. 19:1176–1188. 2017. View Article : Google Scholar : PubMed/NCBI
|
|
23
|
Song G, Liu K, Yang X, Mu B, Yang J, He L,
Hu X, Li Q, Zhao Y5, Cai X and Feng G: SATB1 plays an oncogenic
role in esophageal cancer by up-regulation of FN1 and PDGFRB.
Oncotarget. 8:17771–17784. 2017.PubMed/NCBI
|
|
24
|
Wang Y, Gu X, Zhang G, Wang L, Wang T,
Zhao Y, Zhang X, Zhou Y, Kadin M and Tu P: SATB1 overexpression
promotes malignant T-cell proliferation in cutaneous
CD30+ lymphoproliferative disease by repressing p21.
Blood. 123:3452–3461. 2014. View Article : Google Scholar : PubMed/NCBI
|
|
25
|
Xiang J, Zhou L, Li S, Xi X, Zhang J, Wang
Y, Yang Y, Liu X and Wan X: AT-rich sequence binding protein 1:
Contribution to tumor progression and metastasis of human ovarian
carcinoma. Oncol Lett. 3:865–870. 2012.PubMed/NCBI
|
|
26
|
Schulze D, Plohmann P, Höbel S and Aigner
A: Anti-tumor effects of fibroblast growth factor-binding protein
(FGF-BP) knockdown in colon carcinoma. Mol Cancer. 10:1442011.
View Article : Google Scholar : PubMed/NCBI
|
|
27
|
Livak KJ and Schmittgen TD: Analysis of
relative gene expression data using real-time quantitative PCR and
the 2−ΔΔCT method. Methods. 25:402–408. 2001.
View Article : Google Scholar : PubMed/NCBI
|
|
28
|
Stephen TL, Payne KK, Chaurio RA,
Allegrezza MJ, Zhu H, Perez-Sanz J, Perales-Puchalt A, Nguyen JM,
Vara-Ailor AE, Eruslanov EB, et al: SATB1 expression governs
epigenetic repression of PD-1 in tumor-reactive T cells. Immunity.
46:51–64. 2017. View Article : Google Scholar : PubMed/NCBI
|
|
29
|
Brocato J and Costa M: SATB1 and 2 in
colorectal cancer. Carcinogenesis. 36:186–191. 2015. View Article : Google Scholar : PubMed/NCBI
|
|
30
|
Mir R, Pradhan SJ, Patil P, Mulherkar R
and Galande S: Wnt/β-catenin signaling regulated SATB1 promotes
colorectal cancer tumorigenesis and progression. Oncogene.
35:1679–1691. 2016. View Article : Google Scholar : PubMed/NCBI
|
|
31
|
Frömberg A, Rabe M, Oppermann H, Gaunitz F
and Aigner A: Analysis of cellular and molecular antitumor effects
upon inhibition of SATB1 in glioblastoma cells. BMC Cancer.
17:32017. View Article : Google Scholar : PubMed/NCBI
|
|
32
|
Xiao T, Fu L and Jie Z: SATB1
overexpression correlates with gastrointestinal neoplasms invasion
and metastasis: A meta-analysis for Chinese population. Oncotarget.
8:48282–48290. 2017. View Article : Google Scholar : PubMed/NCBI
|
|
33
|
Justus CR, Sanderlin EJ and Yang LV:
Molecular connections between cancer cell metabolism and the tumor
microenvironment. Int J Mol Sci. 16:11055–11086. 2015. View Article : Google Scholar : PubMed/NCBI
|
|
34
|
Yang Y, Su D, Zhao L, Zhang D, Xu J, Wan
J, Fan S and Chen M: Different effects of LDH-A inhibition by
oxamate in non-small cell lung cancer cells. Oncotarget.
5:11886–11896. 2014. View Article : Google Scholar : PubMed/NCBI
|
|
35
|
Liu L, He Y, Ge G, Li L, Zhou P, Zhu Y,
Tang H, Huang Y, Li W and Zhang L: Lactate dehydrogenase and
creatine kinase as poor prognostic factors in lung cancer: A
retrospective observational study. PLoS One. 12:e01821682017.
View Article : Google Scholar : PubMed/NCBI
|
|
36
|
Goff BA, Agnew K, Neradilek MB, Gray HJ,
Liao JB and Urban RR: Combining a symptom index, CA125 and HE4
(triple screen) to detect ovarian cancer in women with a pelvic
mass. Gynecol Oncol. 147:291–295. 2017. View Article : Google Scholar : PubMed/NCBI
|
|
37
|
Xiang J, Zhou L, Li X, Bao W, Chen T, Xi
X, He Y and Wan X: Preoperative monocyte-to-lymphocyte ratio in
peripheral blood predicts stages, metastasis, and histological
grades in patients with ovarian cancer. Transl Oncol. 10:33–39.
2017. View Article : Google Scholar : PubMed/NCBI
|