Introduction
Oral squamous cell carcinoma (OSCC), the most
prevalent type of SCC of the head and neck (HNSCC), typically
behaves in an aggressive manner, frequently leading to local
invasion and early lymph node metastasis (1). In addition, ~60% of head and neck
cancer cases are diagnosed with advanced stage disease with a high
lethality rate (2). Despite
improvements in the treatment of OSCC, including surgery,
radiotherapy and chemotherapy, its survival has not markedly
improved and OSCC remains a life-threatening illness with a poor
prognosis due to frequent development of local-regional recurrence
or/and distant organ metastasis (3). It would be of great value to find
useful biomarkers and prognostic molecular signatures to aid in the
development of novel therapeutic strategies or chemopreventive
agents.
DNA methylation serves an important role in cancer
initiation, progression and metastasis, partially by
transcriptional silencing of tumor suppressor genes (TSGs)
(4). Khor et al (5) demonstrated 33 promoter hypermethylated
genes such as dimethylarginine dimethylaminohydrolase 2 and dual
specificity phosphatase 1 that were significantly silenced in OSCC,
which may be used as hypermethylated-based biomarkers. Basu et
al (6) reported a unique set of
differentially methylated immune genes in OSCC patients.
Furthermore, Clausen et al (7) revealed that WNT1 inducible signaling
pathway protein 1 hypomethylation contributed to lymph node
metastasis in OSCC. Although previous studies have reported that
the methylation of certain genes is associated with the
pathogenesis of OSCC, the methylation of genes that have relevance
to OSCC progression is not clearly documented.
High throughput genome-wide methylation studies
offer novel ways to understand the significance of DNA methylation
and its impact on gene regulation (8–10).
Numerous studies have used the integration of DNA methylation data
and gene expression data for identifying novel epigenetically
deregulated genes involved in cancer development/progression
(11,12). Li et al (13) identified several biomarkers for the
early detection of buccal OSCC using the Illumina GoldenGate
Methylation Cancer Panel. In the present study, comprehensive
analyses of transcriptome microarray and methylation microarray
data downloaded from a public database were performed.
Differentially expressed genes (DEGs) and differentially methylated
genes (DMGs) in OSCC samples were identified, and functional
enrichment analysis was performed for overlapping genes between
DEGs and DMGs to investigate their potential roles in OSCC
progression. Survival analysis of the overlapping genes was
performed to screen genes with prognostic significance in OSCC.
This systematic approach should provide novel insights into the
understanding of mechanisms underlying DNA methylation regulation
associated with OSCC pathogenesis and progression, and contribute
to the development of prognostic markers with potential clinical
significance in OSCC treatment.
Materials and methods
Gene expression and DNA methylation
datasets
The Gene Expression Omnibus (GEO; http://www.ncbi.nlm.nih.gov/geo/) is a gene
expression/molecular abundance repository from the National Center
for Biotechnology Information that archives and freely distributes
microarray, next-generation sequencing and other functional
genomics data submitted by the scientific community. In the present
study, DNA methylation data from the study by Pickering et
al (15) was retrieved from the
GEO database with accession number GSE41114; this dataset includes
data from 42 OSCC tumor samples and 4 normal control samples. The
available clinical factors are provided in Table I. The β-value that estimates a ratio
of DNA methylation signal intensity to the sum of the methylated
and unmethylated intensities at each position was detected based on
the GPL13534 Illumina HumanMethylation 450 BeadChip platform
(Illumina, Inc., San Diego, CA, USA). Additionally, gene expression
data from tumor tissues and adjacent non-tumor tissues from 6
clinical OSCC patients was downloaded from the GEO database with
accession number GSE74530 (16).
The platform of GPL570 [HG-U133_Plus_2] Affymetrix Human Genome
U133 Plus 2.0 Array (Affymetrix; Thermo Fisher Scientific, Inc.,
Waltham, MA, USA) was used for the quantification of transcriptome
expression profiles.
 | Table I.Clinical factors of samples in the
DNA methylation dataset. |
Table I.
Clinical factors of samples in the
DNA methylation dataset.
| Sample ID | Sex | Site |
|---|
| GSM1008735 | Male | Tongue |
| GSM1008736 | Male | Tongue |
| GSM1008737 | Female | Tongue |
| GSM1008738 | Male | Tongue |
| GSM1008739 | Male | Tongue |
| GSM1008740 | Female | Tongue |
| GSM1008741 | Male | Tongue |
| GSM1008742 | Male | Tongue |
| GSM1008743 | Male | Tongue |
| GSM1008744 | Male | Tongue |
| GSM1008745 | Male | Tongue |
| GSM1008746 | Female | Tongue |
| GSM1008747 | Female | Tongue |
| GSM1008748 | Female | Tongue |
| GSM1008749 | Male | Tongue |
| GSM1008750 | Male | Tongue |
| GSM1008751 | Male | Tongue |
| GSM1008752 | Male | Tongue |
| GSM1008753 | Male | Tongue |
| GSM1008754 | Male | Tongue |
| GSM1008755 | Female | Tongue |
| GSM1008756 | Male | FOM |
| GSM1008757 | Male | Tongue |
| GSM1008758 | Female | FOM |
| GSM1008759 | Male | FOM |
| GSM1008760 | Male | Tongue |
| GSM1008761 | Male | FOM |
| GSM1008762 | Female | Tongue |
| GSM1008763 | Female | Tongue |
| GSM1008764 | Female | Tongue |
| GSM1008765 | Male | Tongue |
| GSM1008766 | Female | FOM |
| GSM1008767 | Female | Tongue |
| GSM1008768 | Male | Buccal cavity |
| GSM1008769 | Male | FOM |
| GSM1008770 | Male | Alveolus |
| GSM1008771 | Male | FOM |
| GSM1008772 | Male | Tongue |
| GSM1008773 | Male | FOM |
| GSM1008774 | Male | Buccal cavity |
| GSM1008775 | Male | Alveolus |
| GSM1008776 | Male | Tongue |
| GSM1008777 | Male | Tongue |
| GSM1008778 | Male | Tongue |
| GSM1008779 | NA | Blood |
| GSM1008780 | NA | Blood |
Assessment of genome-wide DNA
methylation levels
The downloaded methylation data was preprocessed
using the Illumina Methylation Analyzer (IMA) package in R
(http://ima.r-forge.r-project.org/),
which was designed to automate the pipeline for analyzing site
(methylation locus)-level and region (all loci in a gene)-level
methylation changes in epigenetic studies. Methylation sites with
P-values >0.05 in >75% of the samples were filtered out, and
samples with P-values >1×10⁻⁵ at >75% of CpG sites
were excluded from the analysis. Limma method (http://www.bioconductor.org/packages/release/bioc/html/limma.html)
in IMA was used to identify differentially methylated CpG (dmCpG)
sites with the cut-off points of |∆β| >0.2 and a Benjamini and
Hochberg (BH)-corrected P-value (PBH) <0.05 (17). OmicCircos is an R software package
for generating high-quality circular plots and illustrates genomic
data analyses. In the present study, OmicCircos was used to
visualize the heatmap of the top 1,000 dmCpG sites.
Differential gene expression
analysis
Raw data was normalized using RMA in the
Bioconductor R package Affy (14).
Probe annotations were obtained by using the Bioconductor
hgu133plus2.db package and Limma package was used for the
identification of DEGs. |log2fold change (FC)| >1.5
and adjusted P-value <0.05 [corrected by BH method (17)] were chosen as the threshold values
for the DEGs. The heatmap of these DEGs was visualized with the
OmicCircos package.
Association of DNA methylation and
mRNA expression
The overlapping genes between DEGs and DMGs (genes
containing dmCpG sites) were abbreviated as OSCC genes, which may
be more relevant to OSCC than using DEGs or DMGs alone. In this
study, further functional analysis was performed on this set of
genes.
Functional enrichment analyses
Gene ontology (GO) enrichment analysis of OSCC genes
was performed using the bioinformatics analysis tool WebGestalt
(http://www.webgestalt.org/), and the GO
biological process (BP) terms were identified. P-value adjustment
was performed by BH multiple testing correction (17) and enrichment was considered
significant only if PBH<0.05. To investigate and
understand the interactions among significantly enriched GO BP
terms, cross-talk analysis of GO BP terms was conducted. A
Cytoscape plug-in, EnrichmentMap (18), was used for the visualization of the
GO BP enrichment map. GO BP terms were connected according to genes
that overlapped and were grouped by functional similarity.
Kyoto Encyclopedia of Genes and Genomes (KEGG)
pathway (19) enrichment analysis
of OSCC genes was performed using the bioinformatics analysis tool
KOBAS 3.0 (http://kobas.cbi.pku.edu.cn/index.php) (20) with the criterion of
PBH<0.05.
Survival analysis of OSCC genes
Survival analysis of OSCC genes was performed using
a novel and powerful web-based tool, Gene Expression Profiling
Interactive Analysis (http://gepia.cancer-pku.cn/), which is based on The
Cancer Genome Atlas (TCGA; http://cancergenome.nih.gov/) and Genotype-Tissue
Expression data (http://commonfund.nih.gov/GTEx/). The associated
disease ‘HNSCC’ was selected (OSCC was categorized into HNSCC in
TCGA). The other parameters were set as the default.
Reverse transcription-quantitative
polymerase chain reaction (RT-qPCR)
OSCC SCC25 and human normal oral epithelial HIOEC
cell lines were purchased from the American Type Culture Collection
(ATCC; Manassas, VA, USA) and cultured in RPMI-1640 (Sigma-Aldrich;
Merck KGaA, Darmstadt, Germany) at 37°C in 5% CO2, and
supplemented with 10% FBS (PAA Laboratories GmbH, Cölbe, Germany)
and 20 mM HEPES (Sigma-Aldrich; Merck KGaA). For RT-qPCR analysis,
the total RNA of the SCC25 and HIOEC cells was isolated with TRIzol
reagent (Invitrogen; Thermo Fisher Scientific, Inc.). The cDNA was
synthesized by Transcriptor First strand cDNA Synthesis kit (Roche
Diagnostics, Basel, Switzerland) using random primers and subjected
to PCR amplification using rTaq polymerase (Takara Bio, Inc.,
Shiga, Japan). For each target gene, the PCR mixtures (Applied
Biosystems; Thermo Fisher Scientific, Inc.) containing 2 µl of the
diluted cDNA were prepared in a final volume of 20 µl. The PCR was
performed with a total volume of 20 ml reaction mixture using
FastStart Universal SYBR Green Master kit (Roche Diagnostics). qPCR
assays were conducted in polypropylene 96-well plates on an ABI
Prism 7000 sequence detection system (Applied Biosystems; Thermo
Fisher Scientific, Inc.). Non-template controls were used to detect
non-specific amplification. The quantitation cycle (Cq) value of
each target product was determined and ΔCq between target and
endogenous control was calculated. The difference in ΔCq values of
the 2 groups (ΔΔCq) was used to calculate the fold increase
(F=2−ΔΔCq) (21) and to
determine the changes in target gene expression between control and
sample groups. β-actin was used as the control gene. The primer
pairs used for amplification are shown in Table II. GraphPad Prism Version 5.0
software for windows (GraphPad Software Inc., La Jolla, CA, USA)
was used for statistical analysis.
| Table II.Primer sequences for reverse
transcription-quantitative polymerase chain reaction. |
Table II.
Primer sequences for reverse
transcription-quantitative polymerase chain reaction.
| Genes | Forward primer
(5′-3′) | Reverse primer
(5′-3′) | Product length,
bp | Temperature,
°C |
|---|
| FAP |
ATGAGCTTCCTCGTCCAATTCA |
AGACCACCAGAGAGCATATTTTG | 215 | 58 |
| IFI27 |
TGCTCTCACCTCATCAGCAGT |
CACAACTCCTCCAATCACAACT | 115 | 60 |
| LAMC2 |
GACAAACTGGTAATGGATTCCGC |
GACAAACTGGTAATGGATTCCGC | 98 | 60 |
| MMP1 |
AAAATTACACGCCAGATTTGCC |
GGTGTGACATTACTCCAGAGTTG | 82 | 58 |
| SPINK5 |
ATAGCCACAGTGTCAGTGCTT |
TGTTGCGTAAGGCTTGTGTTC | 202 | 58 |
| ZNF662 |
CAAACCTGATTCGTCACCAGA |
TGTTGCGTAAGGCTTGTGTTC | 100 | 60 |
| ACTB |
AGCGAGCATCCCCCAAAGTT |
GGGCACGAAGGCTCATCATT | 285 | 60 |
Statistical analysis
All statistical analyses in this study were
conducted based on R 3.4.3 (https://www.r-project.org/) and GraphPad Prism 5.0
(https://www.graphpad.com/scientific-software/prism/).
|Log2FC|>1.5 and |∆β|>0.2 with an adjusted P-value of
<0.05 was applied for screening of the DEGs and dmCpGs,
respectively. Data analysis was performed by one-way analysis of
variance followed by Tukey's test for multiple group comparisons,
and Student's t-test was used for pairwise comparisons. The
Kaplan-Meier method was used for patient survival estimations and
the log-rank test was used for survival comparisons between
different groups. P<0.05 was used to indicate a statistically
significant difference.
Results
DNA methylation profile analysis
between OSCC samples and control samples
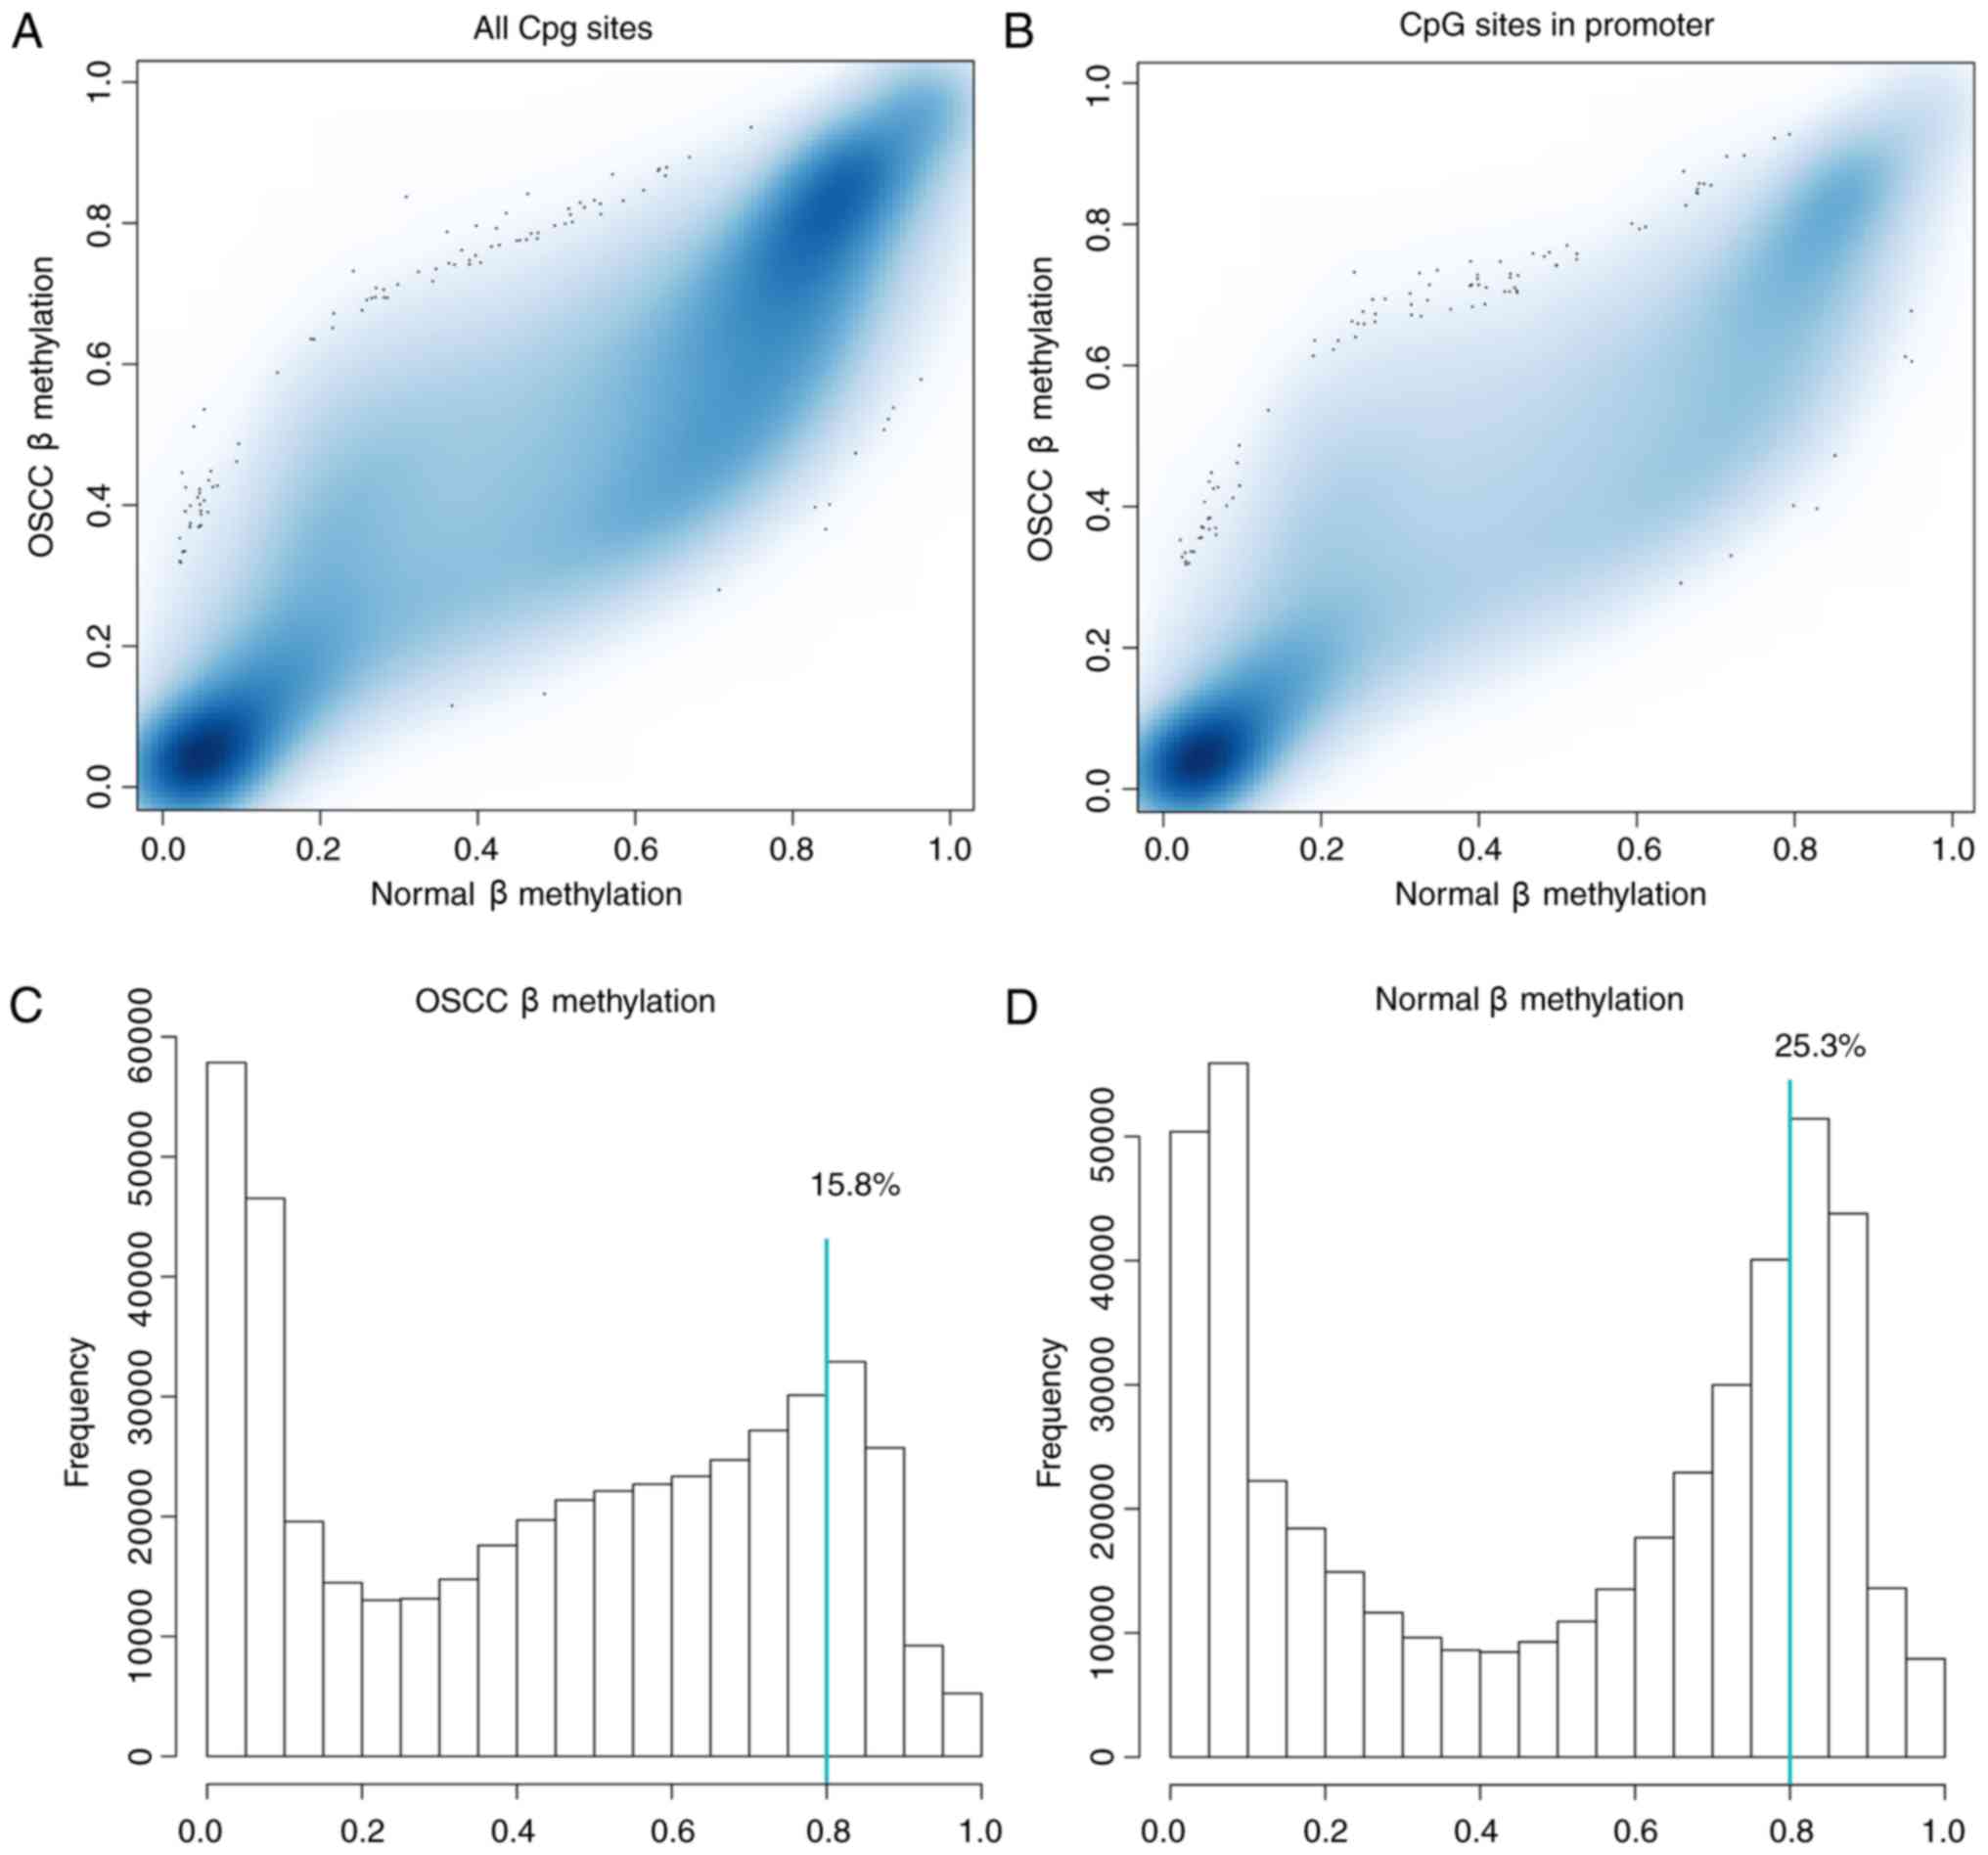
Subsequent to data preprocessing for all samples,
461,304 out of the original 485,577 CpG sites (95.0%) were
retained, which were located in different regions, including that
within 1,500 bps of a transcription start site (TSS1500), within
200 bp of the TSS (TSS200), the 5′-untranslated region (UTR), the
first exon, the body, the 3′UTR, the island, the N shelf, the N
shore and the S shelf. β-values of the 461,304 CpG sites are
presented in Fig. 1A. It was found
that the global methylation level of CpG sites in the normal
control samples was higher compared with those in the OSCC samples.
Additionally, the regions at close proximity to the promoter
(TSS200) and 1,500 bp upstream of the promoter (TSS1500) were
designated as the promoter region. A total of 140,003 CpG sites
were found in the promoter region (Fig.
1B) and the level of methylation at the CpG sites in the
promoter region showed a higher level in the OSCC group than that
in the control samples. Of those 461,304 CpG sites, 15.8% CpG sites
had β-value >0.8 in the OSCC samples (Fig. 1C), and 25.3% CpG sites were
hypermethylated (β-value >0.8) in the normal control samples
(Fig. 1D).
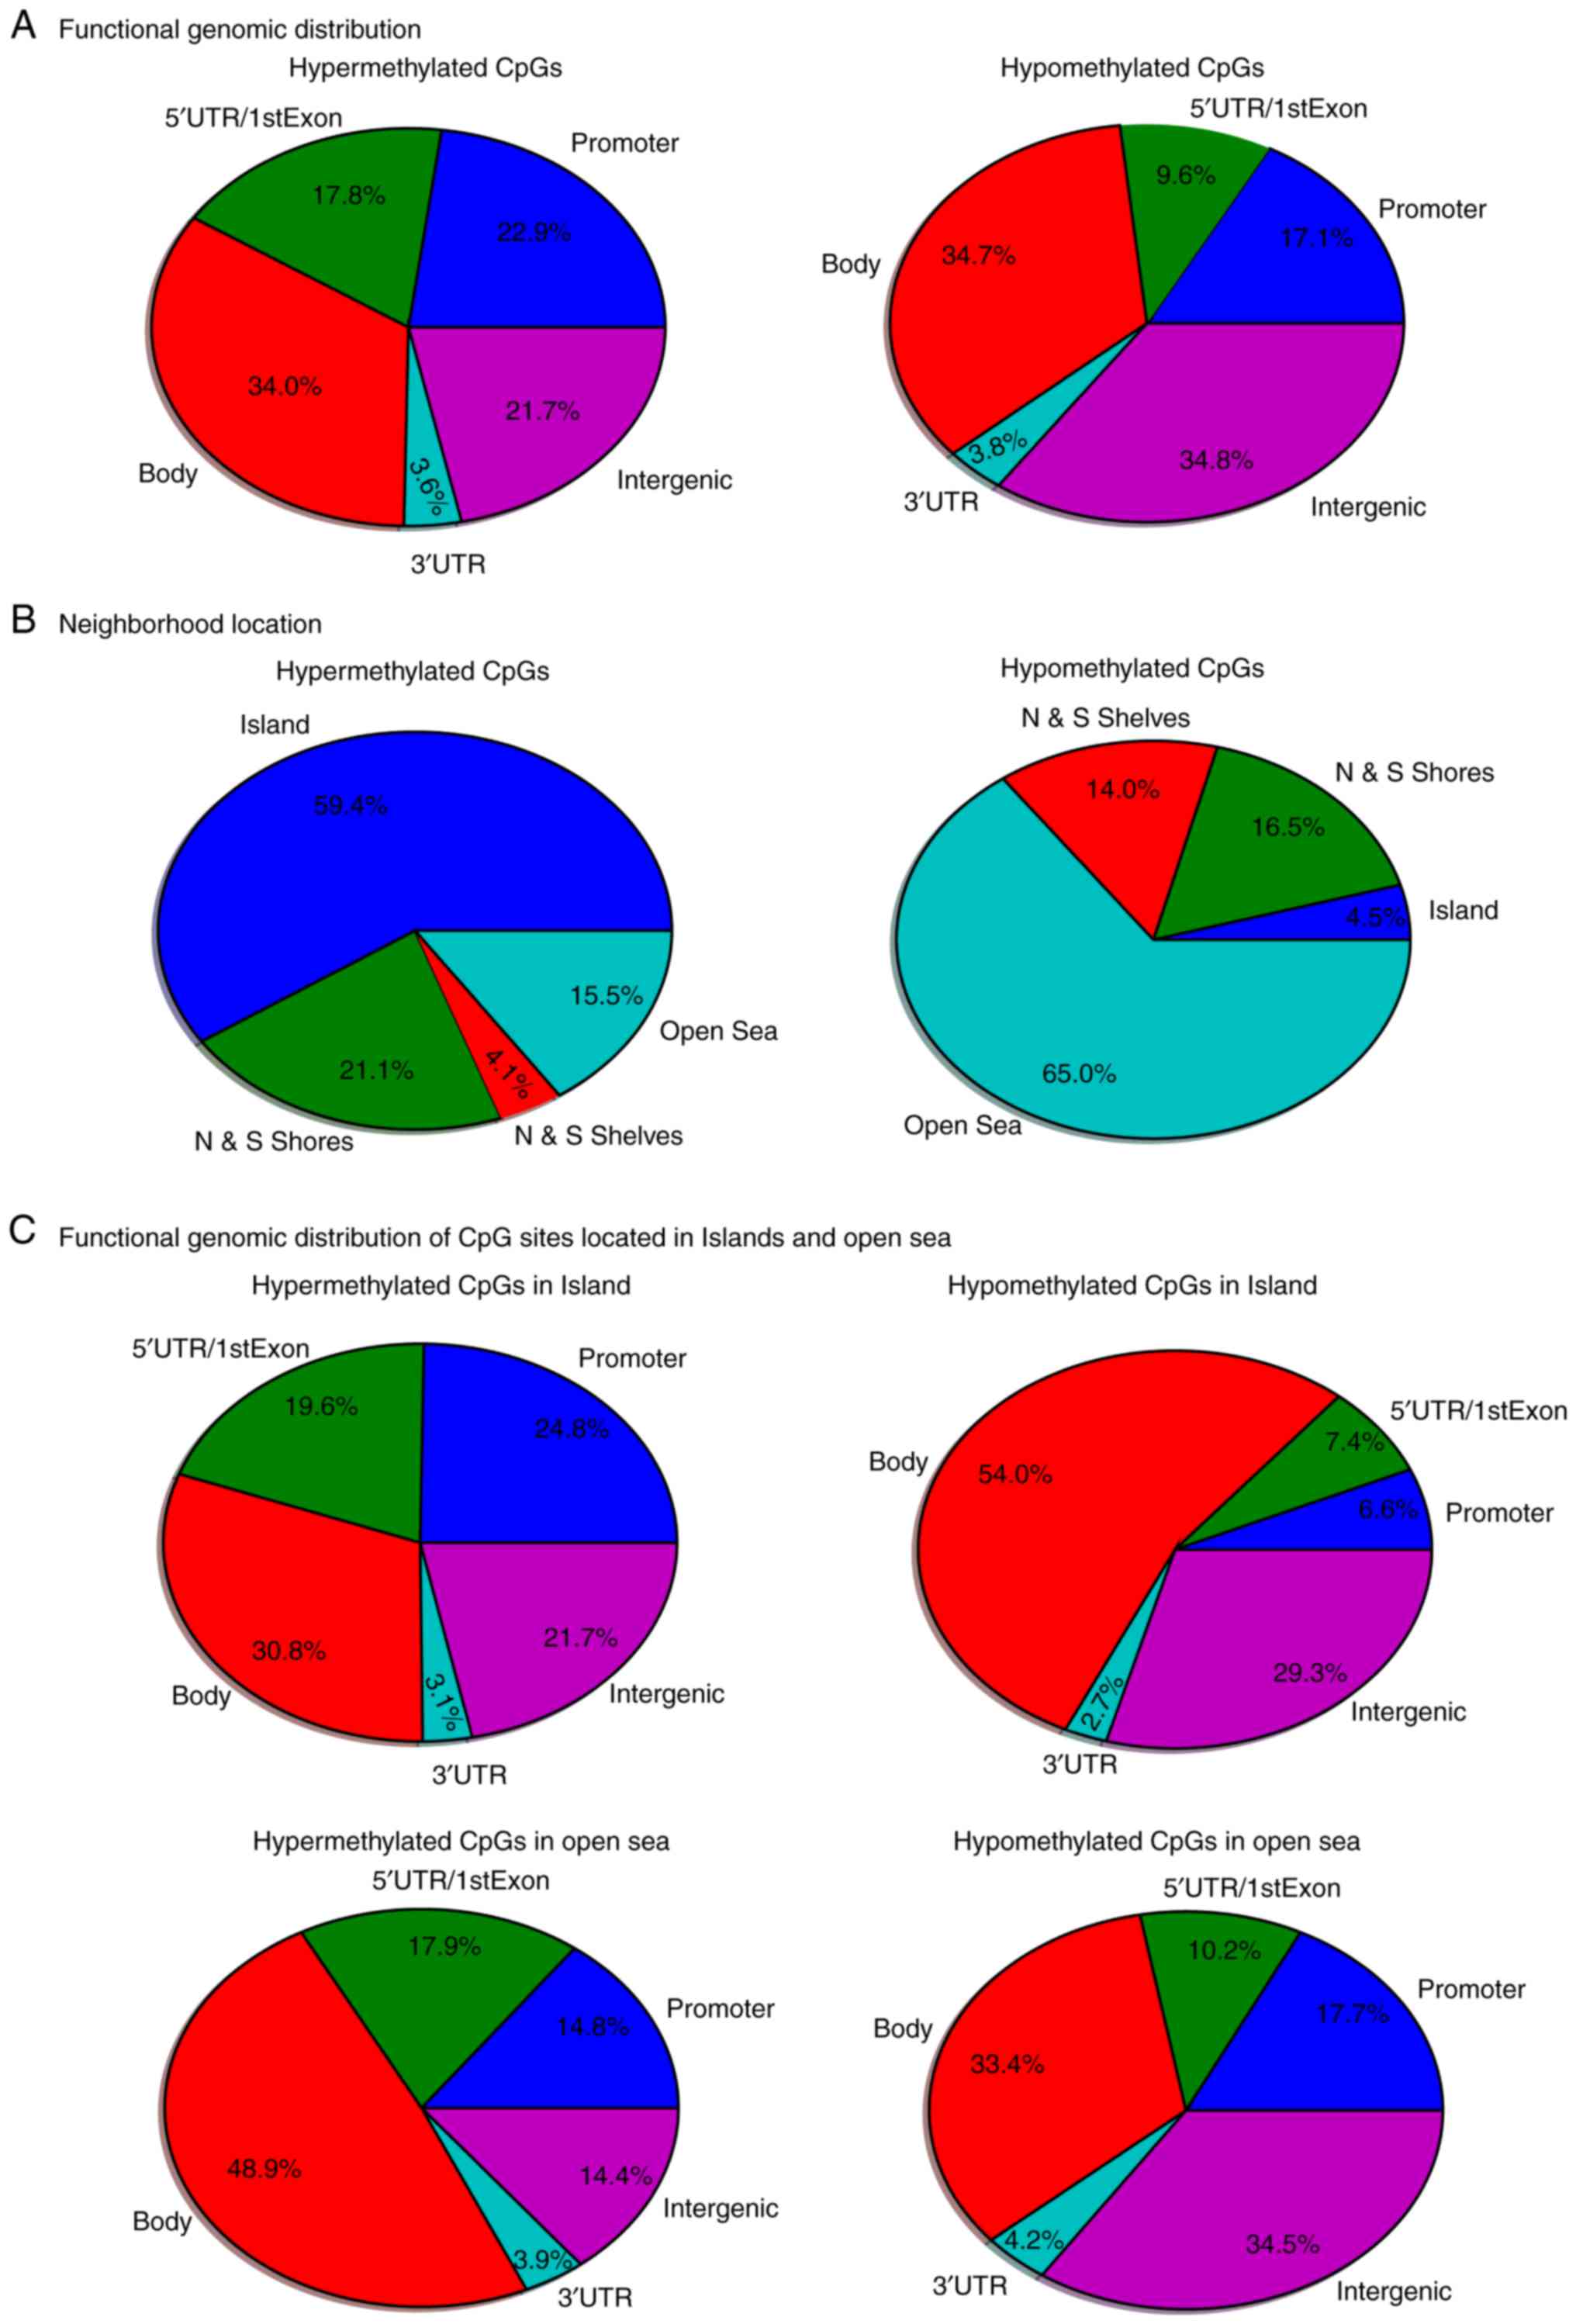
Identification of dmCpG sites
In the comparison of DNA methylation between the
OSCC group and the control group, 40,115 dmCpGs were observed to
reach a liberal significance threshold of methylation difference of
at least 20% (|Δβ|>0.2) and PBH<0.05. These 40,115
dmCpGs covered 3,360 genes, i.e., DMGs. In addition, 6,736 dmCpGs
were hypermethylated and 33,379 were hypomethylated in the OSCC
tissue samples. The functional genomic distribution of the dmCpG
sites in the OSCC samples is shown in Fig. 2A. CpG sites in the promoter, gene
body and intergenic regions were generally highly hypermethylated
or hypomethylated. The neighborhood locations of all dmCpG sites
are shown in Fig. 2B; 59.4% of the
hypermethylated CpG sites were in the island and 65.0% of the
hypomethylated CpG sites were in the open sea (located >4 kb
from a CpG island), whereas only 4.5% hypomethylated CpG sites were
in the island and 15.5% of the hypermethylated CpG sites were in
the open sea. This result prompted the comparison of the functional
genomic distribution of the dmCpG sites in islands and open sea
(Fig. 2C). Among the 6,736
hypermethylated CpG sites, 4,001 CpG sites were located in the
island and 1,044 CpG sites in the open sea. Among the 33,379
hypomethylated CpG sites, 1,487 CpG sites were located in the
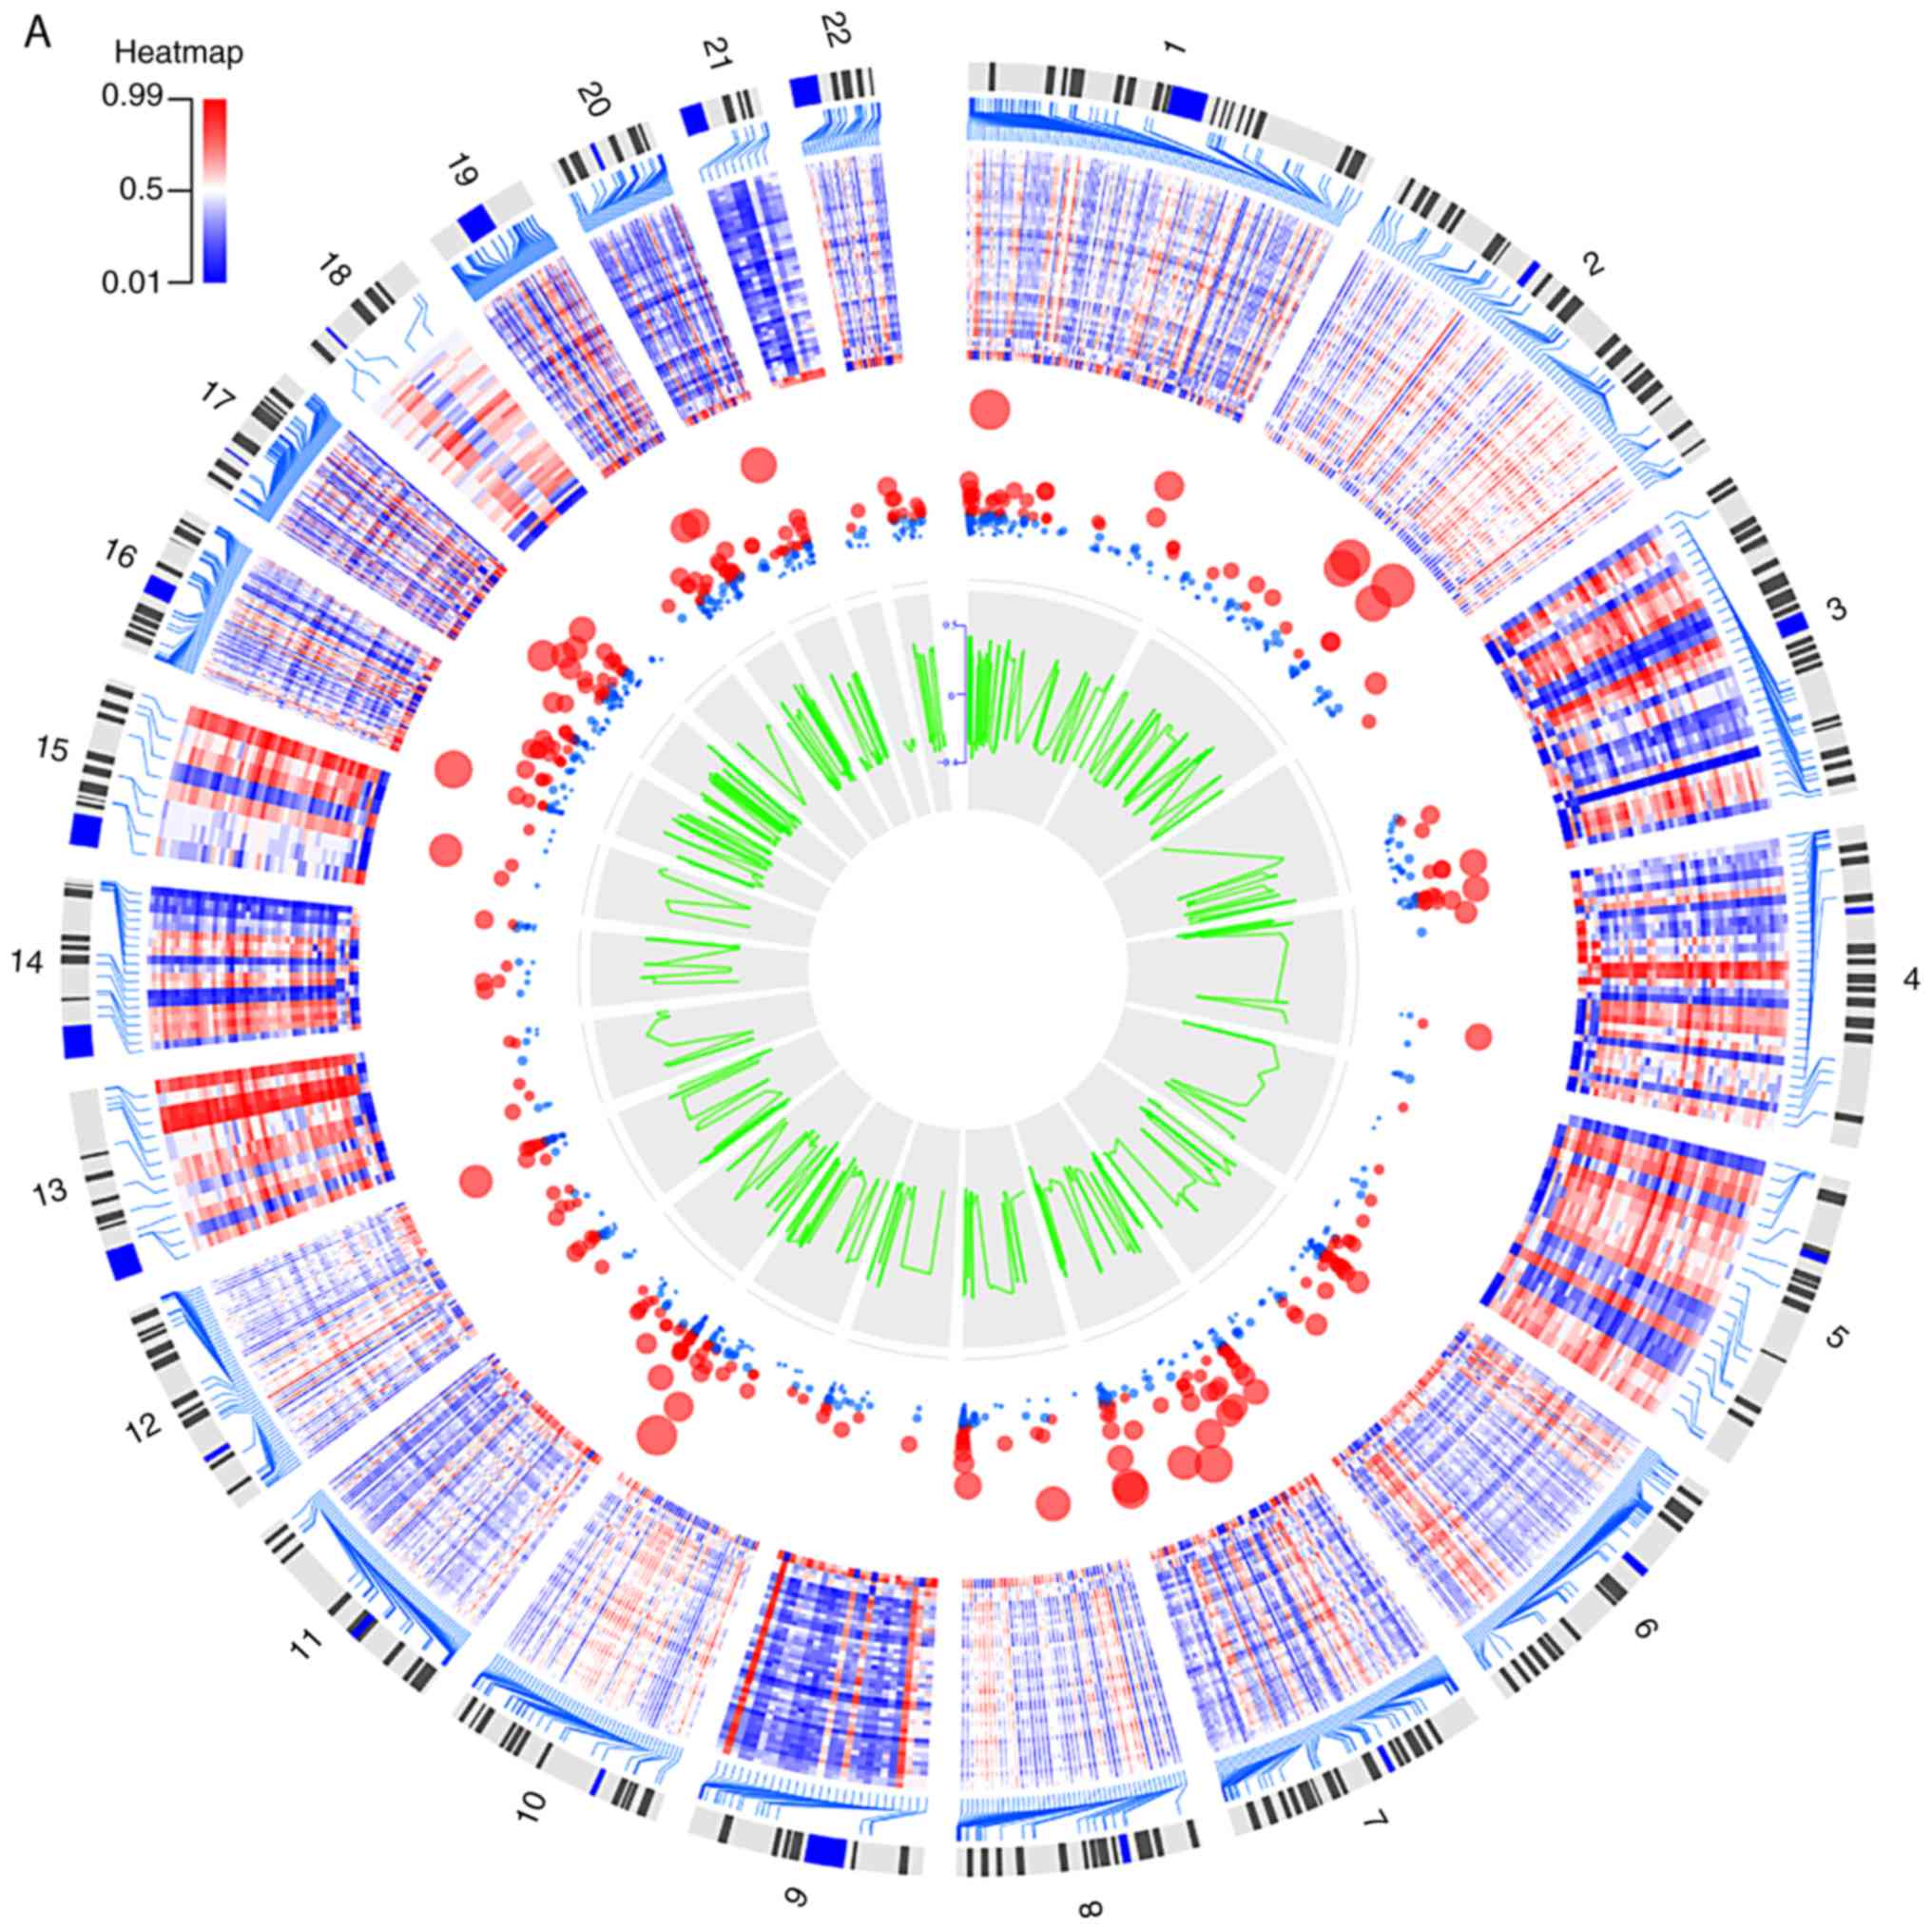
islands and 21,710 CpG sites in the open sea. The heatmap of the
top 1,000 dmCpGs with BH-adjusted P-value and β-value is shown in
Fig. 3A.
DEG screening between OSCC samples and
control samples
With the criteria of |log2FC|>1.5 and
an adjusted P-value of <0.05, a total of 508 DEGs were
identified, consisting of 332 upregulated genes and 176
downregulated genes. The heatmap of these 508 DEGs with
log2FC and adjusted P-value is shown in Fig. 3B.
Association between DNA methylation
and mRNA expression
There were 82 overlapping genes between the 3,360
DMGs and 508 DEGs, termed the OSCC genes; this set of genes may be
more relevant to OSCC. Further functional analysis was performed on
these 82 OSCC genes.
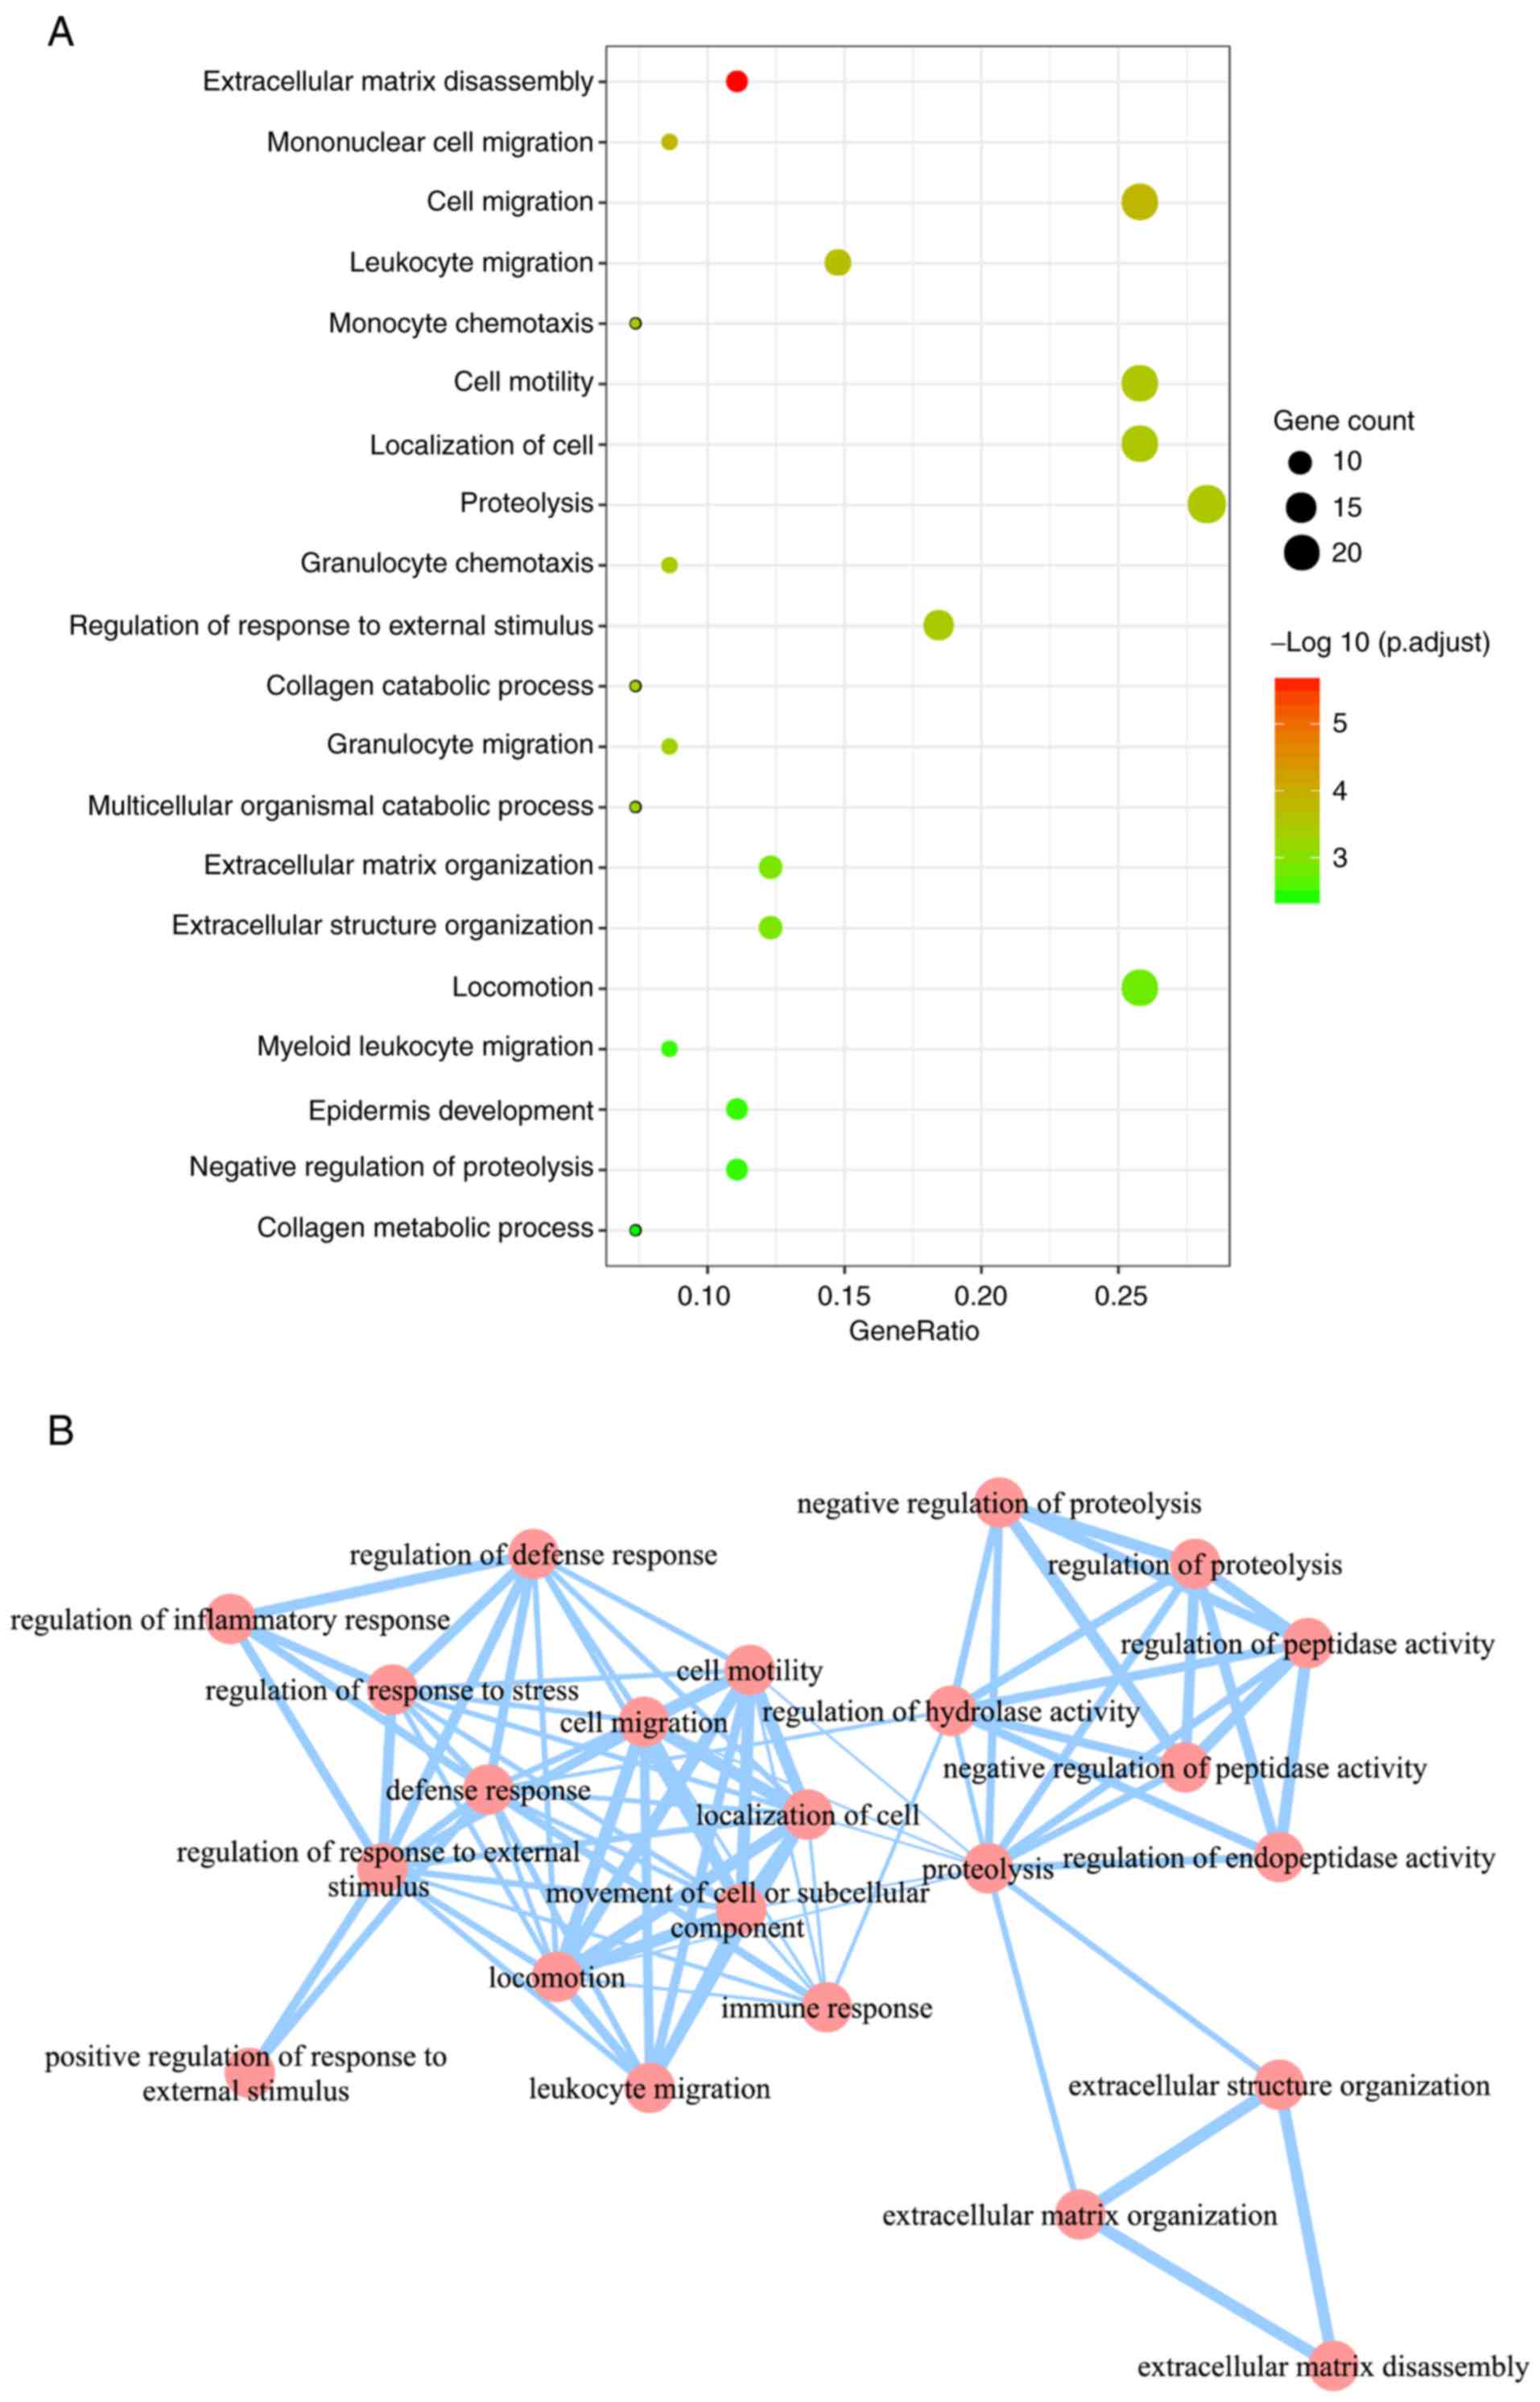
GO and KEGG pathway enrichment
analysis of OSCC genes
In total, 48 significant GO BP terms were identified
(Fig. 4A). Using GO enrichment map
view (Fig. 4B), these 48
significant GO BP terms were mainly grouped into 3 clusters: A
cluster associated with protein metabolism (including
‘proteolysis’, ‘negative regulation of proteolysis’, ‘regulation of
proteolysis’, ‘negative regulation of peptidase activity’ and
‘regulation of peptidase activity’), a cluster associated with the
regulation of the metabolic process (including ‘extracellular
matrix disassembly’, ‘extracellular matrix organization’ and
‘extracellular structure organization’) and a cluster associated
with immune system (including ‘immune response’, ‘cell migration’,
‘regulation of defense response’, ‘regulation of inflammatory
response’, ‘defense response’ and leukocyte migration’).
In addition, 15 KEGG terms were enriched (Table III), including ‘tyrosine
metabolism’ and ‘glycolysis/gluconeogenesis’.
| Table III.Kyoto Encyclopedia of Genes and
Genomes pathways enriched by overlapping genes between
differentially expressed genes and differentially methylated
genes. |
Table III.
Kyoto Encyclopedia of Genes and
Genomes pathways enriched by overlapping genes between
differentially expressed genes and differentially methylated
genes.
| Pathway ID | Description | P-value | Corrected
P-value |
|---|
| hsa00350 | Tyrosine
metabolism |
1.30×10⁻⁶ |
1.27×10⁻⁴ |
| hsa00010 |
Glycolysis/gluconeogenesis |
1.46×10⁻⁵ |
7.14×10⁻⁴ |
| hsa05204 | Chemical
carcinogenesis |
3.11×10⁻⁵ |
1.02×10⁻³ |
| hsa01100 | Metabolic
pathways |
2.51×10⁻⁴ |
6.14×10⁻³ |
| hsa00830 | Retinol
metabolism |
3.82×10⁻⁴ |
7.39×10⁻³ |
| hsa00982 | Drug
metabolism-cytochrome P450 |
4.52×10⁻⁴ |
7.39×10⁻³ |
| hsa00980 | Metabolism of
xenobiotics by cytochrome P450 |
5.30×10⁻⁴ |
7.42×10⁻³ |
| hsa05323 | Rheumatoid
arthritis |
9.84×10⁻⁴ |
1.21×10⁻² |
| hsa05146 | Amoebiasis |
1.28×10⁻³ |
1.40×10⁻² |
| hsa04668 | TNF signaling
pathway |
1.67×10⁻³ |
1.64×10⁻² |
| hsa05219 | Bladder cancer |
3.58×10⁻³ |
3.19×10⁻² |
| hsa00071 | Fatty acid
degradation |
4.08×10⁻³ |
3.34×10⁻² |
| hsa05202 | Transcriptional
misregulation in cancer |
6.47×10⁻³ |
4.64×10⁻² |
| hsa05150 | Staphylococcus
aureus infection |
6.64×10⁻³ |
4.64×10⁻² |
| hsa04062 | Chemokine signaling
pathway |
7.17×10⁻³ |
4.69×10⁻² |
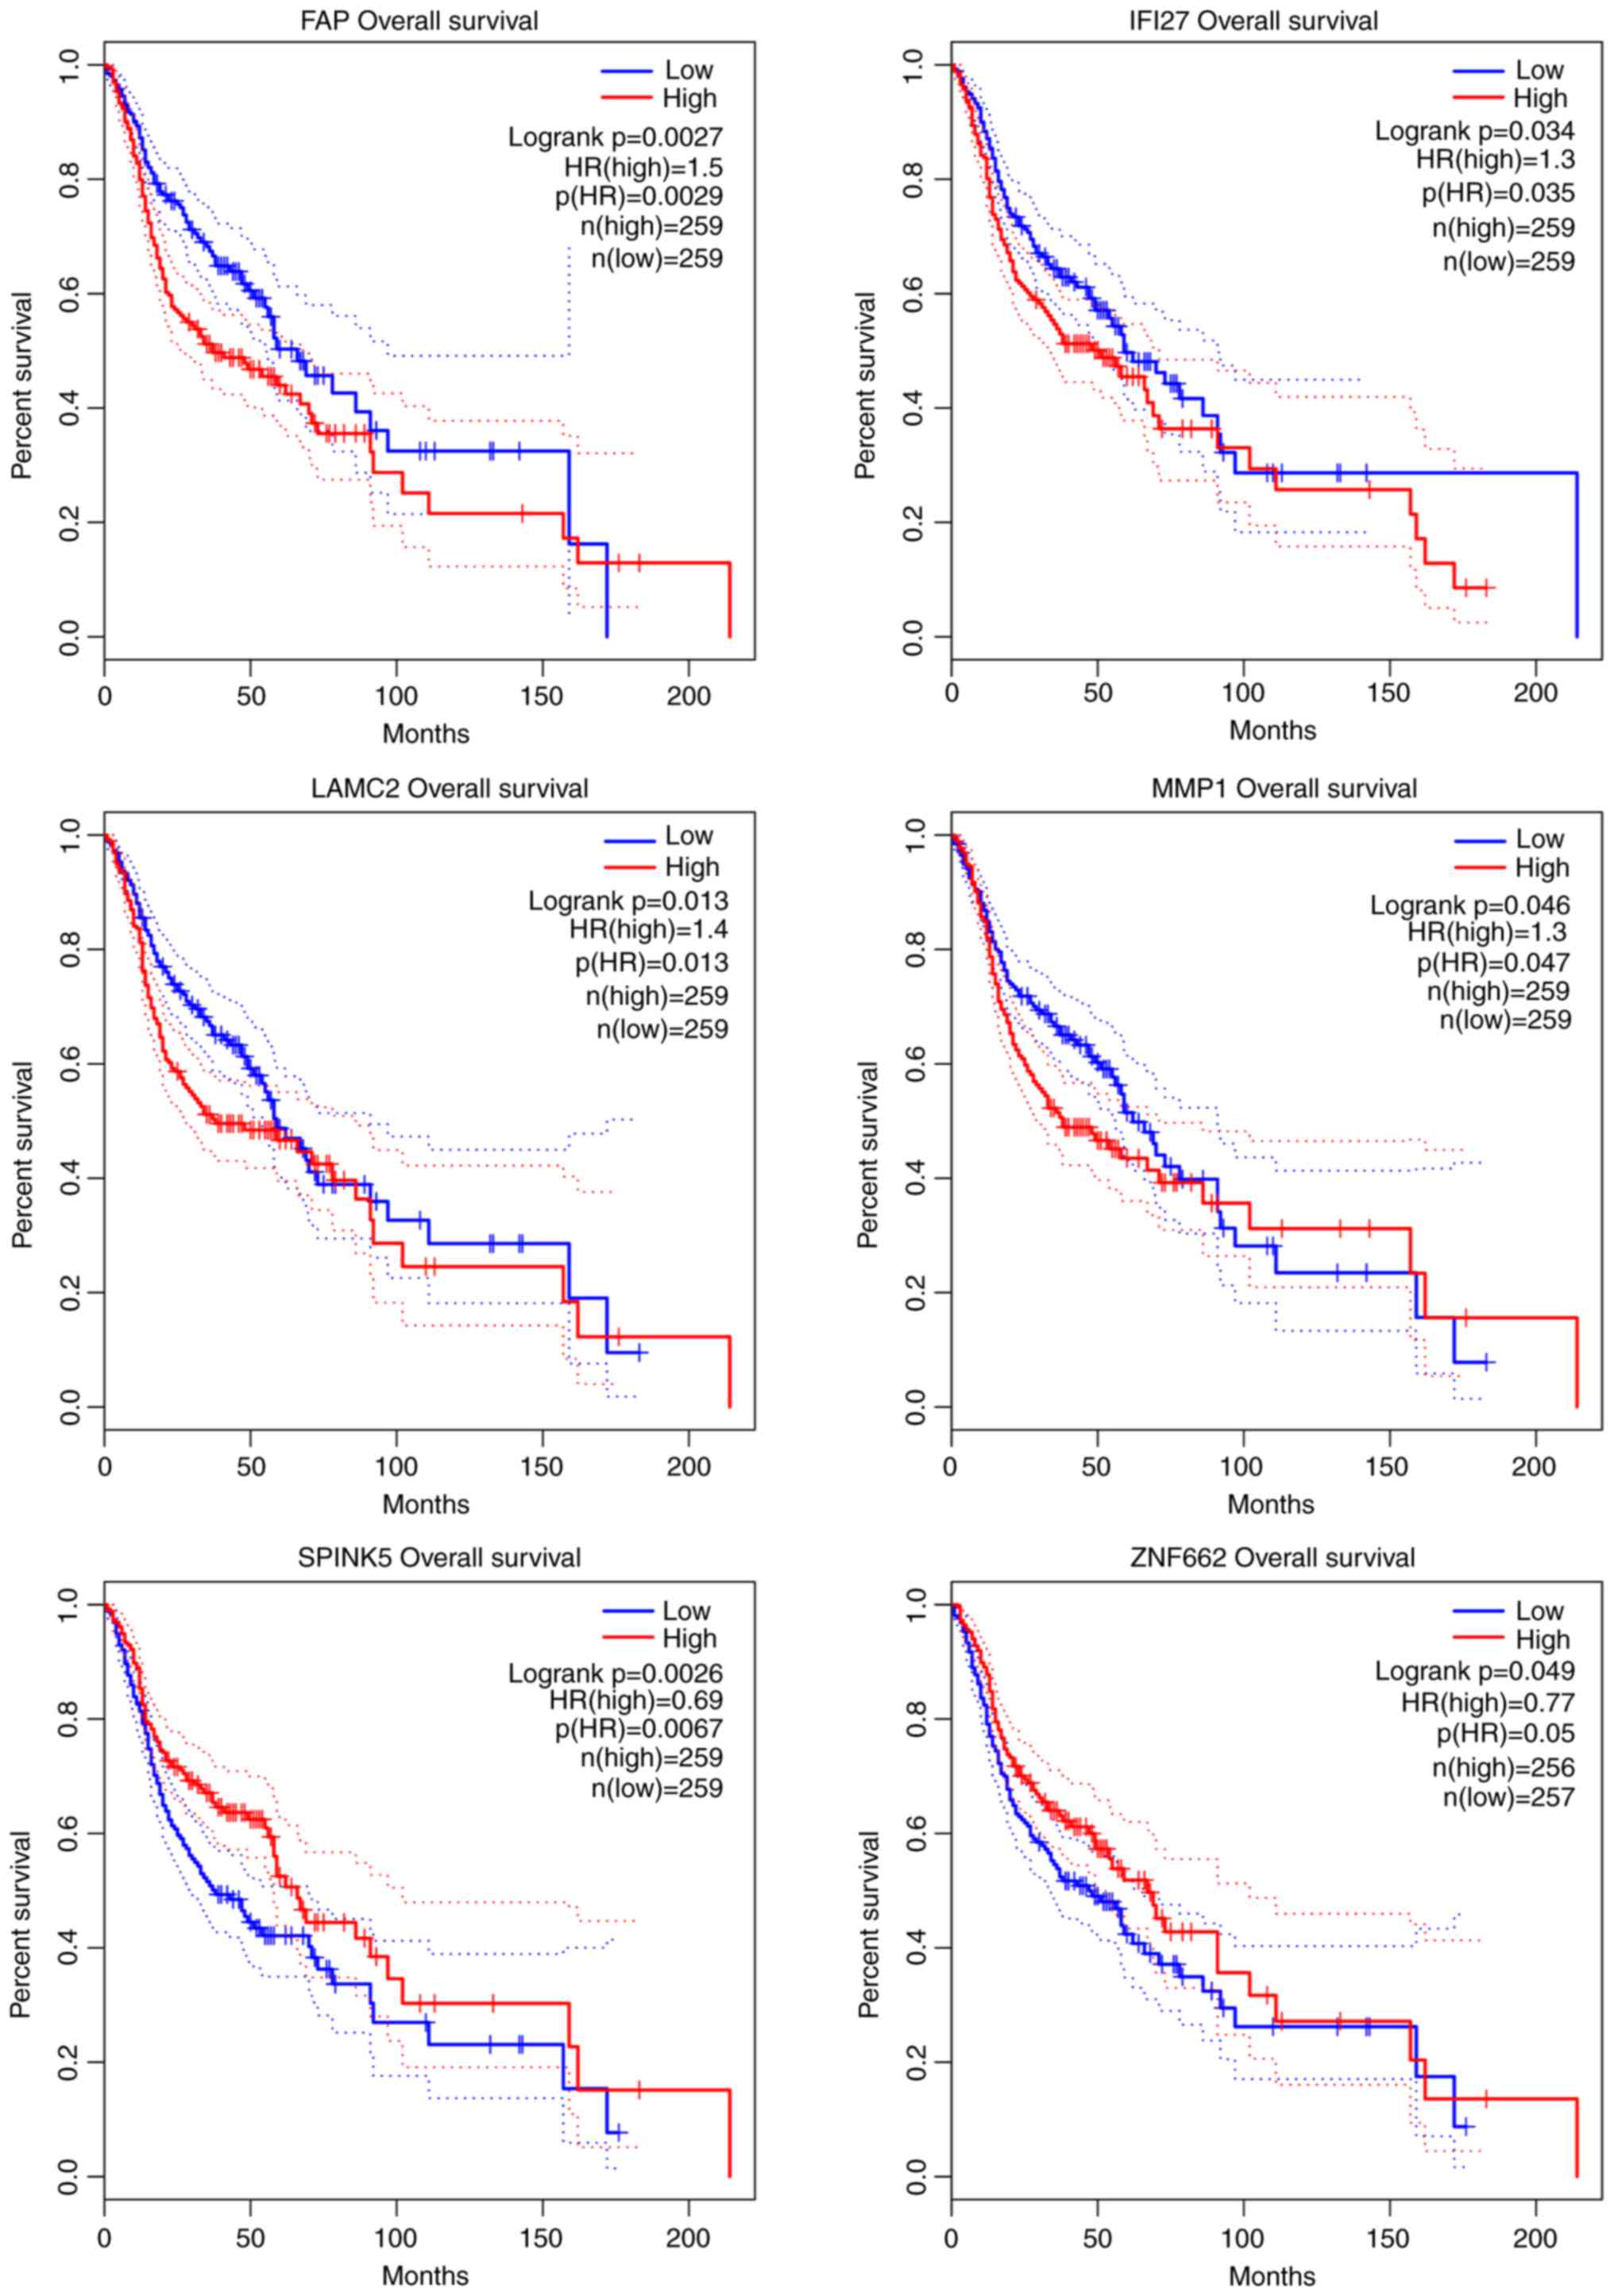
Survival analysis for OSCC genes
To investigate the associations between OSCC overall
survival and the expression of these OSCC genes, Kaplan-Meier curve
analysis was performed to obtain the prognostic signature (Fig. 5). As a result, 6 genes were found,
namely fibroblast activation protein α (FAP; upregulated),
interferon α inducible protein 27 (IFI27; upregulated),
laminin subunit γ2 (LAMC; upregulated), matrix
metallopeptidase 1 (MMP1; upregulated), serine peptidase
inhibitor Kazal-type 5 (SPINK5; downregulated) and zinc
finger protein 662 (ZNF662; downregulated), were
significantly associated with the survival of patients with
OSCC.
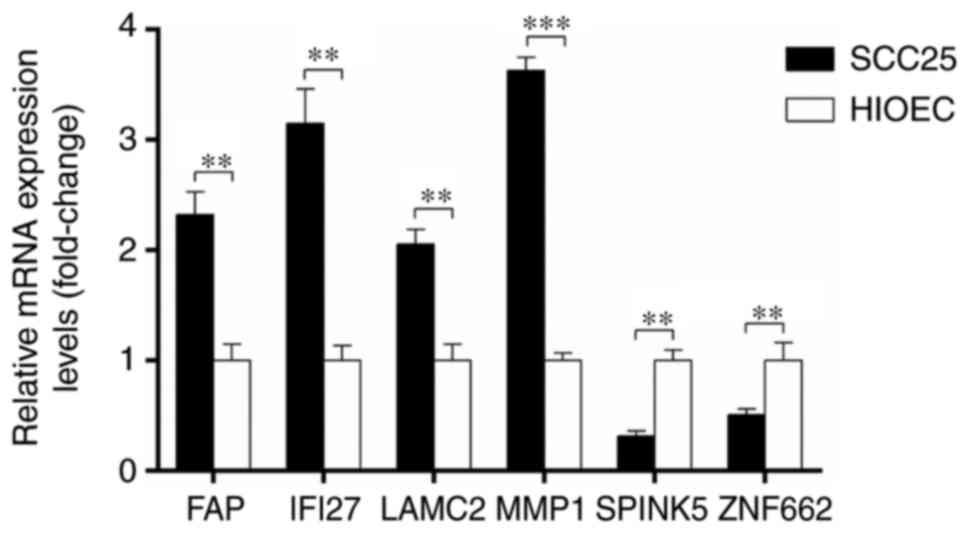
RT-qPCR analysis
Differences in the expression of FAP, IFI27,
LAMC2, MMP1, SPINK5 and ZNF662 between OSCC SCC25 cells
and the human normal oral epithelial HIOEC cell line were
investigated through RT-qPCR. Consistent with the results from the
microarray analysis, the expression of FAP, IFI27, LAMC2 and
MMP1 was significantly upregulated, while the expression of
SPINK5 and ZNF662 was significantly downregulated in
OSCC cells compared with that in normal cells, as shown in Fig. 6.
Discussion
In the current study, it was found that 40,115
dmCpGs spanning 3,360 DMGs were aberrantly methylated in OSCC
samples compared with those in normal samples; CpG sites in the
promoter, gene body and intergenic regions were generally highly
hypermethylated or hypomethylated. Additionally, 508 DEGs were
identified in the OSCC samples, including 332 upregulated and 176
downregulated genes. A total of 82 overlapping genes between DEGs
and DMGs were found, which were mainly involved in protein
metabolism, regulation of the metabolic process and the immune
system. Additionally, differential methylation or expression of
several genes, namely FAP, IFI27, LAMC2, MMP1, SPINK5 and
ZNF662, were significantly associated with the survival of
patients with OSCC.
DNA methylation in different genomic regions can
alter gene expression. A previous study showed a causal association
between gene body DNA methylation and gene expression (22). Hypermethylation of CpG islands
within the promoter regions of TSGs is believed to serve a crucial
role in the development of carcinogenesis (23). In the present study, to better
address the function of dmCpGs sites, their neighborhood locational
distribution was determined. As a result, it was found that >50%
of hypermethylated sites were located in CpG islands, while >50%
of the hypomethylated CpG sites were in the open sea. However,
regardless of the neighborhood location of the promoter methylation
sites, evidence has shown that DNA methylation in the promoter
region is most often associated with transcriptional downregulation
(24).
In addition, the present study found that
methylation and expression changes in the genome of patients with
OSCC, according to functional enrichment analysis, interfere with
protein metabolism, glycolysis/gluconeogenesis and the immune
system. Proteolytic processing of E-cadherin that suppresses
cell-cell adhesion of OSCC cells may facilitate the progression of
OSCC (25). Increased glucose
transport and metabolism has been reported to be associated with
poor prognosis in patients with OSCC (26). Moreover, immune cell dysfunction in
OSCC patients is an important factor influencing tumor growth
(27). One previous study indicated
that the modulation of functional dynamics of regulatory T cells
may be useful for immunotherapeutic strategy for patients with OSCC
(27). Regarding the biological
processes and KEGG pathways likely to be impaired by methylation or
expression changes in the present study, we suggested involvement
of significant methylated genes in the progression of OSCC.
The present study found 82 genes that were
overlapping between the 3,360 DMGs and 508 DEGs, of which 6 genes
(FAP, IFI27, LAMC2, MMP1, SPINK5 and ZNF662) were
predicted to be significantly associated with the survival of OSCC
patients. Wang et al (28)
demonstrated that the downregulation of FAP suppresses cell
proliferation and metastasis in OSCC. In a study by Li et al
(29), OSCC was closely allied to
certain key genes, including IFI27. Additionally,
IFI27 was found to be dysregulated in patients with tongue
squamous cell carcinoma (30).
LAMC2 was found to be significantly associated with lymph
node metastasis in OSCC (31),
while MMP1 is a potential oral cancer marker (32,33).
One previous study reported SPINK5 as one of the genes that
were downregulated in HNSCC (34).
Therefore, we hypothesize that the dysregulation of these genes
caused by epigenetic changes may be a suitable mechanism linked to
the development of OSCC and that these 6 genes may serve as
prognostic biomarkers in OSCC treatment. However, the potential
clinical significance of these genes should be verified by further
experiments.
In summary, genome-wide DNA methylation profiling
revealed a set of DMGs in OSCC patients. Moreover, by integration
of gene expression data, it was suggested that the dysregulation of
FAP, IFI27, LAMC2, MMP1, SPINK5 and ZNF662 genes
caused by epigenetic changes via DNA methylation may be associated
with the development and progression of OSCC, and that these genes
may be useful prognostic markers with potential clinical
significance in OSCC treatment, thus deserving further
investigation.
Acknowledgements
Not applicable.
Funding
This research did not receive any specific grant
from funding agencies in the public, commercial or not-for-profit
sectors.
Availability of data and materials
The datasets generated and/or analyzed during the
current study are available in the Gene Expression Omnibus
repository of the National Center for Biotechnology Information
(https://www.ncbi.nlm.nih.gov/geo/query/acc.cgi?acc=GSE41114).
Authors' contributions
CZ and HZ conceived and designed the project; JZ
acquired the data; CZ, HL and JW analyzed and interpreted the data;
and HZ and HL wrote the paper and revised it for important
intellectual content. CZ and HZ agree to be accountable for all
aspects of the work in ensuring that questions associated with the
accuracy or integrity of any part of the study are appropriately
investigated and resolved. All authors read and approved the final
manuscript.
Ethics approval and consent to
participate
Not applicable.
Patient consent for publication
Not applicable.
Competing interests
The authors declare that they have no competing
interests.
References
|
1
|
Ehtesham H, Safdari R, Mansourian A,
Tahmasebian S, Mohammadzadeh N, Ghazisaeedi M and Bashiri A:
Clinical decision support system, a potential solution for
diagnostic accuracy improvement in oral squamous cell carcinoma: A
systematic review. J Oral Health Oral Epidemiol. 6:187–195.
2017.
|
|
2
|
Marur S and Forastiere AA: Head and neck
squamous cell carcinoma: Update on epidemiology, diagnosis, and
treatment. Mayo Clin Proc. 91:386–396. 2016. View Article : Google Scholar : PubMed/NCBI
|
|
3
|
Velmurugan BK, Yeh KT, Lee CH, Lin SH,
Chin MC, Chiang SL, Wang ZH, Hua CH, Tsai MH, Chang JG and Ko YC:
Acidic leucine-rich nuclear phosphoprotein-32A (ANP32A) association
with lymph node metastasis predicts poor survival in oral squamous
cell carcinoma patients. Oncotarget. 7:10879–10890. 2016.
View Article : Google Scholar : PubMed/NCBI
|
|
4
|
Chi HC, Tsai CY, Tsai MM and Lin KH:
Impact of DNA and RNA methylation on radiobiology and cancer
progression. Int J Mol Sci. 19:E5552018. View Article : Google Scholar : PubMed/NCBI
|
|
5
|
Khor GH, Froemming GR, Zain RB, Abraham
MT, Omar E, Tan SK, Tan AC, Vincent-Chong VK and Thong KL: DNA
methylation profiling revealed promoter hypermethylation-induced
silencing of p16, DDAH2 and DUSP1 in primary oral squamous cell
carcinoma. Int J Med Sci. 10:1727–1739. 2013. View Article : Google Scholar : PubMed/NCBI
|
|
6
|
Basu B, Chakraborty J, Chandra A, Katarkar
A, Baldevbhai JR, Chowdhury Dhar D, Ray JG, Chaudhuri K and
Chatterjee R: Genome-wide DNA methylation profile identified a
unique set of differentially methylated immune genes in oral
squamous cell carcinoma patients in India. Clin Epigenetics.
9:132017. View Article : Google Scholar : PubMed/NCBI
|
|
7
|
Clausen MJ, Melchers LJ, Mastik MF,
Slagter-Menkema L, Groen HJ, van der Laan BF, van Criekinge W, de
Meyer T, Denil S, Wisman GB, et al: Identification and validation
of WISP1 as an epigenetic regulator of metastasis in oral squamous
cell carcinoma. Genes Chromosomes Cancer. 55:45–59. 2016.
View Article : Google Scholar : PubMed/NCBI
|
|
8
|
Shen L, Kondo Y, Guo Y, Zhang J, Zhang L,
Ahmed S, Shu J, Chen X, Waterland RA and Issa JP: Genome-wide
profiling of DNA methylation reveals a class of normally methylated
CpG island promoters. PLoS Genet. 3:2023–2036. 2007. View Article : Google Scholar : PubMed/NCBI
|
|
9
|
Garcia MP and Garcia-Garcia A: Epigenome
and DNA methylation in oral squamous cell carcinoma. Methods Mol
Biol. 863:207–219. 2012. View Article : Google Scholar : PubMed/NCBI
|
|
10
|
Jithesh PV, Risk JM, Schache AG, Dhanda J,
Lane B, Liloglou T and Shaw RJ: The epigenetic landscape of oral
squamous cell carcinoma. Br J Cancer. 108:370–379. 2013. View Article : Google Scholar : PubMed/NCBI
|
|
11
|
Selamat SA, Chung BS, Girard L, Zhang W,
Zhang Y, Campan M, Siegmund KD, Koss MN, Hagen JA, Lam WL, et al:
Genome-scale analysis of DNA methylation in lung adenocarcinoma and
integration with mRNA expression. Genome Res. 22:1197–1211. 2012.
View Article : Google Scholar : PubMed/NCBI
|
|
12
|
Yoo S, Takikawa S, Geraghty P, Argmann C,
Campbell J, Lin L, Huang T, Tu Z, Foronjy RF, Spira A, et al:
Integrative analysis of DNA methylation and gene expression data
identifies EPAS1 as a key regulator of COPD. PLoS Genet.
11:e10048982015. View Article : Google Scholar : PubMed/NCBI
|
|
13
|
Li YF, Hsiao YH, Lai YH, Chen YC, Chen YJ,
Chou JL, Chan MW, Lin YH, Tsou YA, Tsai MH and Tai CK: DNA
methylation profiles and biomarkers of oral squamous cell
carcinoma. Epigenetics. 10:229–236. 2015. View Article : Google Scholar : PubMed/NCBI
|
|
14
|
Gautier L, Cope L, Bolstad BM and Irizarry
RA: Affy-analysis of affymetrix genechip data at the probe level.
Bioinformatics. 20:307–315. 2004. View Article : Google Scholar : PubMed/NCBI
|
|
15
|
Pickering CR, Zhang J, Yoo SY, Bengtsson
L, Moorthy S, Neskey DM, Zhao M, Alves Ortega MV, Chang K, Drummond
J, et al: Integrative genomic characterization of oral squamous
cell carcinoma identifies frequent somatic drivers. Cancer Discov.
3:770–781. 2013. View Article : Google Scholar : PubMed/NCBI
|
|
16
|
Oghumu S, Knobloch TJ, Terrazas C,
Varikuti S, Ahn-Jarvis J, Bollinger CE, Iwenofu H, Weghorst CM and
Satoskar AR: Deletion of macrophage migration inhibitory factor
inhibits murine oral carcinogenesis: Potential role for chronic
pro-inflammatory immune mediators. Int J Cancer. 139:1379–1390.
2016. View Article : Google Scholar : PubMed/NCBI
|
|
17
|
Benjamini Y and Hochberg Y: Controlling
the false discovery rate: A practical and powerful approach to
multiple testing. J Royal Statistical Society Series B. 57:289–300.
1995.
|
|
18
|
Merico D, Isserlin R, Stueker O, Emili A
and Bader GD: Enrichment map: A network-based method for gene-set
enrichment visualization and interpretation. PLoS One.
5:e139842010. View Article : Google Scholar : PubMed/NCBI
|
|
19
|
Kanehisa M and Goto S: KEGG: Kyoto
encyclopedia of genes and genomes. Nucleic Acids Res. 28:27–30.
2000. View Article : Google Scholar : PubMed/NCBI
|
|
20
|
Wu J, Mao X, Cai T, Luo J and Wei L: KOBAS
server: A web-based platform for automated annotation and pathway
identification. Nucleic Acids Res. 34:W720–W724. 2006. View Article : Google Scholar : PubMed/NCBI
|
|
21
|
Livak KJ and Schmittgen TD: Analysis of
relative gene expression data using real-time quantitative PCR and
the 2−ΔΔCT method. Methods. 25:402–408. 2001.
View Article : Google Scholar : PubMed/NCBI
|
|
22
|
Yang X, Han H, De Carvalho DD, Lay FD,
Jones PA and Liang G: Gene body methylation can alter gene
expression and is a therapeutic target in cancer. Cancer Cell.
26:577–590. 2014. View Article : Google Scholar : PubMed/NCBI
|
|
23
|
Khatami F, Larijani B, Heshmat R, Keshtkar
A, Mohammadamoli M, Teimoori-Toolabi L, Nasiri S and Tavangar SM:
Meta-analysis of promoter methylation in eight tumor-suppressor
genes and its association with the risk of thyroid cancer. PLoS
One. 12:e01848922017. View Article : Google Scholar : PubMed/NCBI
|
|
24
|
Jones PA: Functions of DNA methylation:
Islands, start sites, gene bodies and beyond. Nat Rev Genet.
13:484–492. 2012. View
Article : Google Scholar : PubMed/NCBI
|
|
25
|
Hayashido Y, Hamana T, Yoshioka Y, Kitano
H, Koizumi K and Okamoto T: Plasminogen activator/plasmin system
suppresses cell-cell adhesion of oral squamous cell carcinoma cells
via proteolysis of E-cadherin. Int J Oncol. 27:693–698.
2005.PubMed/NCBI
|
|
26
|
Kunkel M, Reichert TE, Benz P, Lehr HA,
Jeong JH, Wieand S, Bartenstein P, Wagner W and Whiteside TL:
Overexpression of Glut-1 and increased glucose metabolism in tumors
are associated with a poor prognosis in patients with oral squamous
cell carcinoma. Cancer. 97:1015–1024. 2003. View Article : Google Scholar : PubMed/NCBI
|
|
27
|
Aggarwal S, Sharma SC and Das N S:
Dynamics of regulatory T cells (Tregs) in patients with
oral squamous cell carcinoma. J Surg Oncol. 116:1103–1113. 2017.
View Article : Google Scholar : PubMed/NCBI
|
|
28
|
Wang H, Wu Q, Liu Z, Luo X, Fan Y, Liu Y,
Zhang Y, Hua S, Fu Q, Zhao M, et al: Downregulation of FAP
suppresses cell proliferation and metastasis through PTEN/PI3K/AKT
and Ras-ERK signaling in oral squamous cell carcinoma. Cell Death
Dis. 5:e11552014. View Article : Google Scholar : PubMed/NCBI
|
|
29
|
Li G, Li X, Yang M, Xu L, Deng S and Ran
L: Prediction of biomarkers of oral squamous cell carcinoma using
microarray technology. Sci Rep. 7:421052017. View Article : Google Scholar : PubMed/NCBI
|
|
30
|
Boldrup L, Gu X, Coates PJ, Norberg-Spaak
L, Fahraeus R, Laurell G, Wilms T and Nylander K: Gene expression
changes in tumor free tongue tissue adjacent to tongue squamous
cell carcinoma. Oncotarget. 8:19389–19402. 2017. View Article : Google Scholar : PubMed/NCBI
|
|
31
|
Zanaruddin SN, Saleh A, Yang YH, Hamid S,
Mustafa WM, Bariah Khairul AA, Zain RB, Lau SH and Cheong SC:
Four-protein signature accurately predicts lymph node metastasis
and survival in oral squamous cell carcinoma. Hum Pathol.
44:417–426. 2013. View Article : Google Scholar : PubMed/NCBI
|
|
32
|
Hashimoto T, Uchida K, Okayama N, Imate Y,
Suehiro Y, Hamanaka Y, Ueyama Y, Shinozaki F, Yamashita H and
Hinoda Y: Association of matrix metalloproteinase (MMP)-1 promoter
polymorphism with head and neck squamous cell carcinoma. Cancer
Lett. 211:19–24. 2004. View Article : Google Scholar : PubMed/NCBI
|
|
33
|
Yen CY, Chen CH, Chang CH, Tseng HF, Liu
SY, Chuang LY, Wen CH and Chang HW: Matrix metalloproteinases (MMP)
1 and MMP10 but not MMP12 are potential oral cancer markers.
Biomarkers. 14:244–249. 2009. View Article : Google Scholar : PubMed/NCBI
|
|
34
|
Jayakumar A, Kang Ya, Mitsudo K, Henderson
Y, Frederick MJ, Wang M, El-Naggar AK, Marx UC, Briggs K and
Clayman GL: Expression of LEKTI domains 6–9′ in the baculovirus
expression system: Recombinant LEKTI domains 6–9′ inhibit trypsin
and subtilisin A. Protein Expr Purif. 35:93–101. 2004. View Article : Google Scholar : PubMed/NCBI
|