Introduction
Various countries worldwide, including the United
States have observed an increase in the number of thyroid cancer
cases. The incidence rate and mortality risk for advanced-stage
papillary thyroid cancer have increased >3% annually in the past
3 decades in the United States (1,2). As
the most common type of endocrine malignancy in the human body,
thyroid cancer primarily consists of papillary, follicular,
medullary and anaplastic carcinoma. Thyroid cancer advances with
genetic and epigenetic alterations, and the consequential
disarrangement of corresponding signaling pathways. Tumorigenesis
is accelerated and amplified by a complex interaction of numerous
secondary molecular alterations, in tumor cells and their
microenvironment (3).
Typically, physical examinations or imaging studies
accidentally identify thyroid cancer as nodules in the neck region.
The majority of these nodules are benign, making it important to
differentiate between the benign and malignant tumors. Patients
with cancer require appropriately definitive treatment, which means
diagnostic surgery is redundant. Fortunately, fine-needle
aspiration (FNA), followed by cytological examination, allows for a
relatively exact diagnosis of the type (benign, malignant, or
uncertain) of nodule with suspicious ultrasound or other clinical
characteristics (4–7).
However, ~25% of FNA cytology samples yield more
than two types of indeterminate cytological diagnoses. In a
meta-analysis, ~20% of the 25,445 samples were diagnosed as atypia
of undetermined significance/follicular lesion of undetermined
significance (AUS/FLUS), follicular or oncocytic
neoplasm/suspicious for a follicular or oncocytic neoplasm (FN/SFN)
or suspicious for malignant cells, with a mean malignant risk of
15.9, 26.1, or 75.2%, respectively (8). Such malignant risks are not low enough
to postpone or cancel surgical management, or indicate definitive
cancer surgery completely. Cytology to separate benign from
malignant tumors has limited efficacy because of inevitable
similarities among the different subtypes of thyroid lesions, and
intraobserver reproducibility is always unrepeatable (9). Consequently, the majority of these
patients suffer through diagnostic surgery, which is unnecessary if
a diagnosis is clear-cut.
In fact, molecular cytology diagnosis is enriched in
multiplatform tests for DNA, mRNA, and microRNA, which are able to
accurately classify thyroid nodules and further improve the
preoperative risk-based management of benign nodules with AUS/FLUS
or FN/SFN cytology (10). Over a
decade ago, researchers performed a review of the top 12
recommended markers, including well-known markers, such as MET,
TFF3, SERPINA1, TIMP1, FN1 and TPO, as well as relatively novel or
vague ones, such as TGFA, QPCT, CRABP1 and PROS1 (11).
The present study aimed to analyze the differences
in gene profiles between thyroid carcinoma (TC or C), thyroid
adenoma (TA or A) and normal thyroid tissue (N) to identify
differentially expressed genes (DEGs) and hub genes. DEGs are used
for gene ontology analysis (GO) and hub genes may be able to
facilitate clinical studies following consideration of their
clinical relevance.
Materials and methods
Microarray data
As an international public database that archives
and shares microarray, next-generation sequencing and other forms
of high-throughput functional genomics data, the Gene Expression
Omnibus (GEO, http://www.ncbi.nlm.nih.gov/geo/) provided the
original dataset (GSE27155) for further analysis. GEO offers the
gene expression profiles of GSE27155 submitted by Giordano et
al (12,13), which was based on the Affymetrix
GPL96 platform (Affymetrix Human Genome U133A Array). The GSE27155
dataset contained 99 samples, including 17 TA samples, 78 TC
samples and four normal thyroid epithelia.
Identification of DEGs
GEO2R (https://www.ncbi.nlm.nih.gov/geo/geo2r/?acc=GSE27155)
is an interactive online software application that allows users to
compare two or more groups of samples in a certain platform in
order to identify genes that are differentially expressed across
different subtypes or different diseases. The results are output as
a table of probes ordered by significance. In order to ensure
quality control, raw data were processed using the GEOquery package
R data structures, which may be used by numerous algorithms in
other R packages. Distributions of value data may be viewed
graphically or exported as a statistical summary table, which is
useful for determining if the data are median-centered across
samples and thus suitable for cross-comparison. Student's t-test
was then used to identify DEGs. P<0.01 and adjusted P<0.05
(Benjamini & Hochberg's method or false discovery rate
controlling procedures) were considered to indicate a statistically
significant difference, and the fold change (FC) was set at
1.2.
GO and pathway enrichment analysis of
DEGs
As a canonical method to annotate genes and gene
products, GO analysis, including biological process (BP), cellular
component (CC) and molecular function (MF), aids in identifying
biological traits for high-throughput genome or transcriptome data
(14,15). Kyoto Encyclopedia of Genes and
Genomes (KEGG) (http://www.genome.jp/) is a common
omnibus to systematically interpret gene functions, facilitating an
intensive understanding of genomic information and higher-order
functional information (16).
Feeding a certain gene list to the DAVID database (https://david.ncifcrf.gov/) is an essential procedure
for the further functional analysis and relevant biological
annotation of high-throughput genome or transcriptome data
(17). To annotate DEGs at the
functional level, GO enrichment and KEGG pathway analysis were
performed using the DAVID online tool. P<0.05 was considered to
indicate a statistically significant difference.
Protein-protein interaction (PPI) and
module analysis
The Search Tool for the Retrieval of Interacting
Genes (STRING; http://string-db.org/) database is an
online tool for evaluating PPI data. The latest version of STRING
(version 10.0) covers 184 million interactions of 9.6 million
proteins from 2031 organisms. DEGs were processed in STRING to
identify the most significantly interactive associations, in which
a criterion of a combined score >0.4 was set as the significant
level. The data from the PPI networks from STRING was analyzed with
Cytoscape (version 3.6.1) software (18), in which a tool named Molecular
Complex Detection (MCODE) directly illustrated the most significant
clusters in the PPI network. False degree cut-off, node score
cut-off, haircut, false K-core and max depth from seed were set at
2, 0.2, true, 2 and 100, respectively.
Clinical relevance of identified
genes
To determine the clinical relevance of gene
expression differences, clinical specimens from the Human Protein
atlas (www.proteinatlas.org) were analyzed.
Finally, logistic regression was performed to determine the trait
(benign or malignant) of a certain neoplasm with the most
differentially expressed genes (P<0.0005, FC>1.2) among the
hub genes.
Results
Identification of DEGs
To ensure quality control on the 99 samples (17 TA
samples, 78 TC samples and four normal thyroid epithelia),
median-centered value data were acquired using the GEOquery R
package in GEO2R, and the results were suitable for
cross-comparison. Based on the GEO2R analysis of GSE27155 with the
criterion of a P<0.01 cut-off, an adjusted P<0.05 and a
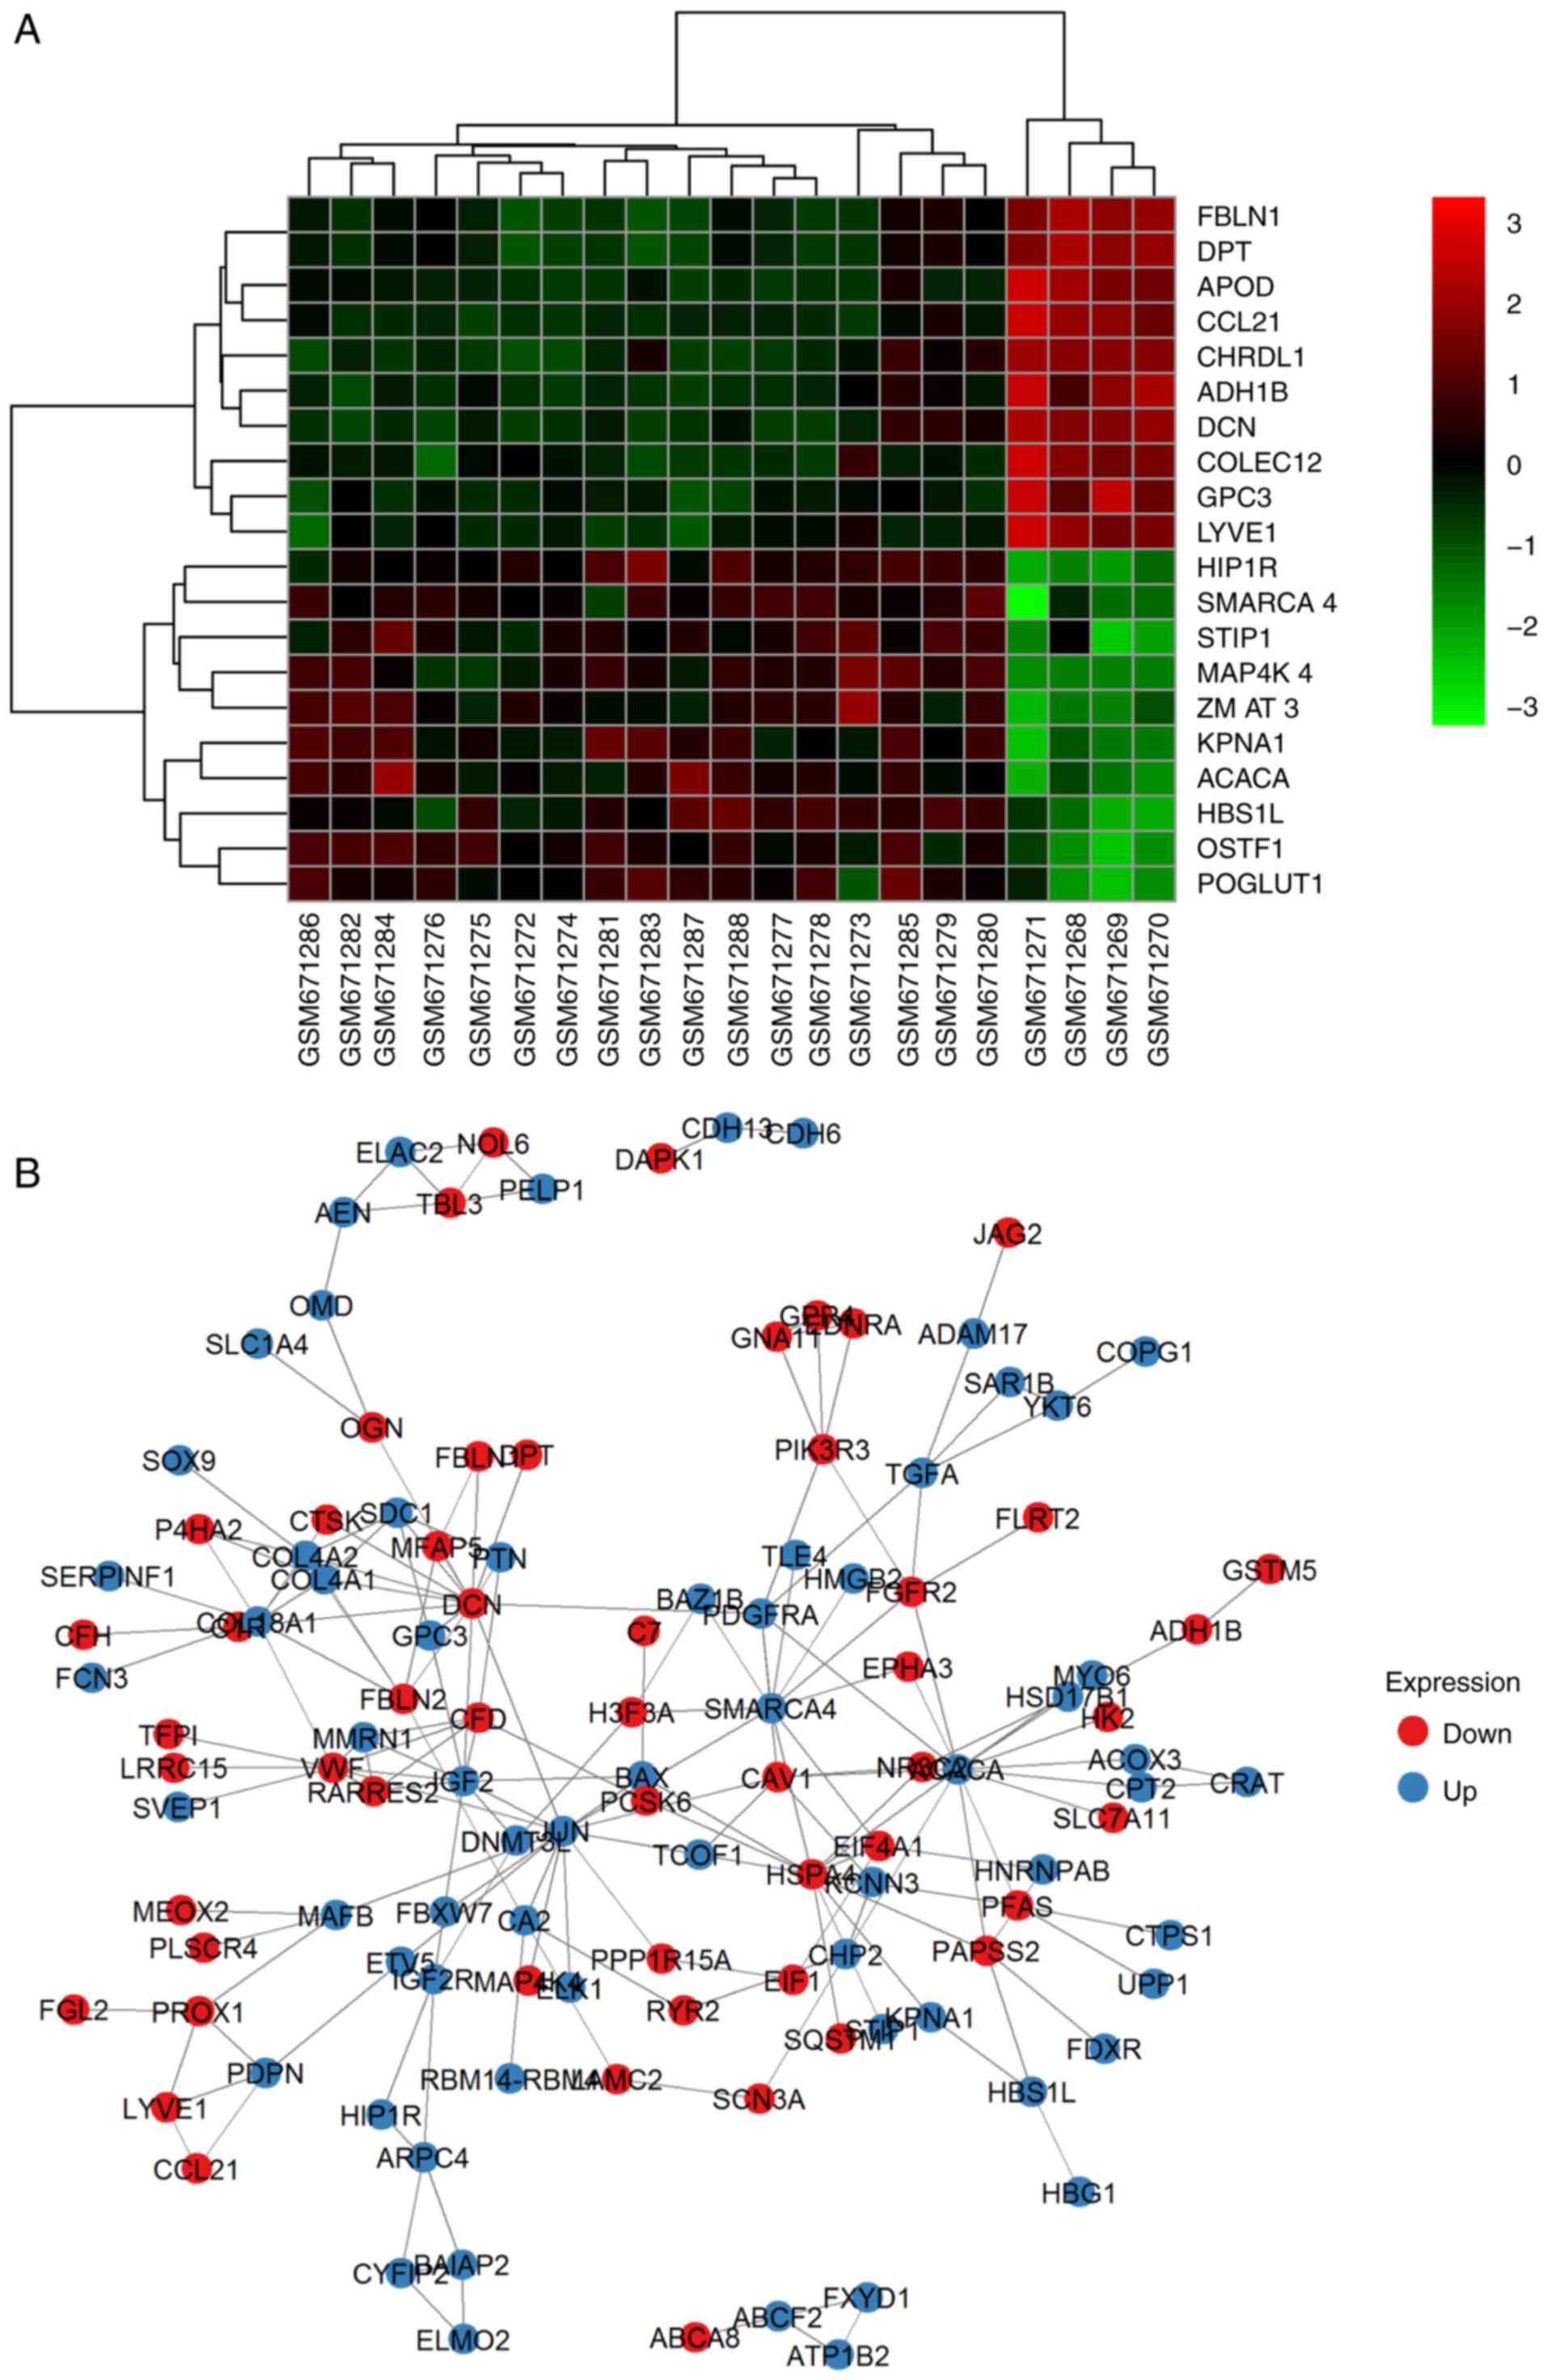
FC>1.2, 190, 294 and 425 DEGs (Fig.
1A; DEG overlapping counts are presented in Fig. 1B) were identified in adenoma vs.
normal tissue (A vs. N), carcinoma vs. normal tissue (C vs. N) and
adenoma vs. carcinoma (A vs. C), respectively. The top 10
upregulated and downregulated genes are shown in Fig. 2 (representative image of A vs. N
comparison). Detailed gene expression data and statistics of these
DEGs are also available (data not shown). Genes without an Entrez
annotation were filtered out. Four available clinical
characteristics included ret/ptc translocation (N: NA: Y=57:31:11),
braf t1799a mutation (N: NA: Y=40:31:28), pax8/pparg translocation
(N: NA: Y=56:36:7) and kras, nras, or hras mutation (N: NA:
Y=52:34:13).
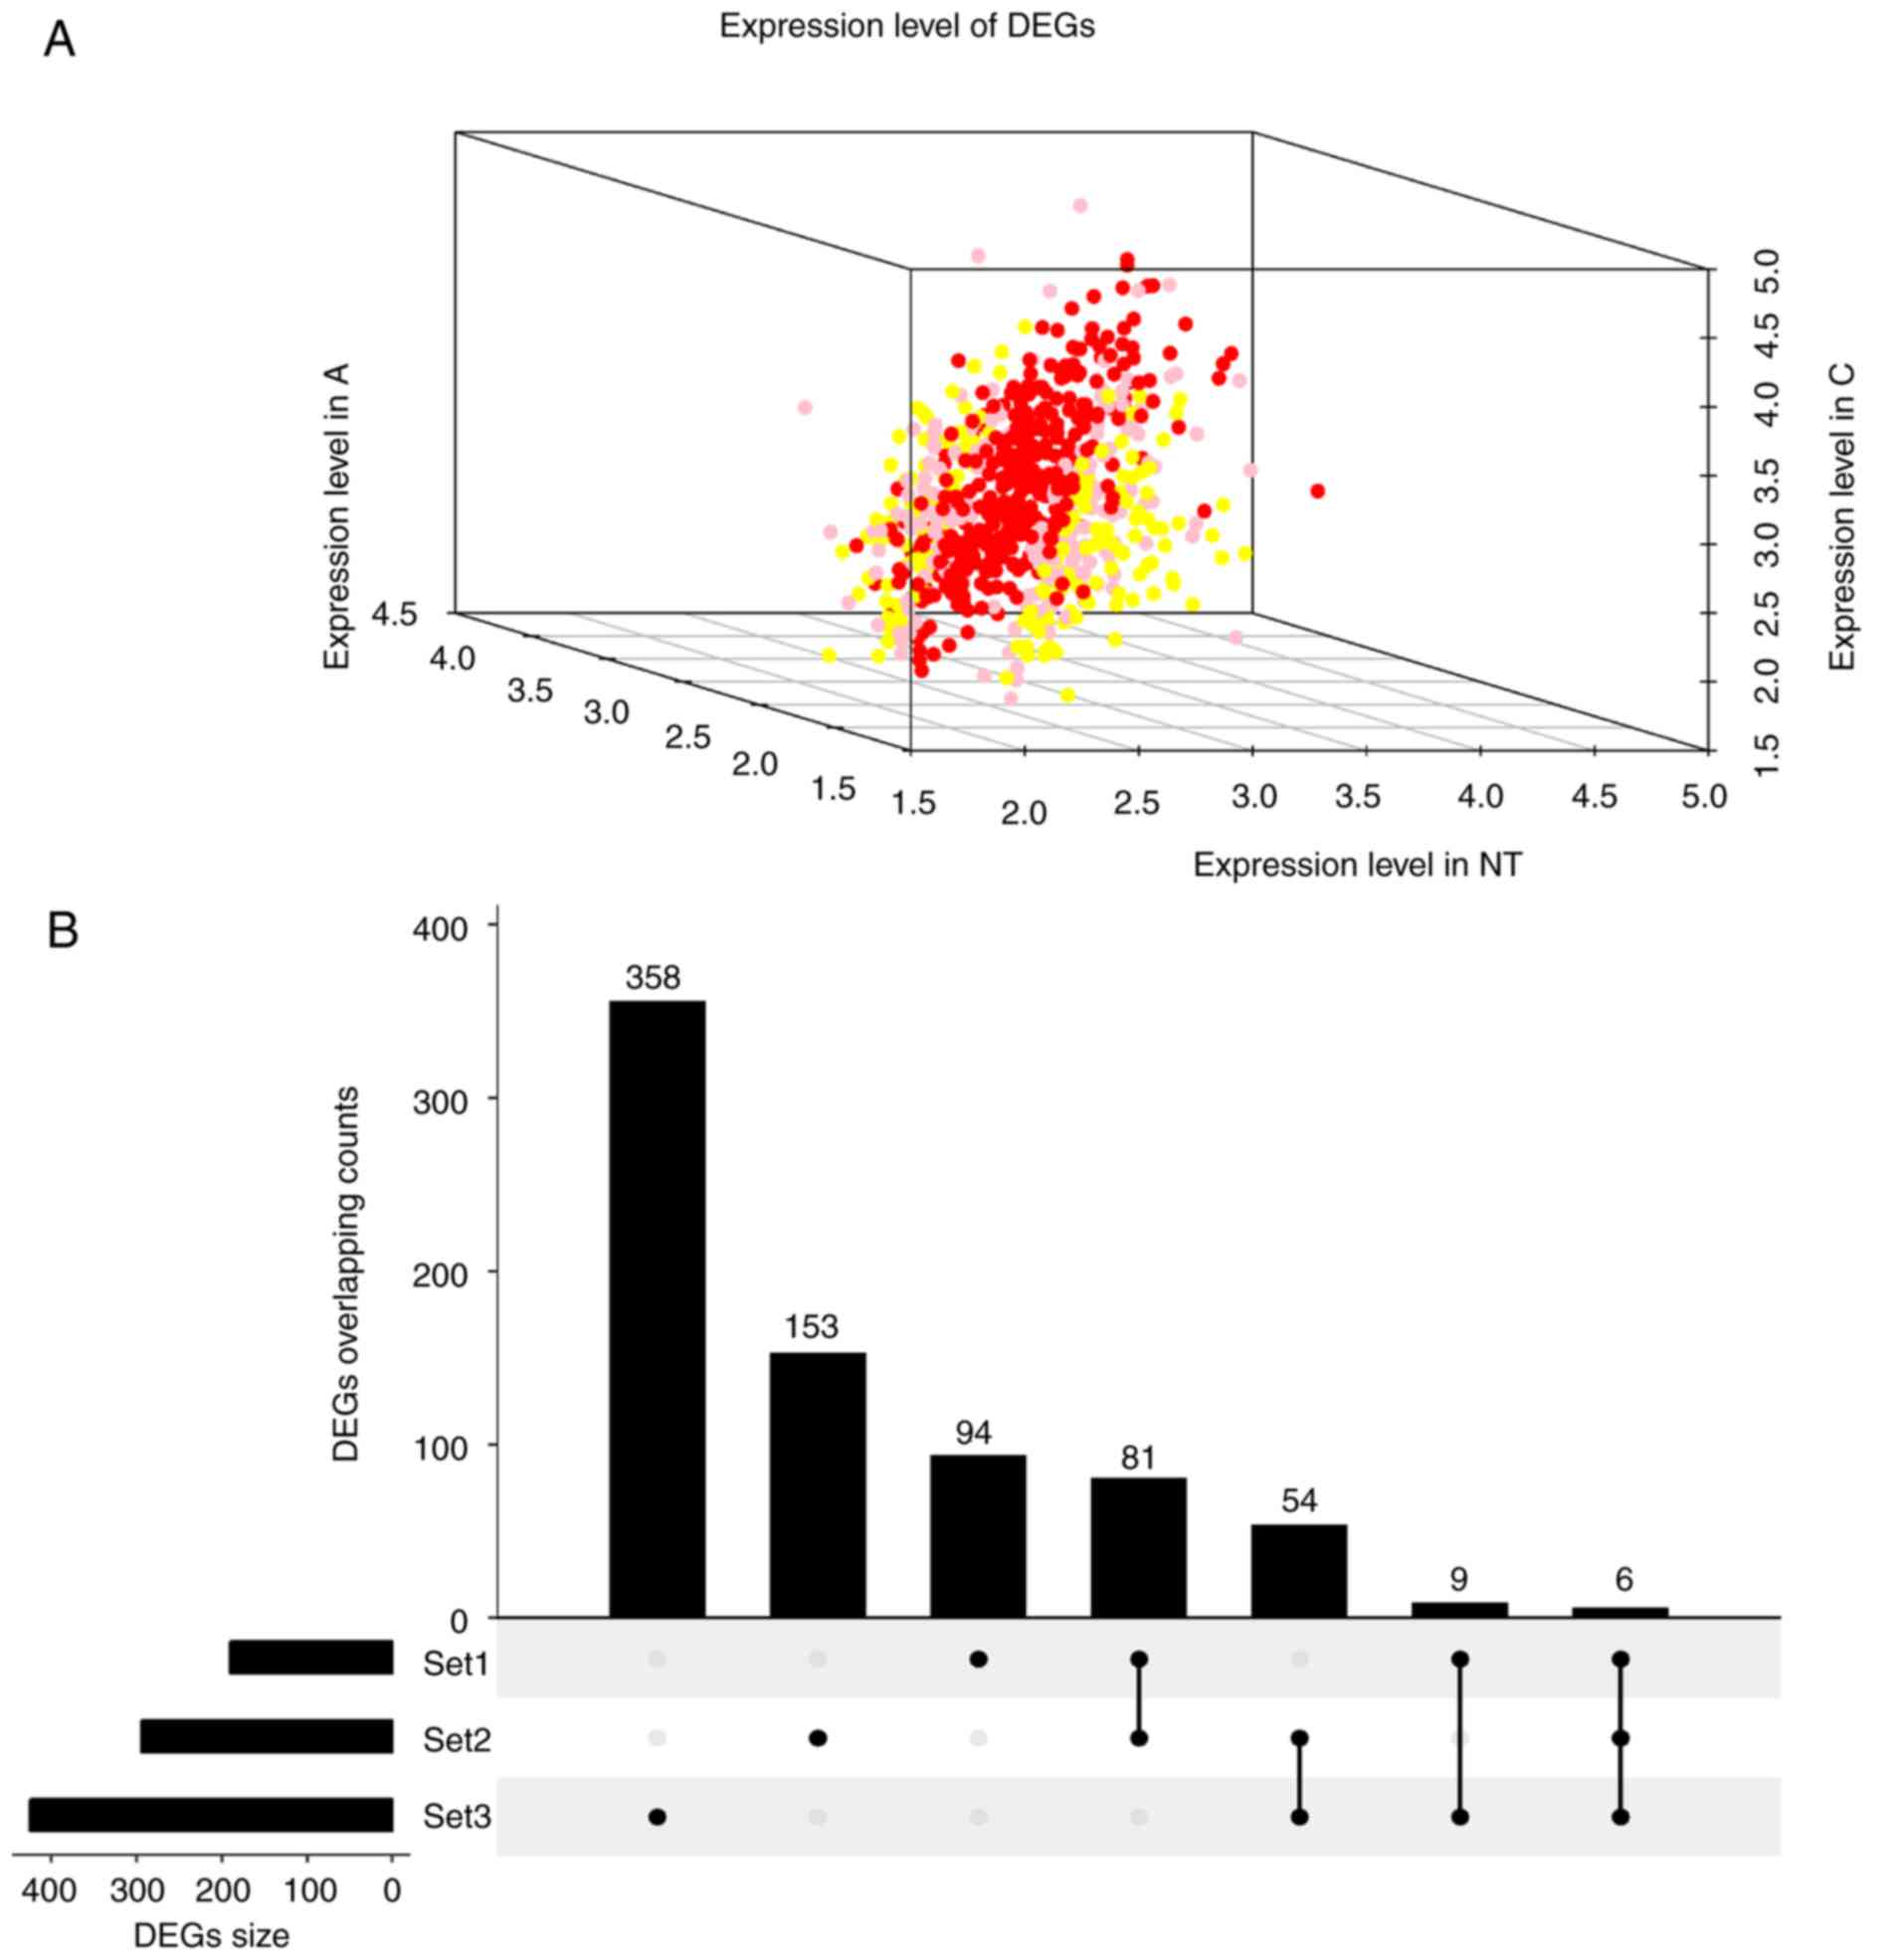 | Figure 1.Expression and overlapping count of
DEGs. (A) Expression of DEGs. Red foci, DEGs between C and N. Pink
foci, DEGs between A and C. Yellow foci, DEGs between N and A. (B)
DEGs overlapping count. Set1, DEGs counts between N and A. Set2,
DEGs counts between N and T. Set3, DEGs counts between T and A. C,
thyroid carcinoma; A, thyroid adenoma; N, normal thyroid epithelial
cells; DEGs, differentially expressed genes. |
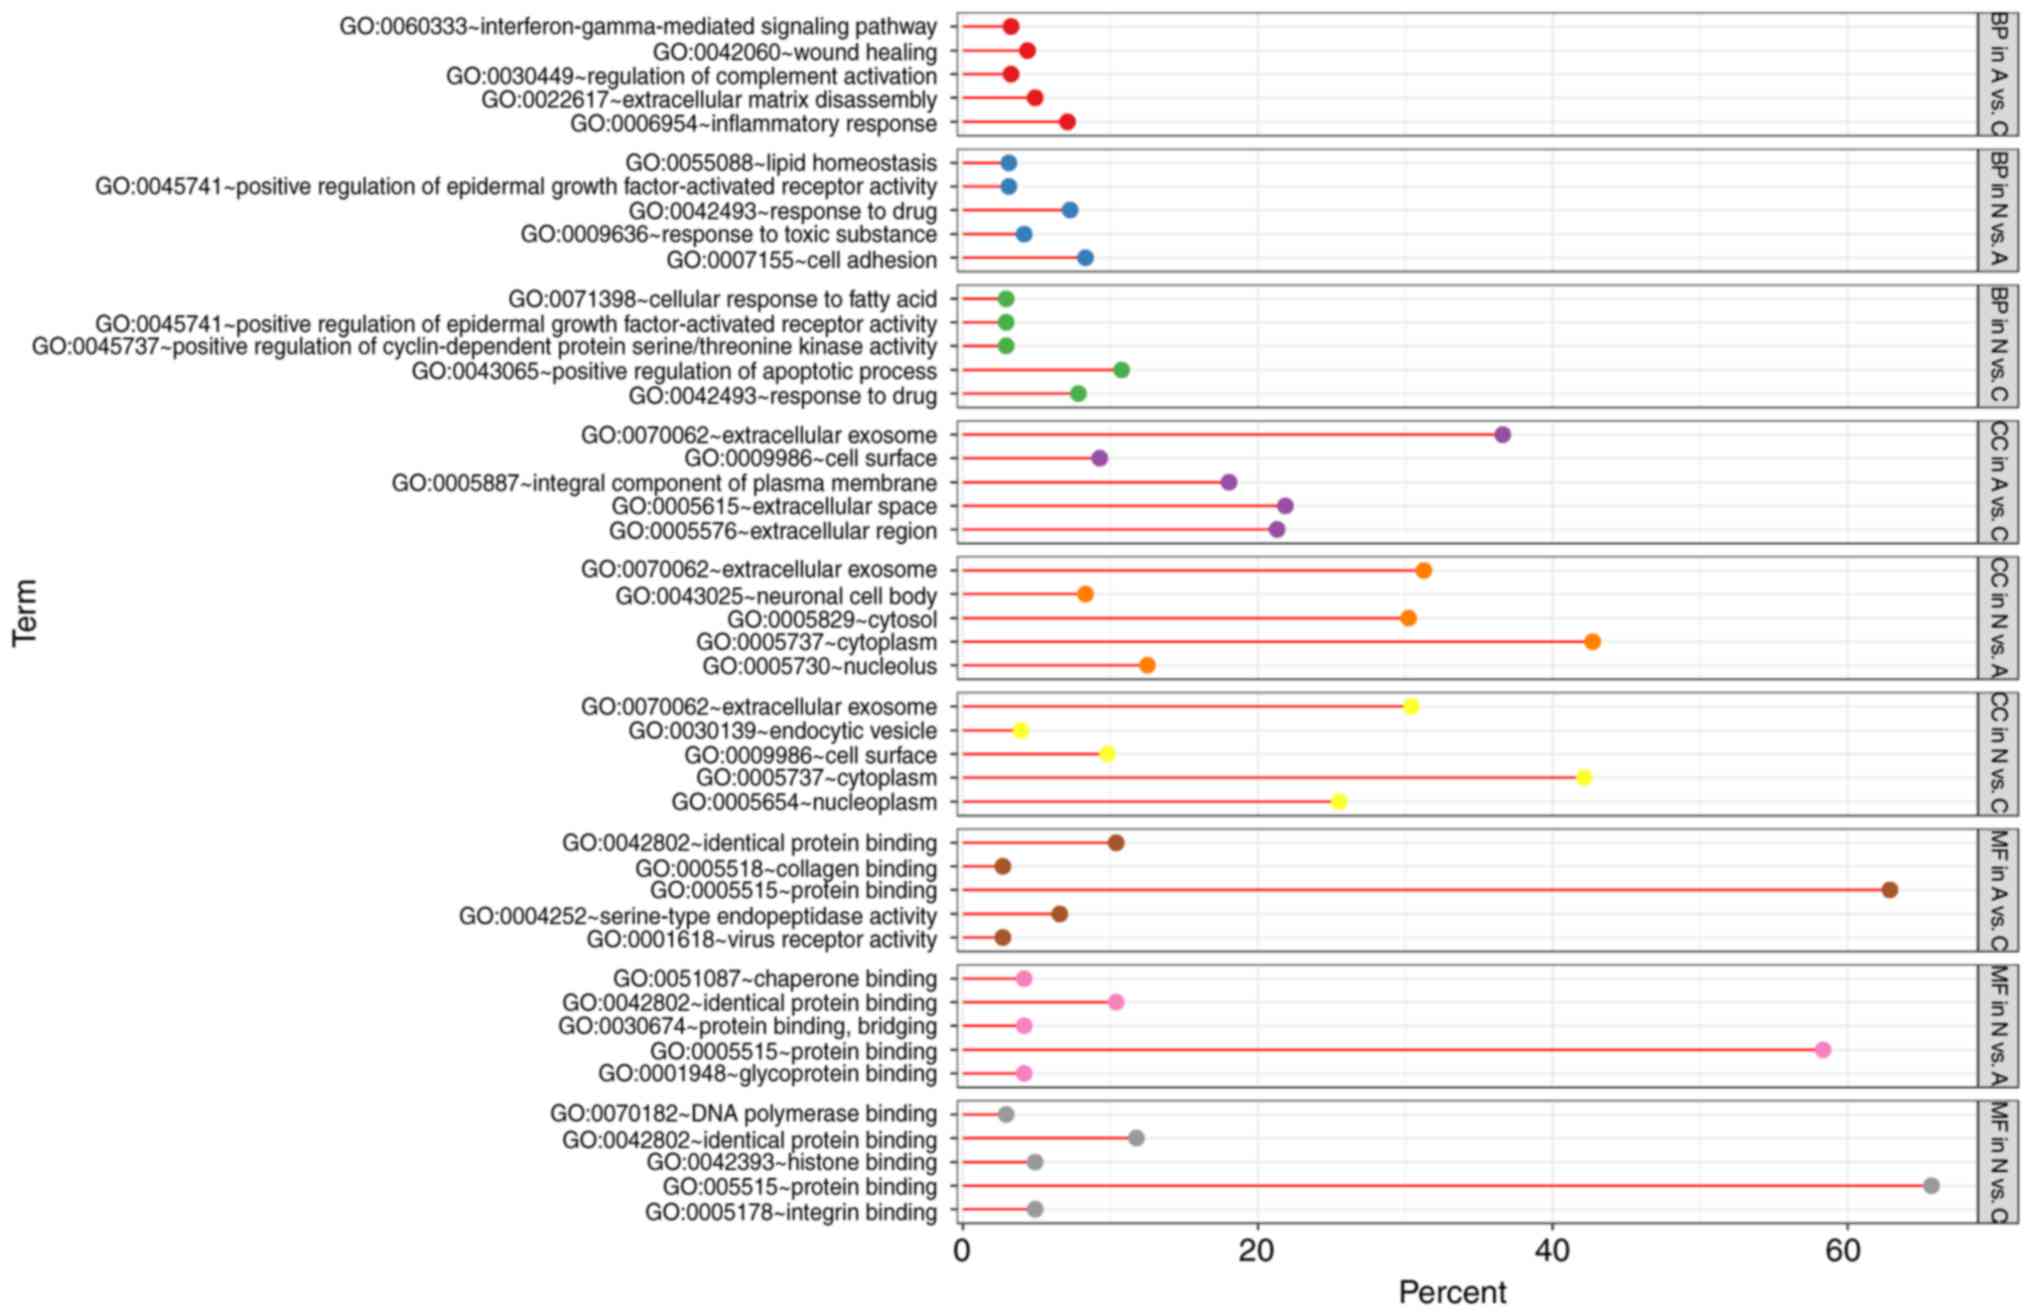
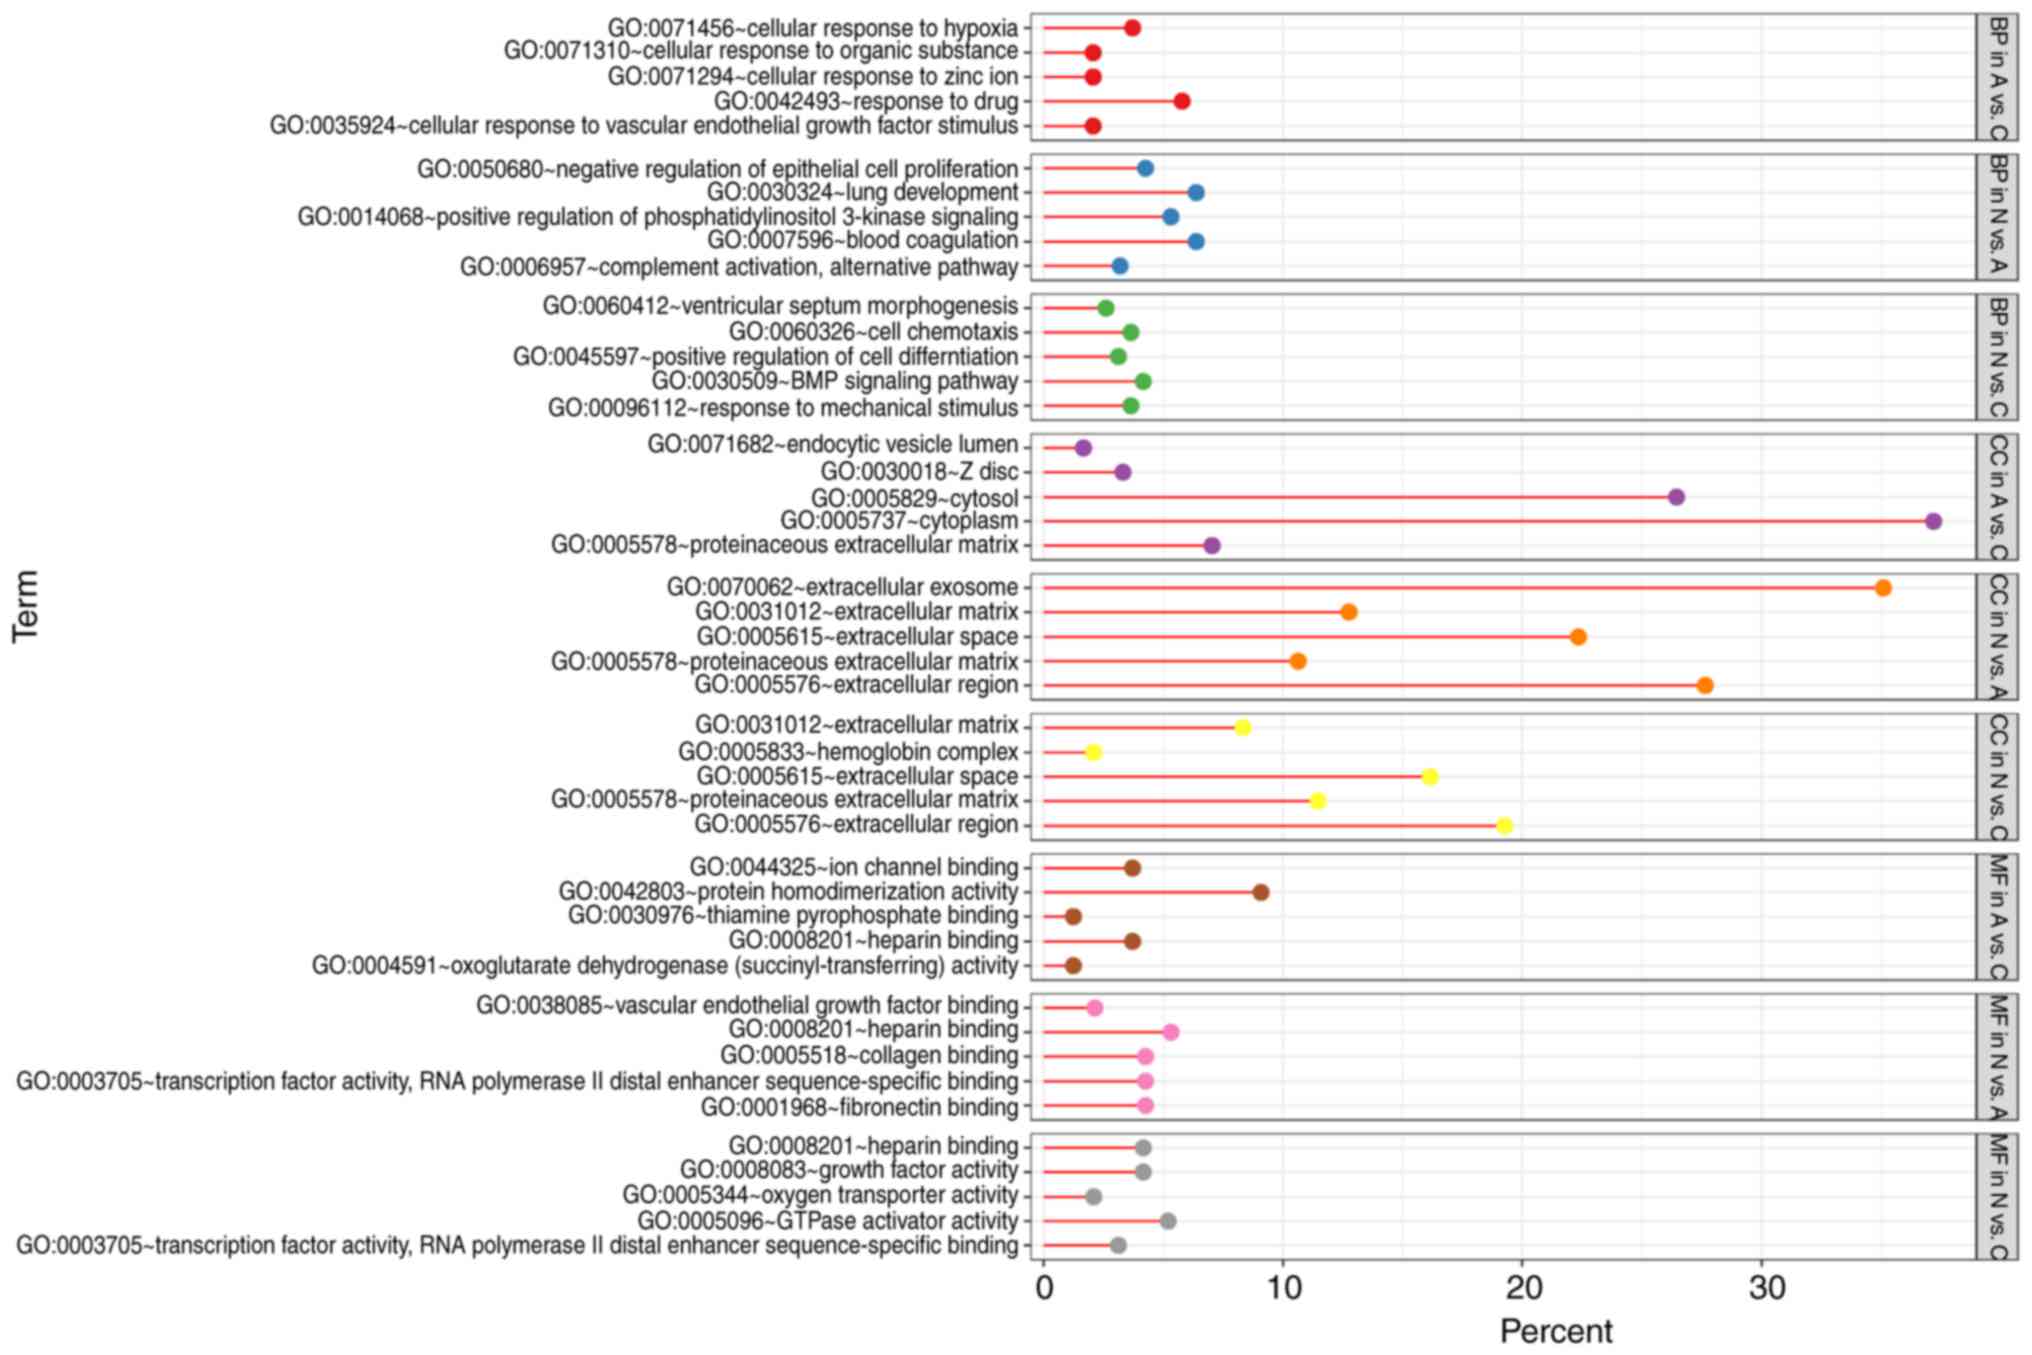
GO term enrichment analysis
With DEGs uploaded to the online tool DAVID, the
upregulated DEGs were significantly enriched in BP, including
positive regulation of epidermal growth factor-activated receptor
activity, response to drug, response to toxic substance, cell
adhesion, and lipid homeostasis in N vs. A; positive regulation of
apoptotic process, positive regulation of epidermal growth
factor-activated receptor activity, response to drug, cellular
response to fatty acid, and positive regulation of cyclin-dependent
protein serine/threonine kinase activity in N vs. C; and positive
regulation of extracellular matrix (ECM) disassembly, regulation of
complement activation, wound healing, inflammatory response, and
the interferon-γ-mediated signaling pathway in A vs. C. The
downregulated DEGs identified using GO analysis were significantly
enriched in lung development, including positive regulation of
phosphatidylinositol 3-kinase signaling, complement activation,
alternative pathway, blood coagulation, and negative regulation of
epithelial cell proliferation in N vs. A; the BMP signaling
pathway, response to mechanical stimulus, positive regulation of
cell differentiation, cell chemotaxis, and ventricular septum
morphogenesis in N vs. C; and cellular response to hypoxia,
cellular response to organic substance, cellular response to zinc
ion, cellular response to vascular endothelial growth factor
stimulus, and response to drug in A vs. C (Figs. 3 and 4).
As for MF, the upregulated DEGs were involved in
glycoprotein binding, protein binding/bridging, chaperone binding,
identical protein binding, and protein binding in N vs. A; protein
binding, DNA polymerase binding, integrin binding, and histone
binding in N vs. C; and serine-type endopeptidase activity,
collagen binding, and virus receptor activity in A vs. C. The
downregulated DEGs were enriched in fibronectin binding, collagen
binding, transcription factor activity, RNA polymerase II distal
enhancer sequence-specific binding, heparin binding, and vascular
endothelial growth factor binding in N vs. A; oxygen transporter
activity, transcription factor activity, RNA polymerase II distal
enhancer sequence-specific binding, heparin binding, growth factor
activity, and GTPase activator activity in N vs. C; and ion channel
binding, protein homodimerization activity, oxoglutarate
dehydrogenase (succinyl-transferring) activity, and thiamine
pyrophosphate binding in A vs. C (Figs.
3 and 4). In addition, GO CC
analysis also showed that the upregulated DEGs were significantly
enriched in extracellular exosome, neuronal cell body, cytoplasm,
cytosol, and nucleolus in N vs. A; extracellular exosome,
cytoplasm, cell surface, endocytic vesicle, and nucleoplasm in N
vs. C; and extracellular exosome, extracellular space,
extracellular region, integral component of plasma membrane, and
cell surface in A vs. C. Downregulated DEGs were enriched in
extracellular region, ECM, extracellular exosome, extracellular
space, and proteinaceous ECM in N vs. A; proteinaceous ECM,
extracellular region, extracellular space, and hemoglobin complex
in N vs. C; and proteinaceous zecm, cytosol, Z disc, endocytic
vesicle lumen, and cytoplasm in A vs. C (Figs. 3 and 4).
KEGG pathway annotation
Table I lists the
most significantly enriched pathways of the upregulated and
downregulated DEGs analyzed with KEGG analysis. The DEGs were
annotated as an enrichment in ECM-receptor interaction, focal
adhesion, protein digestion and absorption, complement and
coagulation cascades, and the cAMP signaling pathway in N vs. A;
and transcriptional misregulation in cancer and tyrosine metabolism
in N vs. C. In addition, the DEGs were enriched in complement and
coagulation cascades, proteoglycans in cancer, microRNAs in cancer,
thyroid hormone synthesis, thyroid hormone signaling pathway, and
the Rap1 signaling pathway in A vs. C.
 | Table I.KEGG pathways enriched with DEGs of N
vs. A, N vs. C, and A vs. C. |
Table I.
KEGG pathways enriched with DEGs of N
vs. A, N vs. C, and A vs. C.
| Term | Group | Up/down
regulated | Count | % | P-value | Entrez gene ID | Fold
enrichment | Bonferroni | Benjamini | FDR |
|---|
|
hsa04512:ECM-receptor interaction | N vs. A | Up | 5 | 5.21 | 0.004292243 | 3918, 1282, 1284,
7450, 6382 | 7.354193274 | 0.473192807 | 0.473192807 | 5.001337745 |
| hsa04510:Focal
adhesion | N vs. A | Up | 6 | 6.25 | 0.020191824 | 3918, 1282, 8503,
1284, 2002, 7450 | 3.727076591 | 0.952135026 | 0.636916977 | 21.5971279 |
| hsa05222:Small cell
lung cancer | N vs. A | Up | 4 | 4.17 | 0.027067112 | 3918, 1282, 8503,
1284 | 6.021786492 | 0.983237079 | 0.558561771 | 27.91339933 |
| hsa04610:Complement
and coagulation cascades | N vs. A | Down | 5 | 5.32 | 7.66E-04 | 7035, 1675, 715,
3075, 730 | 11.64475902 | 0.0737502 | 0.0737502 | 0.846730468 |
| hsa04024:cAMP
signaling pathway | N vs. A | Down | 5 | 5.32 | 0.031337025 | 1909, 3725, 5348,
6262, 6662 | 4.058022081 | 0.958574286 | 0.796466922 | 29.76946113 |
| hsa00982:Drug
metabolism-cytochrome P450 | N vs. C | Down | 3 | 3.19 | 0.063860849 | 125, 2327,
2949 | 7.089603283 | 0.998638427 | 0.807907585 | 51.92743956 |
| hsa05203:Viral
carcinogenesis | N vs. C | Up | 6 | 5.88 | 0.043011299 | 6714, 121504, 581,
87, 5902, 896 | 3.064301552 | 0.997876983 | 0.997876983 | 40.47226822 |
| hsa00350:Tyrosine
metabolism | N vs. C | Down | 3 | 1.56 | 0.053641868 | 125, 316, 3081 | 7.897142857 | 0.999414543 | 0.999414543 | 47.60595747 |
| hsa05030:Cocaine
addiction | N vs. C | Down | 3 | 1.56 | 0.096458334 | 3725, 2905,
2354 | 5.640816327 | 0.99999887 | 0.998937075 | 69.55265629 |
|
hsa04060:Cytokine-cytokine receptor
interaction | N vs. C | Down | 6 | 3.13 | 0.099426908 | 6387, 3590, 6366,
3815, 2690, 4982 | 2.403478261 | 0.999999275 | 0.991018404 | 70.7049881 |
| hsa04610:Complement
and coagulation cascades | A vs. C | Up | 8 | 4.37 | 4.58E-05 | 718, 3426, 5627,
3075, 629, 5265, 1604, 5328 | 8.175096125 | 0.007482548 | 0.007482548 | 0.055516901 |
|
hsa05205:Proteoglycans in cancer | A vs. C | Up | 11 | 6.01 | 4.63E-04 | 595, 2065, 8323,
4060, 7074, 2335, 1634, 960, 4233, 7474, 5328 | 3.878061224 | 0.073089834 | 0.024982191 | 0.559605893 |
| hsa04115:p53
signaling pathway | A vs. C | Up | 5 | 2.73 | 0.014250559 | 595, 2810, 64065,
637, 894 | 5.261955528 | 0.905002436 | 0.324510279 | 15.97387522 |
| hsa04918:Thyroid
hormone synthesis | A vs. C | Down | 6 | 2.48 | 0.008755536 | 7849, 5578, 3708,
5172, 7173, 2778 | 4.663667042 | 0.823146922 | 0.579460968 | 10.41228645 |
| hsa04015:Rap1
signaling pathway | A vs. C | Down | 10 | 4.13 | 0.014252214 | 5909, 5578, 3397,
2321, 3791, 3815, 2778, 5228, 83660, 9223 | 2.590926134 | 0.940862276 | 0.61039768 | 16.42925112 |
|
hsa04925:Aldosterone synthesis and
secretion | A vs. C | Down | 6 | 2.48 | 0.015829909 | 3777, 3164, 5578,
3708, 4929, 2778 | 4.030329542 | 0.956865767 | 0.544272203 | 18.08627865 |
PPI network and the most enriched
clusters
Based on the PPI network derived from the STRING
database and node parameters (gene symbols, P-values and FCs) from
GEO, the MCODE app in Cytoscape provided us with significant
clusters in the three comparison groups. In N vs. A, four genes
made up the most significant cluster (hub): Insulin-like growth
factor 2 (IGF2), Von Willebrand factor (VWF), multimerin 1 (MMRN1)
and complement factor D (CFD). In N vs. C, the most significant
cluster had 19 genes: IGF2, early growth response 2 (EGR2),
transcription factor 3 (TCF3), KIT proto-oncogene receptor tyrosine
kinase (KIT), SMAD family member 9 (SMAD9), MLLT3 super elongation
complex subunit (MLLT3), runt related transcription factor 1
(RUNX1), CFD, actinin α 1 (ACTN1), SWI/SNF related matrix
associated actin dependent regulator of chromatin subfamily a
member 4 (SMARCA4), JunD proto-oncogene, AP-1 transcription factor
subunit (JUND), serum response factor (SRF), FosB proto-oncogene,
AP-1 transcription factor subunit (FOSB), connective tissue growth
factor (CTGF), SRC proto-oncogene, non-receptor tyrosine kinase
(SRC), MMRN1, SRY-box 9 (SOX9), early growth response 3 (EGR3) and
ETS variant 4 (ETV4). In A vs. C, the most significant cluster had
14 genes: BCL2-like 1 (BCL2L1), galectin 3 (LGALS3), MCL1 BCL2
family apoptosis regulator (MCL1), DNA damage inducible transcript
3 (DDIT3), BCL2 apoptosis regulator (BCL2), CTGF, matrix
metallopeptidase 7 (MMP7), early growth response 1 (EGR1), kinase
insert domain receptor (KDR), TIMP metallopeptidase inhibitor 1
(TIMP1), apolipoprotein E (APOE), VWF, cyclin D1 (CCND1) and
placental growth factor (PGF). A representative image of A vs. N
comparison is demonstrated in Fig.
2B and all of the genes are listed in Table II.
| Table II.Hub genes in N vs. A, N vs. C and A
vs. C comparisons. |
Table II.
Hub genes in N vs. A, N vs. C and A
vs. C comparisons.
| Cluster | Score | Nodes | Edges | Hub genes |
|---|
| N vs. A Cluster
1 | 4 | 4 | 6 | IGF2, VWF, MMRN1,
CFD |
| N vs. A Cluster
2 | 3 | 3 | 3 | PROX1, PDPN,
LYVE1 |
| N vs. A Cluster
3 | 3 | 3 | 3 | EDNRA, GNA11,
GPR4 |
| N vs. A Cluster
4 | 3 | 3 | 3 | BAIAP2, ELMO2,
CYFIP2 |
| N vs. C Cluster
1 | 5.222 | 19 | 47 | IGF2, EGR2, TCF3,
KIT, SMAD9, MLLT3, RUNX1, CFD, ACTN1, SMARCA4, JUND, SRF, FOSB,
CTGF, SRC, MMRN1, SOX9, EGR3, ETV4 |
| N vs. C Cluster
2 | 5 | 5 | 10 | HBA2, HBG2, HBA1,
HBB, HBD |
| N vs. C Cluster
3 | 4.5 | 5 | 9 | RERGL, OGN, DIRAS2,
OMD, FMOD |
| N vs. C Cluster
4 | 3 | 5 | 6 | GRIN2C, FGFR2,
DUSP4, GRIN1, CARD10 |
| A vs. C Cluster
1 | 8 | 14 | 52 | BCL2L1, LGALS3,
MCL1, DDIT3, BCL2, CTGF, MMP7, EGR1, KDR, TIMP1, APOE, VWF, CCND1,
PGF |
| A vs. C Cluster
2 | 7 | 11 | 35 | FOXO1, MET, CCND2,
KIT, STAT1, FOS, JUN, RUNX1, MDK, FLT1, ERBB3 |
| A vs. C Cluster
3 | 5 | 5 | 10 | BDKRB2, C3, ANXA1,
NMU, CCR5 |
| A vs. C Cluster
4 | 4.5 | 5 | 9 | LUM, PDE5A, PDE10A,
FMOD, LRRC2 |
Clinical relevance of identified
genes
BCL2L1, LGALS3, MCL1, DDIT3, BCL2, MMP7, KDR, TIMP1,
APOE, CCND1 and PGF demonstrated different expression levels in A
vs. C. TCF3, SMAD9, ACTN1, JUND, SRF, SRC, EGR3 and ETV4 were
differentially expressed in N vs. C. IGF2, MMRN1, CFD, SMARCA4 and
SOX9 were significantly different in N vs. A and N vs. C. EGR2,
KIT, MLLT3, RUNX1, FOSB, CTGF and EGR1 were significantly different
in N vs. C and A vs. C. VWF was significantly different in N vs. A
and A vs. C. Of the 19 hub genes in N vs. C, 60% (11/19), including
KIT (P=6.73×10−04), SMAD9 (P=1.56×10−02),
RUNX1 (P=1.86×10−02), ACTN1 (P=4.15×10−02),
JUND (P=3.56×10−02), SRF (P=1.95×10−02), FOSB
(P=2.94×10−02), CTGF (P=1.14×10−02), MMRN1
(P=8.32×10−09), SOX9 (P=3.32×10−02) and ETV4
(P=6.49×10−03), that performed well
(R2=0.520) in the histology analysis was explored, and
the results of KIT and SMAD9 expression in NT and TC are shown in
Fig. 5. For hubs in the N vs. A and
A vs. C comparisons, the analysis was limited as the samples were
not satisfactory due to no benign neoplasms being available. Thus,
more improved evidence is required to confirm the makeup of the hub
genes in the future.
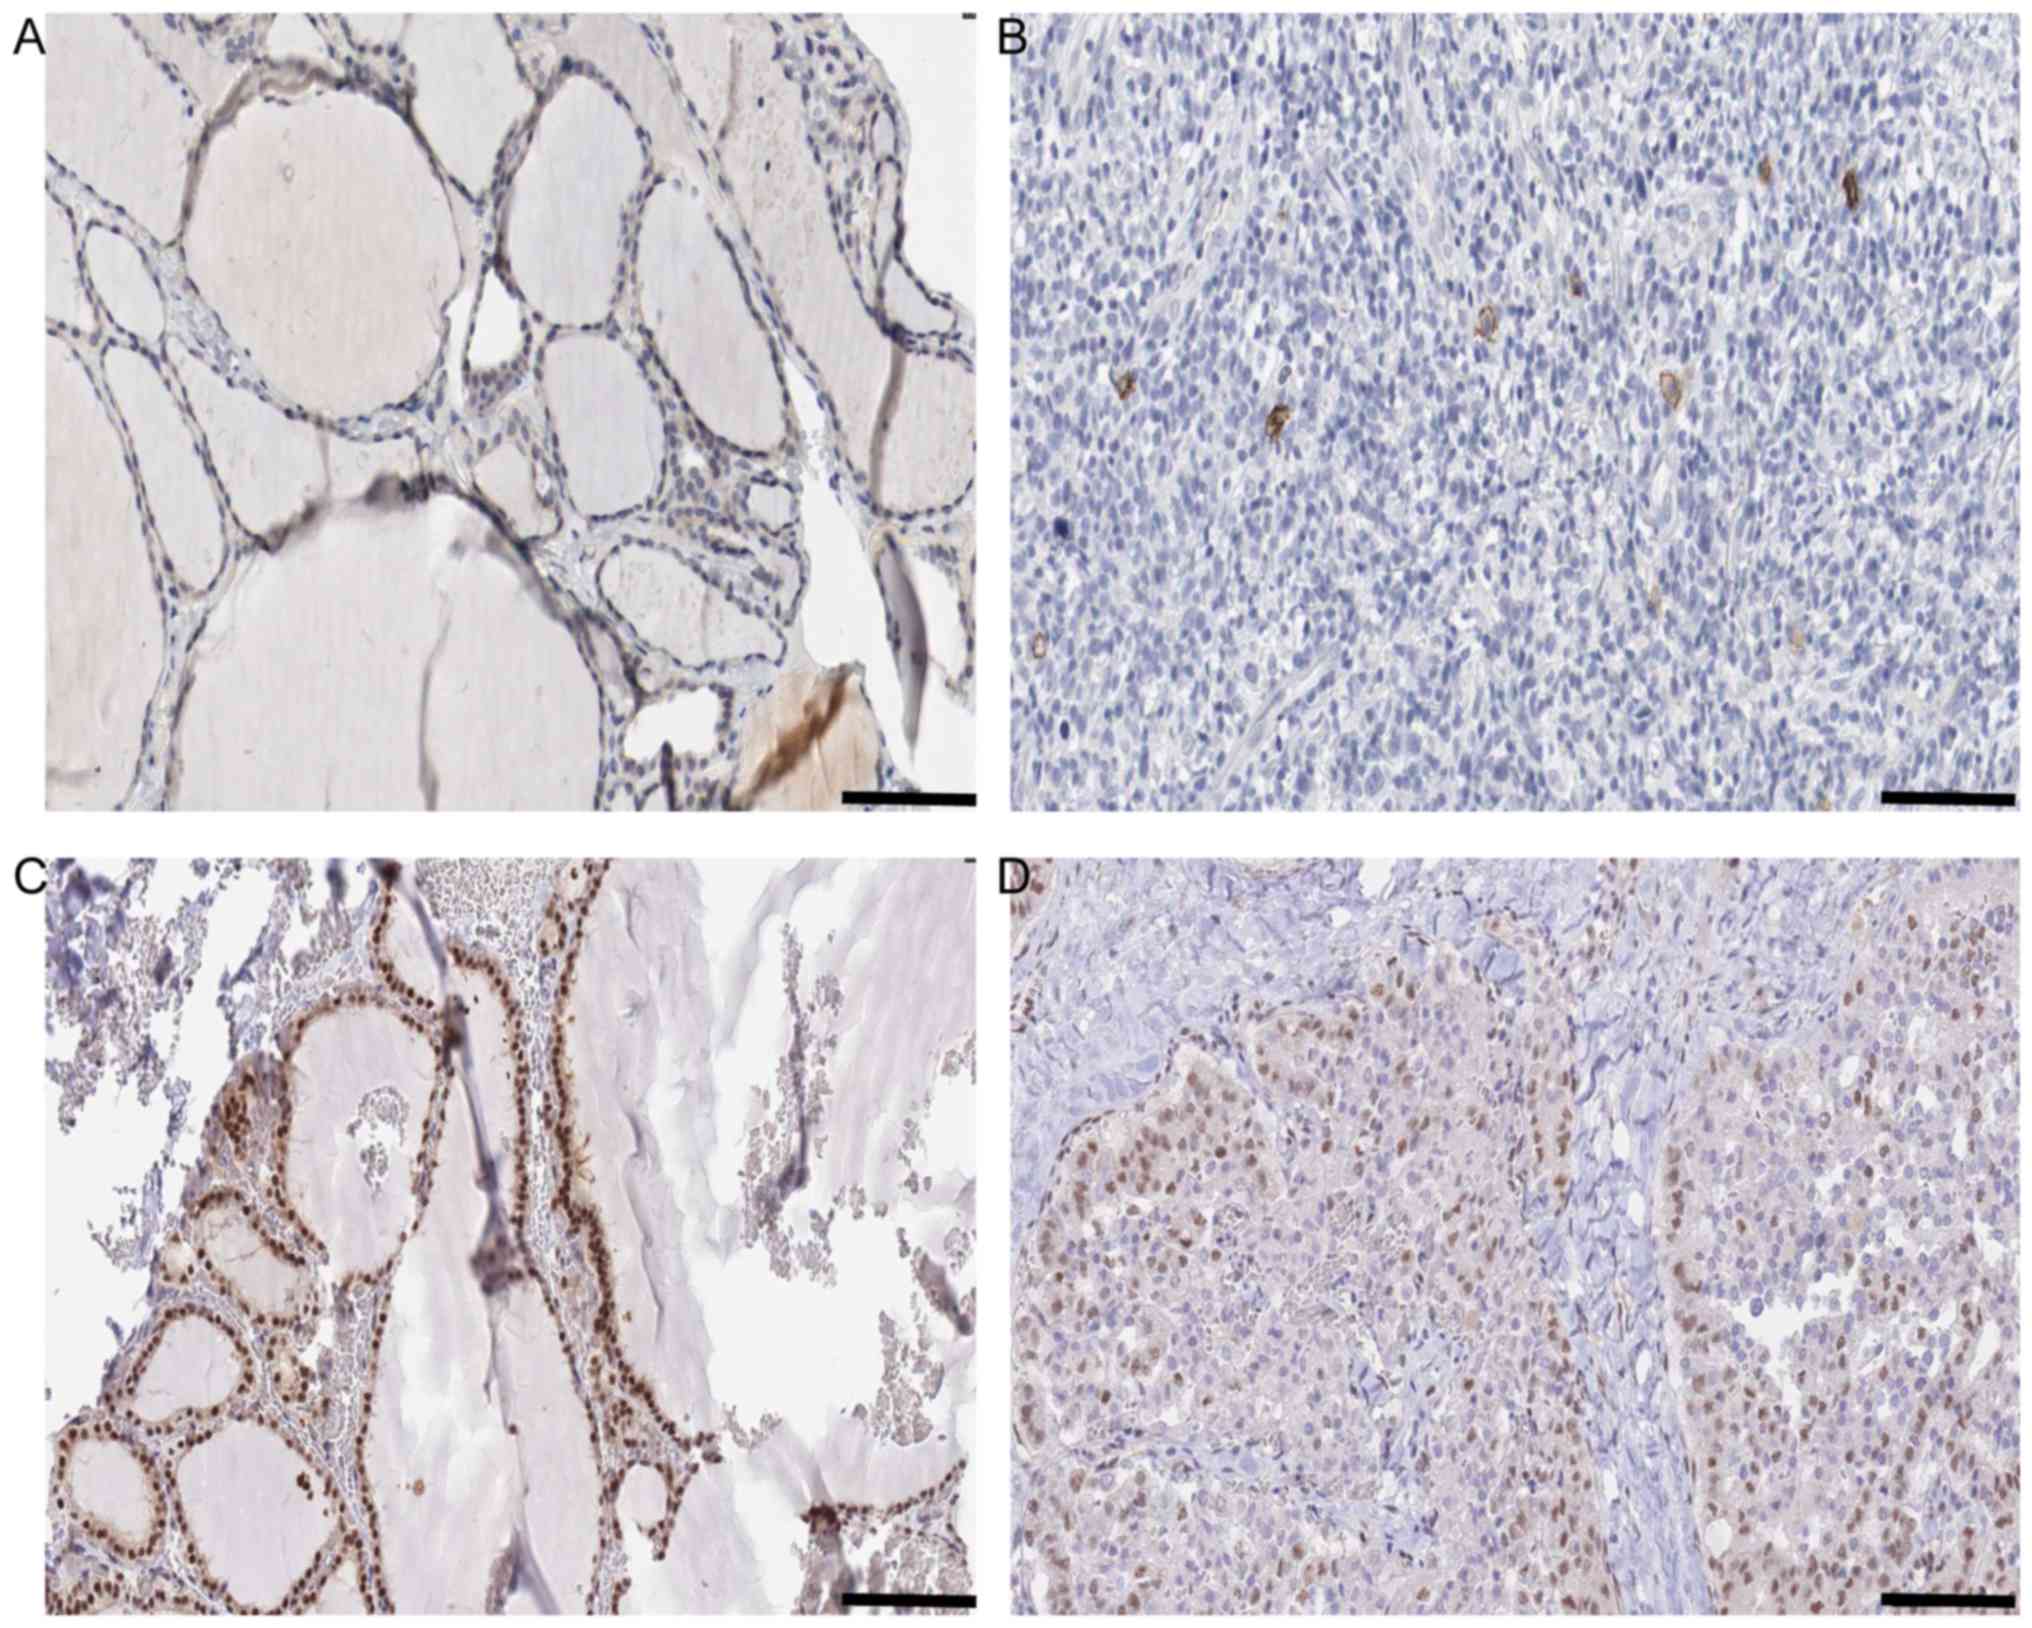 | Figure 5.Histology information of KIT and
SMAD9 in N vs. C comparison. (A) Expression of KIT in N Antibody
(cat. no., HPA004471; Sigma-Aldrich; Merck KGaA, Darmstadt,
Germany). Sex, female; age, 22 years; Patient ID, 2146. Glandular
cells Staining: Low Intensity. Weak Quantity: 75–25%. Location:
Cytoplasmic/membranous. Website: http://www.proteinatlas.org/ENSG00000157404-KIT/tissue/thyroid+gland#img.
(B) Expression of KIT in C Antibody (cat. no., HPA004471;
Sigma-Aldrich; Merck KGaA). Sex, female; age, 77 years; Patient ID,
2479. Staining: Not detected. Intensity: Negative. Quantity:
Negative. Location: None. Website: http://www.proteinatlas.org/ENSG00000157404-KIT/cancer/tissue/thyroid+cancer#img.
(C) Expression of SMAD9 in N Antibody. (cat no., HPA031162;
Sigma-Aldrich; Merck KGaA). Sex, female; age, 39 years; Patient ID,
1948. Staining: High. Intensity: Strong. Quantity: >75%.
Location: Nuclear. Website: http://www.proteinatlas.org/ENSG00000120693-SMAD9/tissue/thyroid+gland#img.
(D) Expression of SMAD9 in C Antibody. (cat. no., HPA031162;
Sigma-Aldrich; Merck KGaA). Sex, male; age, 75 years; Patient ID,
3107. Staining: Medium. Intensity: Moderate. Quantity: >75%.
Location: Nuclear. Website: http://www.proteinatlas.org/ENSG00000120693-SMAD9/cancer/tissue/thyroid+cancer#img.
Scale bar, 100 µm. |
Further analysis of the hub genes in the most
significant clusters in the NT vs. TA comparison indicated that VWF
was a good biomarker of TA. No other gene was an evident biomarker
to differentiate NT from TA as it was hard to isolate TA from TC. A
similar method was used to identify EGR2, KIT, MLLT3, RUNX1, FOSB,
CTGF, BCL2L1, LGALS3, MCL1, DDIT3, BCL2, CTGF, MMP7, EGR1, KDR,
TIMP1, APOE, VWF, CCND1, and PGF.KIT, VWF, BCL2L1, RUNX1, EGR1,
FOSB, LGALS3, KDR, EGR1, CCND1, PGF and DDIT3 were utilized in
logistic regression (stepwise) to predict the trait of a certain
thyroid neoplasm, as shown in Fig.
6A. Logistic regression produced estimates of KIT, VWF, RUNX1,
EGR1 and CCND1 as −0.167 [standard deviation (SD), 0.07556; 95%
confidence interval (CI), −0.3150276 to −0.0188324], −0.360 (SD,
0.10058; 95% CI, −0.5566868 to −0.1624132), 0.144 (SD, 0.06506; 95%
CI, 0.0162424 to 0.2712776), −0.379 (SD, 0.11652; 95% CI,
−0.6068892 to −0.1501308) and 0.273 (SD, 0.09865; 95% CI, 0.079686
to 0.466394), respectively. The area under the curves of KIT, VWF,
RUNX1, EGR1 and CCND1 were 0.8910, 0.8906, 0.796, 0.8024 and 0.7534
respectively, with the receiving operator curve presented in
Fig. 6B.
Discussion
In the present study, gene expression data of 78 TC
samples, 17 TA samples and four normal thyroid epithelial tissues
were extracted from the GEO database via the accession ID GSE27155.
Among the 190 (with 96 upregulated in A), 294 (with 102 upregulated
in C) and 425 (with 183 upregulated in C) DEGs identified between N
vs. A, N vs. C and A vs. C, respectively, GO and KEGG pathway
analyses were performed to gain a more improved understanding of
the DEG interactions. The GO term analysis revealed that
upregulated DEGs were primarily involved in ECM-receptor
interaction, viral carcinogenesis, and complement and coagulation
cascades, while downregulated DEGs were involved in complement and
coagulation cascades, tyrosine metabolism, and thyroid hormone
synthesis. To a certain extent, managing these signaling pathways
may facilitate the manipulation and prediction of tumor
genesis.
As a suitable marker to evaluate acute functional
changes of endothelia, VWF is sensitive to changes in endothelial
function (19). The association
between hyperthyroidism and thromboembolism may be partially
explained by the effects of thyroid hormone on receptors and
transcription factors, which interferes with coagulation-involved
proteins, including VWF, in numerous cell types (19). EGR2, KIT, MLLT3, RUNX1, FOSB and
CTGF were recommended as useful biomarkers in the most enriched
cluster in the N vs. C gene profile comparison. Over a decade ago,
EGR2 was reported as one of the five genes to effectively predict
malignancy with a specificity of 98.5% in the diagnosis of
follicular thyroid carcinoma with logistic regression analysis
(20). Together with the lack of
mutations, the low or absent c-kit expression argued against an
important role of c-kit in undifferentiated thyroid carcinoma cell
proliferation (21), and RUNX1 was
considered one of the 43 most suitable molecular markers in
papillary thyroid carcinoma (22).
Differential induction of Fos family genes represents the
regulation of thyroid cell function by thyroid stimulating hormone
(23).
A total of 14 hub genes, BCL2L1, LGALS3, MCL1,
DDIT3, BCL2, CTGF, MMP7, EGR1, KDR, TIMP1, APOE, VWF, CCND1 and PGF
were identified in the C vs. A comparison. The degree of
upregulation of certain genes, including BCL2L1, has been
associated with increased resistance to chemotherapeutic
treatments, and small interfering RNA targeting BCL2L1 renders
tumor cells sensitive to chemotherapeutic treatments (24,25).
LGALS3 is considered as a discriminative molecular marker in FNA
biopsies of benign and malignant thyroid tumors (26), and MCL1 is an important molecule in
the inhibition of chemotherapy-induced apoptosis by thyroid hormone
(T4) in αvβ3-expressing cancer cells (27). In the pathogenesis of FTC, a
previous study indicated that DDIT3 was involved (28). Thyroid anaplastic carcinoma has been
demonstrated to exhibit downregulated BCL2 expression compared with
differentiated thyroid tumors, indicating that the loss of BCL2 is
associated with the loss of differentiation in thyroid carcinoma.
Thyroid anaplastic carcinoma appeared to be worse in prognosis
compared with other subtypes of thyroid carcinoma, and the loss of
BCL2 may be partially responsible (29). The In-Space FTC-133 human follicular
thyroid cancer cell experiment revealed a scaffold-free formation
of extraordinarily large three-dimensional aggregates of thyroid
cancer cells with an altered CTGF gene under real microgravity
(30). KDR is a key TKI target
protein, and TIMP1 mRNA expression was demonstrated to be an
independent diagnostic marker of malignant thyroid neoplasms
(31,32). A study in 2011 suggested that the
CCND1 gene serves an early role in thyroid tumorigenesis (33). PGF expression is associated with
iodide medium and may interfere with human thyroid follicles
(34). Little is known about the
roles of MMP7, EGR1 and APOE in human thyroid disorders, and these
genes may be false positives.
There are certain limitations of the present study.
Firstly, the relatively small sample size indicates that these
potential biomarkers require further assessment prior to
consideration of the widespread practical application. In other
words, the findings of a study using historical controls from a
particular geographical region may not be applicable to newer
cohorts of patients or different regions. Secondly, relying on few
clinical samples as histological evidence is not robust. Lastly, an
assessment of the association of potential biomarkers with other
clinical characteristics, including age, sex and the stage of
disease, is required. Four accessible clinical characteristics were
used in the present study, including ret/ptc translocation, braf
t1799a mutation, pax8/pparg translocation and kras, nras or hras
mutation. However, it should be acknowledged that innate bias may
exist for the lack of age, sex, and the stage of disease
information.
To conclude, gene expression profiles of cancer
cells in patients with TA or TC were compared with normal
epithelial cells to identify DEGs, generating three pairwise
comparison tables. Subsequently, GEO2R-screened DEGs were
characterized using GO and pathway enrichment analysis. Further
characterization of their biological functions and pathways may
shed light on the general development of thyroid neoplasm at the
molecular level, and identify biomarkers for differential diagnosis
and drug targets, eventually leading to novel thyroid cancer
therapies.
Acknowledgements
Not applicable.
Funding
The present study was supported by grants from the
National Natural Science Foundation of China (grant nos. 81271088
and 81670926) and from the Science and Technology Commission of
Shanghai Municipality, China (grant nos. 15411950303 and
14DZ2260300).
Availability of data and materials
The datasets used and/or analyzed during the current
study including not shown data are available from the corresponding
author on reasonable request.
Authors' contributions
MX and YM conceived the present study. MX, QW and YS
designed the experiments. QW, YS and BY wrote the manuscript. MX
provided platform supports. QW, HH, YZ and JL performed the
experiments. QW, BY, HH, TW and CF analyzed the data. All authors
read and approved the final manuscript.
Ethics approval and consent to
participate
Not applicable.
Patient consent for publication
Not applicable.
Competing interests
The authors declare that they have no competing
interests.
Glossary
Abbreviations
Abbreviations:
|
A/TA
|
thyroid adenoma
|
|
ACTN1
|
actinin α 1
|
|
APOE
|
apolipoprotein E
|
|
AUS/FLUS
|
atypia of undetermined
significance/follicular lesion of undetermined significance
|
|
BCL2
|
BCL2 apoptosis regulator
|
|
BCL2L1
|
BCL2-like 1
|
|
BP
|
biological process
|
|
CC
|
cellular component
|
|
CCND1
|
cyclin D1
|
|
C/TC
|
thyroid carcinoma
|
|
CFD
|
complement factor D
|
|
CTGF
|
connective tissue growth factor
|
|
DDIT3
|
DNA damage inducible transcript 3
|
|
DEG
|
differentially expressed gene
|
|
EGR1
|
early growth response 1
|
|
EGR2
|
early growth response 2
|
|
EGR3
|
early growth response 3
|
|
ETV4
|
ETS variant 4
|
|
FNA
|
fine-needle aspiration
|
|
FN/SFN
|
follicular or oncocytic
neoplasm/suspicious for a follicular or oncocytic neoplasm
|
|
FOSB
|
FosB proto-oncogene, AP-1
transcription factor subunit
|
|
GEO
|
Gene Expression Omnibus
|
|
GO
|
Gene Ontology
|
|
JUND
|
JunD proto-oncogene, AP-1
transcription factor subunit
|
|
KDR
|
kinase insert domain receptor
|
|
KEGG
|
Kyoto Encyclopedia of Genes and
Genomes
|
|
KIT
|
KIT proto-oncogene receptor tyrosine
kinase
|
|
IGF2
|
insulin-like growth factor 2
|
|
LGALS3
|
galectin 3
|
|
MCL1
|
MCL1 BCL2 family apoptosis
regulator
|
|
MCODE
|
Molecular Complex Detection
|
|
MF
|
molecular function
|
|
MLLT3
|
MLLT3 super elongation complex
subunit
|
|
MMP7
|
matrix metallopeptidase 7
|
|
MMRN1
|
multimerin 1
|
|
N/NT
|
normal tissue
|
|
PGF
|
placental growth factor
|
|
RUNX1
|
runt related transcription factor
1
|
|
SMAD9
|
SMAD family member 9
|
|
SMARCA4
|
SWI/SNF related, matrix associated,
actin dependent regulator of chromatin, subfamily a, member 4
|
|
SOX9
|
SRY-box 9
|
|
SRC
|
SRC proto-oncogene, non-receptor
tyrosine kinase
|
|
SRF
|
serum response factor
|
|
STRING
|
Search Tool for the Retrieval of
Interacting Genes
|
|
TCF3
|
transcription factor 3
|
|
TIMP1
|
TIMP metallopeptidase inhibitor 1
|
|
VWF
|
von Willebrand factor
|
References
|
1
|
Rahib L, Smith BD, Aizenberg R, Rosenzweig
AB, Fleshman JM and Matrisian LM: Projecting cancer incidence and
deaths to 2030: The unexpected burden of thyroid, liver, and
pancreas cancers in the United States. Cancer Res. 74:2913–2921.
2014. View Article : Google Scholar : PubMed/NCBI
|
|
2
|
Lim H, Devesa SS, Sosa JA, Check D and
Kitahara CM: Trends in Thyroid Cancer Incidence and Mortality in
the United States, 1974–2013. JAMA. 317:1338–1348. 2017. View Article : Google Scholar : PubMed/NCBI
|
|
3
|
Xing M: Molecular pathogenesis and
mechanisms of thyroid cancer. Nat Rev Cancer. 13:184–199. 2013.
View Article : Google Scholar : PubMed/NCBI
|
|
4
|
Renuka IV, Bala Saila G, Aparna C, Kumari
R and Sumalatha K: The bethesda system for reporting thyroid
cytopathology: Interpretation and guidelines in surgical treatment.
Indian J Otolaryngol Head Neck Surg. 64:305–311. 2012. View Article : Google Scholar : PubMed/NCBI
|
|
5
|
Baloch ZW, LiVolsi VA, Asa SL, Rosai J,
Merino MJ, Randolph G, Vielh P, DeMay RM, Sidawy MK and Frable WJ:
Diagnostic terminology and morphologic criteria for cytologic
diagnosis of thyroid lesions: A synopsis of the National Cancer
institute thyroid fine-needle aspiration state of the science
conference. Diagn Cytopathol. 36:425–437. 2008. View Article : Google Scholar : PubMed/NCBI
|
|
6
|
Gharib H: Changing trends in thyroid
practice: Understanding nodular thyroid disease. Endocr Pract.
10:31–39. 2004. View Article : Google Scholar : PubMed/NCBI
|
|
7
|
Sclabas GM, Staerkel GA, Shapiro SE,
Fornage BD, Sherman SI, Vassillopoulou-Sellin R, Lee JE and Evans
DB: Fine-needle aspiration of the thyroid and correlation with
histopathology in a contemporary series of 240 patients. Am J Surg.
186:702–710. 2003. View Article : Google Scholar : PubMed/NCBI
|
|
8
|
Nikiforov YE, Carty SE, Chiosea SI, Coyne
C, Duvvuri U, Ferris RL, Gooding WE, Hodak SP, LeBeau SO, Ohori NP,
et al: Highly accurate diagnosis of cancer in thyroid nodules with
follicular neoplasm/suspicious for a follicular neoplasm cytology
by ThyroSeq v2 next-generation sequencing assay. Cancer.
120:3627–3634. 2014. View Article : Google Scholar : PubMed/NCBI
|
|
9
|
Lin HS, Komisar A, Opher E and Blaugrund
SM: Follicular variant of papillary carcinoma: The diagnostic
limitations of preoperative fine-needle aspiration and
intraoperative frozen section evaluation. Laryngoscope.
110:1431–1436. 2000. View Article : Google Scholar : PubMed/NCBI
|
|
10
|
Labourier E, Shifrin A, Busseniers AE,
Lupo MA, Manganelli ML, Andruss B, Wylie D and Beaudenon-Huibregtse
S: Molecular Testing for miRNA, mRNA, and DNA on Fine-Needle
aspiration improves the preoperative diagnosis of thyroid nodules
with indeterminate cytology. J Clin Endocrinol Metab.
100:2743–2750. 2015. View Article : Google Scholar : PubMed/NCBI
|
|
11
|
Griffith OL, Melck A, Jones SJM and
Wiseman SM: Meta-analysis and meta-review of thyroid cancer gene
expression profiling studies identifies important diagnostic
biomarkers. J Clin Oncol. 24:5043–5051. 2006. View Article : Google Scholar : PubMed/NCBI
|
|
12
|
Giordano TJ, Au AY, Kuick R, Thomas DG,
Rhodes DR, Wilhelm KG Jr, Vinco M, Misek DE, Sanders D, Zhu Z, et
al: Delineation, functional validation, and bioinformatic
evaluation of gene expression in thyroid follicular carcinomas with
the PAX8-PPARG translocation. Clin Cancer Res. 12:1983–1993. 2006.
View Article : Google Scholar : PubMed/NCBI
|
|
13
|
Giordano TJ, Kuick R, Thomas DG, Misek DE,
Vinco M, Sanders D, Zhu Z, Ciampi R, Roh M, Shedden K, et al:
Molecular classification of papillary thyroid carcinoma: distinct
BRAF, RAS, and RET/PTC mutation-specific gene expression profiles
discovered by DNA microarray analysis. Oncogene. 24:6646–6656.
2005. View Article : Google Scholar : PubMed/NCBI
|
|
14
|
Gene Ontology Consortium: The Gene
Ontology (GO) project in 2006. Nucleic Acids Res. 34:D322–D326.
2006. View Article : Google Scholar : PubMed/NCBI
|
|
15
|
Ashburner M, Ball CA, Blake JA, Botstein
D, Butler H, Cherry JM, Davis AP, Dolinski K, Dwight SS, Eppig JT,
et al: Gene ontology: Tool for the unification of biology. The Gene
Ontology Consortium. Nat Genet. 25:25–29. 2000. View Article : Google Scholar : PubMed/NCBI
|
|
16
|
Kanehisa M and Goto S: KEGG: kyoto
encyclopedia of genes and genomes. Nucleic Acids Res. 28:27–30.
2000. View Article : Google Scholar : PubMed/NCBI
|
|
17
|
Dennis G Jr, Sherman BT, Hosack DA, Yang
J, Gao W, Lane HC and Lempicki RA: DAVID: Database for annotation,
visualization, and integrated discovery. Genome Biol. 4:P32003.
View Article : Google Scholar : PubMed/NCBI
|
|
18
|
Shannon P, Markiel A, Ozier O, Baliga NS,
Wang JT, Ramage D, Amin N, Schwikowski B and Ideker T: Cytoscape: A
software environment for integrated models of biomolecular
interaction networks. Genome Res. 13:2498–2504. 2003. View Article : Google Scholar : PubMed/NCBI
|
|
19
|
Burggraaf J, Lalezari S, Emeis JJ, Vischer
UM, de Meyer PH, Pijl H and Cohen AF: Endothelial function in
patients with hyperthyroidism before and after treatment with
propranolol and thiamazol. Thyroid. 11:153–160. 2001. View Article : Google Scholar : PubMed/NCBI
|
|
20
|
Foukakis T, Gusnanto A, Au AY, Höög A, Lui
WO, Larsson C, Wallin G and Zedenius J: A PCR-based expression
signature of malignancy in follicular thyroid tumors. Endocr Relat
Cancer. 14:381–391. 2007. View Article : Google Scholar : PubMed/NCBI
|
|
21
|
Mullighan CG, Goorha S, Radtke I, Miller
CB, Coustan-Smith E, Dalton JD, Girtman K, Mathew S, Ma J, Pounds
SB, et al: Genome-wide analysis of genetic alterations in acute
lymphoblastic leukaemia. Nature. 446:758–764. 2007. View Article : Google Scholar : PubMed/NCBI
|
|
22
|
Vella V, Pandini G, Sciacca L, Mineo R,
Vigneri R, Pezzino V and Belfiore A: A novel autocrine loop
involving IGF-II and the insulin receptor isoform-A stimulates
growth of thyroid cancer. J Clin Endocrinol Metab. 87:245–254.
2002. View Article : Google Scholar : PubMed/NCBI
|
|
23
|
Kambe F, Miyazaki T and Seo H:
Differential induction of fos and jun family genes by thyrotropin
in rat thyroid FRTL-5 cells. Thyroid. 6:123–128. 1996. View Article : Google Scholar : PubMed/NCBI
|
|
24
|
Kim SJ, Kim JS, Park ES, Lee JS, Lin Q,
Langley RR, Maya M, He J, Kim SW, Weihua Z, et al: Astrocytes
upregulate survival genes in tumor cells and induce protection from
chemotherapy. Neoplasia. 13:286–298. 2011. View Article : Google Scholar : PubMed/NCBI
|
|
25
|
Lee BS, Cha HY, Shin YS, Kim YS and Kim
CH: AY4, an agonistic anti-death receptor 4 MAB, induces apoptotic
cell death in anaplastic thyroid cancer cells via downregulation of
Bcl-xL with reactive oxygen species generation. Endocr Relat
Cancer. 20:283–291. 2013. View Article : Google Scholar : PubMed/NCBI
|
|
26
|
Karger S, Krause K, Gutknecht M, Schierle
K, Graf D, Steinert F, Dralle H and Führer D: ADM3, TFF3 and LGALS3
are discriminative molecular markers in fine-needle aspiration
biopsies of benign and malignant thyroid tumours. Br J Cancer.
106:562–568. 2012. View Article : Google Scholar : PubMed/NCBI
|
|
27
|
Lin HY, Glinsky GV, Mousa SA and Davis PJ:
Thyroid hormone and anti-apoptosis in tumor cells. Oncotarget.
6:14735–14743. 2015.PubMed/NCBI
|
|
28
|
Maciel RMB, Kimura ET and Cerutti JM:
Pathogenesis of differentiated thyroid cancer (papillary and
follicular). Arq Bras Endocrinol Metabol. 49:691–700. 2005.(In
Portuguese). View Article : Google Scholar : PubMed/NCBI
|
|
29
|
Gupta A, Jain S, Khurana N and Kakar AK:
Expression of p63 and Bcl-2 in malignant thyroid tumors and their
correlation with other diagnostic immunocytochemical markers. J
Clin Diagn Res. 10:EC04–EC08. 2016.PubMed/NCBI
|
|
30
|
Pietsch J, Ma X, Wehland M, Aleshcheva G,
Schwarzwälder A, Segerer J, Birlem M, Horn A, Bauer J, Infanger M,
et al: Spheroid formation of human thyroid cancer cells in an
automated culturing system during the Shenzhou-8 Space mission.
Biomaterials. 34:7694–7705. 2013. View Article : Google Scholar : PubMed/NCBI
|
|
31
|
Rodríguez-Antona C, Muñoz-Repeto I,
Inglada-Pérez L, de Cubas AA, Mancikova V, Cañamero M, Maliszewska
A, Gómez A, Letón R, Leandro-García LJ, et al: Influence of RET
mutations on the expression of tyrosine kinases in medullary
thyroid carcinoma. Endocr Relat Cancer. 20:611–619. 2013.
View Article : Google Scholar : PubMed/NCBI
|
|
32
|
Kebebew E, Peng M, Reiff E and McMillan A:
Diagnostic and extent of disease multigene assay for malignant
thyroid neoplasms. Cancer. 106:2592–2597. 2006. View Article : Google Scholar : PubMed/NCBI
|
|
33
|
Bièche I, Franc B, Vidaud D, Vidaud M and
Lidereau R: Analyses of MYC, ERBB2, and CCND1 genes in benign and
malignant thyroid follicular cell tumors by real-time polymerase
chain reaction. Thyroid. 11:147–152. 2001. View Article : Google Scholar : PubMed/NCBI
|
|
34
|
Yamada E, Yamazaki K, Takano K, Obara T
and Sato K: Iodide inhibits vascular endothelial growth factor-A
expression in cultured human thyroid follicles: A microarray search
for effects of thyrotropin and iodide on angiogenesis factors.
Thyroid. 16:545–554. 2006. View Article : Google Scholar : PubMed/NCBI
|