Introduction
Inter-observer variance in the evaluation of
pathological specimens is one of the problems that arises when
pathological findings are used for experimental purposes (1). In order to resolve this, several
attempts to utilize image analysis (IA) were introduced in the
1980s. For example, Stern et al and Rosenthal et al
analyzed cervical samples by IA to determine the cytosolic
diameter, nuclear diameter, and integrated optical density of the
nucleus (2,3). Since then, other attempts have been
made by other groups. For example, Nakazato et al reported
that cases of lung adenocarcinoma in which the cells had larger
nuclei exhibited a worse prognosis than the cases in which the
cells had smaller nuclei. In that study, they also showed a
significant difference between cases with large nuclear size and
small nuclear size with respect to pathological stage, T factor, N
factor and histological classification (4). In addition to IA, whole-slide imaging
(WSI) was utilized to capture digital images of the pathological
specimens to generate homogeneous images. For example, Yamada et
al showed the importance of nuclear analysis by IA for nuclear
size, shape factor, and intra-nuclear texture features to
distinguish low-grade ductal carcinoma in situ (DCIS) from
high-grade DCIS in WSI of hematoxylin and eosin (H&E)-stained
specimens of breast cancer cases (5). In addition, Kosuge et al showed
the significance of diverse nuclear density and size in the
evaluation of high-grade urothelial carcinomas by Feulgen staining
using IA and WSI techniques (6).
Thus, the effort to evaluate pathological findings in an objective
manner is continuously improving.
The nuclear envelope is a structure that separates
chromosomes from the cytosol in eukaryotic cells (7). Some nuclear proteins have been
utilized to analyze pathological specimens. For example, Asioli and
Bussolati reported that immunohistochemical staining for emerin,
which is one of the inner nuclear membrane proteins, could predict
the shapes of the nuclear membrane to help distinguish follicular
variant papillary carcinoma (FVPC) from follicular tumors. In
contrast, the nuclear features of FVPC were unclear in the
H&E-stained specimens (8).
Bussolati et al also used lamin, another nuclear membrane
protein, in addition to emerin for the analysis of the nuclear
morphology of breast cancer cases (9).
In the present study, we sought to evaluate the
nuclear morphology of 106 cases of lung adenocarcinoma using two
types of stains. One is the Feulgen reaction, as the staining is
valuable for the semi-quantitative evaluation of DNA and has a good
signal to noise ratio. The other is emerin immunohistochemistry
(IHC), which has been used to trace the shape of the nuclear
membrane. In addition, we applied WSI and IA to analyze nuclear
features in an objective manner and aimed to determine subtle
differences that might otherwise be missed without these tools.
Materials and methods
Cases
We included pathological specimens from 106 patients
with lung adenocarcinoma who underwent surgical resection at the
Gunma University Hospital (Maebashi, Japan) from November 2011 to
December 2013. Our research was approved by the Ethics Committee of
Gunma University School of Medicine, and the written notification
for this study was presented publicly on the webpage of our
hospital. Moreover, the opportunity to decline participation in
this study was guaranteed according to the Ethical Guidelines for
Medical and Health Research Involving Human Subjects of the
Japanese government (Ministry of Education, Culture, Sports,
Science and Technology and Ministry of Health, Labour and
Welfare).
Table I contains a
summary of the clinical features of the samples included in this
study. We classified each case based on tumor stage and tumor size
according to the 2017 TNM classification of the Union for
International Cancer Control (10).
We also classified each case into histological categories and
subcategories according to the 2015 World Health Organization
Classification of Lung Tumors (11). We excluded pT1a cases from this
study due to the small size of these tumors.
 | Table I.Characteristics of the lung
adenocarcinoma cases. |
Table I.
Characteristics of the lung
adenocarcinoma cases.
| Characteristics | No. of patients
(%) |
|---|
| Total number of
cases | 106 (100) |
| Age (years) |
|
|
<60 | 21 (20) |
| ≥60 | 85 (80) |
| Sex |
|
| Male | 60 (57) |
|
Female | 46 (43) |
| pT status |
|
| pTis | 1 (1) |
| pT1 | 48 (45) |
| pT2 | 44 (42) |
| pT3 | 11 (10) |
| pT4 | 2 (2) |
| Stage |
|
| I | 69 (65) |
| II | 21 (20) |
| III | 14 (13) |
| IV | 2 (2) |
| Histological
subtype |
|
|
Adenocarcinoma in situ | 1 (1) |
| Invasive
adenocarcinoma | 99 (93) |
| Lepidic
adenocarcinoma | 30 (28) |
| Papillary
adenocarcinoma | 38 (36) |
| Acinar
adenocarcinoma | 23 (22) |
|
Micropapillary
adenocarcinoma | 0 (0) |
| Solid
adenocarcinoma | 8 (8) |
|
Invasive mucinous
adenocarcinoma | 6 (6) |
Preparation of the specimens
Overall, 3-, 2- and 1-µm-thick specimens were
prepared from 10% formalin-fixed, paraffin-embedded blocks for each
staining procedure described below. Then, 3-µm-thick sections used
for H&E staining were mounted onto Star frost glass slides
(cat. no. 511511; Muto Pure Chemicals Co. Ltd., Tokyo, Japan). The
specimens used for Feulgen staining and IHC were mounted onto
silane-coated glass slides (NEW Silane III, cat. no. 519618; Muto
Pure Chemicals Co. Ltd.).
Hematoxylin and eosin (H&E)
staining
After de-paraffinization (xylene 3 times for 5 min
each time) and rehydration (100% ethanol for 1 min, 95% ethanol for
1 min, and 70% ethanol for 1 min), the specimens were rinsed in
running water for 1 min. Then, the specimens were stained with
hematoxylin solution (New Hematoxylin Type M, cat. no. 30141; Muto
Pure Chemicals) for 10 min at room temperature (R/T). After they
were washed in running water for 10 min, the specimens were stained
with eosin solution (New Eosin Type M, cat. no. 32081; Muto Pure
Chemicals) for 3 min. The dehydration (rinse in 70% ethanol, rinse
in 95% ethanol, and 100% ethanol twice for 30 sec each time) and
the penetration steps (xylene 3 times for 5 min each time) were
performed. Next, the specimens were cover-slipped with mounting
medium (Malinol, cat. no. 20093; Muto Pure Chemicals) for
observation.
Feulgen reaction
For the Feulgen reaction, we followed the protocol
reported by Kreicbergs and Zetterberg (12), except for the hydrogen chloride
(HCl) treatment time. Specifically, after the deparaffinization and
hydration steps, the specimens were washed with running water for 1
min and distilled water (DW) for 1 min and were incubated with 5 N
HCl for 40 min in order to remove the purine bases. Then, the
specimens were rinsed with cold Schiff reagent (cat. no. 40932;
Muto Pure Chemicals;) once, and then stained with cold Schiff
reagent for 90 min at R/T. In order to stop the reaction, the
specimens were treated with sulfurous acid solution (cat. no.
40941; Muto Pure Chemicals) three times. After washing with running
water for 5 min, dehydration, penetration and mounting were
performed.
Immunohistochemistry (IHC)
After de-paraffinization and hydration, the
specimens were washed in running water for 1 min. Then, the
specimens were treated with 0.3% hydrogen peroxide for 30 min at
R/T in order to block internal peroxidase activity. After they were
washed in running water for 1 min, the specimens were placed in a
container filled with 100 mM Tris-EDTA buffer (pH 9.0), which was
then placed in a thermos containing the same buffer. The thermos
was then heated at 97°C for 30 min, after which the container was
removed from the thermos and kept at R/T until the specimens
cooled. Then, the specimens were washed in running water and rinsed
with 10 mM phosphate-buffered saline (PBS), pH 7.4. To block
non-specific reactions due to the secondary antibody, the specimens
were treated with 2% normal goat serum for 15 min at R/T. After the
solution was removed by tapping, the specimens were treated with
mouse monoclonal anti-human emerin antibody (1:500 dilution, clone
CL0201; cat. no. NBP2-52876; Novus Biologicals, Littleton, CO, USA)
at 4°C overnight. Then, the specimens were washed with PBS 3 times
for 5 min each time, and incubated with horseradish-peroxidase
polymer-labeled goat anti-mouse immunoglobulin antibody (Histofine
Simple Stain MAX-PO (M), cat. no. 424134; Nichirei Biosciences,
Tokyo, Japan) for 30 min at R/T. After washing with PBS three times
for 5 min each time, the reaction was visualized by treatment with
0.003% H2O2 and 0.2 mg/ml
3,3′-diaminobenzidine (DAB) in 50 mM Tris-HCl, pH 7.6, for 2 min at
R/T. After the slides were washed in running water for 1 min,
counterstaining was performed with hematoxylin solution for 5 min
at R/T. After another wash in running water for 5 min, dehydration,
penetration, and mounting were performed.
Whole-slide imaging (WSI)
WSI of specimens subjected to the Feulgen stain and
IHC were obtained by a TOCO Virtual Slide Scanner (VS) (Claro,
Hirosaki, Japan) with a ×40 objective lens. The specifications of
the TOCO 20 are as follows: camera pixels, 1.39 million pixels;
size of the pixels, 0.26 µm/pixel; source of lamination, super
luminosity light emitting diode. Autofocus mode was used for
capture.
Image analysis
For the Feulgen stain, five randomly selected VS
images (in all, more than 400 nuclei were present in each case)
were saved as TIFF files. The TIFF files were converted to MRXS
files using an image converter software (E-Path Co., Ltd.,
Kanagawa, Japan). Then, the TIFF images were analyzed by Pannoramic
Viewer version 1.15.4 using the Quant Center HistoQuant module
(3DHISTECK Ltd., Budapest, Hungary) for Feulgen reaction-positive
areas with the following RGB range: (200, 207, 230). In order to
exclude small nuclei such as those in lymphocytes and aggregated
cells, nuclei <105 µm2 and >720 µm2
were excluded from the analysis. The data collected were as
follows: nuclear area, nuclear perimeter (NP), nuclear circularity,
and nuclear gray intensity (staining intensity). Nuclear
circularity was defined as the ratio of two concentric circles as
follows: circle that lined the innermost side of the object/circle
that lined the outermost side of the object. Therefore, if the area
was an exact circle, the circularity was 1. In terms of gray
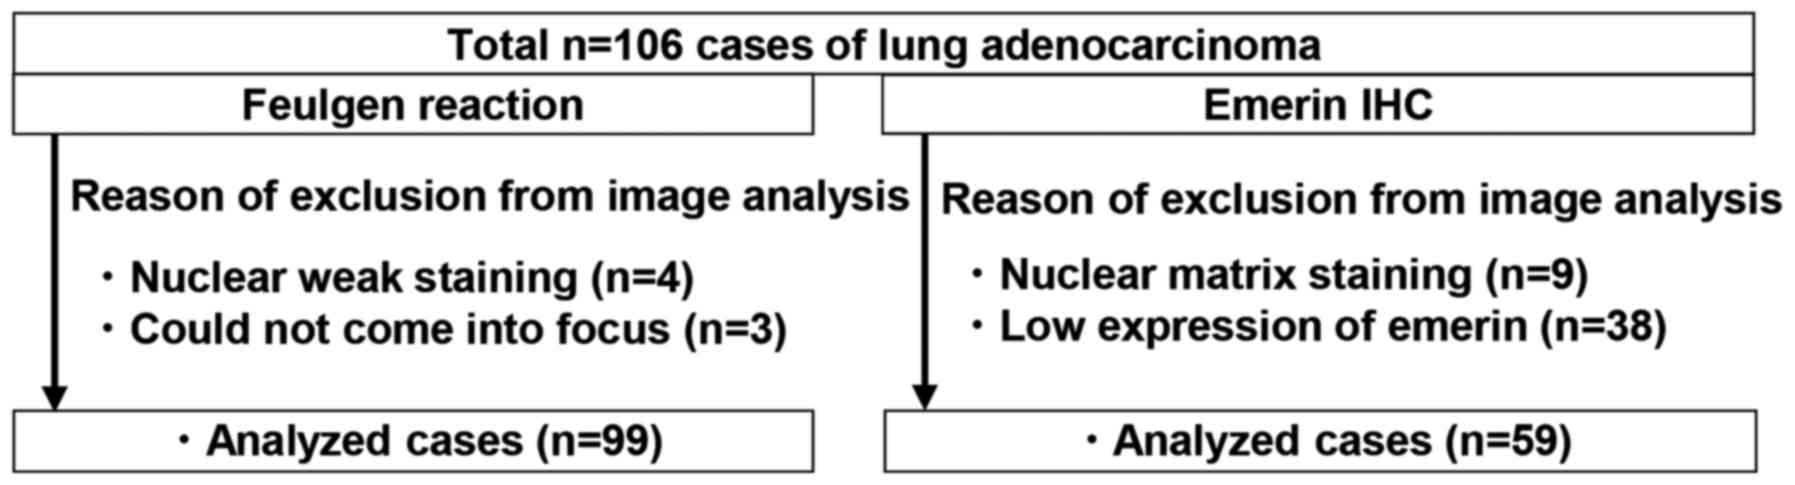
intensity, gray tone was indicated by 8-bit color (256). In all, 99
cases were analyzed. Several specimens were unable to be analyzed
due to poor focus (4 cases) or light staining (3 cases) and were
excluded from the study (Fig.
1).
In terms of the IHC specimens, five randomly
selected VS images (in all, more than 200 nuclei were present in
each case) were saved as TIFF files. For nuclear membrane and
nuclear analyses, e-Nucle version 21 (E-path Co., Ltd., Fujisawa,
Japan) was used. Data settings for analysis were as follows: red:
0–255, green: 0–255, blue: 75–102 (1 pixel=0.26 micrometer for TOCO
virtual slide scanner that we used in this study). Detected
positive area size <13 µm2 and >125 µm2
was excluded from this study as lymphocytes and aggregated cells
are included in these range. According to the manufacturer,
‘nuclear area with DAB staining’ was detected as a
hematoxylin-positive area with DAB staining. First, the nuclear
region that was defined by the hematoxylin-stained area was traced
as the outermost part of the region and was termed NP. The circular
area with positive DAB staining inside of the nuclear area was
recognized as the ‘emerin-stained nuclear membrane length (ENML)’.
Thus, if the nuclear area was not completely surrounded by positive
DAB staining, the nucleus was not detected by our protocol. On the
contrary, the emerin-stained portion was detected as the linear
DAB-positive portion of the ‘nuclear area’. The ENML was determined
by tracing the center line of emerin-stained linear belt-like
objects in the nuclear area. Thus, if the nucleus contained no
nuclear grooves or invaginations, the NP was larger than the ENML
because the NP traced the outermost part of the nucleus, whereas
the ENML traced the center line of thin belt-like DAB-stained area.
Using our protocol, we collected data on the nuclear area, NP,
ENML, maximum diameter and minimum diameter of the nuclear area. We
defined emerin low expression as cases in which less than half of
tumor nuclei could be detected by our protocol. Due to nuclear
matrix staining (9 cases) and weak expression of emerin (38 cases),
47 cases were excluded from the image analysis by e-Nucle software
(Fig. 1).
Statistical analysis
We utilized JMP Pro version 12.2.0 software (SAS
Japan, Tokyo, Japan) for all statistical analyses. For the
correlation analysis, R>0.9 was considered to represent high
correlation, whereas 0.7–0.9 indicated moderate correlation,
0.5–0.7 indicated low correlation, and 0.5 a chance result
(13). When the average (Avg) was
compared between the two groups, the Student's t-test was used.
Results with P-values <0.05 were considered statistically
significant.
Results
Amount of nuclear DNA did not
correlate with nuclear size according to the analysis by Feulgen
reaction
We utilized the Feulgen reaction for nuclear
morphological analysis rather than hematoxylin staining because the
Feulgen reaction has a better signal/noise ratio and allows for the
analysis of DNA content in a semi-quantitative manner (6). First, we investigated the thickness of
specimens that were suitable for nuclear morphological analysis in
this study. We assessed 3-µm-thick H&E-stained specimens and
found that some exhibited nuclear overlapping (data not shown).
Therefore, we prepared 1- to 3-µm-thick sections and analyzed the
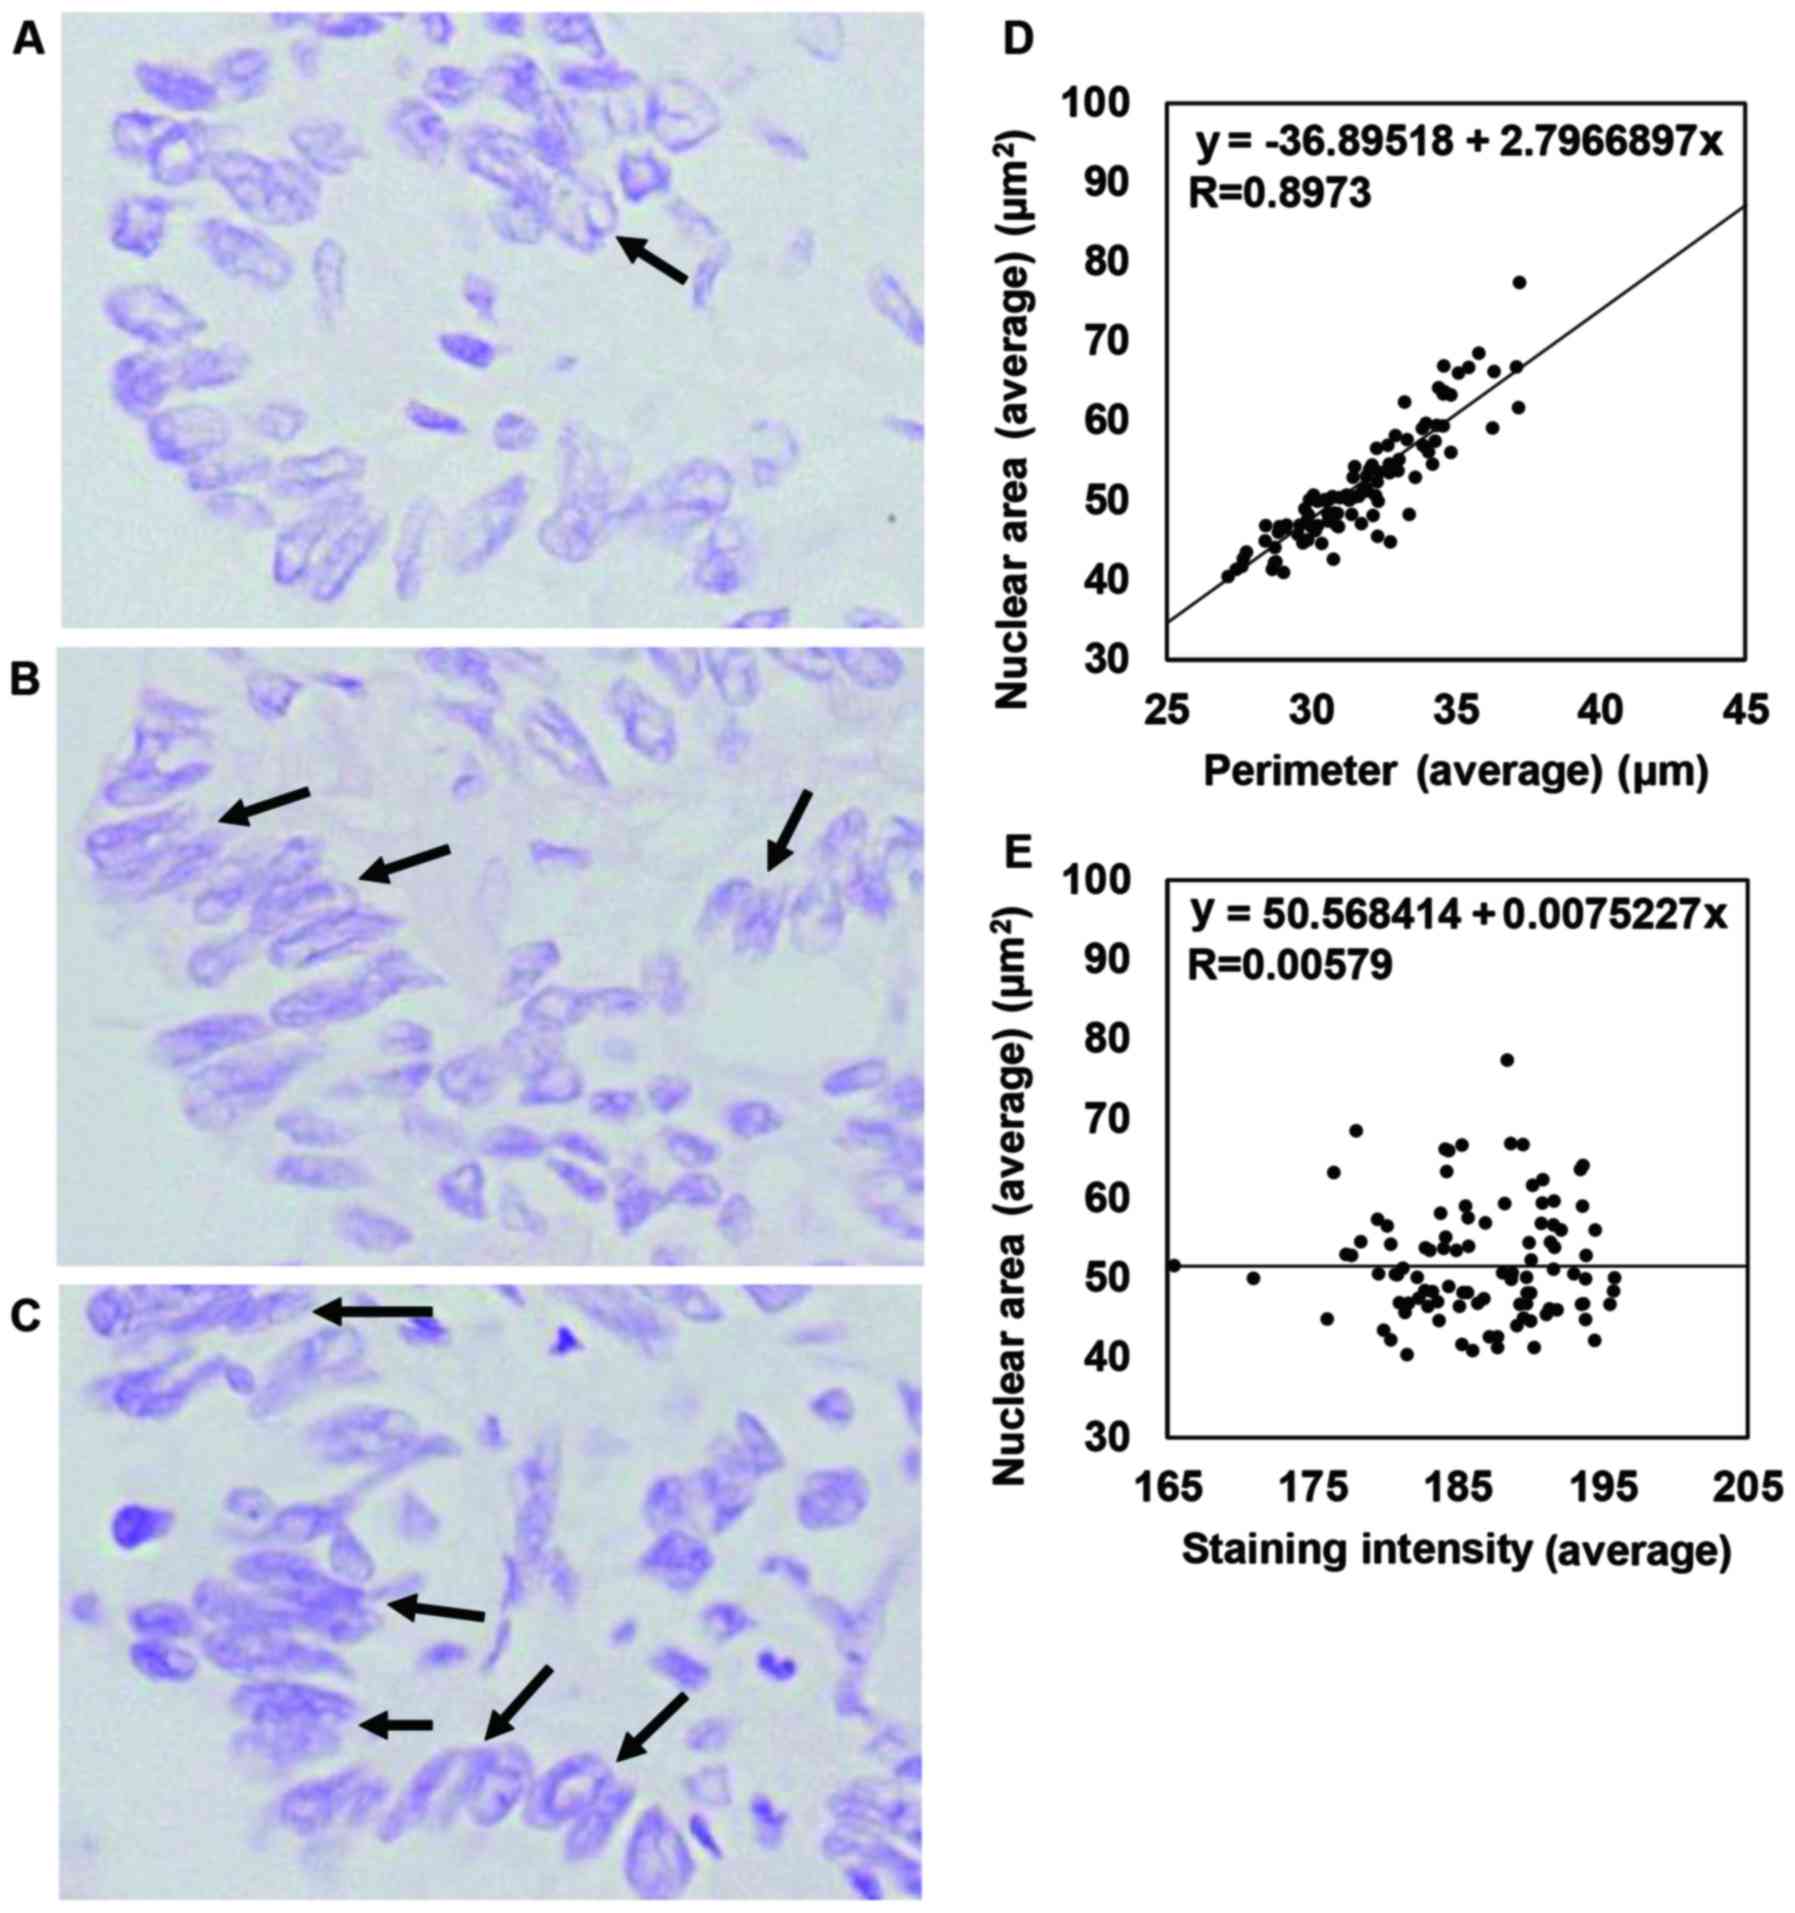
nuclear morphology using our protocol. We observed representative
severe nuclear overlapping in the case shown in Fig. 2A-C. Even in cases with severe
nuclear overlapping, 1-µm-thick sections showed relatively minimal
nuclear overlapping compared with 2- to 3-µm-thick sections.
Moreover, since our protocol detected the nuclear area
appropriately, we chose 1-µm-thick sections for analysis of the
Feulgen reaction. In this setting, we were able to analyze 99 cases
(Fig. 1). The correlation of each
factor detected in the image analysis was as follows: the Avg
nuclear area versus (vs.) the standard deviation (SD) of the
nuclear area (R=0.9471), the Avg vs. the SD of the NP (R=0.9002)
demonstrated a high correlation. The Avg nuclear area vs. the Avg
NP (R=0.8973), the SD of the nuclear area vs. the SD of the NP
(R=0.8570), and the SD of the NP vs. the Avg circularity (R=0.7167)
demonstrated a moderate correlation. In addition, the Avg
circularity vs. the SD of circularity (R=0.6693), the Avg staining
intensity vs. the SD of staining intensity (R=0.7008) demonstrated
a low correlation, but other combinations did not demonstrate any
correlation. The representative results are shown in Fig. 2D and E. Our results indicate that
our analysis of continuous variables provided a correlation between
nuclear size and NP. In terms of staining intensity, which seemed
to represent the amount of DNA in a semi-quantitative manner
(6), our staining intensity was not
correlated with nuclear size or morphology (Avg nuclear area, Avg
NP, or Avg nuclear circularity) or with the variability in nuclear
size or morphology (SD of the nuclear area, SD of the NP, or SD of
the nuclear circularity).
Nuclear morphological analysis of
total nuclei in emerin-stained specimens did not reflect the
presence of a minor population with eccentric nuclear
morphology
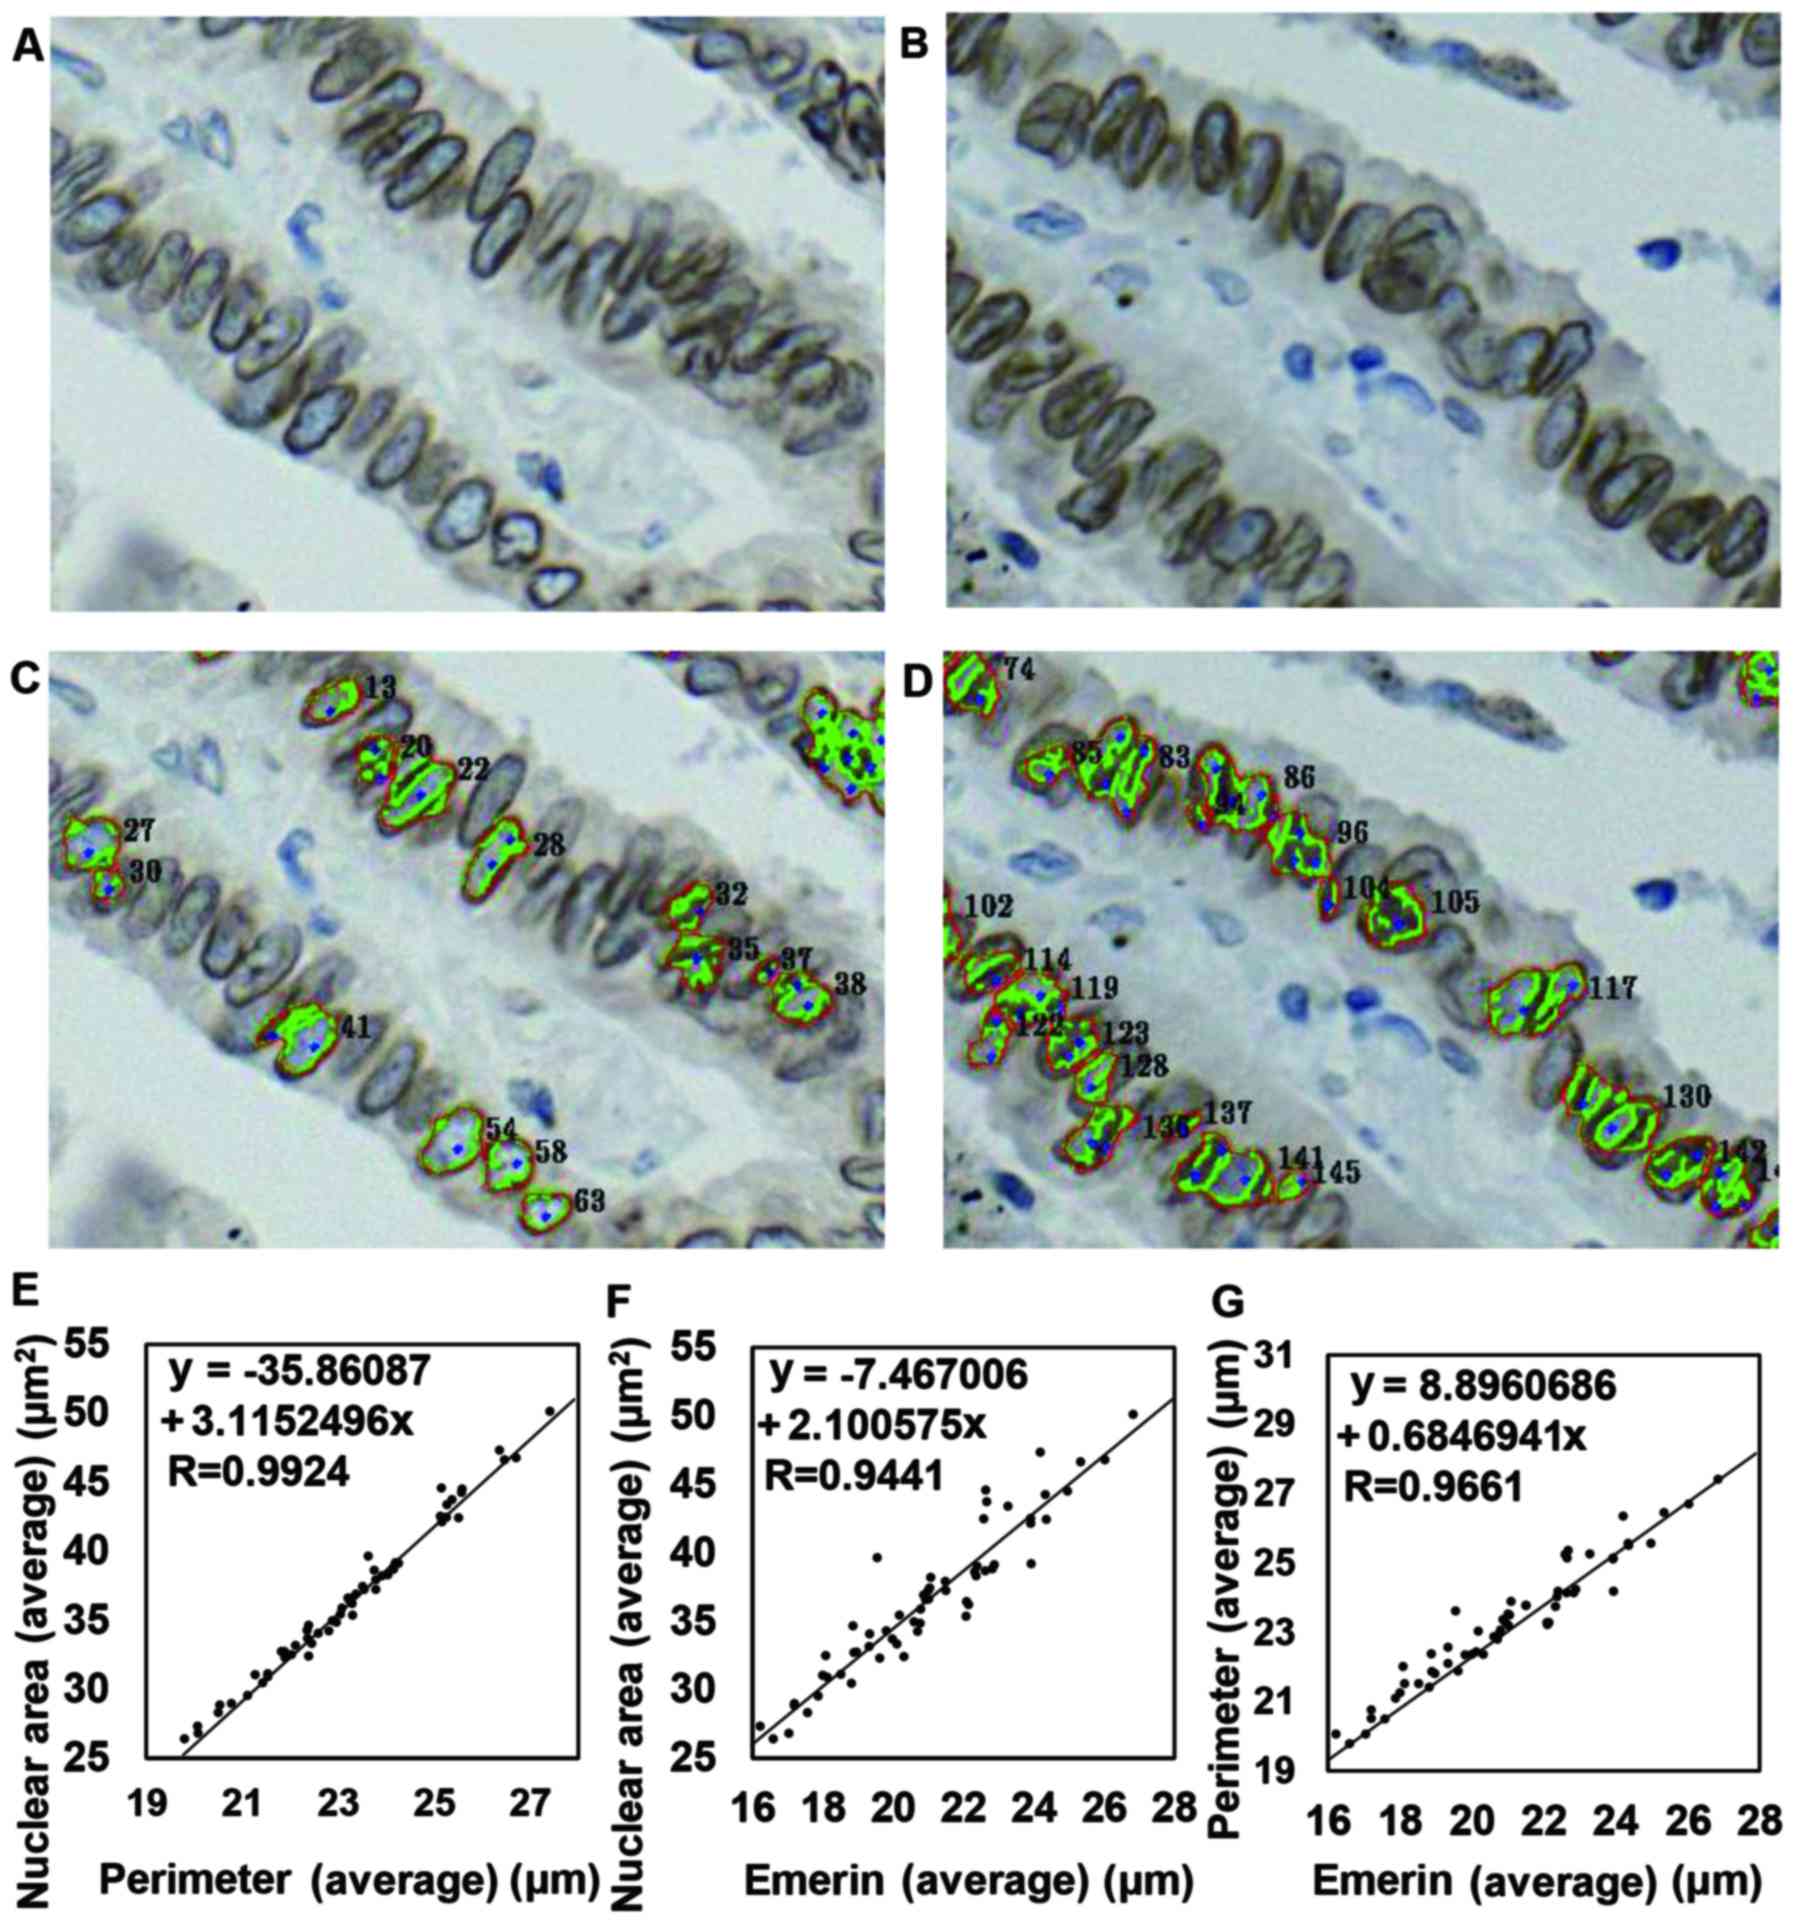
Since we could not properly detect the nuclear area
in 1-µm-thick emerin-stained sections using our protocol, we
selected 2-µm-thick sections for this analysis. A representative
case in which the NP and ENML could be detected in a 2-µm-thick
section but one in which the NP and ENML failed to be detected in a
1-µm-thick section is shown in Fig.
3A-D. We were able to analyze 59 cases in this setting, and the
correlation of each factor was as follows: the Avg nuclear area vs.
the Avg of the NP (R=0.9924), the Avg NP vs. the Avg emerin-stained
nuclear membrane length (ENML) (R=0.9661), the Avg ENML vs. the SD
of the nuclear area (R=0.9502), the Avg nuclear area vs. the Avg
ENML (R=0.9441), and the SD of the NP vs. the SD of the ENML
(R=0.9304) showed a strong correlation. The Avg ENML and the SD of
the NP (R=0.8952), the SD of the nuclear area vs. the SD of the
ENML (R=0.8863), the Avg nuclear area vs. the SD of the NP
(R=0.7855) and the Avg NP vs. the SD of the ENML (R=0.7076) showed
a moderate correlation. In contrast, the Avg nuclear area vs. the
SD of the ENML (R=0.6483) showed a weak correlation. Other
combinations did not show any correlation. Representative results
are shown in Fig. 3E-G. Despite the
findings of nuclear grooves (NGs), intranuclear cytoplasmic
inclusions (ICIs), and jagged shape of some nuclei (we termed these
nuclei ‘eccentric nuclei in this manuscript), the data described
above suggested that nuclear morphological changes including NGs,
ICIs, and jagged shape were so infrequently observed that these
changes might not be exhibited if we estimated the data based on
the Avg or the SD of all nuclei.
The difference in nuclear perimeter
and emerin-stained nuclear membrane length accurately reflected a
minor population with eccentric nuclear morphology
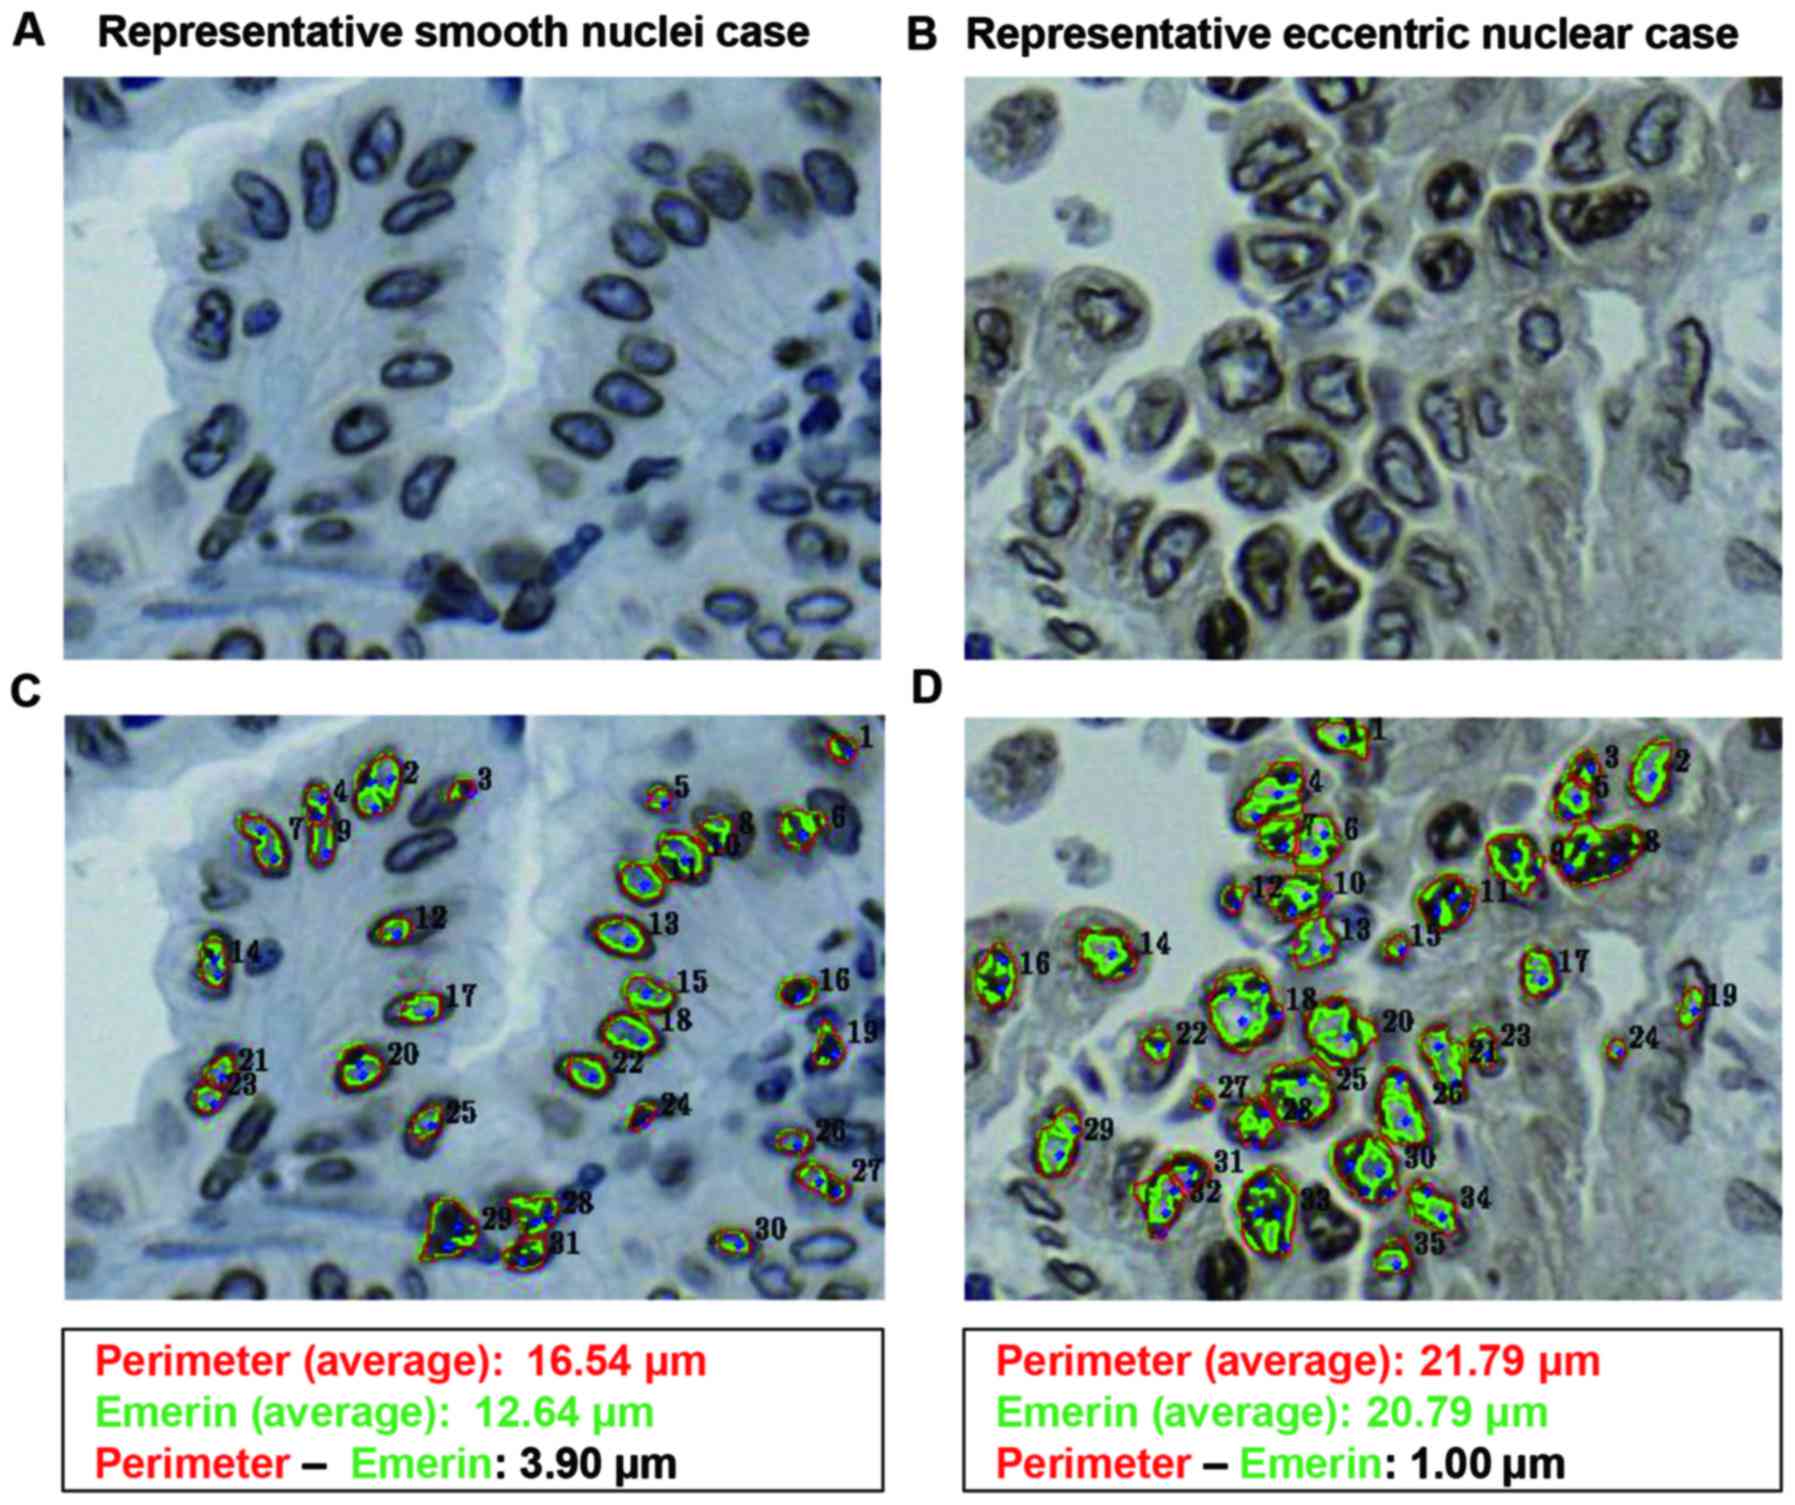
We next considered how we could properly reflect the
existence of eccentric nuclei, nuclei with NGs, and ICI-positive
nuclei, which comprised a relatively minor proportion of the total
nuclei of cancer cells. We noticed that the difference in the NP
minus the ENML (NP-ENML difference) would be the most appropriate
way to estimate the changes in membrane morphology. To determine
the NP-ENML difference, we subtracted the ENML from the NP for each
nucleus examined. Then, we calculated the ratio of the NP-ENML
difference in positive nuclei to the total number of nuclei. In
these experiments, if the ENML was longer than the NP, we termed
the nucleus as a ‘high nuclear deformity nucleus (HNDN)’, and we
calculated the rate of HNDN out of all nuclei. We compared the NP
and the presence of ICIs in cases by visual examination (i.e., with
the naked eye) and accounted for the rate of HNDN. Representative
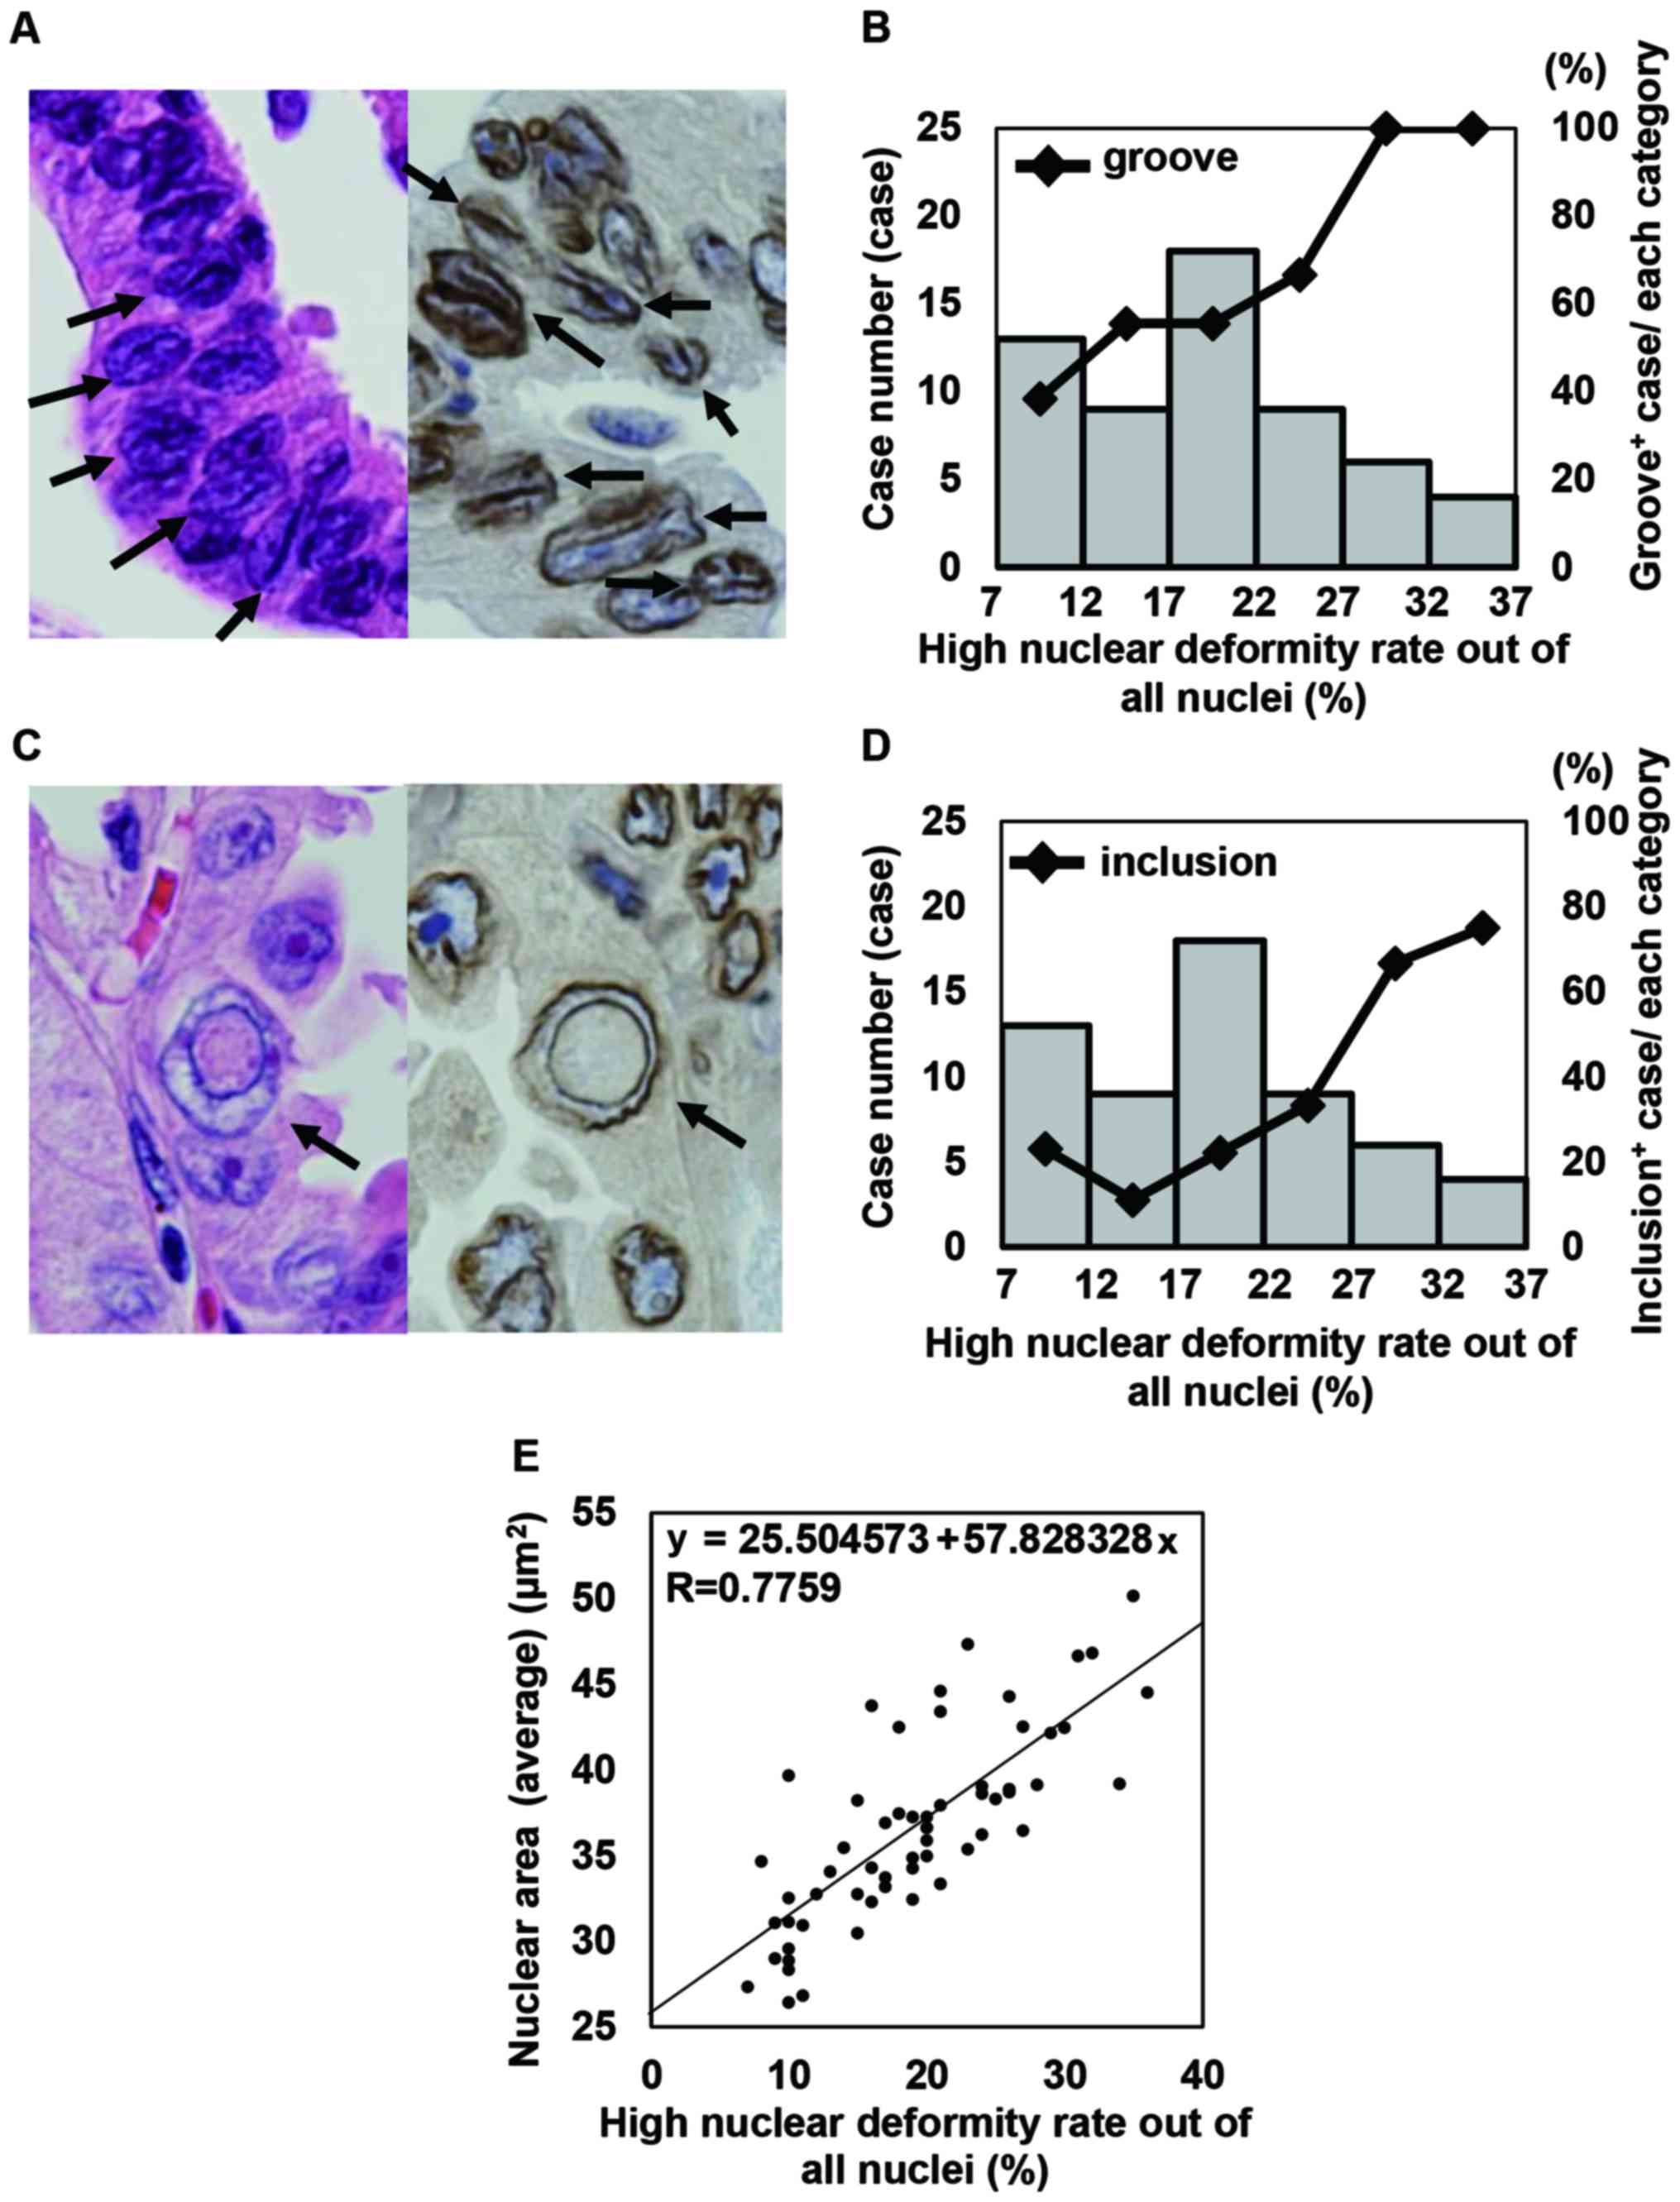
cases with smooth and eccentric nuclei are shown in Fig. 4. As an average size, even in cases
with eccentric nuclei, the average ENML was smaller than the
average of the NP according to the software algorithm, as described
in the Materials and methods section. As shown in Fig. 5A and B, the frequency of cases with
NGs and the frequency of ICIs gradually increased based on the
increase in the rate of HNDN. In addition, according to this
analysis, the Avg ENML vs. the rate of HNDN (R=0.9256), the SD of
the NP vs. the rate of HNDN (R=0.8975), and the SD of the ENML vs.
the rate of HNDN (R=0.9110) all demonstrated a high correlation.
The Avg NP vs. the rate of HNDN (R=0.8125), the Avg nuclear area
and the rate of HNDN (R=0.7759), and the SD of the nuclear area vs.
the rate of HNDN (R=0.8862) demonstrated a moderate correlation.
Representative data are shown in Fig.
5C and D. These data suggested that the rate of HNDN was a
valuable tool to detect cases of eccentric nuclei using objective
continuous variables. In addition, our data indicated that larger
nuclear size showed a tendency to be associated with a large rate
of HNDN (Fig. 5E). Manual
observation and evaluation of nuclear morphology against the same
images used for IA were performed by two pathologists (MS and FT).
The accordance rate between the two observers was 43.7%, and the
graphs of each observer's results appeared different from each
other although the average score between the two observers
demonstrated a moderate correlation (R=0.8066) (Fig. S1).
These data indicated that manual observation and evaluation was
useful but not consistent because of inter-observer variance.
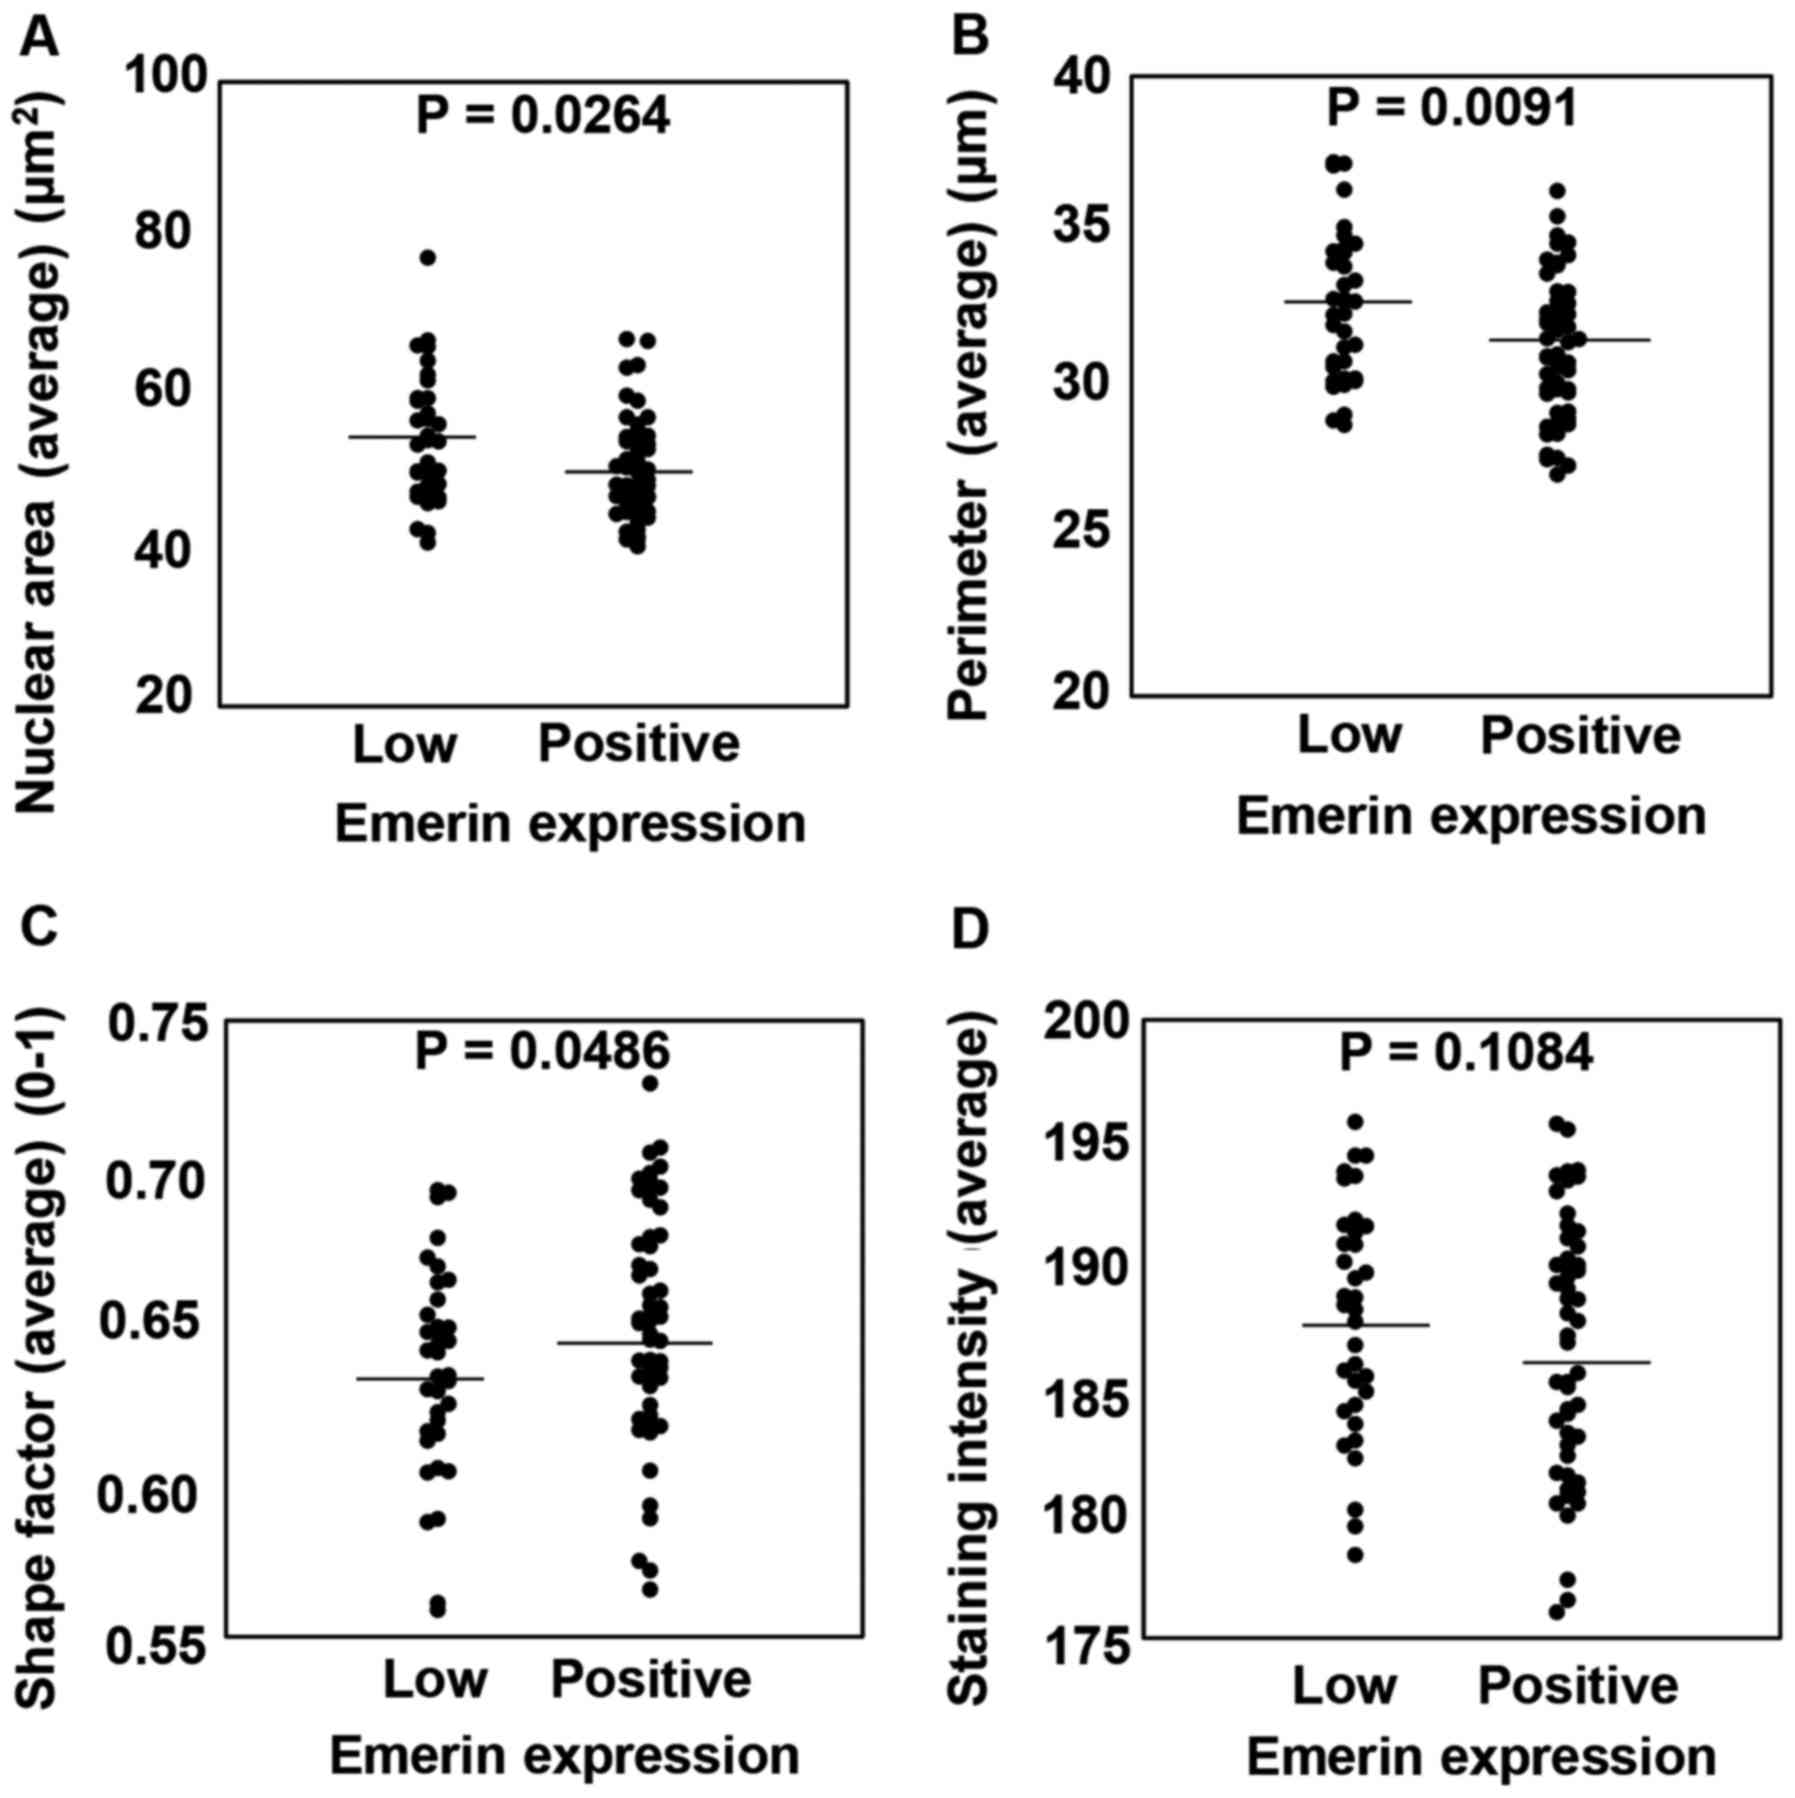
The emerin low expression group showed
enlarged nuclei with an oval shape compared with the emerin high
expression group
Finally, we compared whether emerin expression could
affect nuclear size. To explore this question, we defined the group
that was excluded from the emerin immunohistochemistry (IHC)
nuclear morphological analysis due to emerin low expression as the
‘emerin low expression group’. Then, we compared Feulgen staining
in the emerin expression group and the emerin low expression group.
Among the emerin low expression group (n=38), 34 cases could be
analyzed by Feulgen reaction. In contrast, among cases in the
emerin expression group (n=59), 54 could be analyzed by Feulgen
reaction. In comparison with the emerin expression group, the
emerin low expression group had significantly enlarged nuclear
areas (P<0.0264), NP (P<0.0091) and nuclear circularity
(P<0.0486). However, the nuclear intensity was not significantly
different between the two groups. Representative data are shown in
Fig. 6. Our data indicated that low
expression of emerin affects nuclear size and shape. NP, nuclear
perimeter.
Discussion
High nuclear grade denotes a more aggressive tumor
(14), but nuclear grade is the
most subjective factor in comparison with architectural features
and mitotic rate in the evaluation of breast cancer specimens
(14). Therefore, we believe that
the establishment of a more objective method to evaluate nuclear
morphology is necessary. In the present study, we analyzed the
nuclear morphology of 106 cases of lung adenocarcinoma using
Feulgen staining and emerin immunohistochemistry (IHC) in
combination with whole-slide imaging (WSI) and computer-assisted
image analysis (IA). By the Feulgen reaction, a correlation was
observed between the Avg nuclear area and the average nuclear
perimeter (NP), but no correlation was observed between nuclear
circularity (Avg) and nuclear area (Avg), NP (Avg), or nuclear
staining intensity represented by the staining intensity (Avg) of
the nucleus. In contrast, no correlation was found between the
staining intensity of the nuclear area (Avg) and the NP (Avg).
Kumar et al analyzed the nuclear morphological features of
30 cases of normal oral mucosa and well to moderately
differentiated oral squamous cell carcinoma (SCC) by H&E
staining, and found that the nuclear area and the NP of SCC were
significantly larger than those of normal squamous epithelium
(15). According to the data of the
nuclear morphological analysis of 64 cases of breast cancer, as
analyzed by cytologic smear, Kashyap et al classified
cellular atypia based on Robinson's grading system. They also found
that cases of high-grade cellular atypia had enlarged nuclear areas
and NPs, but neither nuclear circularity, nuclear irregularity, nor
nuclear staining intensity was statistically different with respect
to tumor grade (16). These data
suggested that nuclear enlargement does not influence circularity
or staining intensity of the nucleus, and our results were
consistent with this finding. In terms of staining intensity
detected by the Fuelgen reaction, the reaction was reported to be
utilized to evaluate DNA content of cells in a specimen in a
semi-quantitative manner (6).
Biesterfeld et al reported that Feulgen staining remains the
gold standard for precise analysis of DNA ploidy using image
cytometry (17). However, our data
did not show any correlation between staining intensity and other
nuclear factors. One possible explanation is the thickness of
specimens. Kosuge et al utilized 3-µm-thick specimens for
analysis (6), whereas we used
1-µm-thick specimens. Thus it is possible that evaluation of
1-µm-thick specimen might be out of range of evaluation by the
Feulgen reaction.
We will now discuss the relationship among nuclear
grooves (NGs), cytoplasmic inclusions (ICIs) and nuclear
irregularity as detected by emerin IHC in this study. Currently,
the frequency of NGs and ICIs in renal cell carcinoma histological
specimens is 96 and 65%, respectively (18). In contrast, the frequency of ICIs in
cytological specimens of ovarian cancer is 38% (19), while the frequency of ICIs in
cytological specimens of thyroid papillary carcinoma cases is 88.9%
(20). In terms of lung
adenocarcinoma cases, Choi et al reported the frequency of
either NGs or ICIs in anaplastic lymphoma kinase (ALK)-positive
cases and ALK-negative cases as 21.1 and 9.9%, respectively
(21). In the present study, the
frequency of NGs and ICIs in our cases was 61 and 31%,
respectively. That is, the frequency of NGs and ICIs was very high
in our case compared to that in Choi's report. We therefore
considered the reason for the high detection rate in our study. In
Choi's study, H&E-stained specimens were examined, while in the
present study, emerin-stained specimens were used for the
evaluation of NGs and ICIs. Therefore, the type of staining might
affect the detection rate of NGs and ICIs. Indeed, Asioli and
Bussolati reported that emerin IHC allowed for easier observation
of nuclear morphological structure than H&E staining as in some
H&E-stained specimens, overstaining of the nucleus by
hematoxylin led to difficulties in the observation of nuclear
details (8).
Now, we will discuss the meaning of the subtraction
of the emerin-stained nuclear membrane length (ENML) from the NP.
In our protocol used in this study, the NP was recognized as the
outermost part of the nuclear area, whereas the ENML traced the
center line of the linearly stained emerin-positive membrane
structure, as described in the Materials and methods section. Thus,
the length of the center line of the emerin-stained linear membrane
structure would be smaller than the outermost part of the nuclear
area if the nucleus was round without any nuclear invaginations,
NGs, or ICIs. Therefore, if the subtracted value of ‘NP - ENML’ is
negative, the nucleus would have a great number of nuclear
structural changes, such as NGs or ICIs. Thus, according to our
data, the frequency of NGs or ICIs was correlated with the
frequency of a high nuclear deformity rate (HNDN) (Fig. 5A and B). In addition, a rate of HNDN
was correlated with nuclear size (Fig.
5C). This result suggested that nuclear size is a very
important factor for the occurrence of nuclear irregularities.
However, no direct evidence was found to support our hypothesis,
and thus, this would be a question to be resolved in a future
study.
Finally, we discuss the meaning of low emerin
expression and nuclear morphology. Emerin is a small 29-kDa inner
nuclear membrane protein with a single transmembrane domain that
plays multiple roles (22). For
example, emerin contributes to miRNA expression and myogenic
signaling including that mediated by the Notch, Wnt, TGF-β and IGF
pathways (23). Additionally,
emerin plays several roles in nuclear architecture since it binds
directly to both type A and type B lamins, which are type V
intermediate filament proteins that maintain nuclear laminar
structure (24). In the present
study, we found that the emerin low expression group showed larger
nuclear size and NP and was more likely to have an oval shape in
comparison with the emerin expression group, although the nuclear
DNA content evaluated by staining intensity of the nucleus after
Feulgen staining did not reveal any significant differences. In
terms of the relationship between nuclear morphology and emerin
expression in clinical samples, Jieying et al reported that
the nuclei of emerin-expressing non-tumor follicular cells of
thyroid glands exhibited a round nuclear shape and small nuclear
size with a thyroxin (T4)- and thyroglobulin (Tg)-positive
functional phenotype. However, the nuclei in emerin-negative cases
exhibited an oval shape and large size with a T4-negative,
Tg-negative dysfunctional phenotype (25).
Our data and the data of others suggested that low
emerin expression results in an oval nuclear shape and large
nuclear size. However, it is possible that nuclear morphological
changes might result in the low expression of emerin. We further
searched the literature and found two articles that described
nuclear morphological changes when emerin expression was knocked
down. Smith et al examined nuclear morphological changes in
murine embryonic stem (ES) cells during differentiation induced by
retinoic acid (RA). They found that the shape of the nuclei
remained oval in wild-type (wt) cells and in single or double
knockout ES cells in which the nuclear lamin A/C proteins or emerin
expression were knocked down without RA-induced differentiation.
However, the nuclei became round in wt cells with RA-induced
differentiation, while the shape of the nuclei remained oval in
single or double knockouts of lamin A/C or emerin with RA-induced
differentiation (26). These data
indicate that lamin A/C or emerin might contribute to a round
nuclear shape during the differentiation process. Lammerding et
al examined morphological features in emerin-deficient murine
ES cells and showed that emerin-deficient cells had an irregular
nuclear shape, low contour ratio [4π × nuclear area/(perimeter of
nucleus)2], and enlarged nuclear size compared with wt
cells (27). These data suggested
that emerin downregulation itself might lead to an oval nuclear
shape and enlarged nuclear size. Therefore, we believe that the
changes in nuclear shape and size observed in cases with low emerin
expression in our study would be directly caused by emerin
downregulation. This is the first description that low emerin
expression would contribute to an oval nuclear shape and enlarged
nuclear size in adenocarcinoma cells in clinical samples.
In conclusion, in the present study, it was shown
that a portion of cancer cell nuclei exhibited strong morphological
changes, which are very difficult to evaluate with the naked eye,
and thus, we used WSI and IA. In addition, our data revealed that
low expression of emerin contributes not only to the oval shape of
nuclei, but also to the enlargement in nuclear size.
Supplementary Material
Supporting Data
Acknowledgements
Not applicable.
Funding
Research funding from Gunma University for MS and SK
was used in these experiments.
Availability of data and materials
The datasets used and/or analyzed during the current
study are available from the corresponding author on reasonable
request.
Authors' contributions
SK conducted the clinical data collection, specimen
staining, digital imaging of the specimens by virtual slide
scanner, image analysis, statistical analysis, figure preparation,
and manuscript preparation. MS developed the experimental design,
conducted the experiments, digital imaging of specimens by virtual
slide scanner, image analysis, figure preparation, statistical
analysis and manuscript preparation. KK assisted in image analysis
and manuscript reviewing for manuscript preparation. TF performed
manual evaluation of emerin-stained IHC specimens, assisted in the
pathological review of the cases, and reviewed and prepared the
manuscript. JH and TO assisted in pathological review of the cases
and manuscript reviewing for manuscript preparation. All authors
read and approved the manuscript and agree to be accountable for
all aspects of the research in ensuring that the accuracy or
integrity of any part of the work are appropriately investigated
and resolved.
Ethics approval and consent to
participate
Our research was approved by the Ethical Committee
of Gunma University School of Medicine, and the written
notification for this study including notification of possibility
to publish the results of this study was presented publicly on the
webpage of our hospital as of information disclosure document.
Moreover, the opportunity to decline participation in this study
was guaranteed according to the Ethical Guidelines for Medical and
Health Research Involving Human Subjects of the Japanese government
(Ministry of Education, Culture, Sports, Science and Technology and
Ministry of Health, Labour and Welfare).
Patient consent for publication
Not applicable.
Competing interests
The authors declare that they have no competing
interests.
References
|
1
|
Nakazato Y, Maeshima AM, Ishikawa Y,
Yatabe Y, Fukuoka J, Yokose T, Tomita Y, Minami Y, Asamura H,
Tachibana K, et al: Interobserver agreement in the nuclear grading
of primary pulmonary adenocarcinoma. J Thorac Oncol. 8:736–743.
2013. View Article : Google Scholar : PubMed/NCBI
|
|
2
|
Stern E, Rosenthal DL, McLatchie C, White
BS and Castleman KR: An expanded cervical cell classification
system validated by automated measurements. Anal Quant Cytol.
4:110–114. 1982.PubMed/NCBI
|
|
3
|
Rosenthal DL, McLatchie C, Stern E, White
BS and Castleman KR: Endocervical columnar cell atypia coincident
with cervical neoplasia characterized by digital image analysis.
Acta Cytol. 26:115–120. 1982.PubMed/NCBI
|
|
4
|
Nakazato Y, Minami Y, Kobayashi H, Satomi
K, Anami Y, Tsuta K, Tanaka R, Okada M, Goya T and Noguchi M:
Nuclear grading of primary pulmonary adenocarcinomas: Correlation
between nuclear size and prognosis. Cancer. 116:2011–2019. 2010.
View Article : Google Scholar : PubMed/NCBI
|
|
5
|
Yamada M, Saito A, Yamamoto Y, Cosatto E,
Kurata A, Nagao T, Tateishi A and Kuroda M: Quantitative nucleic
features are effective for discrimination of intraductal
proliferative lesions of the breast. J Pathol Inform. 7:12016.
View Article : Google Scholar : PubMed/NCBI
|
|
6
|
Kosuge N, Saio M, Matsumoto H, Aoyama H,
Matsuzaki A and Yoshimi N: Nuclear features of infiltrating
urothelial carcinoma are distinguished from low-grade noninvasive
papillary urothelial carcinoma by image analysis. Oncol Lett.
14:2715–2722. 2017. View Article : Google Scholar : PubMed/NCBI
|
|
7
|
Webster M, Witkin KL and Cohen-Fix O:
Sizing up the nucleus: Nuclear shape, size and nuclear-envelope
assembly. J Cell Sci. 122:1477–1486. 2009. View Article : Google Scholar : PubMed/NCBI
|
|
8
|
Asioli S and Bussolati G: Emerin
immunohistochemistry reveals diagnostic features of nuclear
membrane arrangement in thyroid lesions. Histopathology.
54:571–579. 2009. View Article : Google Scholar : PubMed/NCBI
|
|
9
|
Bussolati G, Marchiò C, Gaetano L, Lupo R
and Sapino A: Pleomorphism of the nuclear envelope in breast
cancer: A new approach to an old problem. J Cell Mol Med.
12:209–218. 2008. View Article : Google Scholar : PubMed/NCBI
|
|
10
|
O'Sullivan B, Mason M, Asmura H, Lee A,
Van Eychen E, Denny L, MB A and Gupta S: Lung. In: TNM
Classification of Malignant Tumours, Eighth Edition. Brierley JD,
Gospodarowicz MK and Wittekind C: Wiley Blackwell; West Sussex; pp.
106–112. 2017
|
|
11
|
Travis W, Ladanyi M, Scagliotti G, Noguchi
M, Meyerson M, Thunnissen E, Yatabe Y, Mino-Kenudson M, To K,
Brambilla E, et al: Adenocarcinoma: WHO Classification of Tumours
of the Lung, Pleura, Thymus and Heart. Travis W, Brambilla E, Burke
A, Marx A and Nicholson A: International Agency for Research on
Cancer Lyon. 26–37. 2015.
|
|
12
|
Kreicbergs A and Zetterberg A:
Cytophotometric DNA measurements of chondrosarcoma: Methodologic
aspects of measurements in tissue sections from old
paraffin-embedded specimens. Anal Quant Cytol. 2:84–92.
1980.PubMed/NCBI
|
|
13
|
Akobeng AK: Understanding diagnostic tests
3: Receiver operating characteristic curves. Acta Paediatr.
96:644–647. 2007. View Article : Google Scholar : PubMed/NCBI
|
|
14
|
Fischer A: The diagnostic pathology of the
nuclear envelope in human cancers. In: Cancer Biology and the
Nuclear Envelope. Schirmer EC and de las Heras JI: Springer;
London: pp. 49–75. 2014
|
|
15
|
Kumar M, Chatterjee K, Purkait SK and
Samaddar D: Computer-assisted morphometric image analysis of cells
of normal oral epithelium and oral squamous cell carcinoma. J Oral
Maxillofac Pathol. 21:24–29. 2017. View Article : Google Scholar : PubMed/NCBI
|
|
16
|
Kashyap A, Jain M, Shukla S and Andley M:
Role of nuclear morphometry in breast cancer and its correlation
with cytomorphological grading of breast cancer: A study of 64
cases. J Cytol. 35:41–45. 2018. View Article : Google Scholar : PubMed/NCBI
|
|
17
|
Biesterfeld S, Beckers S, Del Carmen Villa
Cadenas M and Schramm M: Feulgen staining remains the gold standard
for precise DNA image cytometry. Anticancer Res. 31:53–58.
2011.PubMed/NCBI
|
|
18
|
Lee JH, Han EM, Lin ZH, Wu ZS, Lee ES and
Kim YS: Clinicopathologic significance of nuclear grooves and
inclusions in renal cell carcinoma: Image database construction and
quantitative scoring. Arch Pathol Lab Med. 132:940–946.
2008.PubMed/NCBI
|
|
19
|
Naka M, Ohishi Y, Kaku T, Watanabe S,
Tamiya S, Ookubo F, Kato K, Oda Y and Sugishima S: Identification
of intranuclear inclusions is useful for the cytological diagnosis
of ovarian clear cell carcinoma. Diagn Cytopathol. 43:879–884.
2015. View
Article : Google Scholar : PubMed/NCBI
|
|
20
|
Das DK: Intranuclear cytoplasmic
inclusions in fine-needle aspiration smears of papillary thyroid
carcinoma: A study of its morphological forms, association with
nuclear grooves, and mode of formation. Diagn Cytopathol.
32:264–268. 2005. View
Article : Google Scholar : PubMed/NCBI
|
|
21
|
Choi IH, Kim DW, Ha SY, Choi YL, Lee HJ
and Han J: Analysis of histologic features suspecting anaplastic
lymphoma kinase (ALK)-expressing pulmonary adenocarcinoma. J Pathol
Transl Med. 49:310–317. 2015. View Article : Google Scholar : PubMed/NCBI
|
|
22
|
Koch AJ and Holaska JM: Emerin in health
and disease. Semin Cell Dev Biol. 29:95–106. 2014. View Article : Google Scholar : PubMed/NCBI
|
|
23
|
Koch AJ and Holaska JM: Loss of emerin
alters myogenic signaling and miRNA expression in mouse myogenic
progenitors. PLoS One. 7:e372622012. View Article : Google Scholar : PubMed/NCBI
|
|
24
|
Holaska JM and Wilson KL: Multiple roles
for emerin: Implications for Emery-Dreifuss muscular dystrophy.
Anat Rec A Discov Mol Cell Evol Biol. 288:676–680. 2006. View Article : Google Scholar : PubMed/NCBI
|
|
25
|
Jieying W, Kondo T, Yamane T, Nakazawa T,
Oishi N, Kawasaki T, Mochizuki K, Dongfeng N and Katoh R:
Heterogeneous immunoreactivity of emerin, a nuclear envelope
LEM-domain protein, in normal thyroid follicles. Acta Histochem
Cytochem. 47:289–294. 2014. View Article : Google Scholar : PubMed/NCBI
|
|
26
|
Smith ER, Meng Y, Moore R, Tse JD, Xu AG
and Xu XX: Nuclear envelope structural proteins facilitate nuclear
shape changes accompanying embryonic differentiation and fidelity
of gene expression. BMC Cell Biol. 18:82017. View Article : Google Scholar : PubMed/NCBI
|
|
27
|
Lammerding J, Hsiao J, Schulze PC, Kozlov
S, Stewart CL and Lee RT: Abnormal nuclear shape and impaired
mechanotransduction in emerin-deficient cells. J Cell Biol.
170:781–791. 2005. View Article : Google Scholar : PubMed/NCBI
|