Introduction
Liver cancer is more common in men than in women,
and is the second leading cause of cancer-associated mortality
worldwide in men living in less developed countries (1). It is estimated that ~50% of newly
diagnosed cancer cases and mortalities globally occurred in China
alone in 2012, which equates to approximately 391,250 new liver
cancer cases and 372,750 mortalities (1). Hepatocellular carcinoma (HCC) accounts
for the majority (70–90%) of primary liver cancer cases worldwide
(2). Previous epidemiological
surveys have revealed that chronic hepatitis B or C viral
infection, cirrhosis, exposure to aflatoxin B1, obesity, chronic
alcohol consumption and diabetes mellitus, as well as metabolic
abnormalities including haemochromatosis and α1-antitrypsin
deficiency, are common and significant risk factors for HCC
development (3–5). Furthermore, recent studies indicate
that approximately 1,000,000 new HCC cases are diagnosed each year
worldwide, with the same incidence and morbidity rate, indicating
that HCC diagnosis is typically at the advanced stage and prognosis
remains poor (6,7). Despite advances in diagnosis,
prevention and treatment, including ultrasonography, multiphase
computerized tomography, magnetic resonance imaging, surgical
resection, liver transplantation, transarterial chemoembolization,
radiofrequency ablation and transarterial radiation, percutaneous
ablation and systemic therapy, the prognosis for HCC patients
remains unsatisfactory (8). The
5-year relative survival rate is approximately 7% (9). Therefore, identification of novel
biomarkers for the early diagnosis of HCC is vital and may improve
HCC prognosis.
At present, many reports have focused on the
identification of prognosis-associated biomarkers The role of
astrocytic phosphoprotein PEA-15 in HCC has been evaluated and may
be a novel target for HCC treatment, as well as a predictive
biomarker for HCC patient prognosis (10). Furthermore, it has been suggested
that CKLF-like MARVEL transmembrane domain-containing protein 5 may
function as a tumor suppressor in human HCC and represent a
valuable therapeutic target (11).
microRNA (miR)-182-5p is recognized as a potential predictive
biomarker for the early recurrence of HCC (12). Currently, DNA microarray approach
has been used to investigate the genetic features of HCC in
molecular biology (13).
Accumulating evidence regarding gene expression in HCC has
demonstrated that a variety of differentially expressed genes
(DEGs) may be involved in the process of hepatocarcinogenesis
(14). The combination of
microarray techniques and bioinformatic analysis makes it
conceivable to use DEGs in one or more chips to detect potential
predictive biomarkers for several types of malignancies (15). Therefore, the present study focused
on DEGs in microarrays and aimed to identify potential predictive
biomarkers for patients with HCC.
Materials and methods
Data collection and processing
GEO2R (www.ncbi.nlm.nih.gov/geo/geo2r/) was initially used to
identify DEGs in the GSE36376 gene expression profile in the Gene
Expression Omnibus (GEO) database (16). The GSE36376 dataset (www.ncbi.nlm.nih.gov/geo/query/acc.cgi?acc=GSE36376)
is embedded in the platform GPL10558 (Illumina HumanHT-12 v4
Expression Beadchip) and includes 240 tumor tissues and 193
adjacent non-tumor tissues of two gene expression by array sets: A
training set and validation set (17).
Next, DEGs from the GSE36376 profile were acquired
using the GEO2R tool with the criteria of |log fold change|≥2 and
P≤0.05. Furthermore, the Cytoscape software (version 3.6.0) plugin,
CentiScaPe (version 2.2), was employed to identify the top 10 hub
genes in these DEGs on the basis of the following centralities:
degree, betweenness and closeness (18).
Hub gene expression, survival and
stratified analysis
The expression levels of 10 hub genes in multiple
organs, as well as in tumor and non-tumor tissues were obtained
from the GTEx portal (www.gtexportal.org/home) and the Gene Expression
Profiling Interactive Analysis (GEPIA; gepia.cancer-pku.cn/index.html) server (19). Protein expression levels of the hub
genes in liver tissue were obtained from The Human Protein Atlas
(www.proteinatlas.org) (20). A co-expression matrix was
constructed using R (version 3.5.0; www.r-project.org) to show Pearson correlations
between two of these genes.
In addition, hub genes were further analyzed for
their prognostic values using The Cancer Genome Atlas database
(cancergenome.nih.gov/). The clinical
characteristics of 360 HCC patients, including age, sex, race and
tumor stage, were obtained and used in the analysis. Gene
expression data were downloaded from the OncoLnc website
(www.oncolnc.org) at median cut off. In addition,
clinical data with statistically significant P-values (≤0.05) were
adjusted for further analysis to identify prognosis-associated
genes. For the above identified genes, clinical data were
stratified for further analysis.
Hub gene mutational and
transcriptional analysis
The mutation status of hub genes using the
cBioPortal website (www.cbioportal.org/) (21,22).
Furthermore, transcripts per million (TPM) of the hub genes in
liver tissues were analyzed to identify transcription levels at the
log scale [Log2 (TPM+1)] using the GEPIA website
(gepia.cancer-pku.cn/index.html/) (19).
Construction of risk score model and
nomogram
A risk score model was constructed based on the
expression levels of prognosis-associated genes and the
contribution coefficient (β) of the multivariate Cox proportional
hazards regression model. The formula of the model was as follows:
risk score=expression of gene1 × β1 of
gene1 + expression of gene2 × β2
of gene2 + … + expression of genen ×
βn of genen. The risk score was then divided
into high and low risk groups with the same cut-off criteria of
gene expression. A Kaplan-Meier survival curve was drawn to predict
patient survival. Prognostic receiver operating characteristic
(ROC) curves were then created at 1–5 years.
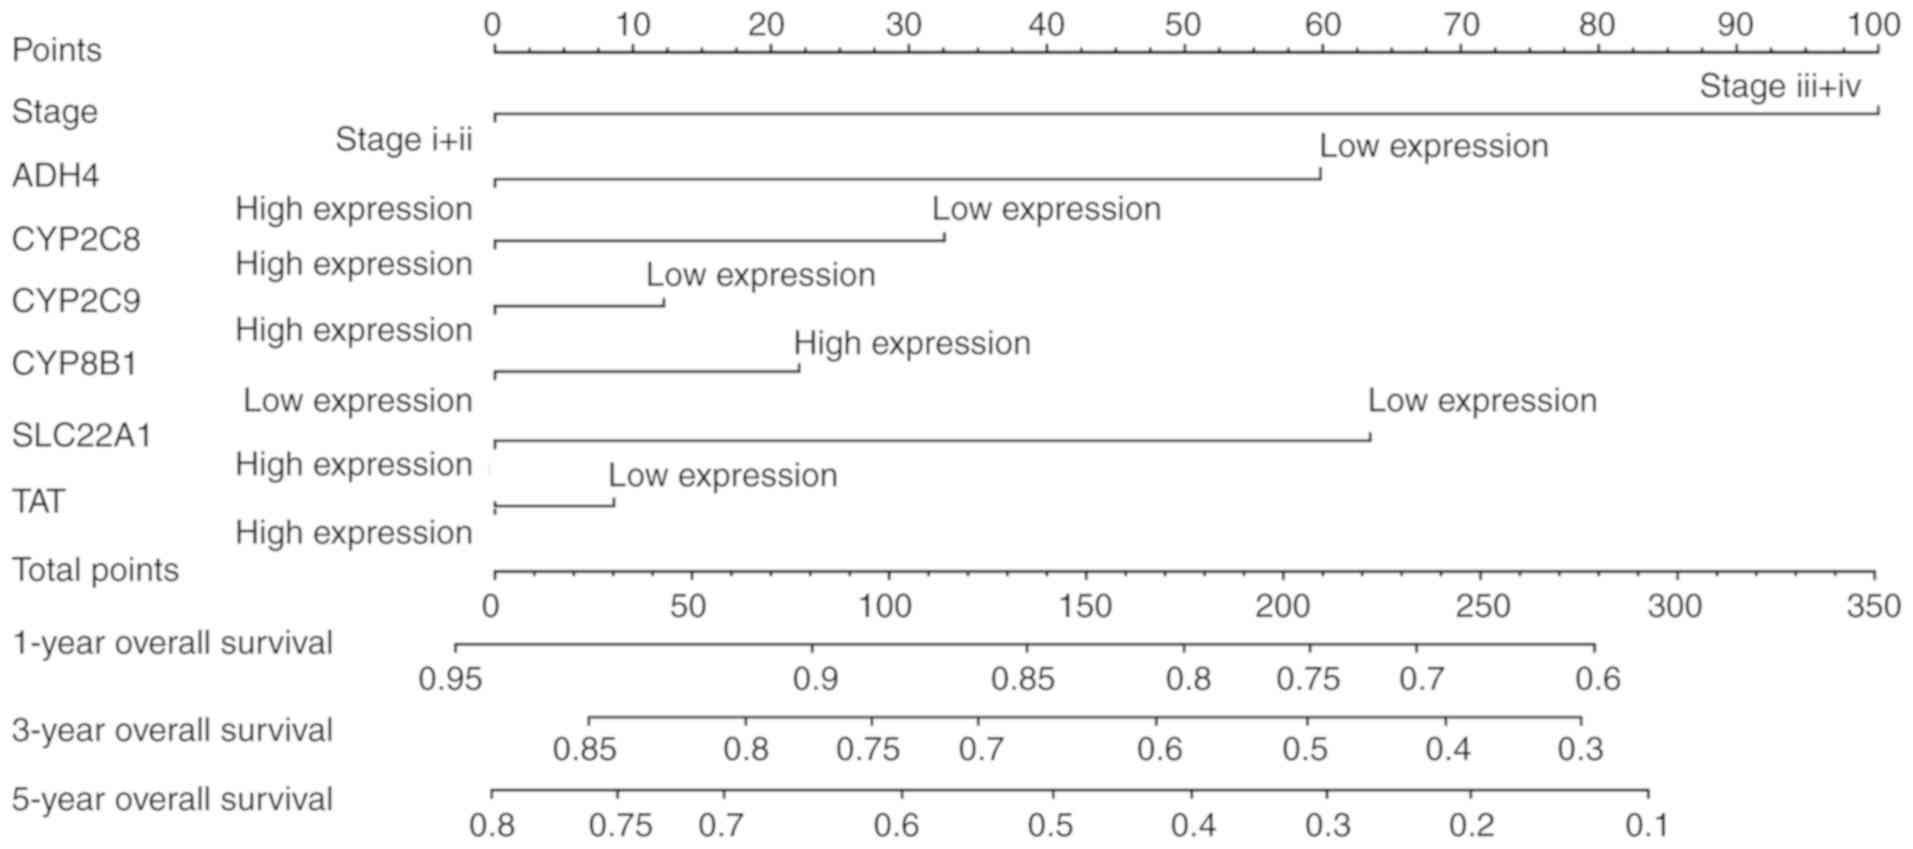
A nomogram was also constructed based on seven
prognosis-associated hub genes, clinical factors and tumor stage,
to obtain patient survival at 1, 3 and 5 years. The contribution of
each factor was limited to a maximum of 100 points.
Gene-gene and protein-protein
interactions (PPI) network construction and functional enrichment
analysis
To identify the biological processes and metabolic
pathways of these hub genes, enrichment analysis of Gene Ontology
(GO) was performed, including biological process (BP), cellular
component (CC), and molecular function (MF), and Kyoto Encyclopedia
of Genes and Genomes (KEGG) pathways using The Database for
Annotation, Visualization and Integrated Discovery (DAVID;
david.ncifcrf.gov/) (15,23).
In addition, visualized GO results were presented by the Cytoscape
BinGO plugin version 3.6.0 (18,24).
Gene-gene interaction networks were constructed using the GeneMANIA
plugin (version 3.4.1) in Cytoscape software version 3.6.0
(25). The PPI network depicted
interactions among these proteins and was constructed using the
Search Tool for the Retrieval of Interacting Genes website
(string-db.org/cgi/input.pl) (26).
Statistical analysis
Kaplan-Meier survival analysis by log rank test was
used to calculate the median survival time (MST). Univariate and
multivariate Cox proportional hazards models were used to calculate
the hazard ratio (HR) and 95% confidence interval (CI). P≤0.05 was
considered to indicate a statistically significant difference. Box
plots by unpaired t-test, survival curves and ROC curves including
area under the curve (AUC) were produced using GraphPad version 7.0
(GraphPad Software, Inc., La Jolla, CA, USA). Statistical analysis
was performed using SPSS software version 16.0 (SPPS, Inc.,
Chicago, IL, USA).
Results
Processing of DEGs and hub genes
A total of 71 DEGs were obtained from the GSE36376
dataset and the top 10 hub genes were identified. These 10 hub
genes included cytochrome P450 family 2 subfamily E member 1
(CYP2E1), tyrosine aminotransferase (TAT), cytochrome
P450 family 2 subfamily A member 6 (CYP2A6), cytochrome P450
family 8 subfamily B member 1 (CYP8B1), cytochrome P450
family 2 subfamily C member 9 (CYP2C9), hydroxysteroid 11-β
dehydrogenase 1 (HSD11B1), hydroxysteroid 17-β dehydrogenase
13 (HSD17B13), solute carrier family 22 member 1
(SLC22A1), cytochrome p450 family 2 subfamily C member 8
(CYP2C8) and alcohol dehydrogenase 4 (class II), pi
polypeptide (ADH4). Detailed results are shown in Table I.
 | Table I.Identified hub genes in the GSE36376
dataset and their screening centralities. |
Table I.
Identified hub genes in the GSE36376
dataset and their screening centralities.
| Genes | Degree
centralities | Betweenness
centralities | Closeness
centralities |
|---|
| CYP2E1 | 37 | 362.1080892 | 0.009345794 |
| TAT | 32 | 266.8918244 | 0.008928571 |
| CYP2A6 | 32 | 97.3346815 | 0.008064516 |
| CYP8B1 | 32 | 109.0359712 | 0.008064516 |
| CYP2C9 | 31 | 179.8498746 | 0.007874016 |
| HSD11B1 | 31 | 333.8964087 | 0.008849558 |
|
HSD17B13 | 31 | 147.7138107 | 0.008403361 |
| SLC22A1 | 30 | 84.7381197 | 0.008403361 |
| CYP2C8 | 29 | 36.7257238 | 0.007751938 |
| ADH4 | 28 | 52.5113332 | 0.007575758 |
Analysis of hub gene expression,
mutation and transcription
Hub gene expression in tumor tissues was
downregulated compared with normal tissues in all cases (Fig. 1). However, only CYP2A6, CYP2C8,
CYP2E1, HSD17B13 and SLC22A1 had a significant
alteration in expression (P<0.05). Tissue expression data
indicated that all of the hub genes were highly expressed in liver
tissue (Fig. 2). Mutation analysis
of hub genes revealed that mutations were present in different
ratios (Fig. 3A). At 11%,
HSD11B1 was the most significant in terms of mutation ratio,
of which the majority were amplification mutations. Transcriptional
analysis (Fig. 3B) demonstrated
that all hub genes were differentially transcribed in tumor and
normal tissues. Furthermore, normal tissues had consistently high
TPM in the 10 hub genes. Detailed results are shown in Fig. 3.
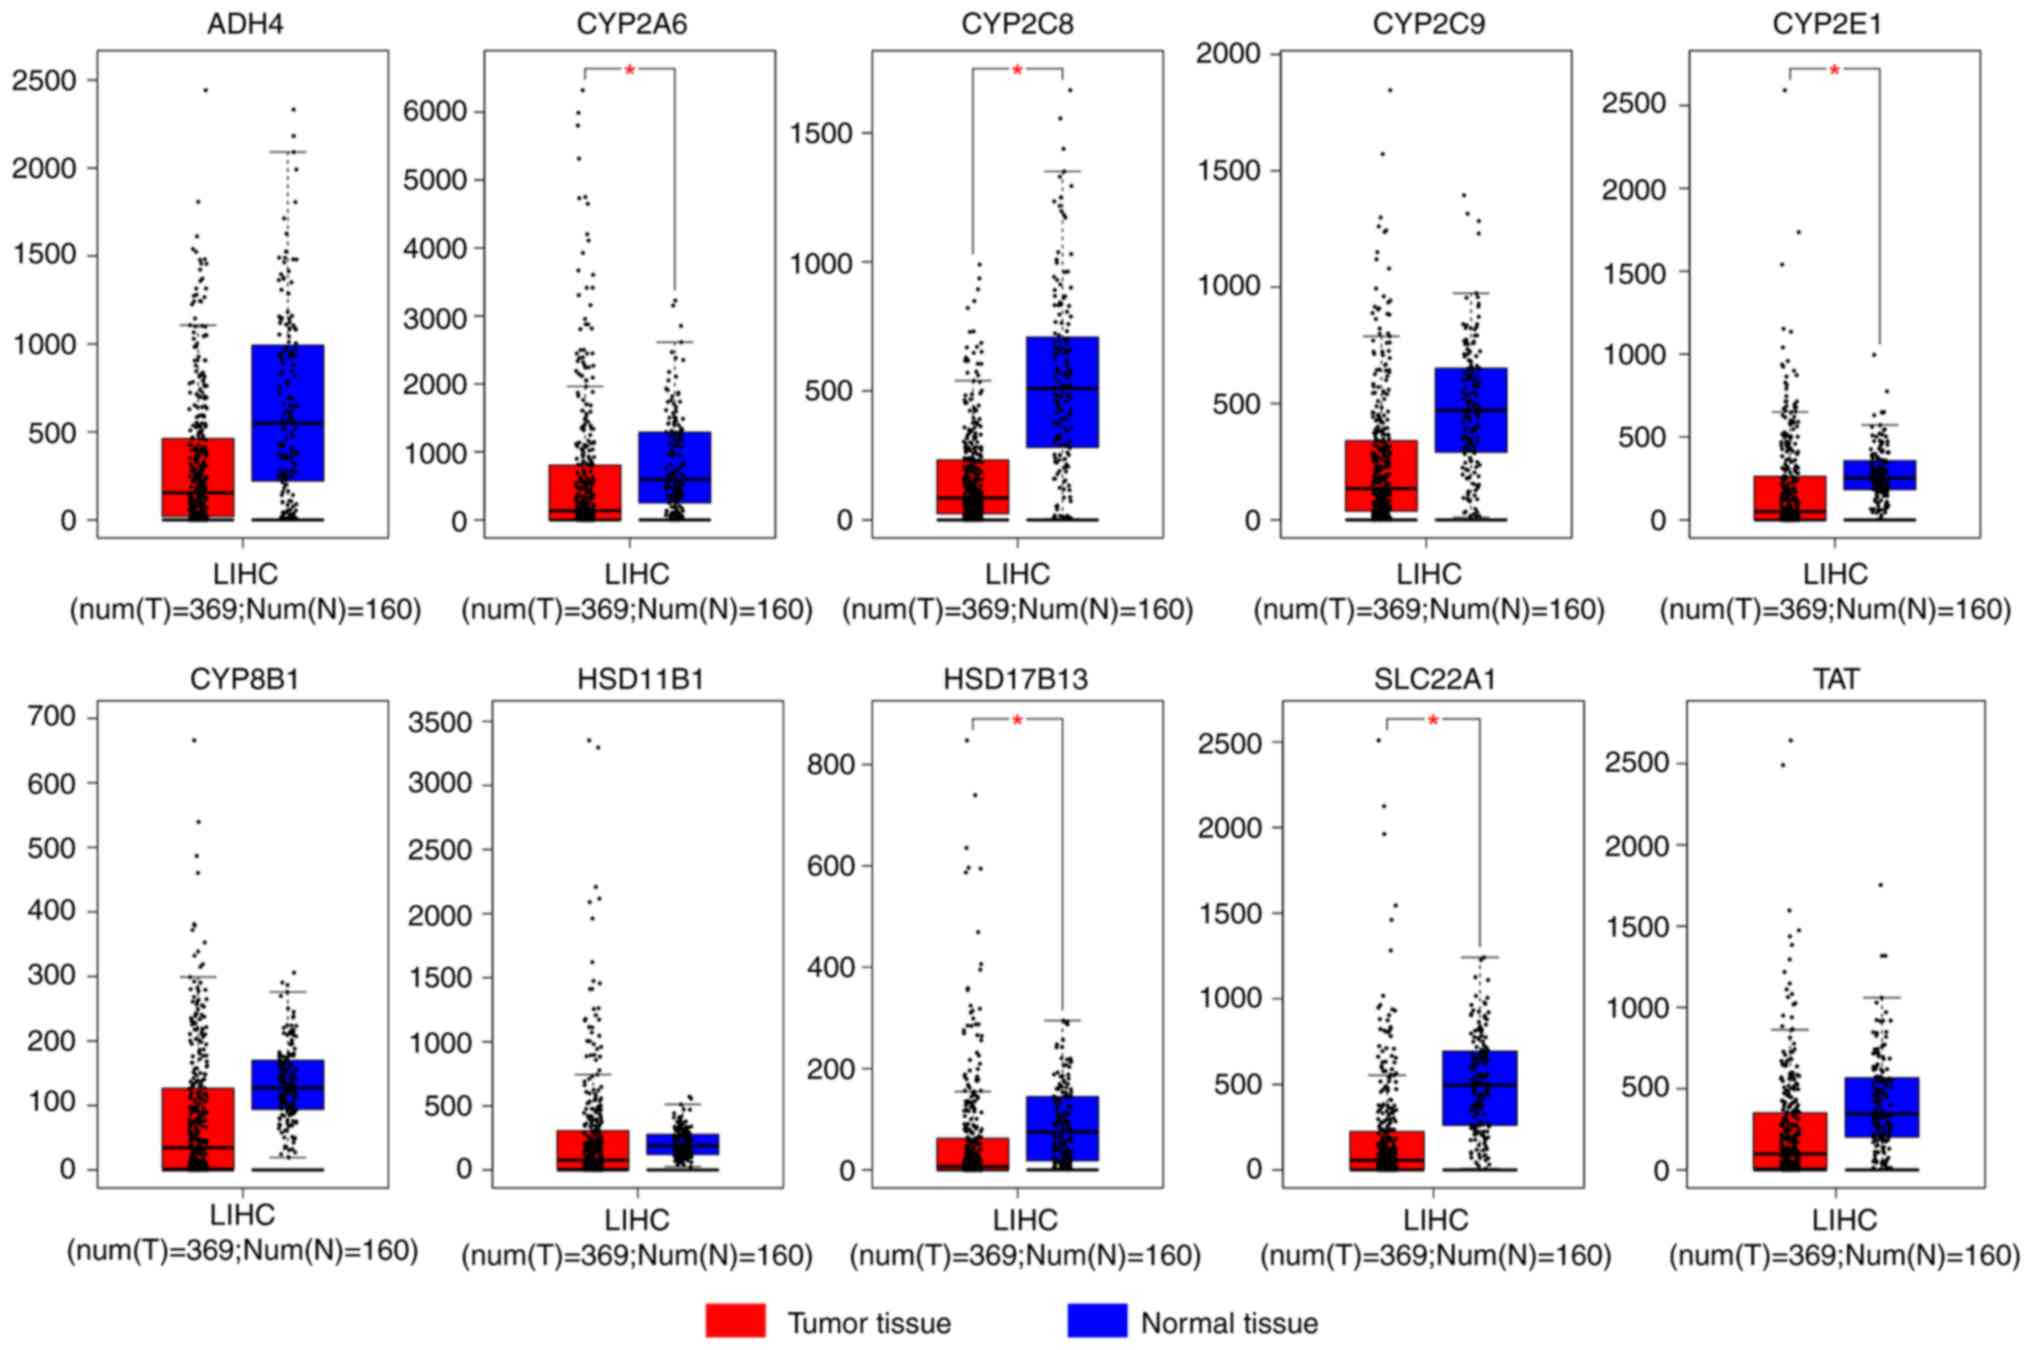 | Figure 1.Expression levels of hub genes
ADH4, CYP2A6, CYP2C8, CYP2C9, CYP2E1, CYP8B1, HSD11B1, HSD17B13,
SLC22A1 and TAT in tumor and normal tissues. *P<0.05
vs. normal tissue. LIHC, liver hepatocellular carcinoma;
CYP2E1, cytochrome P450 family 2 subfamily E member 1;
TAT, tyrosine aminotransferase; CYP2A6, cytochrome
P450 family 2 subfamily A member 6; CYP8B1, cytochrome P450
family 8 subfamily B member 1; CYP2C9, cytochrome P450
family 2 subfamily C member 9; HSD11B1, hydroxysteroid 11-β
dehydrogenase 1; HSD17B13, hydroxysteroid 17-β dehydrogenase
13; SLC22A1, solute carrier family 22 member 1;
CYP2C8, cytochrome p450 family 2 subfamily C member 8;
ADH4, alcohol dehydrogenase 4 (class II), pi
polypeptide. |
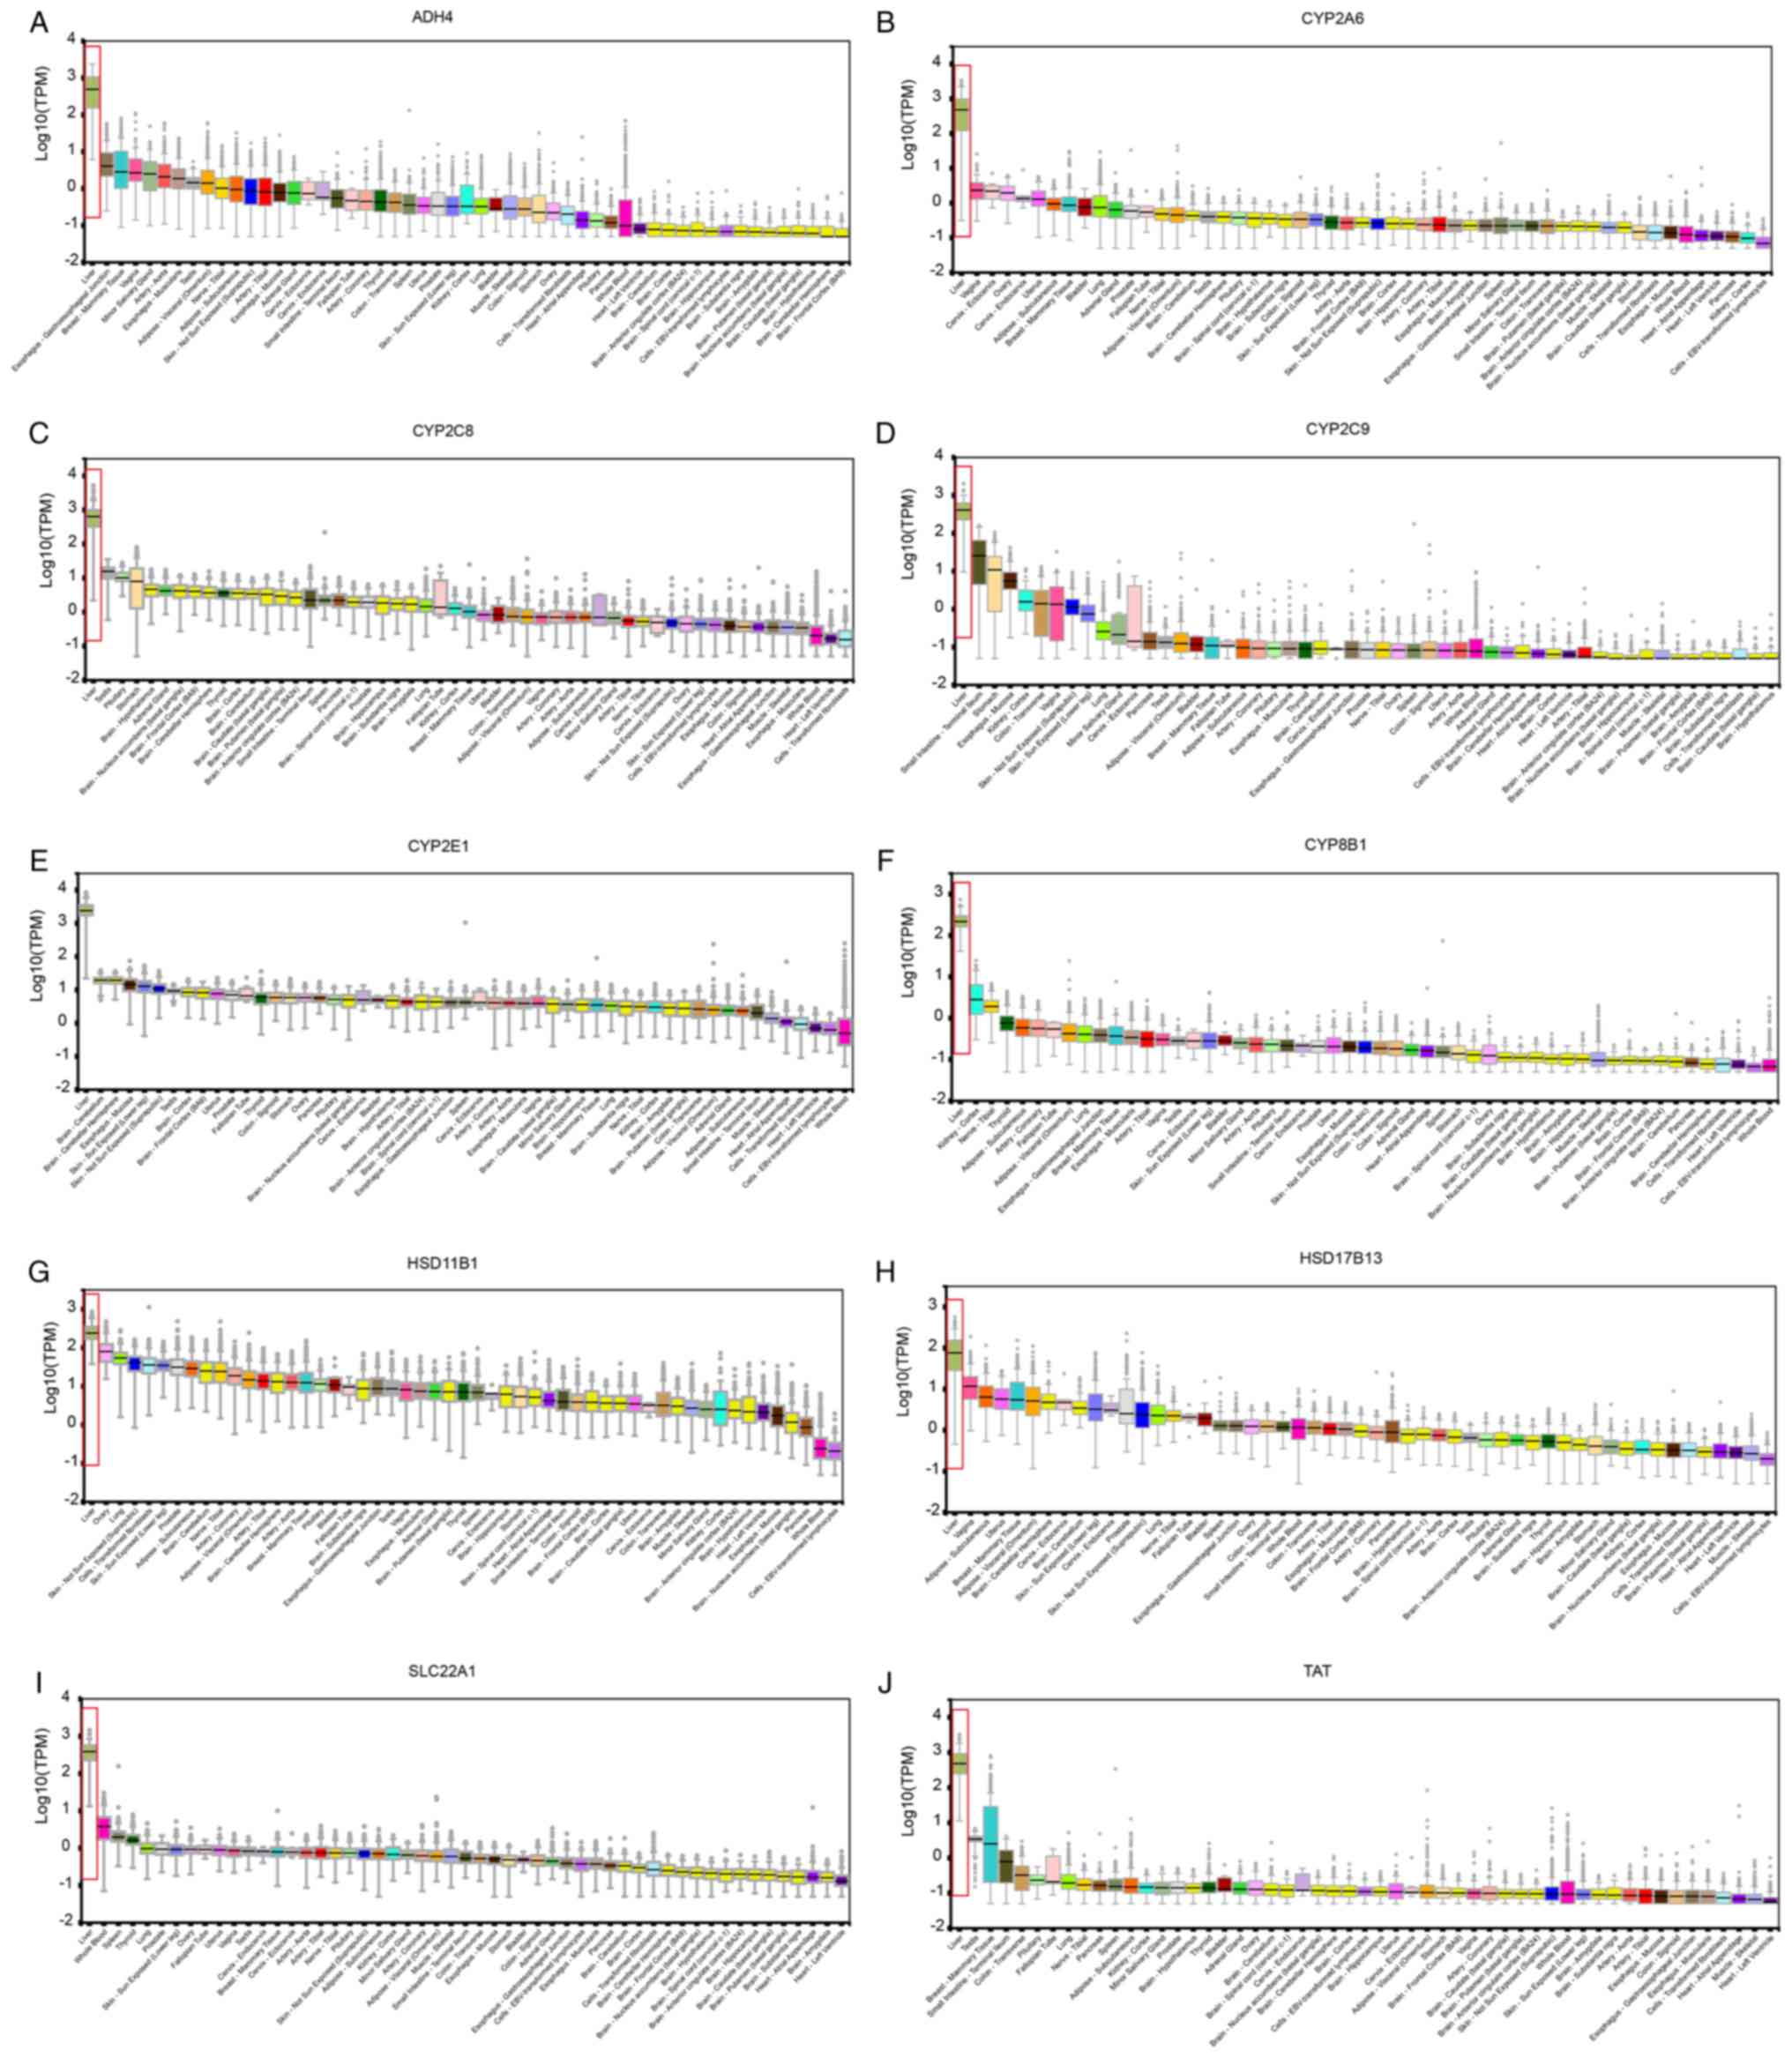 | Figure 2.Expression levels of hub genes (A)
ADH4, (B) CYP2A6, (C) CYP2C8, (D)
CYP2C9, (E) CYP2E1, (F) CYP8B1, (G)
HSD11B1, (H) HSD17B13, (I) SLC22A1 and (J)
TAT in different organs. High liver expression was noted in
all hub genes. TPM, transcripts per million; CYP2E1,
cytochrome P450 family 2 subfamily E member 1; TAT, tyrosine
aminotransferase; CYP2A6, cytochrome P450 family 2 subfamily
A member 6; CYP8B1, cytochrome P450 family 8 subfamily B
member 1; CYP2C9, cytochrome P450 family 2 subfamily C
member 9; HSD11B1, hydroxysteroid 11-β dehydrogenase 1;
HSD17B13, hydroxysteroid 17-β dehydrogenase 13;
SLC22A1, solute carrier family 22 member 1; CYP2C8,
cytochrome p450 family 2 subfamily C member 8; ADH4, alcohol
dehydrogenase 4 (class II), pi polypeptide. |
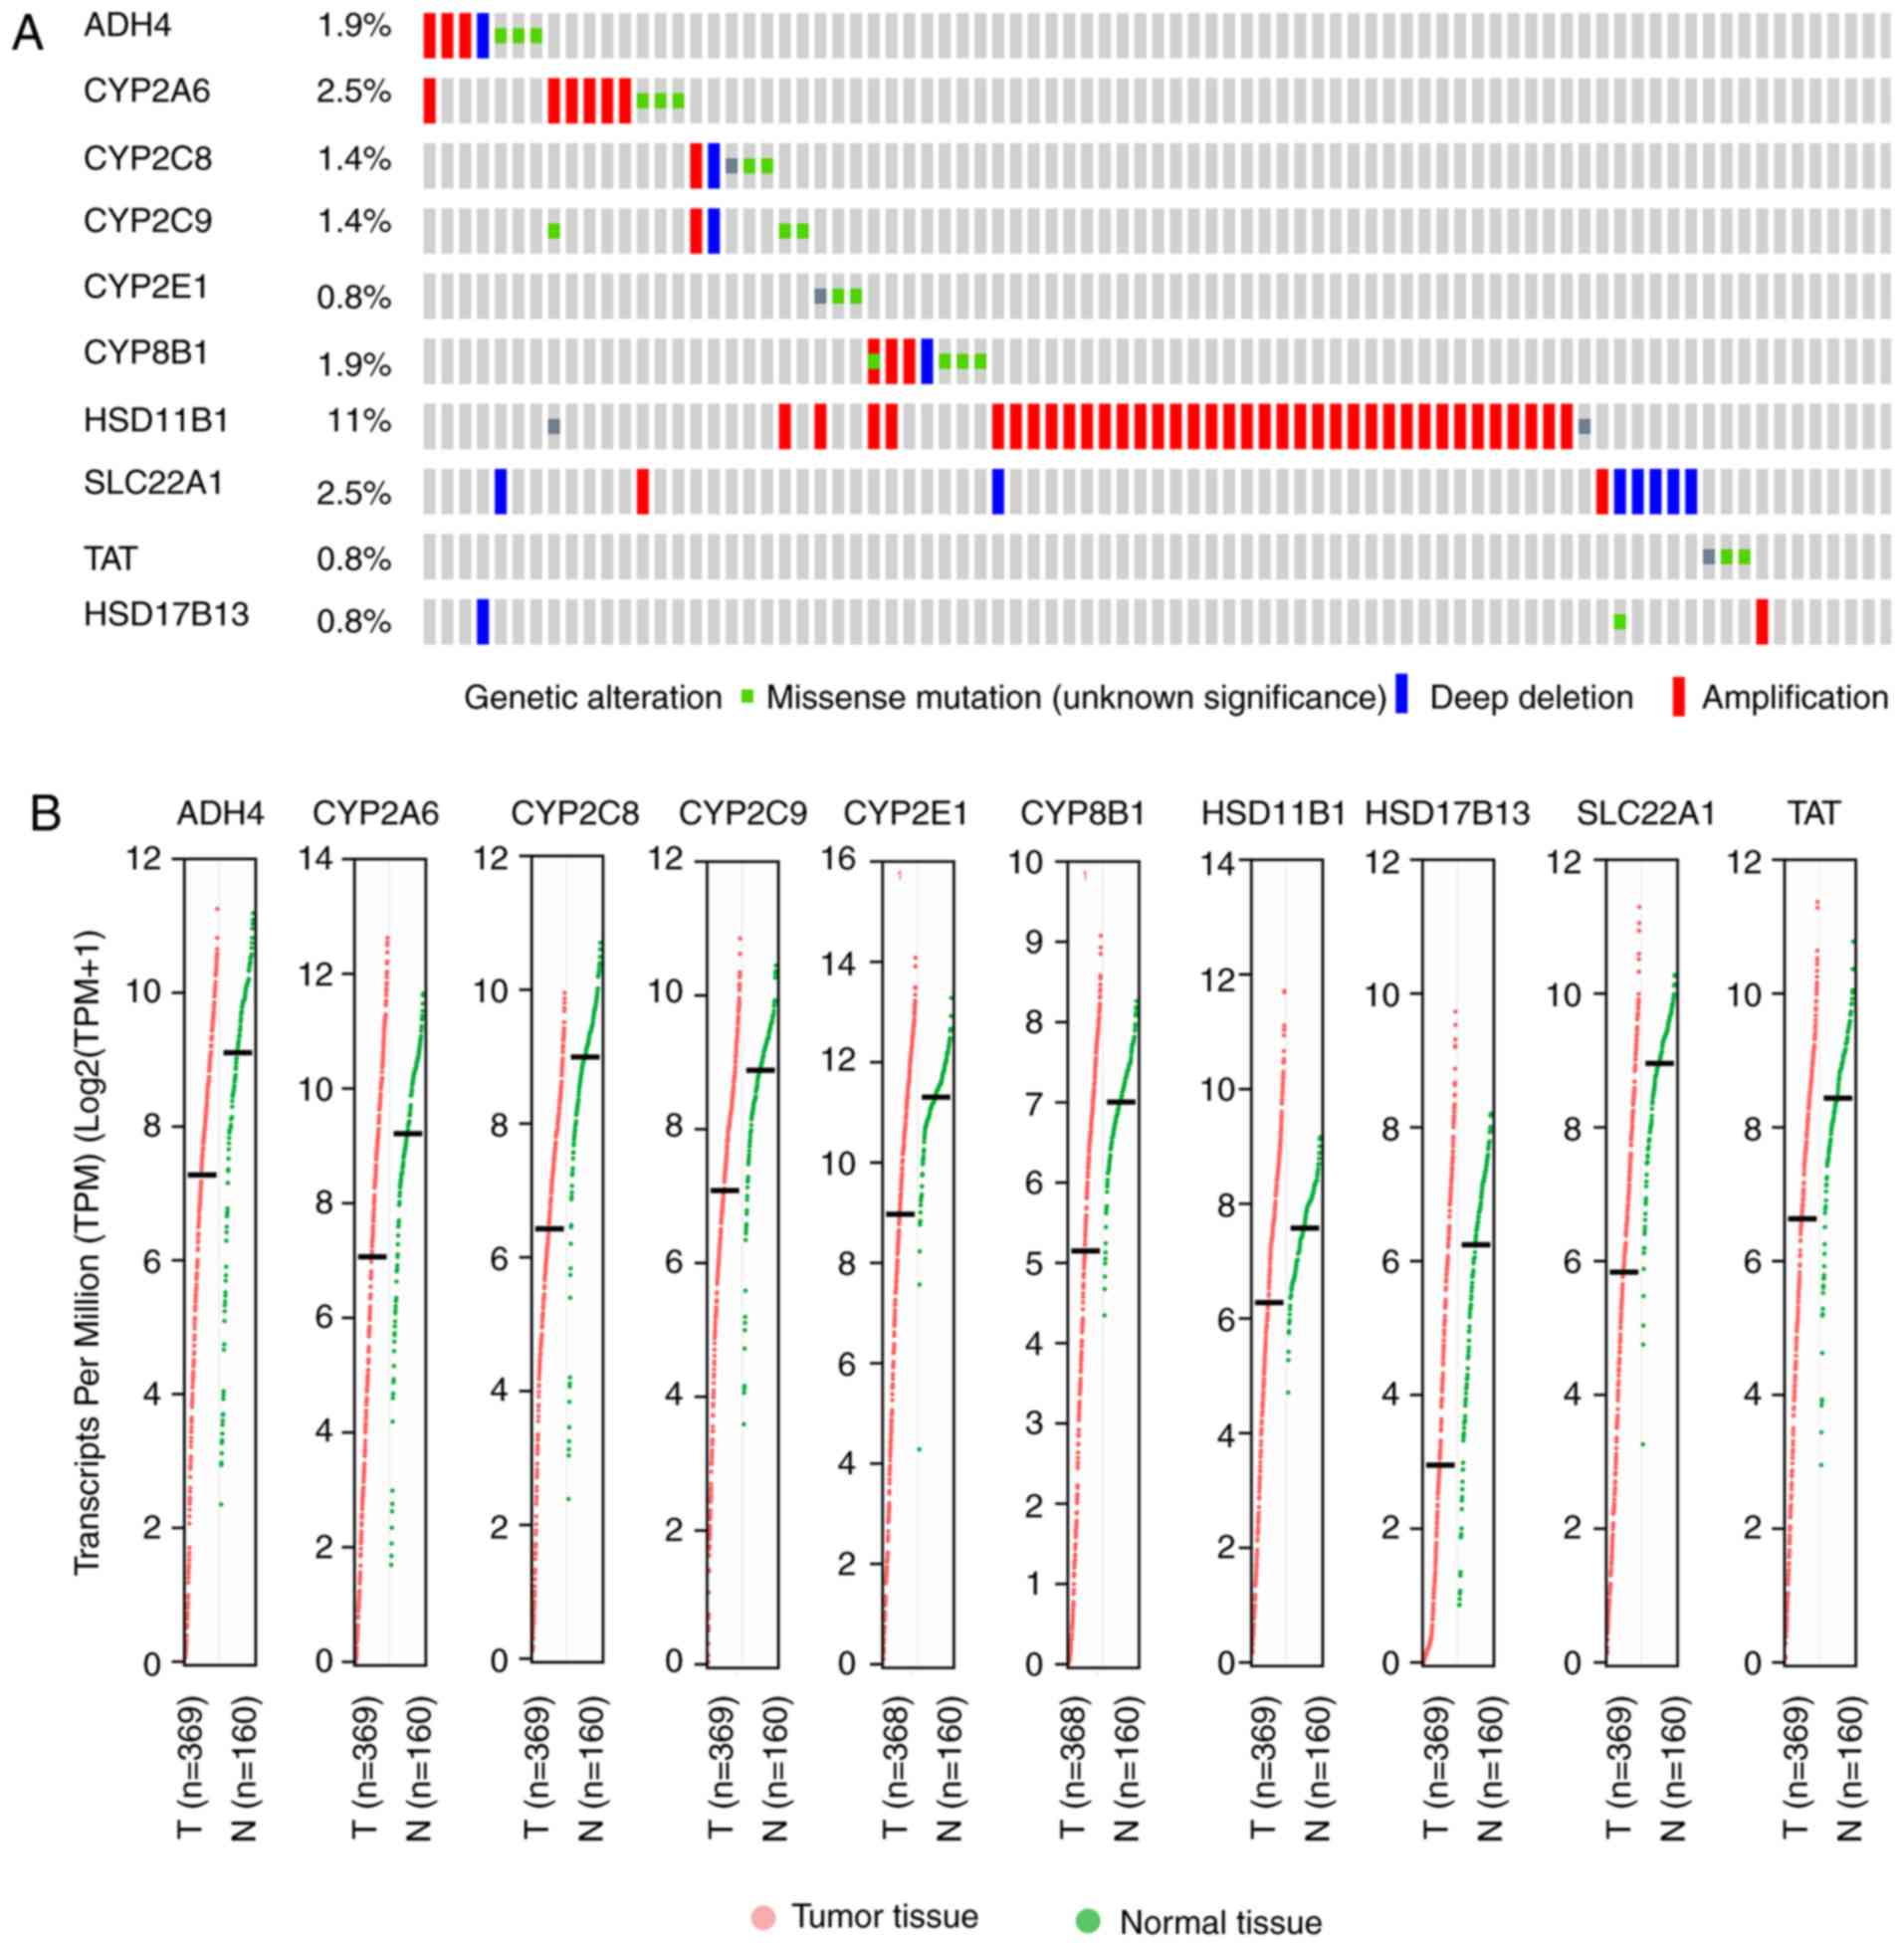 | Figure 3.Mutational and transcriptional
analysis of hub genes. (A) Mutational analysis including missense
mutation, deep deletion and amplification of the 10 hub genes. (B)
Transcriptional analyses (TPM) of the 10 hub genes in tumor and
normal tissues. TPM, transcripts per million; CYP2E1,
cytochrome P450 family 2 subfamily E member 1; TAT, tyrosine
aminotransferase; CYP2A6, cytochrome P450 family 2 subfamily
A member 6; CYP8B1, cytochrome P450 family 8 subfamily B
member 1; CYP2C9, cytochrome P450 family 2 subfamily C
member 9; HSD11B1, hydroxysteroid 11-β dehydrogenase 1;
HSD17B13, hydroxysteroid 17-β dehydrogenase 13;
SLC22A1, solute carrier family 22 member 1; CYP2C8,
cytochrome p450 family 2 subfamily C member 8; ADH4, alcohol
dehydrogenase 4 (class II), pi polypeptide. |
Protein expression data indicated that eight
proteins were highly expressed in liver tissue, excluding
TAT and CYP8B1 (data not shown; Fig. 4), which was similar to the tissue
expression results.
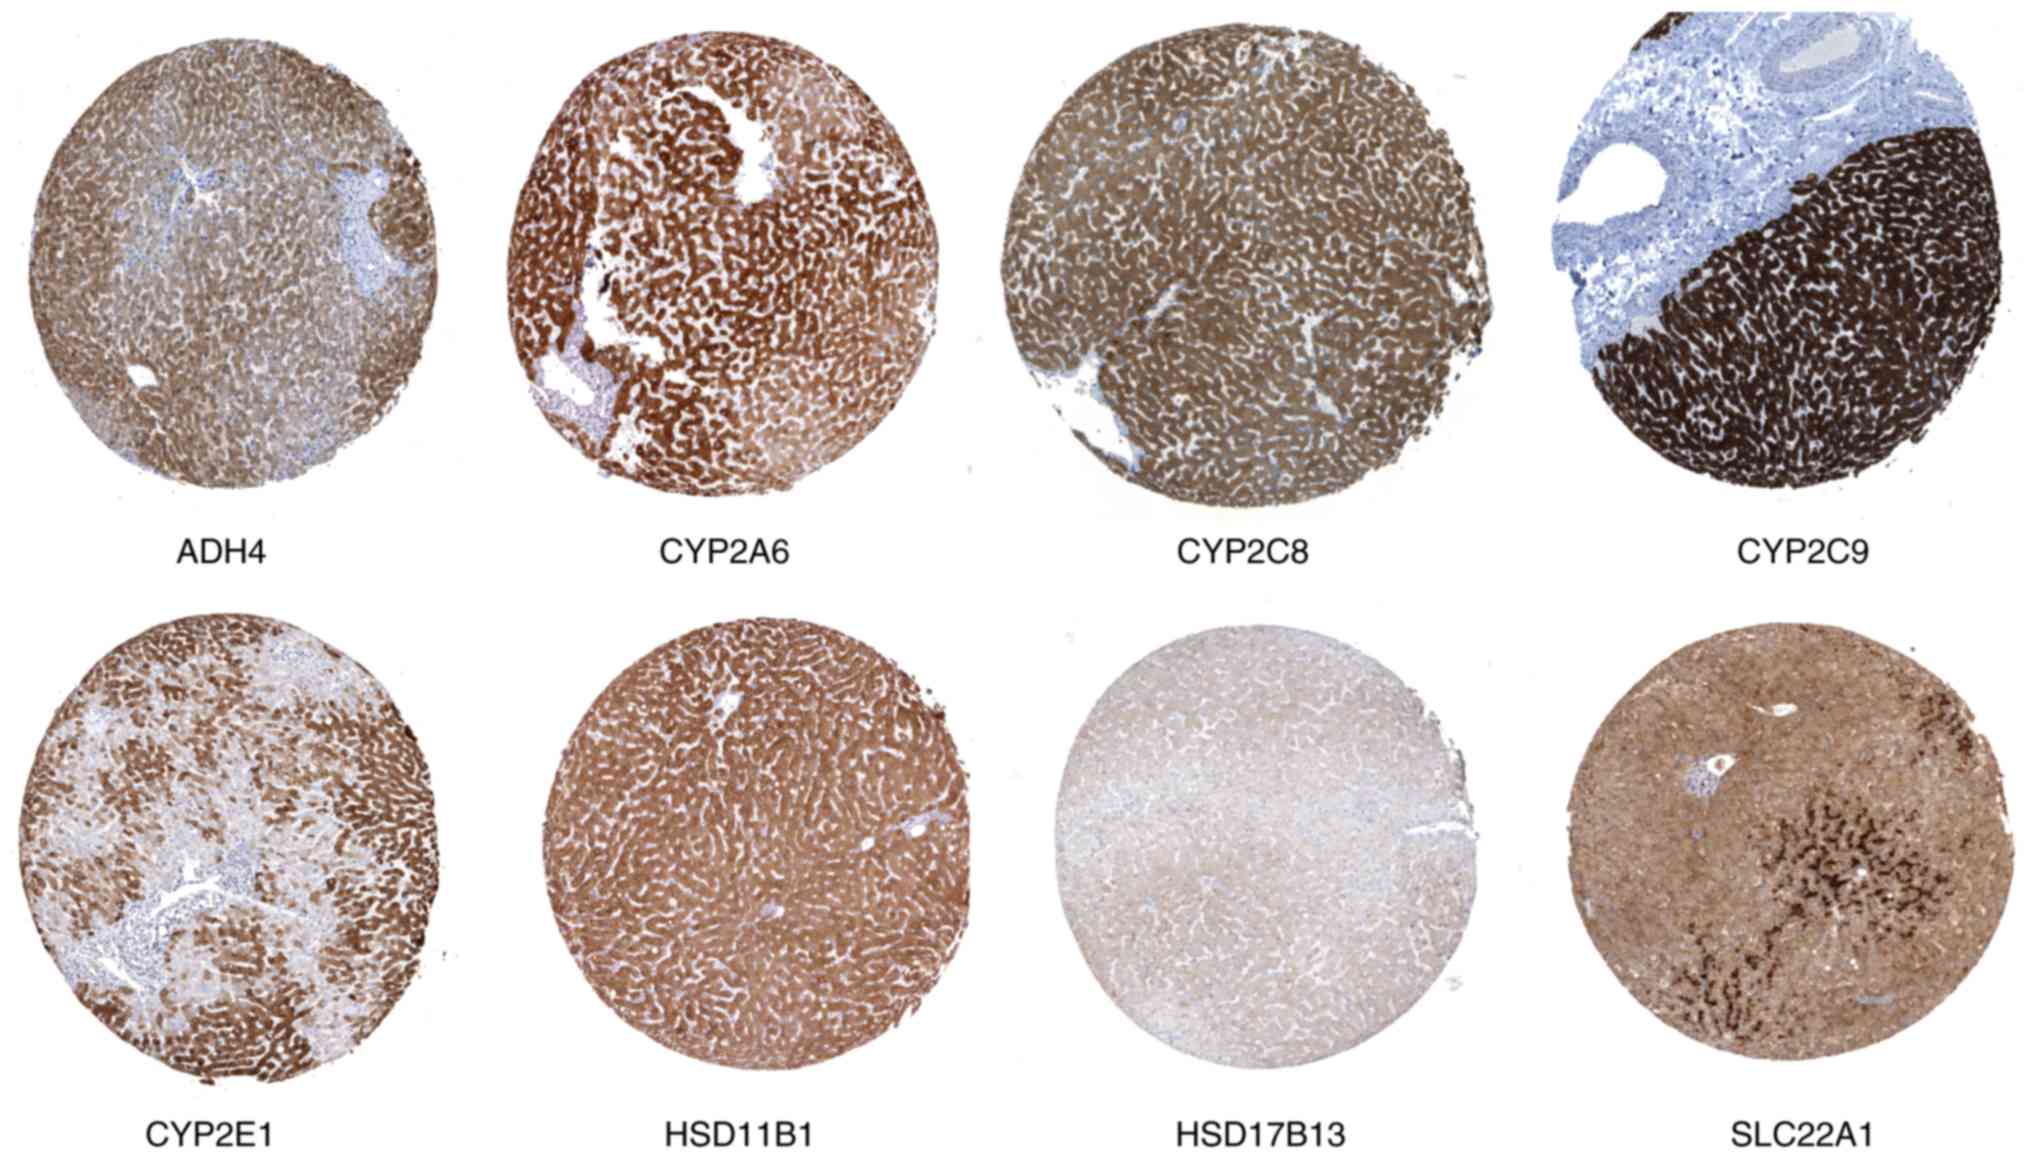 | Figure 4.Immunohistochemistry results of
protein expression levels of hub genes ADH4, CYP2A6, CYP2C8,
CYP2C9, CYP2E1, HSD11B1, HSD17B13 and SLC22A1 in normal
liver tissues. ADH4, alcohol dehydrogenase 4 (class II), pi
polypeptide; CYP2A6, cytochrome P450 family 2 subfamily A
member 6; CYP2C8, cytochrome p450 family 2 subfamily C
member 8; CYP2C9, cytochrome P450 family 2 subfamily C
member 9; CYP2E1, cytochrome P450 family 2 subfamily E
member 1; HSD11B1, hydroxysteroid 11-β dehydrogenase 1;
HSD17B13, hydroxysteroid 17-β dehydrogenase 13;
SLC22A1, solute carrier family 22 member 1. |
Demographic and clinicopathological
characteristics
A total of 360 HCC patients were included in the
dataset. Survival analysis indicated that tumor stage showed
statistical significance (log-rank P<0.0001), but all other
factors were not significant (log-rank P>0.05; Table II).
| Table II.Demographic characteristics of HCC
patients. |
Table II.
Demographic characteristics of HCC
patients.
| Variables | Patients
(n=360) | Number (%) | MST (days) | HR (95% CI) | Log-rank
P-value |
|---|
| Race |
|
Asian | 155 | 44 (28.4) | NA | Ref. |
|
|
Non-Asian | 196 | 78 (39.8) | 1,397 | 1.29
(0.89–1.87) | 0.184 |
| Sex |
|
Male | 244 | 78 (32.0) | 2,486 | Ref. |
|
|
Female | 116 | 48 (41.4) | 1,560 | 1.21
(0.84–1.73) | 0.308 |
| Age (years) |
|
≤61 | 186 | 59 (31.7) | 2,116 | Ref. |
|
|
>61 | 171 | 65 (38.0) | 1,622 | 1.18
(0.83–1.69) | 0.349 |
| Tumor stage |
| I and
II | 252 | 66 (26.2) | 2,532 | Ref. |
|
| III and
IV | 87 | 48 (55.2) |
770 | 2.50
(1.72–3.63) | <0.0001 |
Expression levels and survival
analysis of hub genes
In the univariate survival analysis, ADH4,
CYP2C8, CYP2C9, CYP2E1, CYP8B1, HSD17B13, SLC22A1 and
TAT were significant (P≤0.05; Table III and Fig. 5). Following adjustment for tumor
stage, ADH4, CYP2C8, CYP2C9, CYP8B1, SLC22A1, TAT and
HSD17B13 were significant (P≤0.05; Table III) while CYP2A6, CYP2E1,
HSD11B1 were not significant (P>0.05). All hub genes were
significantly different when comparing high and low expression
levels (P<0.0001; Fig. 6A).
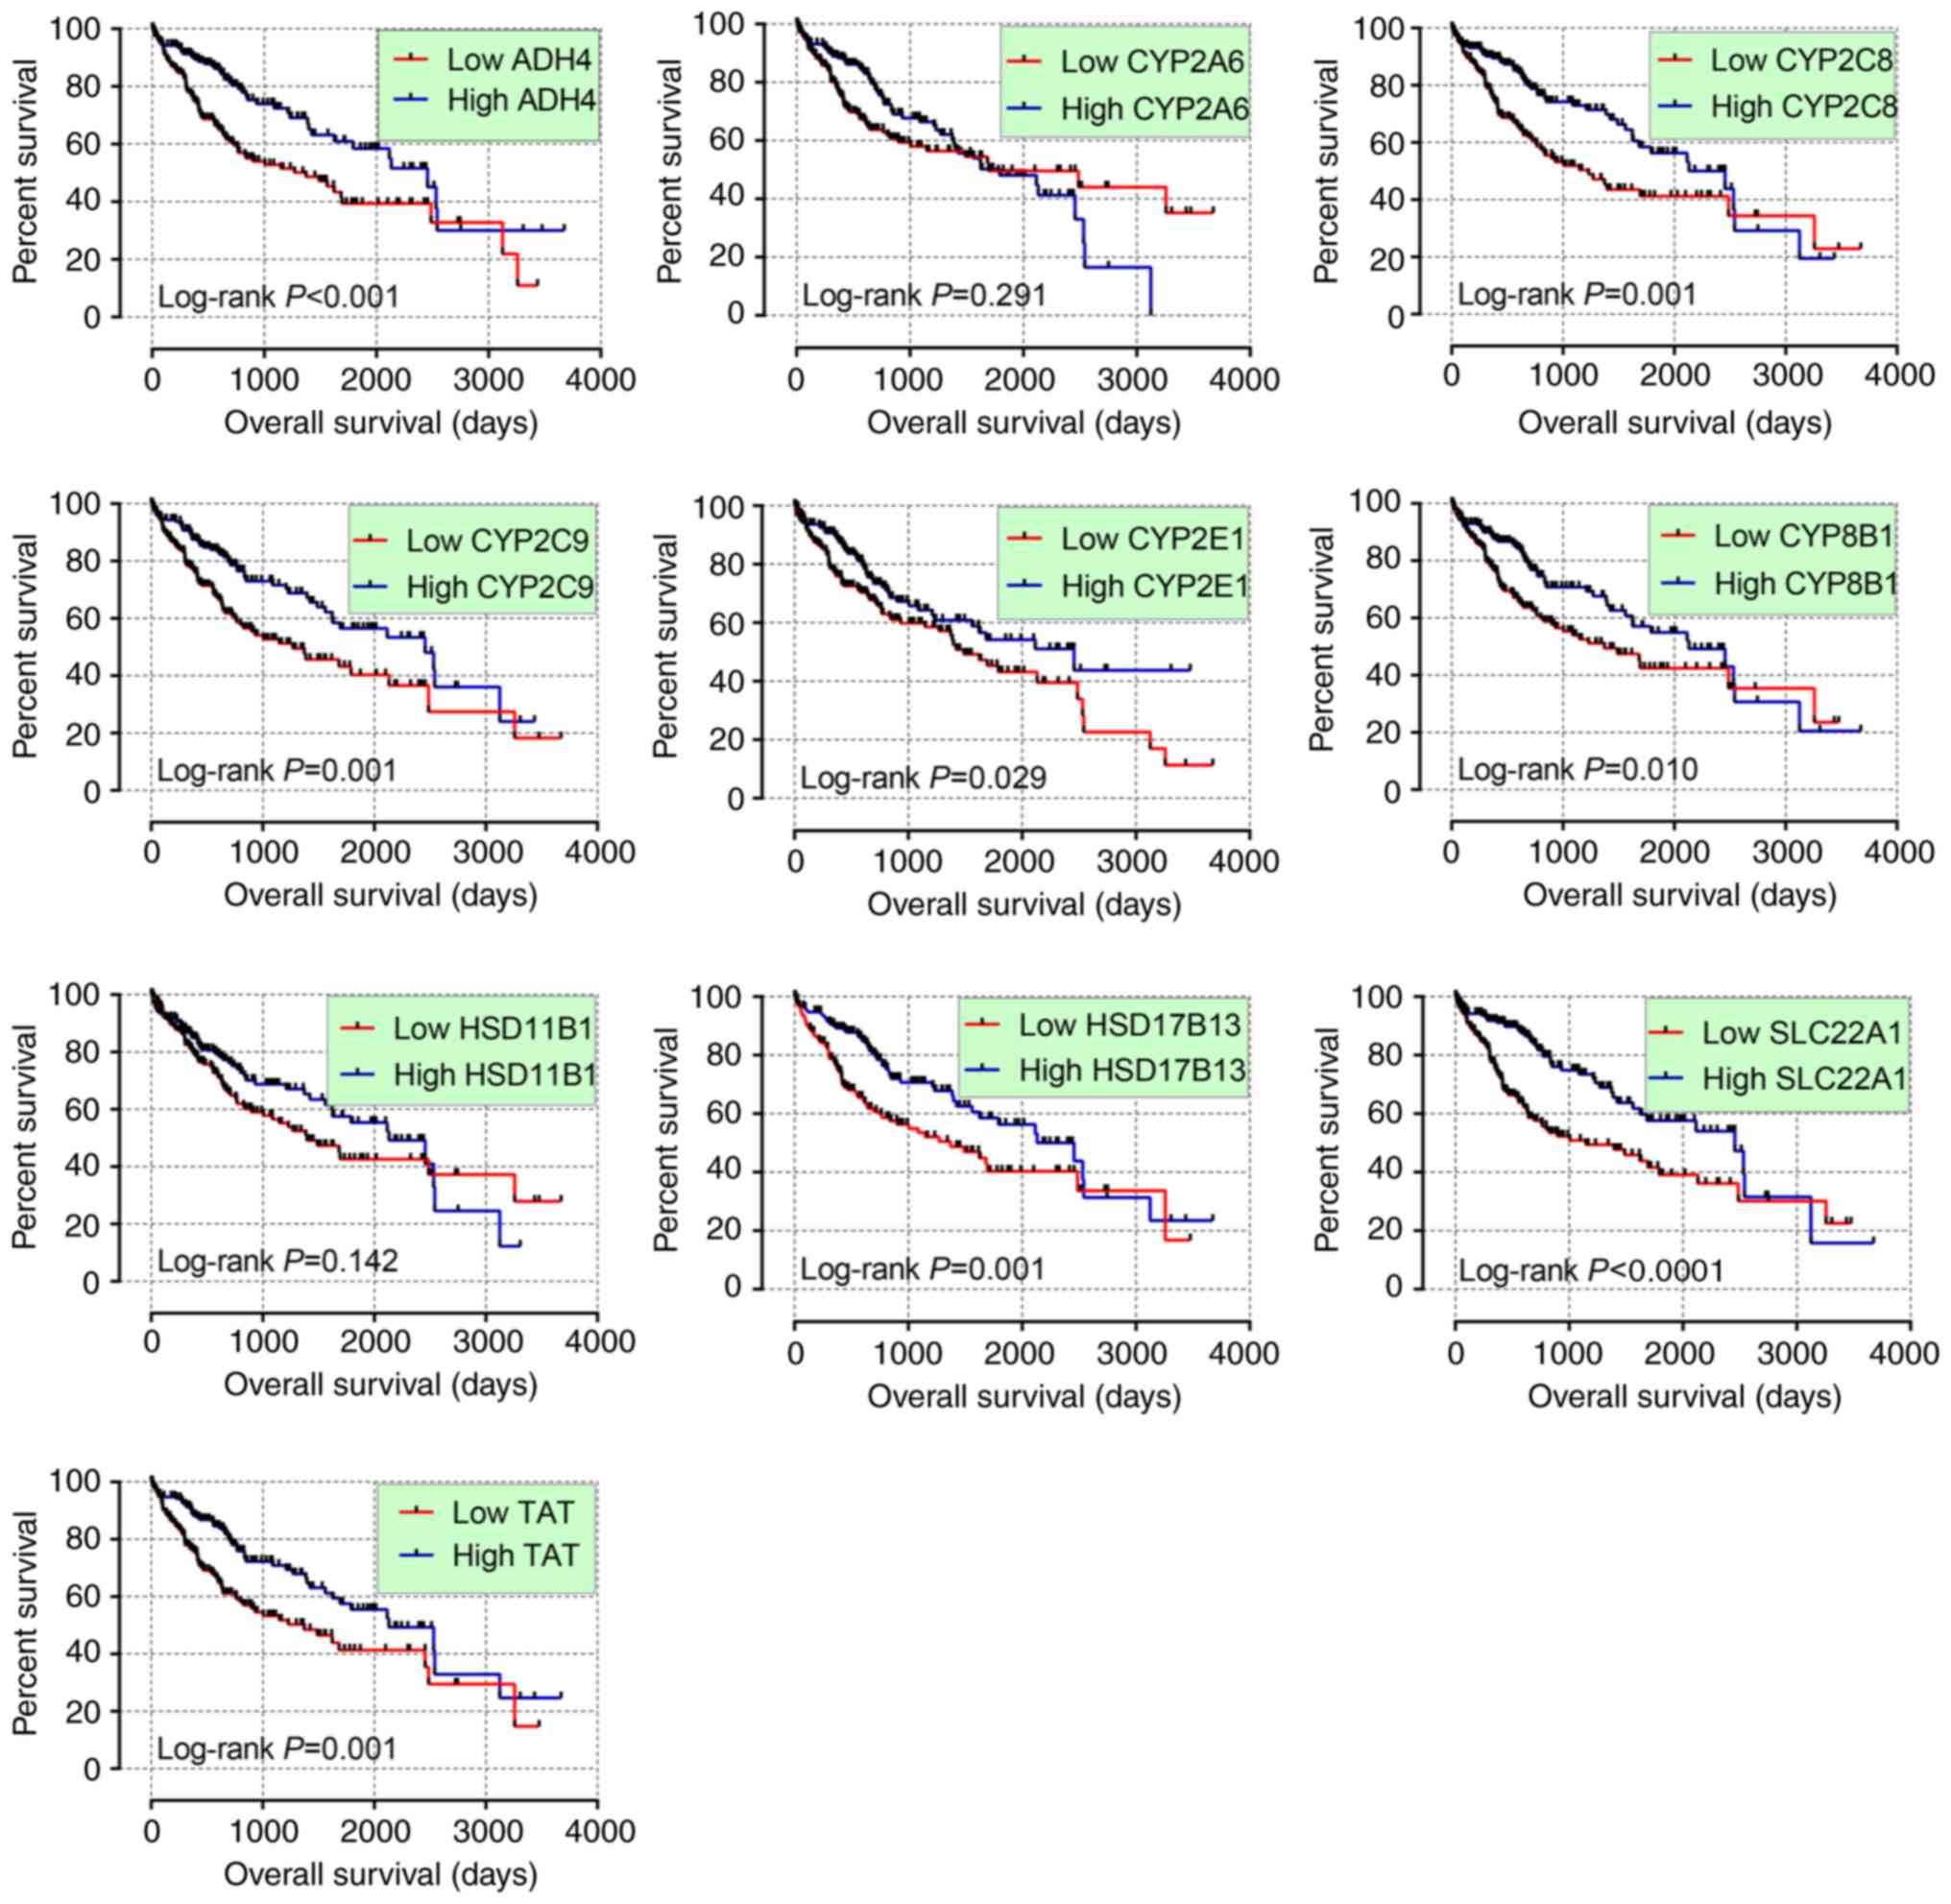 | Figure 5.Kaplan-Meier plots of hub genes
ADH4, CYP2A6, CYP2C8, CYP2C9, CYP2E1, CYP8B1, HSD11B1, HSD17B13,
SLC22A1 and TAT. CYP2E1, cytochrome P450 family 2
subfamily E member 1; TAT, tyrosine aminotransferase;
CYP2A6, cytochrome P450 family 2 subfamily A member 6;
CYP8B1, cytochrome P450 family 8 subfamily B member 1;
CYP2C9, cytochrome P450 family 2 subfamily C member 9;
HSD11B1, hydroxysteroid 11-β dehydrogenase 1;
HSD17B13, hydroxysteroid 17-β dehydrogenase 13;
SLC22A1, solute carrier family 22 member 1; CYP2C8,
cytochrome p450 family 2 subfamily C member 8; ADH4, alcohol
dehydrogenase 4 (class II), pi polypeptide. |
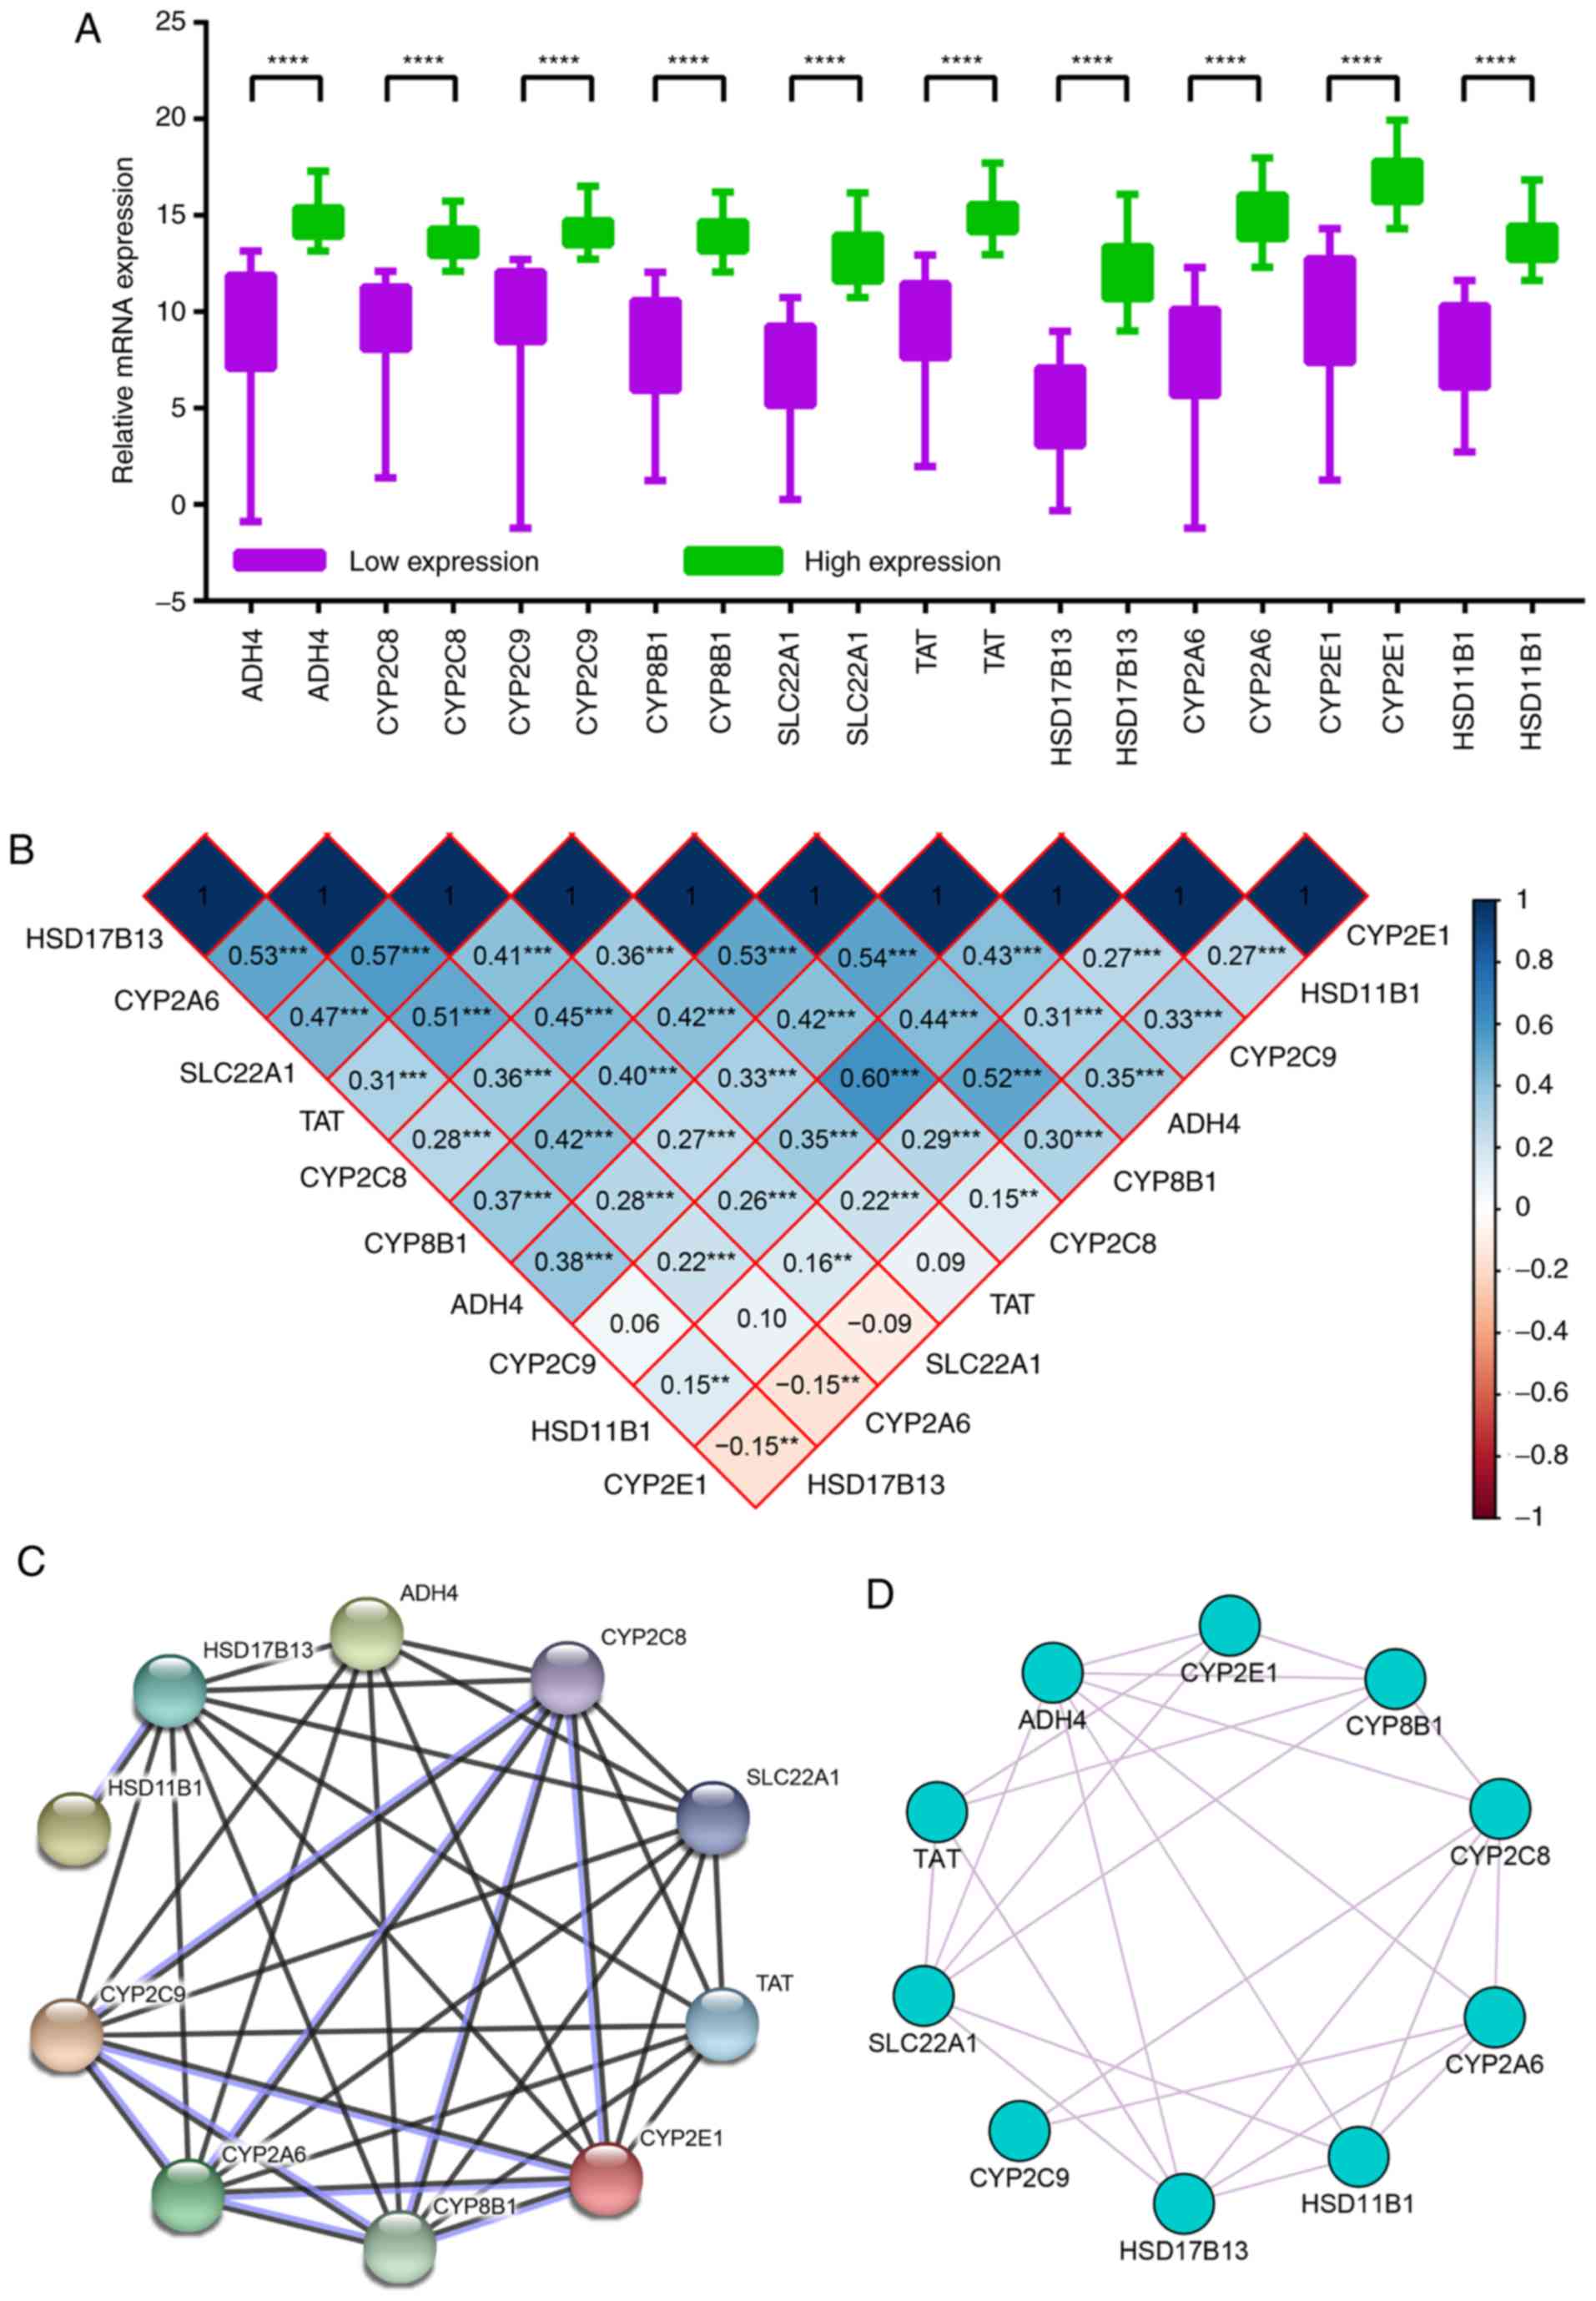 | Figure 6.Expression levels, Pearson's
correlations and expression network analysis of hub genes. (A)
Relative mRNA expression levels in low expression and high
expression groups. (B) Pearson correlation analysis of hub genes.
Blue indicates positive correlation and red indicates negative
correlation. (C) Protein-protein interaction network and (D)
Gene-gene co-expression network of hub genes. **P<0.01,
***P<0.001, ****P<0.0001. CYP2E1, cytochrome P450
family 2 subfamily E member 1; TAT, tyrosine
aminotransferase; CYP2A6, cytochrome P450 family 2 subfamily
A member 6; CYP8B1, cytochrome P450 family 8 subfamily B
member 1; CYP2C9, cytochrome P450 family 2 subfamily C
member 9; HSD11B1, hydroxysteroid 11-β dehydrogenase 1;
HSD17B13, hydroxysteroid 17-β dehydrogenase 13;
SLC22A1, solute carrier family 22 member 1; CYP2C8,
cytochrome p450 family 2 subfamily C member 8; ADH4, alcohol
dehydrogenase 4 (class II), pi polypeptide. |
| Table III.Survival analysis of HCC patient
prognosis. |
Table III.
Survival analysis of HCC patient
prognosis.
| Gene
expression |
Patients/events | MST (days) | Crude HR (95%
CI) | Crude P-value | Adjusted HR (95%
CI) | Adjusted
P-value |
|---|
| ADH4 |
|
Low | 180/80 | 1,372 | Ref. |
| Ref. |
|
|
High | 180/46 | 2,456 | 0.52
(0.36–0.75) |
<0.001a | 0.55
(0.38–0.81) | 0.002a |
| CYP2A6 |
|
Low | 180/66 | 1,694 | Ref. |
| Ref. |
|
|
High | 180/60 | 1,791 | 0.83
(0.58–1.18) | 0.291 | 0.83
(0.57–1.20) | 0.321 |
| CYP2C8 |
|
Low | 180/75 | 1,229 | Ref. |
| Ref. |
|
|
High | 180/51 | 2,456 | 0.56
0.39–0.79) | 0.001a | 0.56
(0.38–0.83) | 0.003a |
| CYP2C9 |
|
Low | 180/74 | 1,271 | Ref. |
| Ref. |
|
|
High | 180/52 | 2,456 | 0.56
(0.39–0.80) | 0.001a | 0.64
(0.43–0.93) | 0.020a |
| CYP2E1 |
|
Low | 180/75 | 1,490 | Ref. |
| Ref. |
|
|
High | 180/51 | 2,456 | 0.67
(0.47–0.96) | 0.029a | 0.74
(0.51–1.08) | 0.119 |
| CYP8B1 |
|
Low | 180/73 | 1,372 | Ref. |
| Ref. |
|
|
High | 180/53 | 2,131 | 0.63
(0.44–0.90) | 0.010a | 0.61
(0.42–0.89) | 0.011a |
| HSD11B1 |
|
Low | 180/71 | 1,397 | Ref. |
| Ref. |
|
|
High | 180/55 | 2,131 | 0.77
(0.54–1.09) | 0.142 | 0.81
(0.56–1.18) | 0.279 |
| SLC22A1 |
|
Low | 180/79 | 1,149 | Ref. |
| Ref. |
|
|
High | 180/47 | 2,456 | 0.49
(0.34–0.70) |
<0.0001a | 0.51
(0.35–0.75) | 0.001a |
| TAT |
|
Low | 180/74 | 1,372 | Ref. |
| Ref. |
|
|
High | 180/52 | 2,131 | 0.56
(0.39–0.80) | 0.001a | 0.53
(0.36–0.78) | 0.001a |
|
HSD17B13 |
|
Low | 180/74 | 1,372 | Ref. |
| Ref. |
|
|
High | 180/52 | 2,456 | 0.57
(0.40–0.81) | 0.001a | 0.56
(0.39–0.82) | 0.003a |
Stratified analysis of
prognosis-associated genes
In the stratification of tumor stage, high
expression levels of CYP2C8, CYP2C9, SLC22A1, TAT and
HSD17B13 had tumor suppressor roles in stages I and II
(P≤0.05) while high expression levels of ADH4, CYP2C8, CYP8B1,
SLC22A1, TAT and HSD17B13 had tumor suppressor roles in
stages III and IV (P≤0.05). Detailed results are presented in
Tables IV and V.
| Table IV.Stratified analysis of HSD17B13,
SLC22A1 and TAT for HCC patients (n=360) in terms of
prognosis. |
Table IV.
Stratified analysis of HSD17B13,
SLC22A1 and TAT for HCC patients (n=360) in terms of
prognosis.
|
|
HSD17B13 | SLC22A1 | TAT |
|---|
|
|
|
|
|
|---|
|
Characteristics | Low | High | Adjusted HR (95%
CI) | Adjusted
P-value | Low | High | Adjusted HR (95%
CI) | Adjusted
P-value | Low | High | Adjusted HR (95%
CI) | Adjusted
P-value |
|---|
| Race |
|
Asian | 87 | 68 | 0.48
(0.24–0.93) | 0.03a | 88 | 67 | 0.32
(0.15–0.68) | 0.003a | 92 | 63 | 0.38
(0.19–0.78) | 0.009a |
|
Non-Asian | 89 | 107 | 0.55
(0.34–0.89) | 0.014a | 89 | 107 | 0.64
(0.40–1.05) | 0.076 | 82 | 114 | 0.66
(0.41–1.07) | 0.092 |
| Sex |
|
Male | 128 | 116 | 0.47
(0.28–0.78) | 0.003a | 111 | 133 | 0.48
(0.29–0.79) | 0.004a | 115 | 129 | 0.44
(0.27–0.72) | 0.001a |
|
Female | 52 | 64 | 0.71
(0.39–1.28) | 0.258 | 69 | 47 | 0.60
(0.31–1.13) | 0.113 | 65 | 51 | 0.79
(0.43–1.45) | 0.45 |
| Age (years) |
|
≤61 | 100 | 86 | 0.42
(0.24–0.74) | 0.003a | 104 | 82 | 0.29
(0.16–0.55) |
<0.001a | 103 | 83 | 0.37
(0.21–0.67) | 0.001a |
|
>61 | 80 | 91 | 0.66
(0.39–1.12) | 0.121 | 74 | 97 | 0.76
(0.45–1.31) | 0.325 | 74 | 97 | 0.73
(0.43–1.24) | 0.244 |
| Tumor stage |
| I and
II | 121 | 131 | 0.61
(0.37–0.99) | 0.047a | 116 | 136 | 0.55
(0.34–0.91) | 0.019a | 121 | 131 | 0.61
(0.37–1.00) | 0.048a |
| III and
IV | 50 | 37 | 0.47
(0.26–0.86) | 0.015a | 58 | 29 | 0.40
(0.20–0.79) | 0.009a | 53 | 34 | 0.41
(0.21–0.77) | 0.006a |
| Table V.Stratified analysis of ADH4,
CYP2C8, CYP2C9 and CYP8B1 for HCC patients (n=360) in
terms of prognosis. |
Table V.
Stratified analysis of ADH4,
CYP2C8, CYP2C9 and CYP8B1 for HCC patients (n=360) in
terms of prognosis.
|
| ADH4 | CYP2C8 | CYP2C9 | CYP8B1 |
|---|
|
|
|
|
|
|
|---|
|
Characteristics | Low | High | Adjusted HR (95%
CI) | Adjusted
P-value | Low | High | Adjusted HR (95%
CI) | Adjusted
P-value | Low | High | Adjusted HR (95%
CI) | Adjusted
P-value | Low | High | Adjusted HR (95%
CI) | Adjusted
P-value |
|---|
| Race |
|
Asian | 91 | 64 | 0.35
(0.17–0.74) | 0.005a | 85 | 70 | 0.40
(0.20–0.80) | 0.009a | 79 | 76 | 0.40
(0.21–0.75) | 0.004a | 93 | 62 | 0.28
(0.13–0.59) | 0.001a |
|
Non-Asian | 85 | 111 | 0.62
(0.38–1.01) | 0.057 | 92 | 104 | 0.70
(0.43–1.13) | 0.143 | 97 | 99 | 0.75
(0.45–1.23) | 0.251 | 84 | 112 | 0.90
(0.55–1.45) | 0.658 |
| Sex |
|
Male | 107 | 137 | 0.51
(0.31–0.83) | 0.006a | 120 | 124 | 0.48
(0.29–0.80) | 0.005a | 108 | 136 | 0.54
(0.33–0.89) | 0.015a | 109 | 135 | 0.48
(0.30–0.78) | 0.003a |
|
Female | 73 | 43 | 0.65
(0.34–1.25) | 0.196 | 60 | 56 | 0.75
(0.42–1.37) | 0.355 | 72 | 44 | 0.85
(0.46–1.58) | 0.613 | 71 | 45 | 1.00
(0.54–1.85) | 0.998 |
| Age (years) |
|
≤61 | 103 | 83 | 0.43
(0.24–0.77) | 0.005a | 106 | 80 | 0.54
(0.30–0.98) | 0.044a | 98 | 88 | 0.73
(0.42–1.27) | 0.269 | 115 | 71 | 0.27
(0.14–0.53) |
<0.001a |
|
>61 | 75 | 96 | 0.63
(0.36–1.09) | 0.096 | 71 | 100 | 0.63
(0.37–1.06) | 0.08 | 79 | 92 | 0.62
(0.37–1.06) | 0.082 | 63 | 108 | 0.99
(0.58–1.69) | 0.973 |
| Tumor stage |
| I and
II | 117 | 135 | 0.62
(0.38–1.01) | 0.055 | 113 | 139 | 0.58
(0.36–0.95) | 0.029a | 113 | 139 | 0.61
(0.38–1.00) | 0.048a | 121 | 131 | 0.79
(0.48–1.28) | 0.334 |
| III and
IV | 53 | 34 | 0.45
(0.24–0.84) | 0.013a | 59 | 28 | 0.50
(0.27–0.95) | 0.033a | 56 | 31 | 0.65
(0.35–1.20) | 0.171 | 51 | 36 | 0.38
(0.20–0.71) | 0.003a |
Hub gene co-expression and Pearson
correlation analysis
The majority of hub genes showed significant Pearson
correlations with other genes. For example, CYP2E1 was
positively correlated with CYP2C8, CYP2C9, CYP8B1, ADH4 and
HSD11B1, and negatively correlated with CYP2A6 and
HSD17B13. Detailed results are presented in Fig. 6B.
In the PPI network, most of the hub genes exhibited
complicated interactive co-expression relationships, with the
exception of HSD11B1, which was co-expressed with HSD17B13 alone
(Fig. 6C). In the gene-gene
interaction network, each gene was co-expressed with at least two
other genes (Fig. 6D).
Risk score model and nomogram
construction
A risk score model was constructed using the
aforementioned formula, which contained risk score ranking,
survival status and heat maps of gene expressions (Fig. 7A). The Kaplan-Meier plot revealed
that the percent survival difference between the low and high risk
groups was significant (Fig. 7B).
ROC curves were then constructed to evaluate the prognostic values
of the model. In the 1–5 year ROC curves, all AUCs were above 0.6
(Fig. 7C), which shows that this
model was useful for prognosis prediction. In the comparison of
high and low risk score groups, all of the comparisons showed
significant P-values (all P<0.001; Fig. 7D).
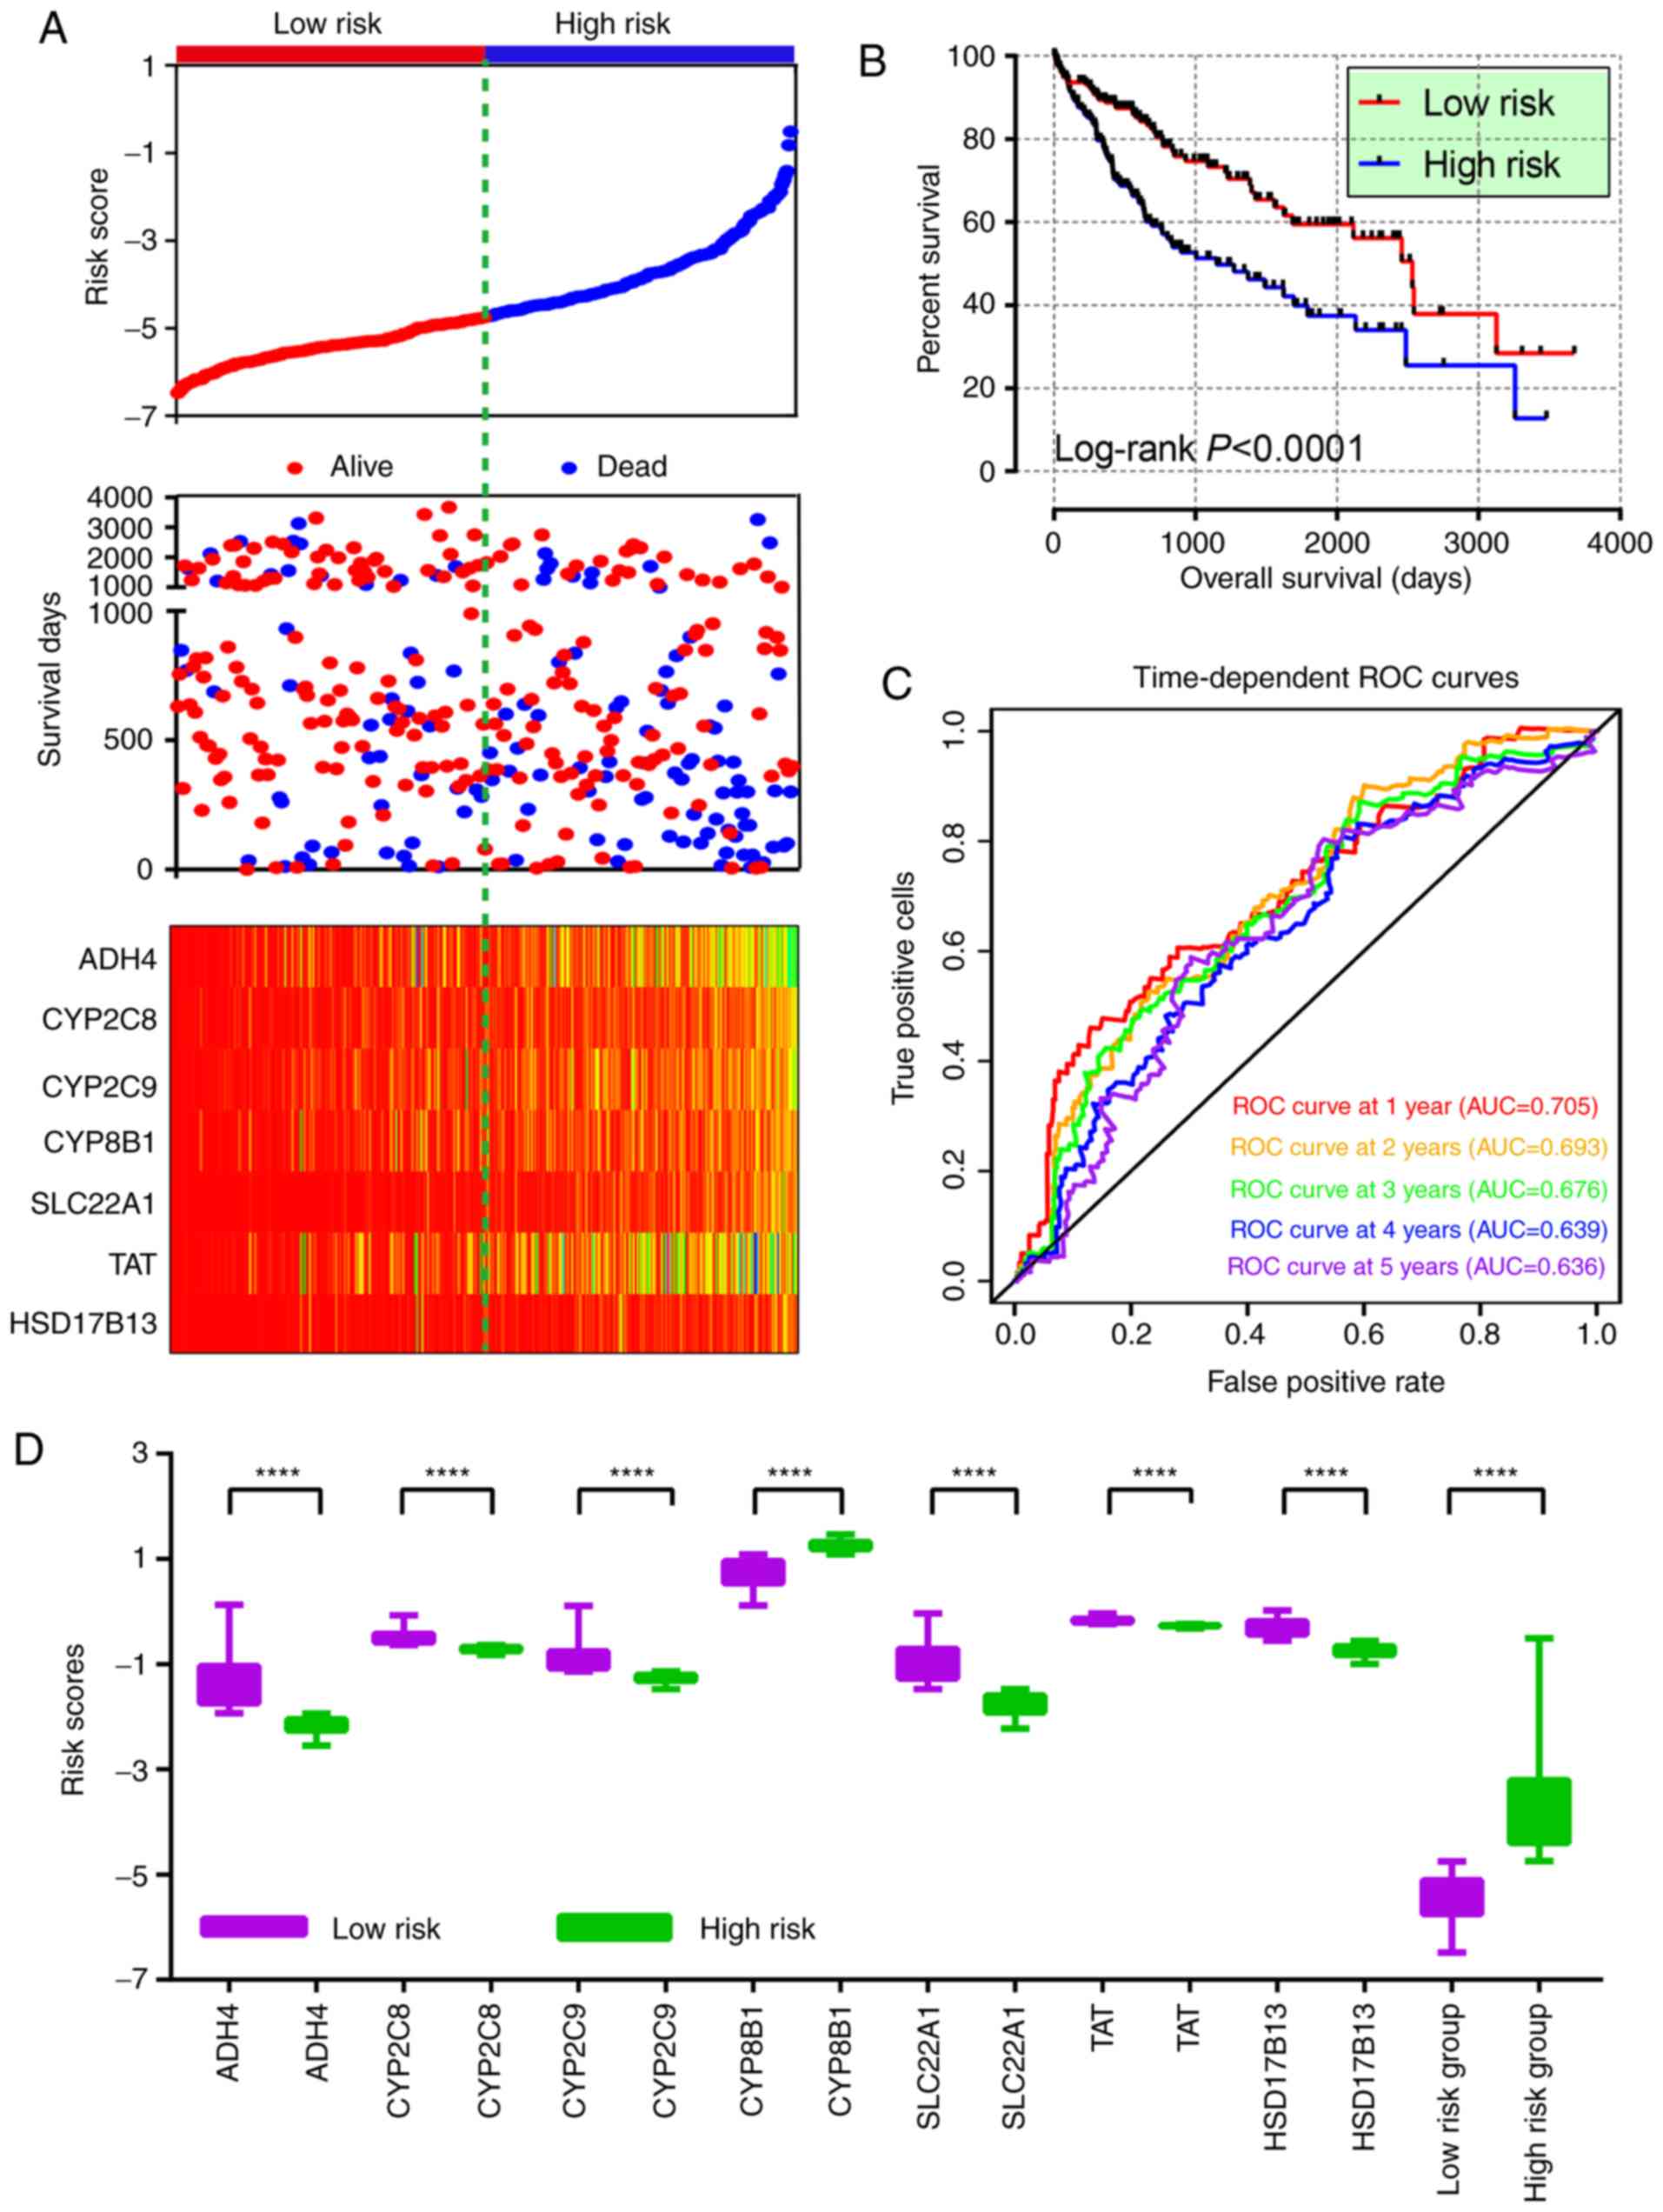 | Figure 7.Risk score model, survival plot, ROC
curves and boxplot. (A) Risk score model plot including risk score
ranking, survival status and heatmap. (B) Kaplan-Meier plot of the
risk score model. (C) ROC curves for 1-, 2-, 3-, 4- and 5-year
survival rates from the risk score model. (D) Boxplot of risk score
groups. ****P<0.0001. ROC, receiver operating characteristic;
TAT, tyrosine aminotransferase; CYP8B1, cytochrome
P450 family 8 subfamily B member 1; CYP2C9, cytochrome P450
family 2 subfamily C member 9; HSD17B13, hydroxysteroid 17-β
dehydrogenase 13; SLC22A1, solute carrier family 22 member
1; CYP2C8, cytochrome p450 family 2 subfamily C member 8;
ADH4, alcohol dehydrogenase 4 (class II), pi
polypeptide. |
The contributions of each factor were present in the
nomogram (Fig. 8). In detail, tumor
stages III and IV showed the maximum 100 points. Unlike the other
genes, high expression levels of CYP8B1 had a high number of
points. High points typically indicated low survival probability at
1, 3 and 5 years. As expected, there was a high probability of
survival prediction at 1 year compared with 5 years.
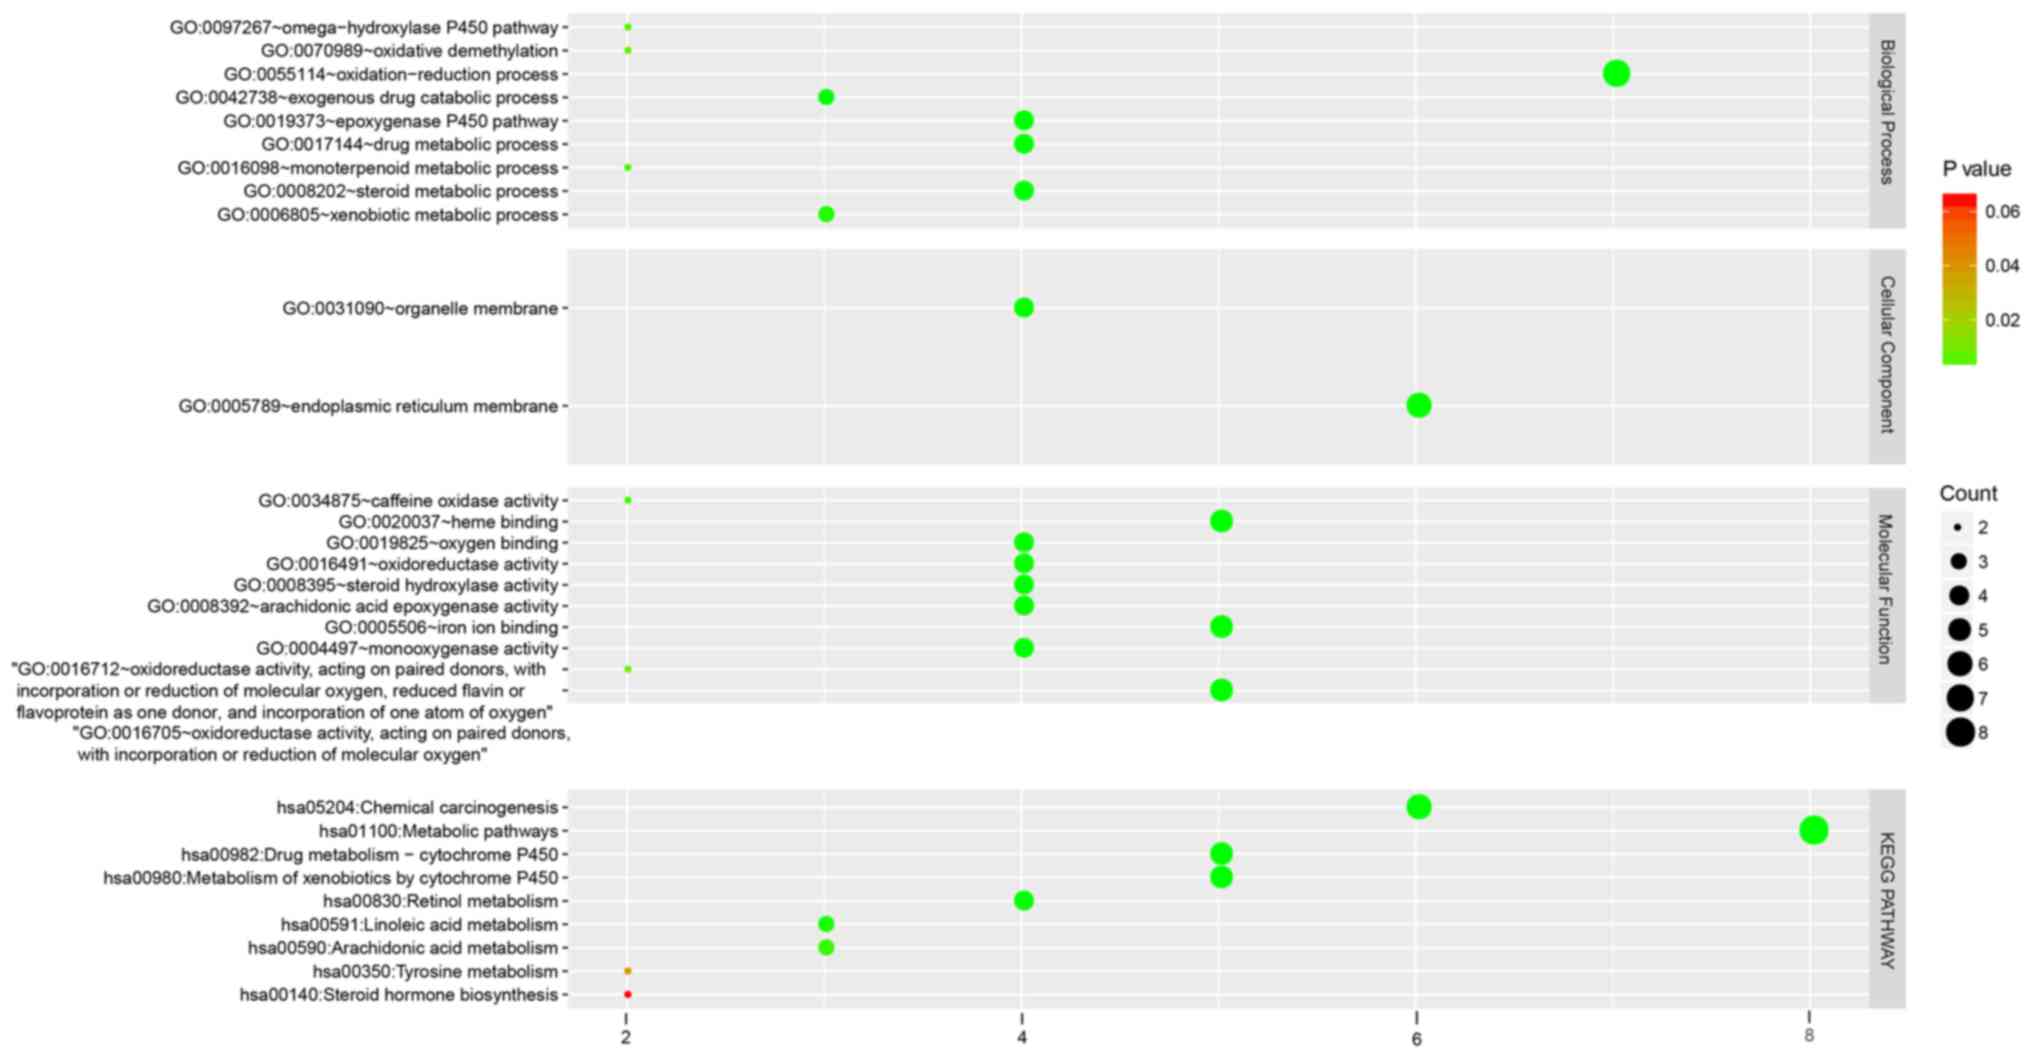
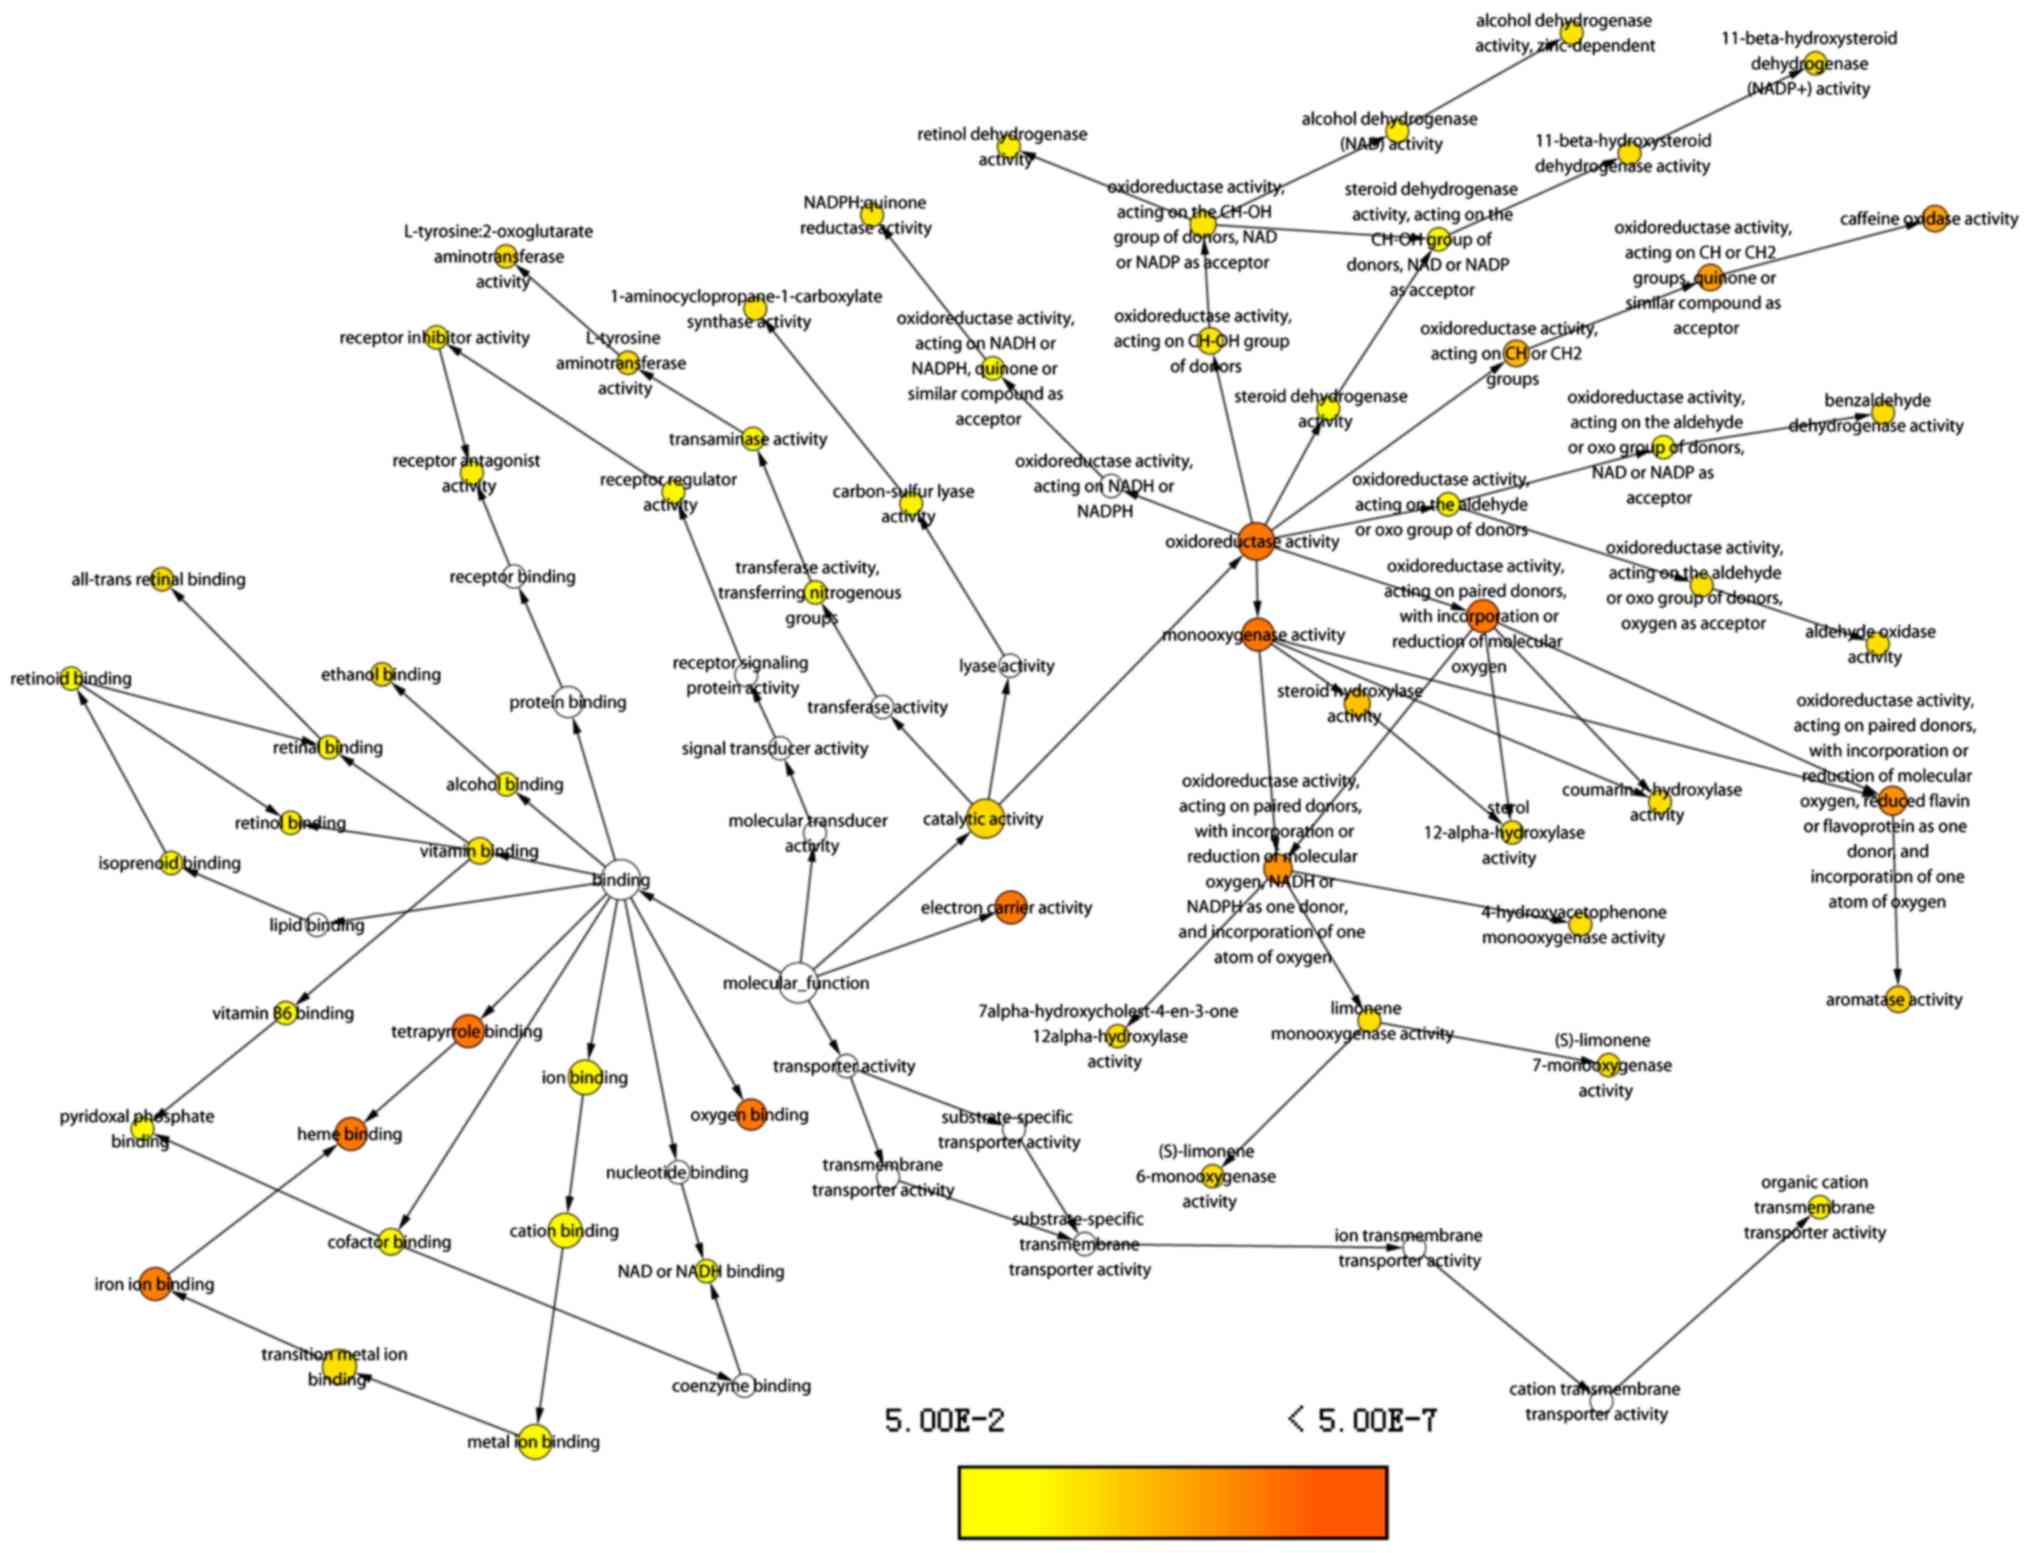
Hub genes enrichment analysis
GO analysis revealed that genes were significantly
enriched in the terms such as ‘oxidation-reduction process’, the
‘epoxygenase P450 pathway’, ‘metbolism of xenobiotics by cytochrome
P450’, ‘chemical carcinogenesis’, ‘drug metabolic processes’ and
‘organelle membranes’ (Fig. 9).
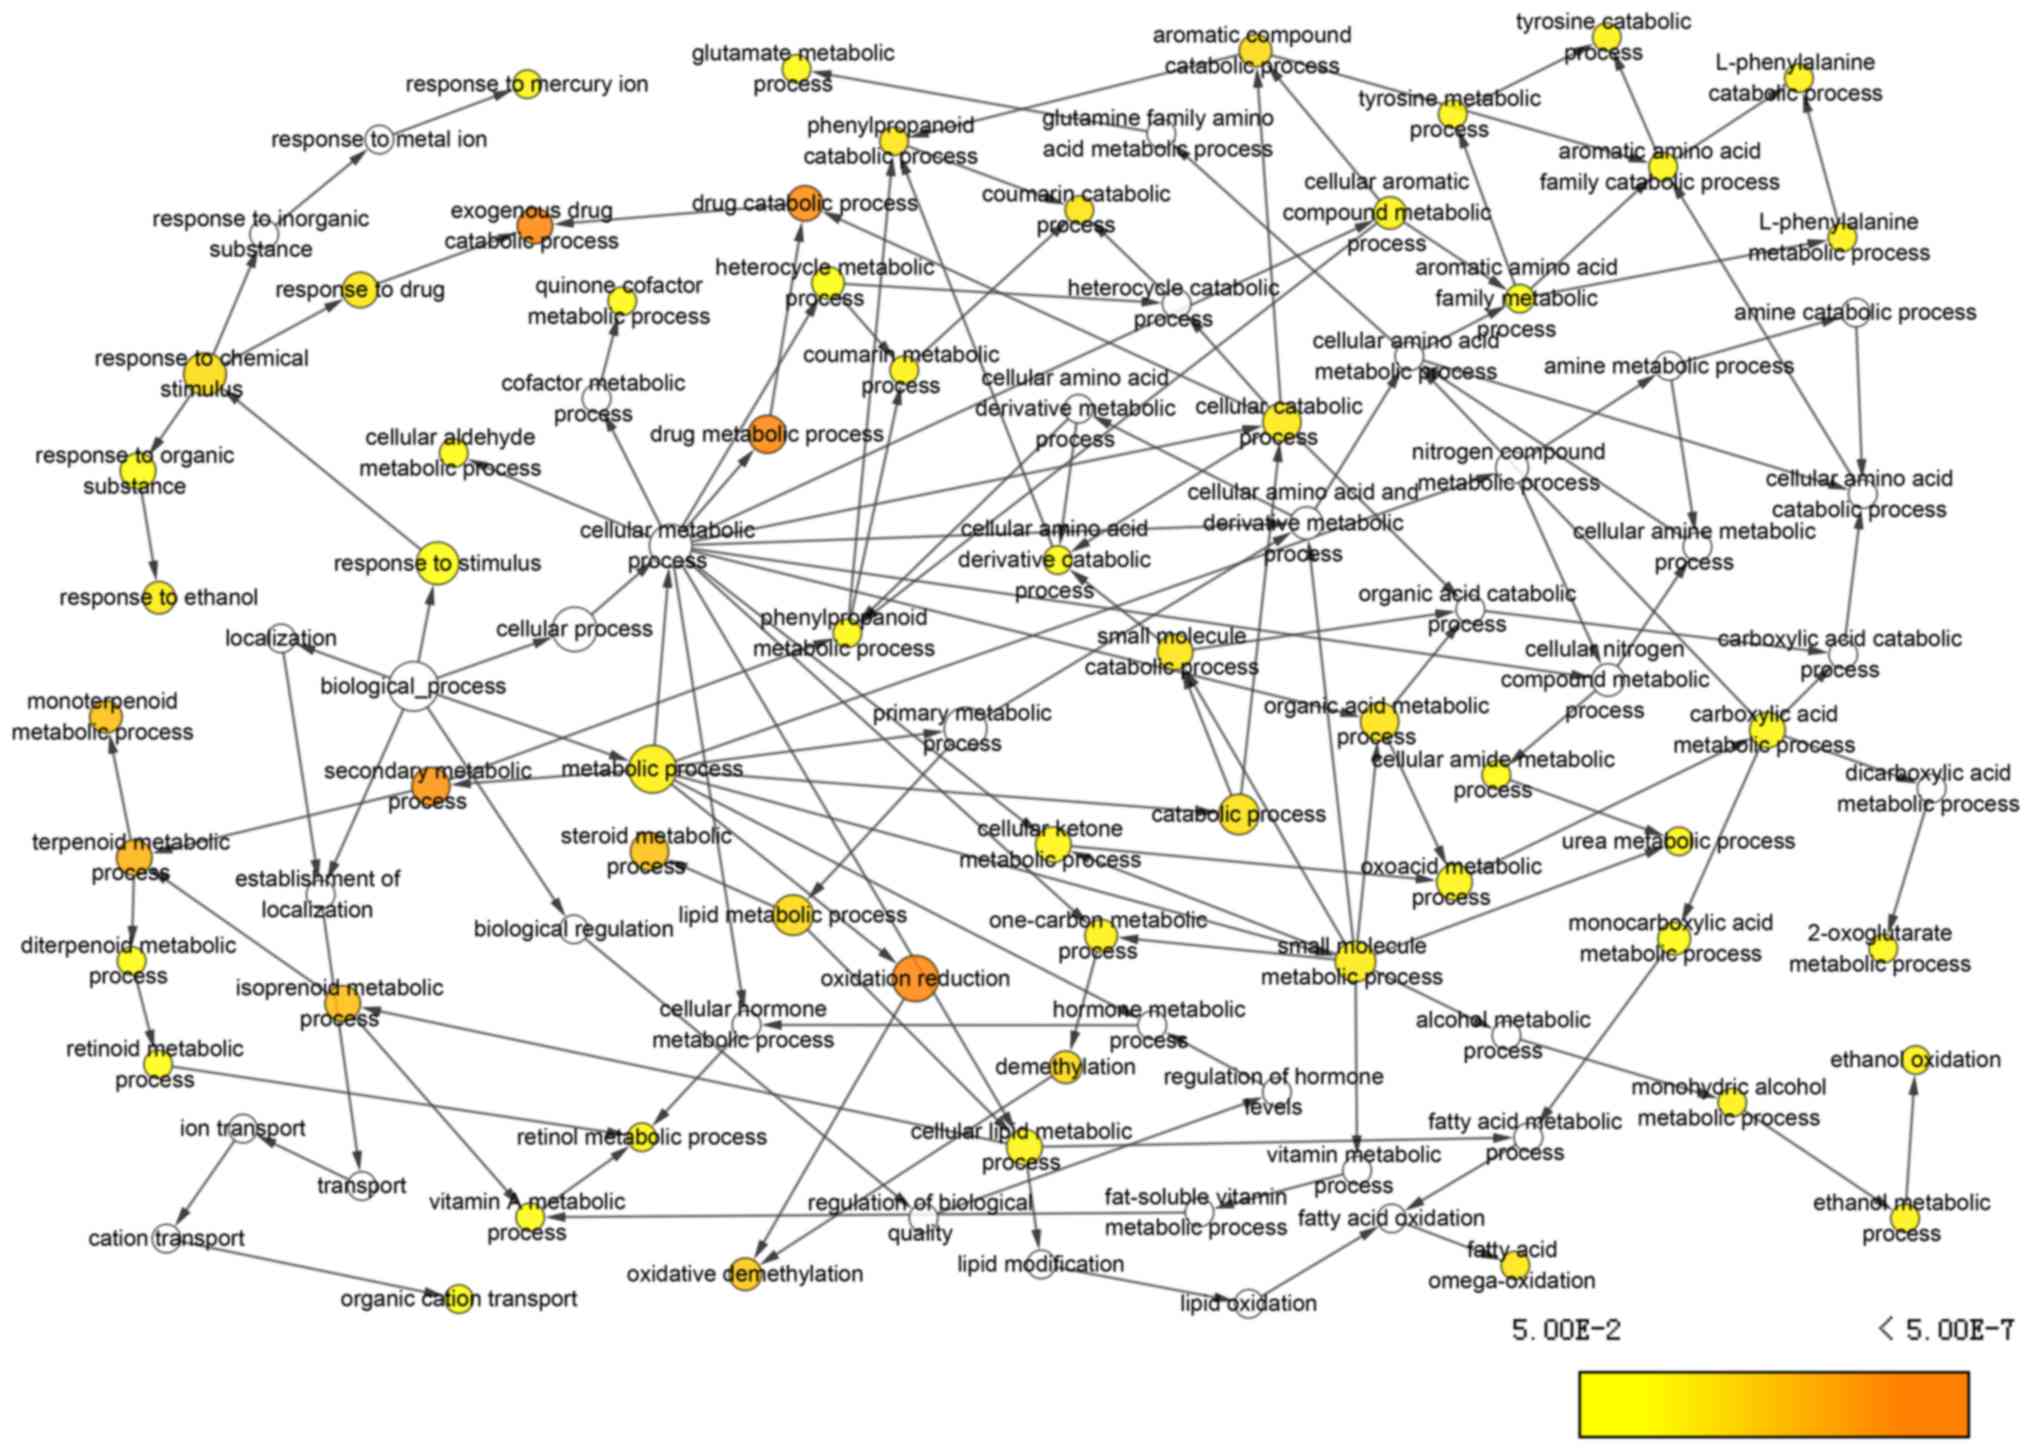
BP terms, including ‘exogenous drug catabolic
process’, ‘drug catabolic process’, ‘secondary metabolic process’
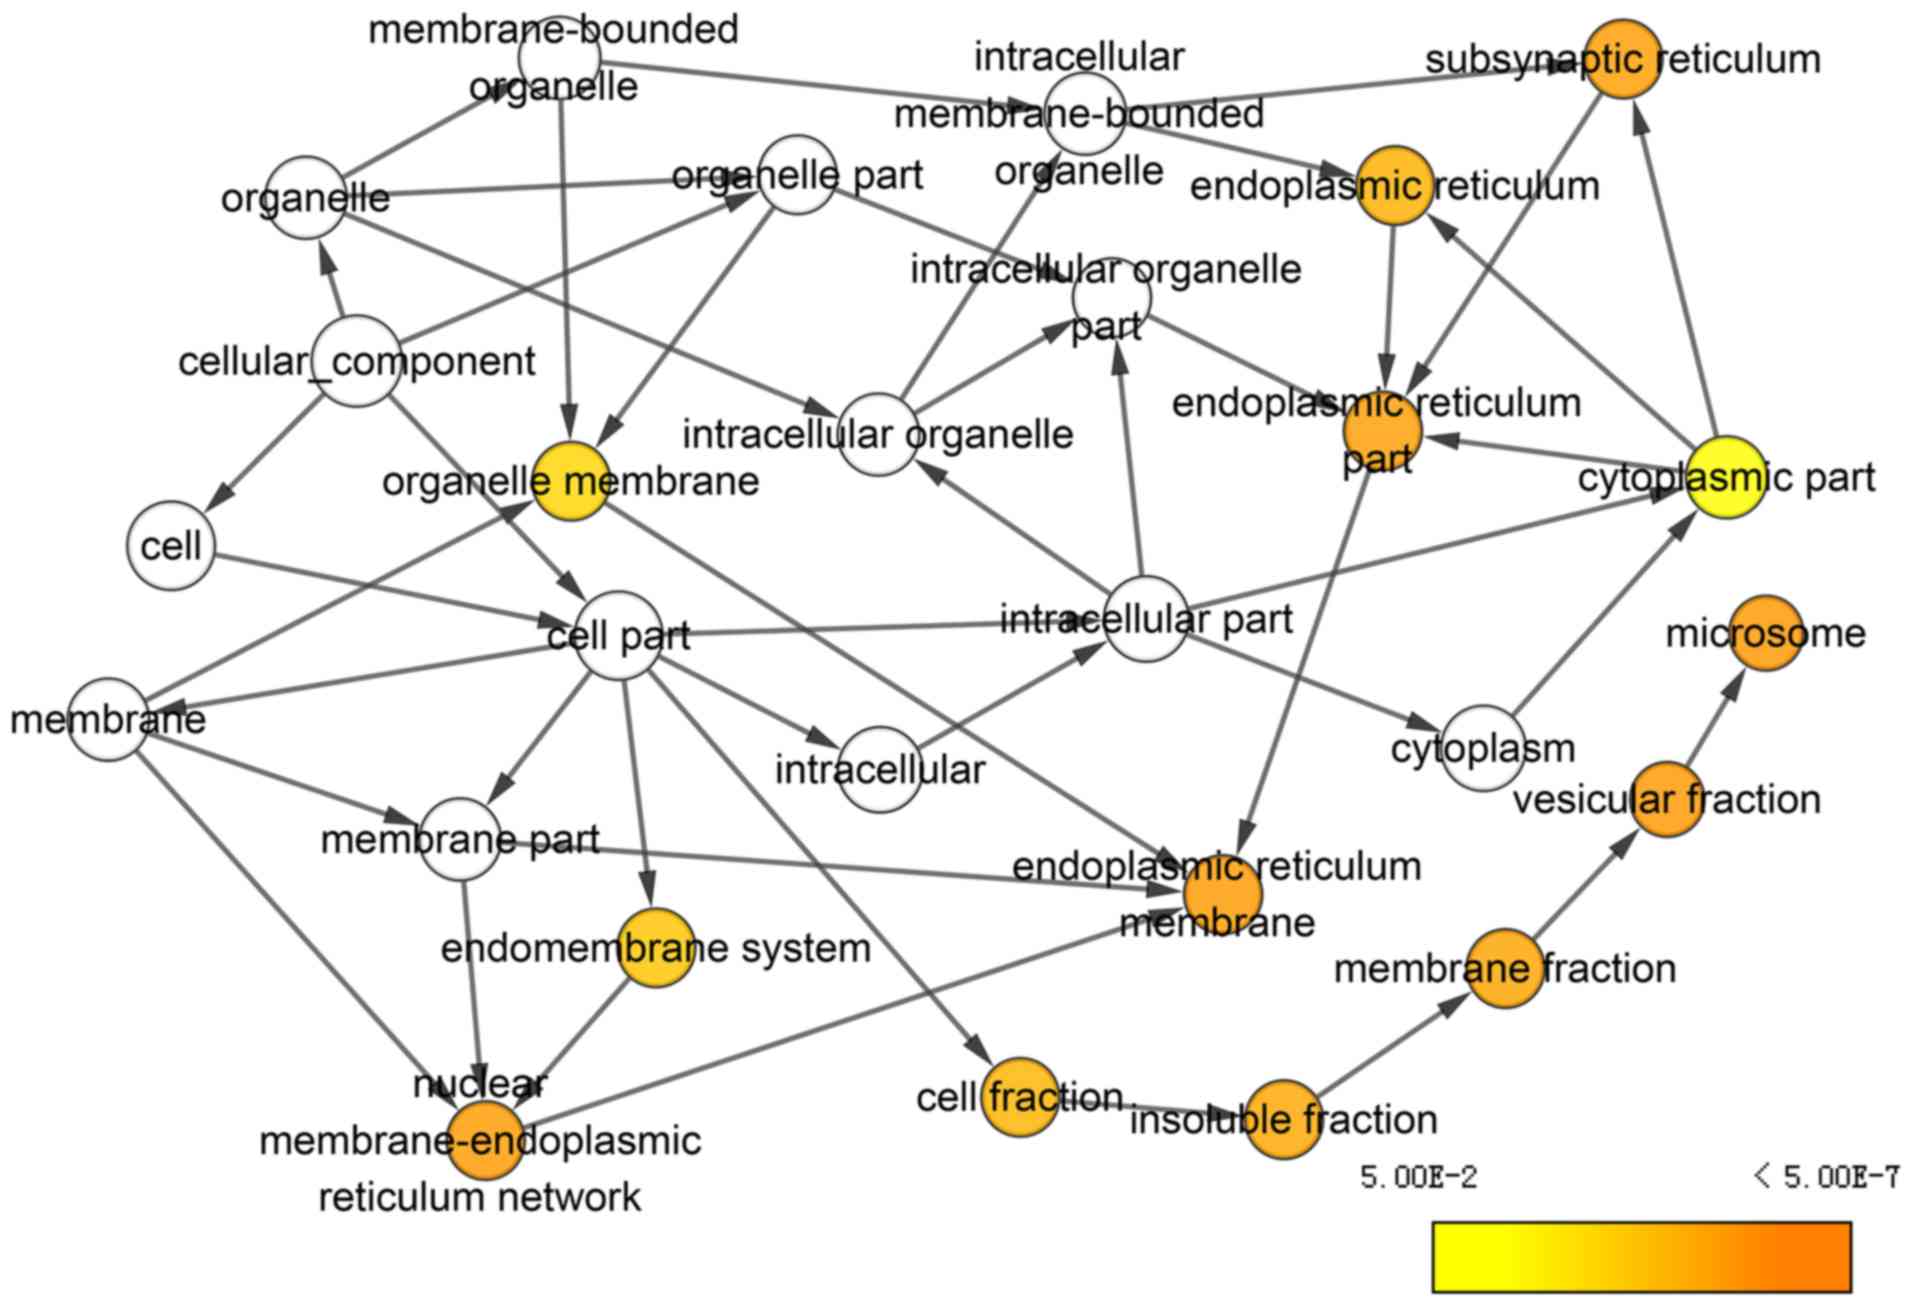
and ‘oxidation reduction’, were significantly enriched (Fig. 10). In CC terms, ‘subsynaptic
reticulum’, ‘endoplasmic reticulum’, ‘microsome’ and ‘vesicular
fraction’, were enriched (Fig.
11). ‘Oxygen binding’, ‘iron ion binding’, ‘heme binding’,
‘electron carrier activity’ and ‘oxidoreductase activity’, were
enriched in terms of MF (Fig.
12).
Discussion
In the present study, DEGs were analyzed in
microarrays to identify hub genes. The top 10 hub genes in the
GSE36376 dataset were examined for their prognostic prediction
value in HCC. A total of seven genes, including ADH4, CYP2C8,
CYP2C9, CYP8B1, SLC22A1, TAT and HSD17B13, were
identified as potential prognostic biomarkers. In addition, high
expression levels of these hub genes were associated with tumor
suppressing roles in HCC. Stratified analysis of clinical factors
further revealed their prognostic values in subgroups. A risk score
model for patient survival was constructed and evaluated, which
confirmed its value for assessing prognosis. A nomogram was created
to identify the degree of the contribution made by each factor.
Enrichment analysis of the hub genes highlighted the metabolic
pathways and biological processes that the hub genes were involved
in, which may provide clues into the exact mechanisms of HCC
development.
Valuable data in gene microarrays may be lost due to
potentially unpredictable problems with the samples when the
results of a single piece of research are analyzed (27). Furthermore, using a Student's t-test
to analyze microarray data has several limitations (27). Small sample sizes may lead to
unreliable variance estimation, leading to a high false-positive
rate, while some significant and reliable differences in expression
may be missed (28). However, in
the present study, analyzing microarray data from a study with a
large sample size, allowed the acquisition of potentially useful
information for further analysis. In total, 433 samples from the
GSE36376 dataset were analyzed to obtain DEGs, in order to
determine potential serum biomarkers for HCC diagnosis and
prognosis. Focused on an Asian population, the present study also
searched for DEGs using the GEO2R online resource. The top 10 hub
genes in these DEGs were selected for further analysis, and seven
of these hub genes, ADH4, CYP2C8, CYP2C9, CYP8B1, SLC22A1,
TAT and HSD17B13, were confirmed to have prognostic
value in HCC.
The human ADH4 enzyme is encoded by the ADH4
gene, which maps to 4q22 within the ADH gene cluster (29). Previous studies have revealed that a
ADH4 gene variant confers risk for alcohol dependence (AD)
and related traits in European Americans and African Americans
(29). Edenberg et al
(30) reported that 16 single
nucleotide polymorphisms (SNP) of ADH4, including rs2226896,
are associated with AD, in an independent collaborative study on
the genetics of alcoholism. Edenberg et al (31) showed that ADH4 promoter variant
−75A/C (rs800759), which could alter ADH4 enzyme expression levels
significantly, as well as the 159A/G variant were significantly
linked to AD in European Americans and African Americans in a
Brazilian population (31).
Previous studies have reported that ADH4 may be associated
with cluster headaches and personality traits such as agreeableness
and extraversion (32,33). In addition, polymorphisms in the
ADH4 gene are associated with a decreased risk of ovarian
cancer (34) and an increased risk
of upper aerodigestive tract cancer (35), which suggests that the ADH4
may be involved in tumorigenesis. Wei et al (36) found that ADH4 mRNA expression
in HCC is significantly lower than that in non-cancerous tissue,
and ADH4 protein expression is also reduced in HCC, which indicates
that ADH4 may serve as a tumor suppressor. These findings are
consistent with the results of the present study, where ADH4 was
identified as a potential prognostic biomarker for HCC.
The CYP2 family contains many subfamilies, including
CYP2A, CYP2B, CYP2C, CYP2D, CYP2E and CYP2F (37). CYP2C8 and CYP2C9 are
members of the CYP2C subfamily that are localized in a single gene
locus on chromosome 10 (38,39).
CYP2C8 shares sequence homology with CYP2C9, that metabolizes
several drugs including analgesics (40), antidiabetic and cholesterol-lowering
drugs (41). CYP2C9 metabolizes the
majority of angiotensin II type 1 receptor blockers (42) and neurological drugs (43). In addition, CYP2C8 has been
associated with an increased risk of essential hypertension and
coronary artery disease in Bulgarian patients (44), anemia (45), vascular inflammatory disease
(46) and breast cancer (47). It has been reported that CYP2C9
downregulation by miR-128-3p is associated with HCC (48). In addition, we have previously
reported that analysis of CYP2C8 and CYP2C9 expression in
combination is better than analyzing them in isolation (37).
CYP8B1 is predominantly expressed in hepatocytes in
a homogenous pattern (49) and is
involved in bile acid synthesis of bile acids (50). Overexpression of CYP8B1 alone or in
combination with CYP7A1, but not of CYP7A1 alone, reverses
obeticholic acid-induced alterations in bile acid levels
(taurocholic acid), bile acid composition (taurocholic acid and
α/β-muricholic acids) and cholesterol absorption (51). The SNP rs3732860 in the
3′-untranslated region of the CYP8B1 gene is linked to
gallstone disease risk in the Chinese Han population (52,53).
However, the function of CYP8B1 in cancer remains elusive. The
present study indicated that CYP8B1 may serve as a potential
biomarker for HCC, and may be involved in tumor initiation and
development.
SLC22A1 has the ability to encode solute
carrier family 22 member 1, which is not only an uptake transporter
but also has a predictive value for the molecular response to
imatinib mesylate therapy (54).
Patients who experience a major molecular response have higher
SLC22A1 expression compared with those without a major
molecular response (55).
SLC22A1-ABCB1 haplotype profiles can predict imatinib
pharmacokinetics in Asian patients with chronic myeloid leukemia
(56). Indirect SLC22A1 gene
upregulation by dexamethasone may be caused by glucocorticoid
receptor-induced hepatocyte nuclear factor-4α expression in primary
human hepatocytes, but not in hepatocyte-derived tumor cell lines
(57). HCC and cholangiocarcinoma
development is typically accompanied by decreased SLC22A1
expression, which may significantly alter the ability of sorafenib
to reach active intracellular concentrations in these tumors
(58). Downregulated SLC22A1
expression is associated with tumor progression and decreased
survival in patients with cholangiocellular carcinoma (59). However, to the best of our
knowledge, the relationship between SLC22A1 and HCC patient
prognosis has not been reported. The present study demonstrated
that SLC22A1 may be a predictive biomarker for HCC.
TAT is associated with the catalyzing the
transamination of tyrosine and other aromatic amino acids and plays
a role in recovery from tyrosinemia type II, hepatitis and hepatic
carcinoma (60). Deficiency of TAT
causes marked hypertyrosinemia, which leads to painful palmoplantar
hyperkeratosis, pseudodendritic keratitis, and variable mental
retardation (61). Recurrent
mutation of the TAT gene has been reported in those affected by
Richner-Hanhart syndrome (62). Fu
et al (63) reported that
downregulation of TAT at a frequently deleted region, 16q22,
contributes to the pathogenesis of HCC, and it was demonstrated
that TAT is a novel tumor suppressor gene. This finding is
consistent with the results of the present study, and may be used
as an effective serum biomarker for HCC.
Su et al (64) reported that HSD17B13 is
upregulated in the livers of patients with non-alcoholic fatty
liver disease. HSD17B13 expression is localized to liquid droplets
(65). In addition, Chen et
al (66) reported that HSD17B13
is downregulated in HCC, and has a tumor suppressor role via
inhibition of HCC progression and recurrence (66). This finding is in accordance with
the results of the present study, where it was concluded that
HSD17B13 may serve as a potential predictive biomarker for HCC.
In regards to metabolic pathways, our previous study
demonstrated that the CYP2C subfamily members are involved in
chemical carcinogenesis (37). The
formation of DNA adducts, dG-C8-IQ, dG-N-IQ, dG-C8-MeIQx and
dG-N-MeIQx, may induce liver, colon lung and breast cancer
tumorigenesis (37). The present
study found that the identified hub genes were also enriched in
chemical carcinogenesis. Additionally, gene were enriched in ‘drug
metabolism-cytochrome P450’, ‘metabolism of xenobiotics by
cytochrome P450’, ‘retinol metabolism’, ‘linoleic acid metabolism’,
‘arachidonic acid metabolism’, ‘tyrosine metabolism’, and ‘steroid
hormone biosynthesis’. These metabolic processes and pathways
provide evidence that the hub genes may be involved in
hepatocarcinogenesis.
There are some limitations to the present study.
First, larger samples that include other populations are required
to validate the findings of the present study. Second, an increased
number of valid clinical factors, such as race, drinking status,
smoking status, cirrhosis, Barcelona-Clinic liver cancer staging,
hepatitis infection status, antiviral therapy, α-fetoprotein levels
and microvascular invasion, should be included in the analysis.
Third, functional validation in a well-designed clinical trial is
required to examine the biological behavior of prognosis-associated
genes on HCC initiation and progression. As the present study
explored the potential prognostic biomarkers for HCC, the
identification and clinical significance of targeted drugs was not
investigated in the present study. Thus, it is crucial to focus
future studies on these topics.
The present study indicated that low gene expression
of ADH4, CYP2C8, CYP2C9, CYP8B1, SLC22A1, TAT and
HSD17B13 are predictors of poor prognosis in HCC. Further
functional trials and identification of targeted drugs for these
hub genes is warranted to determine clinical application. In
detail, trials in vivo and in vitro should be
conducted to explore biological behavior, such as invasion,
metastasis and proliferation ability. Then, the influence potential
drugs on their target genes should be validated, to determine
whether targeted overexpression of these genes improve HCC
prognosis.
Acknowledgements
The authors would like to acknowledge the laboratory
equipment and platform support provided by the Key Laboratory of
Early Prevention and Treatment for Regional High-Incidence-Tumor
(Guangxi Medical University; Ministry of Education, Nanning,
China). The authors would also like to acknowledge the helpful
comments on this article received from our reviewers.
Funding
The present study was supported in part by the
National Nature Science Foundation of China (grant nos. 81560535,
81072321, 30760243, 30460143 and 30560133), the 2009 Program for
New Century Excellent Talents in University, Guangxi Nature
Sciences Foundation (grant no. GuiKeGong 1104003A-7), the Guangxi
Health Ministry Medicine Grant (grant no. Key-Scientific
Research-Grant Z201018), the Self-Raised Scientific Research Fund
of the Health and Family Planning Commission of Guangxi Zhuang
Autonomous Region (grant no. Z2016318), the Basic Ability
Improvement Project for Middle-aged and Young Teachers in Guangxi
Colleges and Universities (grant no. 2018KY0110), Innovation
Project of Guangxi Graduate Education (grant no. JGY2018037) and
the Research Institute of Innovative Think-tank in Guangxi Medical
University (The gene-environment interaction in
hepatocarcinogenesis in Guangxi HCCs and its translational
applications in the HCC prevention).
Availability of data and materials
The datasets analyzed during the current study are
available from the corresponding author on reasonable request.
Authors' contributions
XW and TP designed the study. XL, CY, TY, LY, CH,
GZ, KH, XZe, ZL, XZh, WQ, HS, XY and TP conducted the study and
analyzed the data. XW wrote the manuscript and TP revised the
manuscript. All authors read and approved the manuscript and agree
to be accountable for all aspects of the research in ensuring that
the accuracy or integrity of any part of the work are appropriately
investigated and resolved.
Ethics approval and consent to
participate
Not applicable.
Patient consent for publication
Not applicable.
Competing interests
The authors declare that they have no competing
interests.
Glossary
Abbreviations
Abbreviations:
|
HCC
|
hepatocellular carcinoma
|
|
GEO
|
Gene Expression Omnibus
|
|
DEG
|
differentially expressed gene
|
|
PPI
|
protein-protein interaction
|
|
GEPIA
|
Gene Expression Profiling Interactive
Analysis
|
|
ROC
|
receiver operating characteristic
|
|
AUC
|
area under the curve
|
|
HR
|
hazard ratio
|
|
CI
|
confidence interval
|
|
MST
|
median survival time
|
|
GO
|
Gene Ontology
|
|
BP
|
biological process
|
|
CC
|
cellular component
|
|
MF
|
molecular function
|
|
KEGG
|
Kyoto Encyclopedia of Genes and
Genomes
|
|
DAVID
|
Database for Annotation,
Visualization and Integrated Discovery
|
References
|
1
|
Torre LA, Bray F, Siegel RL, Ferlay J,
Lortet-Tieulent J and Jemal A: Global cancer statistics, 2012. CA
Cancer J Clin. 65:87–108. 2015. View Article : Google Scholar : PubMed/NCBI
|
|
2
|
Kolonel LN and Wilkens LR: Migrant
studies. Cancer Epidemiology and Prevention. Schottenfeld D and
Fraumeni JF Jr: 3rd. Oxford University Press, Inc.; New York, NY:
pp. 189–201. 2006, View Article : Google Scholar
|
|
3
|
Kgatle MM, Setshedi M and Hairwadzi HN:
Hepatoepigenetic alterations in viral and nonviral-induced
hepatocellular carcinoma. Biomed Res Int 2016. 39564852016.
|
|
4
|
Marotta F, Vangieri B, Cecere A and
Gattoni A: The pathogenesis of hepatocellular carcinoma is
multifactorial event. Novel immunological treatment in prospect.
Clin Ter. 155:187–199. 2004.PubMed/NCBI
|
|
5
|
Coleman WB: Mechanisms of human
hepatocarcinogenesis. Curr Mol Med. 3:573–388. 2003. View Article : Google Scholar : PubMed/NCBI
|
|
6
|
Dominguez-Malagón H and Gaytan-Graham S:
Hepatocellular carcinoma: An update. Ultrastruct Pathol.
25:497–516. 2001. View Article : Google Scholar : PubMed/NCBI
|
|
7
|
Chen G, Wang D, Zhao X, Cao J, Zhao Y,
Wang F, Bai J, Luo D and Li L: miR-155-5p modulates malignant
behaviors of hepatocellular carcinoma by directly targeting CTHRC1
and indirectly regulating GSK-3β-involved Wnt/β-catenin signaling.
Cancer Cell Int. 17:1182017. View Article : Google Scholar : PubMed/NCBI
|
|
8
|
Balogh J, Victor D III, Asham EH,
Burroughs SG, Boktour M, Saharia A, Li X, Ghobrial RM and Monsour
HP Jr: Hepatocellular carcinoma: A review. J Hepatocell Carcinoma.
3:41–53. 2016. View Article : Google Scholar : PubMed/NCBI
|
|
9
|
Tien AJ, Chien CY, Chen YH, Lin LC and
Chien CT: fruiting bodies of antrodia cinnamomea and its active
triterpenoid, antcin K, ameliorates N-nitrosodiethylamine-induced
hepatic inflammation, fibrosis and carcinogenesis in rats. Am J
Chin Med. 45:173–198. 2017. View Article : Google Scholar : PubMed/NCBI
|
|
10
|
Quintavalle C, Hindupur SK, Quagliata L,
Pallante P, Nigro C, Condorelli G, Andersen JB, Tagscherer KE, Roth
W, Beguinot F, et al: Phosphoprotein enriched in diabetes
(PED/PEA15) promotes migration in hepatocellular carcinoma and
confers resistance to sorafenib. Cell Death Dis. 8:e31382017.
View Article : Google Scholar : PubMed/NCBI
|
|
11
|
Xu G and Dang C: CMTM5 is downregulated
and suppresses tumour growth in hepatocellular carcinoma through
regulating PI3K-AKT signalling. Cancer Cell Int. 17:1132017.
View Article : Google Scholar : PubMed/NCBI
|
|
12
|
Cao MQ, You AB, Zhu XD, Zhang W, Zhang YY,
Zhang SZ, Zhang KW, Cai H, Shi WK, Li XL, et al: miR-182-5p
promotes hepatocellular carcinoma progression by repressing FOXO3a.
J Hematol Oncol. 11:122018. View Article : Google Scholar : PubMed/NCBI
|
|
13
|
Maass T, Sfakianakis I, Staib F, Krupp M,
Galle PR and Teufel A: Microarray-based gene expression analysis of
hepatocellular carcinoma. Curr Genomics. 11:261–268. 2010.
View Article : Google Scholar : PubMed/NCBI
|
|
14
|
Fu Q, Yang F, Zhao J, Yang X, Xiang T,
Huai G, Zhang J, Wei L, Deng S and Yang H: Bioinformatical
identification of key pathways and genes in human hepatocellular
carcinoma after CSN5 depletion. Cell Signal. 49:79–86. 2018.
View Article : Google Scholar : PubMed/NCBI
|
|
15
|
Huang da W, Sherman BT and Lempicki RA:
Bioinformatics enrichment tools: Paths toward the comprehensive
functional analysis of large gene lists. Nucleic Acids Res.
37:1–13. 2009. View Article : Google Scholar : PubMed/NCBI
|
|
16
|
Davis S and Meltzer PS: GEOquery: A bridge
between the gene expression omnibus (GEO) and BioConductor.
Bioinformatics. 23:1846–1847. 2007. View Article : Google Scholar : PubMed/NCBI
|
|
17
|
Lim HY, Sohn I, Deng S, Lee J, Jung SH,
Mao M, Xu J, Wang K, Shi S, Joh JW, et al: Prediction of
disease-free survival in hepatocellular carcinoma by gene
expression profiling. Ann Surg Oncol. 20:3747–3753. 2013.
View Article : Google Scholar : PubMed/NCBI
|
|
18
|
Shannon P, Markiel A, Ozier O, Baliga NS,
Wang JT, Ramage D, Amin N, Schwikowski B and Ideker T: Cytoscape: A
software environment for integrated models of biomolecular
interaction networks. Genome Res. 13:2498–2504. 2003. View Article : Google Scholar : PubMed/NCBI
|
|
19
|
Tang Z, Li C, Kang B, Gao G, Li C and
Zhang Z: GEPIA: A web server for cancer and normal gene expression
profiling and interactive analyses. Nucleic Acids Res. 45(W1):
W98–W102. 2017. View Article : Google Scholar : PubMed/NCBI
|
|
20
|
Uhlén M, Fagerberg L, Hallström BM,
Lindskog C, Oksvold P, Mardinoglu A, Sivertsson Å, Kampf C,
Sjöstedt E, Asplund A, et al: Proteomics. Tissue-based map of the
human proteome. Science. 347:12604192015. View Article : Google Scholar : PubMed/NCBI
|
|
21
|
Gao J, Aksoy BA, Dogrusoz U, Dresdner G,
Gross B, Sumer SO, Sun Y, Jacobsen A, Sinha R, Larsson E, et al:
Integrative analysis of complex cancer genomics and clinical
profiles using the cBioPortal. Sci Signal. 6:pl12013. View Article : Google Scholar : PubMed/NCBI
|
|
22
|
Cerami E, Gao J, Dogrusoz U, Gross BE,
Sumer SO, Aksoy BA, Jacobsen A, Byrne CJ, Heuer ML, Larsson E, et
al: The cBio cancer genomics portal: An open platform for exploring
multidimensional cancer genomics data. Cancer Discov. 2:401–404.
2012. View Article : Google Scholar : PubMed/NCBI
|
|
23
|
Huang da W, Sherman BT and Lempicki RA:
Systematic and integrative analysis of large gene lists using DAVID
bioinformatics resources. Nat Protoc. 4:44572009. View Article : Google Scholar : PubMed/NCBI
|
|
24
|
Maere S, Heymans K and Kuiper M: BiNGO: A
Cytoscape plugin to assess overrepresentation of gene ontology
categories in biological networks. Bioinformatics. 21:3448–3449.
2005. View Article : Google Scholar : PubMed/NCBI
|
|
25
|
Montojo J, Zuberi K, Rodriguez H, Kazi F,
Wright G, Donaldson SL, Morris Q and Bader GD: GeneMANIA Cytoscape
plugin: Fast gene function predictions on the desktop.
Bioinformatics. 26:2927–2928. 2010. View Article : Google Scholar : PubMed/NCBI
|
|
26
|
Szklarczyk D, Morris JH, Cook H, Kuhn M,
Wyder S, Simonovic M, Santos A, Doncheva NT, Roth A, Bork P, et al:
The STRING database in 2017: Quality-controlled protein-protein
association networks, made broadly accessible. Nucleic Acids Res.
45:D362–D368. 2017. View Article : Google Scholar : PubMed/NCBI
|
|
27
|
Lu X, Sun W, Tang Y, Zhu L, Li Y, Ou C,
Yang C, Su J, Luo C, Hu Y and Cao J: Identification of key genes in
hepatocellular carcinoma and validation of the candidate gene,
cdc25a, using gene set enrichment analysis, meta-analysis and
cross-species comparison. Mol Med Rep. 13:1172–1178. 2016.
View Article : Google Scholar : PubMed/NCBI
|
|
28
|
MacDonald JW and Ghosh D: COPA-cancer
outlier profile analysis. Bioinformatics. 22:2950–2951. 2006.
View Article : Google Scholar : PubMed/NCBI
|
|
29
|
Luo X, Zuo L, Kranzler HR, Wang S, Anton
RF and Gelernter J: Recessive genetic mode of an ADH4 variant in
substance dependence in African-Americans: A model of utility of
the HWD test. Behav Brain Funct. 4:422008. View Article : Google Scholar : PubMed/NCBI
|
|
30
|
Edenberg HJ, Xuei X, Chen HJ, Tian H,
Wetherill LF, Dick DM, Almasy L, Bierut L, Bucholz KK, Goate A, et
al: Association of alcohol dehydrogenase genes with alcohol
dependence: a comprehensive analysis. Hum Mol Genet. 15:1539–1549.
2006. View Article : Google Scholar : PubMed/NCBI
|
|
31
|
Edenberg HJ, Jerome RE and Li M:
Polymorphism of the human alcohol dehydrogenase 4 (ADH4) promoter
affects gene expression. Pharmacogenetics. 9:25–30. 1999.
View Article : Google Scholar : PubMed/NCBI
|
|
32
|
Guindalini C, Scivoletto S, Ferreira RGM,
Breen G, Zilberman M, Peluso MA and Zatz M: Association of genetic
variants in alcohol dehydrogenase 4 with alcohol dependence in
Brazilian patients. Am J Psychiatry. 162:1005–1007. 2005.
View Article : Google Scholar : PubMed/NCBI
|
|
33
|
Luo X, Kranzler HR, Zuo L, Wang S and
Gelernter J: Personality traits of agreeableness and extraversion
are associated with ADH4 variation. Biol Psychiatry. 61:599–608.
2007. View Article : Google Scholar : PubMed/NCBI
|
|
34
|
Goode EL, White KL, Vierkant RA, Phelan
CM, Cunningham JM, Schildkraut JM, Berchuck A, Larson MC, Fridley
BL, Olson JE, et al: Xenobiotic-metabolizing gene polymorphisms and
ovarian cancer risk. Mol Carcinog. 50:397–402. 2011. View Article : Google Scholar : PubMed/NCBI
|
|
35
|
Oze I, Matsuo K, Suzuki T, Kawase T,
Watanabe M, Hiraki A, Ito H, Hosono S, Ozawa T, Hatooka S, et al:
Impact of multiple alcohol dehydrogenase gene polymorphisms on risk
of upper aerodigestive tract cancers in a Japanese population.
Cancer Epidemiol Biomarkers Prev. 18:3097–3102. 2009. View Article : Google Scholar : PubMed/NCBI
|
|
36
|
Wei RR, Zhang MY, Rao HL, Pu HY, Zhang HZ
and Wang HY: Identification of ADH4 as a novel and potential
prognostic marker in hepatocellular carcinoma. Med Oncol.
29:2737–2743. 2012. View Article : Google Scholar : PubMed/NCBI
|
|
37
|
Wang X, Yu T, Liao X, Yang C, Han C, Zhu
G, Huang K, Yu L, Qin W, Su H, et al: The prognostic value of CYP2C
subfamily genes in hepatocellular carcinoma. Cancer Med. 7:966–980.
2018. View Article : Google Scholar : PubMed/NCBI
|
|
38
|
Gelboin HV and Krausz K: Monoclonal
antibodies and multifunctional cytochrome P450: Drug metabolism as
paradigm. J Clin Pharmacol. 46:353–372. 2006. View Article : Google Scholar : PubMed/NCBI
|
|
39
|
Goldstein JA and de Morais SM:
Biochemistry and molecular biology of the human CYP2C subfamily.
Pharmacogenetics. 4:285–299. 1994. View Article : Google Scholar : PubMed/NCBI
|
|
40
|
Hamman MA, Thompson GA and Hall SD:
Regioselective and stereoselective metabolism of ibuprofen by human
cytochrome P450 2C. Biochem Pharmacol. 54:33–41. 1997. View Article : Google Scholar : PubMed/NCBI
|
|
41
|
Jaakkola T, Laitila J, Neuvonen PJ and
Backman JT: Pioglitazone is metabolised by CYP2C8 and CYP3A4 in
vitro: Potential for interactions with CYP2C8 inhibitors. Basic
Clin Pharmacol Toxicol. 99:44–51. 2006. View Article : Google Scholar : PubMed/NCBI
|
|
42
|
Unger T: Inhibiting angiotensin receptors
in the brain: Possible therapeutic implications. Curr Med Res Opin.
19:449–451. 2003. View Article : Google Scholar : PubMed/NCBI
|
|
43
|
Kiang TK, Ping CH, Anari MR, Tong V,
Abbott FS and Chang TK: Contribution of CYP2C9, CYP2A6, and CYP2B6
to valproic acid metabolism in hepatic microsomes from individuals
with the CYP2C9*1/*1 genotype. Toxicol Sci. 94:261–271. 2006.
View Article : Google Scholar : PubMed/NCBI
|
|
44
|
Tzveova R, Naydenova G, Yaneva T, Dimitrov
G, Vandeva S, Matrozova Y, Pendicheva-Duhlenska D, Popov I,
Beltheva O, Naydenov C, et al: Gender-specific effect of CYP2C8*3
on the risk of essential hypertension in bulgarian patients.
Biochem Genet. 53:319–333. 2005. View Article : Google Scholar
|
|
45
|
Bosó V, Herrero MJ, Santaballa A, Palomar
L, Megias JE, de la Cueva H, Rojas L, Marqués MR, Poveda JL,
Montalar J and Aliño SF: SNPs and taxane toxicity in breast cancer
patients. Pharmacogenomics. 15:1845–1858. 2014. View Article : Google Scholar : PubMed/NCBI
|
|
46
|
Liu W, Wang B, Ding HU, Wang DW and Zeng
H: A potential therapeutic effect of CYP2C8 overexpression on
anti-TNF-α activity. Int J Mol Med. 34:725–732. 2014. View Article : Google Scholar : PubMed/NCBI
|
|
47
|
Wei X, Zhang D, Dou X, Niu N, Huang W, Bai
J and Zhang G: Elevated 14,15-epoxyeicosatrienoic acid by
increasing of cytochrome P450 2C8, 2C9 and 2J2 and decreasing of
soluble epoxide hydrolase associated with aggressiveness of human
breast cancer. BMC Cancer. 14:8412014. View Article : Google Scholar : PubMed/NCBI
|
|
48
|
Yu D, Green B, Marrone A, Guo Y, Kadlubar
S, Lin D, Fuscoe J, Pogribny I and Ning B: Suppression of CYP2C9 by
microRNA hsa-miR-128-3p in human liver cells and association with
hepatocellular carcinoma. Sci Rep. 5:85342015. View Article : Google Scholar : PubMed/NCBI
|
|
49
|
Wang J, Greene S, Eriksson LC, Reihnér E,
Reihner E, Einarsson C, Eggertsen G and Gåfvels M: Human sterol
12a-hydroxylase (CYP8B1) is mainly expressed in hepatocytes in a
homogenous pattern. Histochem Cell Biol. 123:441–446. 2005.
View Article : Google Scholar : PubMed/NCBI
|
|
50
|
Björkhem I and Eggertsen G: Genes involved
in initial steps of bile acid synthesis. Curr Opin Lipidol.
12:97–103. 2001. View Article : Google Scholar : PubMed/NCBI
|
|
51
|
Xu Y, Li F, Zalzala M, Xu J, Gonzalez FJ,
Adorini L, Lee YK, Yin L and Zhang Y: Farnesoid X receptor
activation increases reverse cholesterol transport by modulating
bile acid composition and cholesterol absorption in mice.
Hepatology. 64:1072–1085. 2016. View Article : Google Scholar : PubMed/NCBI
|
|
52
|
Qin J, Han TQ, Yuan WT, Zhang J, Fei J,
Jiang ZY, Niu ZM, Zhang KY, Hua Q, Cai XX, et al: Single nucleotide
polymorphism rs3732860 in the 3’-untranslated region of CYP8B1 gene
is associated with gallstone disease in Han Chinese. J
Gastroenterol Hepatol. 28:717–722. 2013. View Article : Google Scholar : PubMed/NCBI
|
|
53
|
Qin J, Jiang ZY, Niu ZM, Zhang KY, Hua Q,
Jiang ZH, Wang Y, Huang W, Han TQ and Zhang SD: Association of
single nucleotide polymorphism in human CYP8B1 gene with gallstone
disease. Zhonghua Yi Xue Za Zhi. 91:2092–2095. 2011.(In Chinese).
PubMed/NCBI
|
|
54
|
White DL, Saunders VA, Dang P, Engler J,
Venables A, Zrim S, Zannettino A, Lynch K, Manley PW and Hughes T:
Most CML patients who have a suboptimal response to imatinib have
low OCT-1 activity: Higher doses of imatinib may overcome the
negative impact of low OCT-1 activity. Blood. 110:4064–4072. 2007.
View Article : Google Scholar : PubMed/NCBI
|
|
55
|
de Lima LT, Vivona D, Bueno CT, Hirata RD,
Hirata MH, Luchessi AD, de Castro FA, de Lourdes F, Chauffaille M,
Zanichelli MA, et al: Reduced ABCG2 and increased SLC22A1 mRNA
expression are associated with imatinib response in chronic myeloid
leukemia. Med Oncol. 31:8512014. View Article : Google Scholar : PubMed/NCBI
|
|
56
|
Singh O, Chan JY, Lin K, Heng CC and
Chowbay B: SLC22A1- ABCB1 haplotype profiles predict imatinib
pharmacokinetics in Asian patients with chronic myeloid leukemia.
PLoS One. 7:e517712012. View Article : Google Scholar : PubMed/NCBI
|
|
57
|
Rulcova A, Krausova L, Smutny T, Vrzal R,
Dvorak Z, Jover R and Pavek P: Glucocorticoid receptor regulates
organic cation transporter 1 (OCT1, SLC22A1) expression via HNF4α
upregulation in primary human hepatocytes. Pharmacol Rep.
65:1322–1335. 2013. View Article : Google Scholar : PubMed/NCBI
|
|
58
|
Herraez E, Lozano E, Macias RI, Vaquero J,
Bujanda L, Banales JM, Marin JJ and Briz O: Expression of SLC22A1
variants may affect the response of hepatocellular carcinoma and
cholangiocarcinoma to sorafenib. Hepatology. 58:1065–1073. 2013.
View Article : Google Scholar : PubMed/NCBI
|
|
59
|
Lautem A, Heise M, Gräsel A,
Hoppe-Lotichius M, Weiler N, Foltys D, Knapstein J, Schattenberg
JM, Schad A, Zimmermann A, et al: Downregulation of organic cation
transporter 1 (SLC22A1) is associated with tumor progression and
reduced patient survival in human cholangiocellular carcinoma. Int
J Oncol. 42:1297–1304. 2013. View Article : Google Scholar : PubMed/NCBI
|
|
60
|
Mehere P, Han Q, Lemkul JA, Vavricka CJ,
Robinson H, Bevan DR and Li J: Tyrosine aminotransferase:
Biochemical and structural properties and molecular dynamics
simulations. Protein Cell. 1:1023–1032. 2010. View Article : Google Scholar : PubMed/NCBI
|
|
61
|
Maydan G, Andresen BS, Madsen PP, Zeigler
M, Raas- Rothschild A, Zlotogorski A, Gutman A and Korman SH: TAT
gene mutation analysis in three Palestinian kindreds with
oculocutaneous tyrosinaemia type II; characterization of a silent
exonic transversion that causes complete missplicing by exon 11
skipping. J Inherit Metab Dis. 29:620–626. 2006. View Article : Google Scholar : PubMed/NCBI
|
|
62
|
Bouyacoub Y, Zribi H, Azzouz H, Nasrallah
F, Abdelaziz RB, Kacem M, Rekaya B, Messaoud O, Romdhane L,
Charfeddine C, et al: Novel and recurrent mutations in the TAT gene
in Tunisian families affected with Richner-Hanhart syndrome. Gene.
529:45–49. 2003. View Article : Google Scholar
|
|
63
|
Fu L, Dong SS, Xie YW, Tai LS, Chen L,
Kong KL, Man K, Xie D, Li Y, Cheng Y, et al: Down-regulation of
tyrosine aminotransferase at a frequently deleted region 16q22
contributes to the pathogenesis of hepatocellular carcinoma.
Hepatology. 51:1624–1634. 2010. View Article : Google Scholar : PubMed/NCBI
|
|
64
|
Su W, Wang Y, Jia X, Wu W, Li L, Tian X,
Li S, Wang C, Xu H, Cao J, et al: Comparative proteomic study
reveals 17β-HSD13 as a pathogenic protein in nonalcoholic fatty
liver disease. Proc Natl Acad Sci USA. 111:11437–11442. 2014.
View Article : Google Scholar : PubMed/NCBI
|
|
65
|
Fujimoto Y, Itabe H, Sakai J, Makita M,
Noda J, Mori M, Higashi Y, Kojima S and Takano T: Identification of
major proteins in the lipid droplet-enriched fraction isolated from
the human hepatocyte cell line HuH7. Biochim Biophys Acta 1644.
47–59. 2004.
|
|
66
|
Chen J, Zhuo JY, Yang F, Liu ZK, Zhou L,
Xie HY, Xu X and Zheng SS: 17-beta-hydroxysteroid dehydrogenase 13
inhibits the progression and recurrence of hepatocellular
carcinoma. Hepatobiliary Pancreat Dis Int. 17:220–226. 2018.
View Article : Google Scholar : PubMed/NCBI
|