Introduction
Ovarian cancer, which ranks fifth in terms of
cancer-associated mortalities among women, is the most lethal
gynaecological malignancy (1).
Epithelial ovarian cancer (EOC) is the most common type of ovarian
cancer and comprises a heterogeneous group of diseases. High-grade
serous ovarian carcinoma (HGSOC), which is the most common EOC
subtype, has several unique clinical features and high genomic
instability (2). Irrespective of
the histological type, the standard first-line chemotherapy for EOC
is platinum-based either as a single agent or in combination with
paclitaxel (3). However, there is
evidence that response to this therapy varies in different
histological subtypes (4).
Historically, the estimation of prognosis for a
number of cancer sites relied heavily on conventional
clinicopathological parameters. More recently, molecular profiling
has provided an additional dimension to improve prognostic accuracy
and has assisted in identifying subclasses of tumours more closely
linked to prognosis. Potentially, such an approach can also reveal
novel targets for treatment (5).
Prostaglandins (PGs) are a family of biologically
active endogenous metabolites of arachidonic acid. PGs control a
large range of physiological functions, including the regulation of
smooth muscle tone, inflammation, cellular growth and
differentiation (6). In the normal
ovary, PGD2 signalling interferes with the action of
follicle-stimulating hormone within granulosa cells, thereby
indicating an important role for PGD2 signalling in the modulation
of the balance of the proliferation, differentiation and
steroidogenic activity of these cells (7). The protein product of prostaglandin D2
synthase 21 kDa (brain) (PTGDS), PGD2 protein, was initially
identified as the main prostaglandin in the brain (8) and within brain tumours (9). PGD2 has previously been shown to
inhibit cell migration and invasion (10–14).
Reduction in the protein expression of PGD2 was shown to be a
significant biological event that is involved in the malignant
progression of astrocytomas and predicts poor patient survival
(12). In addition, PGD2 levels in
serous cystadenocarcinoma of the ovary were shown to inhibit in
vitro and in vivo ovarian cancer cell growth in a
dose-dependent manner, subsequently extending the survival time of
nude mice with these tumours (10).
In order to identify markers that could predict
response to conventional therapy at the time of first surgery, an
exploratory large-scale gene expression array was conducted in a
cohort of 11 patients with HGSOC in the present study, and whether
the expression of these genes could be used to predict response in
a larger cohort of 114 HGSOC FFPE samples with a known outcome was
assessed. In the cohort of 114 HGSOC patients, PGD2 evaluation by
immunohistochemistry (IHC) was found to be a marker of a good
prognosis.
Patients and methods
Tissue sample collection for
microarray analysis
The study design was approved by the Medical Ethical
Committee of the A.C. Camargo Cancer Center (São Paulo, Brazil;
1863/14). For this first approach, patients were selected who were
diagnosed with an advanced stage of HGSOC between January 2000 and
August 2013, and whose specimens were obtained from optimal
debulking surgery (<1 cm of gross residual disease) (15) prior to chemotherapy. All patients
provided written informed consent for the collection of samples and
subsequent analysis, and this study was approved by the Ethics
Committee of the A.C. Camargo Cancer Center (1863/14). All patients
with advanced-stage HGSOC were treated with platinum-taxane
standard chemotherapy following surgery (6 cycles of carboplatin
with area under the curve of 5 or 6, and 175 mg/m2
paclitaxel on day 1 every 21 days). Cancer antigen 125 (CA125)
serum level and image analyses were routinely performed at
follow-up visits. Patients with unavailable data regarding primary
surgery and chemotherapy, and patients with a follow-up time of
<24 months were excluded for the analysis of platinum response.
A total of 11 frozen primary HGSOC tissue specimens were selected
from the available samples in the institution biobank following
these criteria.
Clinical endpoints
For the survival signature, disease-free survival
was calculated as the interval from primary surgery to disease
progression or recurrence. The platinum-free interval (PFI) was
considered the interval between the date of the last platinum
compound infusion and the date of disease progression. In a cohort
of 114 HGSOC patients, the protein expression was evaluated along
with anatomopathological data and chemotherapy response. Cases in
which patients relapsed within 6–12 months were defined as platinum
partially sensitive. Patients who relapsed >12 months later were
termed platinum-sensitive and those who relapse within 6 months of
completing initial treatment was classified as being
platinum-resistant (16,17). Progression was defined per the
Gynaecological Cancer InterGroup (GCIG) criteria (18) following the evaluation of Response
Evaluation Criteria In Solid Tumors and CA125 progression in the
medical charts, and the date of the earlier event was considered
for progression. GCIG considers CA125 progression to have occurred
if there is a doubling in CA125 from the upper limit of the normal
range (normal range, 0.6–35.0 U/ml) (19). For those patients whose CA125 level
does not decrease to within the normal range, a doubling from the
nadir is considered progression (20,21).
Overall survival was determined by the time interval between the
date of diagnosis and the date of mortality due to ovarian
cancer.
Sample processing and gene expression
profiling
Upon histological evaluation, frozen tissues
containing tumour cells were used for RNA extraction. Total RNA was
extracted using TRIzol reagent (Invitrogen; Thermo Fisher
Scientific, Inc., Waltham, MA, USA) according to the manufacturer's
protocols. The RNA quality was assessed using the RNA 6000 Nano kit
on the Agilent 2100 Bioanalyzer Platform (Agilent Technologies,
Inc., Santa Clara, CA, USA). Only samples with an RNA integrity
number >7 were considered suitable for the reaction. Total RNA
(100 ng) was converted into labelled cRNA. Universal Human
Reference RNA was labelled with Cy3 and used to control for
variability in array hybridization, establishing the same
denominator of data analysis in the reaction. Tumour cRNA was
labelled with Cy5 and hybridized for 17 h at 65°C to an Agilent
Whole Human Genome Oligo Microarray 4×44K (G4112F; Agilent
Technologies, Inc.). The hybridized microarray was washed and then
scanned in a microarray scanner with Microarray Scanner System
(Agilent Technologies, Inc.), with Scan Control Software 8.1
(Agilent Technologies, Inc.). Signal intensity per spot was
generated from the scanned image with Feature Extraction Software
with default settings. The microarray data were normalised by
intensity-dependent global normalisation (locally weighted
scatterplot smoothing) using the Agilent Feature Extraction
Software (v.10.1.1.1; Agilent Technologies, Inc.). The raw data
were normalised by median-centring the genes for each array and
then log2 transformation. The Limma package (22) was used to obtain differentially
expressed genes and the statistical comparison between samples with
different clinical responses was performed using the R package,
considering P<0.05 as indicating a statistically significant
difference.
In order to identify upregulated or downregulated
genes in a comparison of two different RNA populations, a threshold
value defined in relation to fold-change was used, where ≥4.0 and
≤-4.0 was used to classify the most and least regulated genes,
respectively. To compare the microarray datasets measured in this
group of tumour samples, patterns of gene expression were compared
between patients without disease recurrence after 2 years from
their last platinum treatment, considered as ‘long-term
disease-free patients’ and patients with recurrence within 2 years
from the last platinum treatment following initial surgery and
first-line treatment, considered as ‘short-term disease-free
patients’. This cut-off was established according to previous
studies showing that the average patient experienced clearly
defined progression within 18–24 months of cisplatin/paclitaxel
therapy (23,24).
The differentially expressed genes were submitted to
in silico analysis of biological function, canonical pathway
and upstream regulator analysis interaction networks using the
Ingenuity Pathway Analysis software (IPA; v8.0;
Ingenuity® Systems, Redwood City, CA, USA; http://www.ingenuity.com), and for graphical
representation, the TMeV v4.8 program (www.tm4.org) was
used to construct the heatmap to obtain a gene expression profile.
Hierarchical clustering was performed using Euclidean distance. In
parallel, the differentially expressed genes were searched for
significantly enriched pathways with the software KOBAS 2.0
(25). Only pathways identified
simultaneously by IPA and KOBAS with P≤0.05 were considered for
further interpretation.
Technical validation using reverse
transcription-quantitative polymerase chain reaction (RT-qPCR)
In order to evaluate the reproducibility of
microarray data through transcript quantification, RT-qPCR
technology was used as a support technique to validate and quantify
the drivers. Phospholipase C β2 (PLCB2) and PTGDS
were selected for validation by RT-qPCR, taking into account in
silico analyses by IPA software together with an accurate
search in the literature and the biological role of these genes in
the context of HGSOC. The RNA samples used in the microarray
analysis were converted into cDNA from 2 µg total RNA using the
High-Capacity cDNA Reverse Transcription kit (Applied Biosystems;
Thermo Fisher Scientific, Inc.), following the manufacturer's
protocols. RT-qPCR was performed in triplicate on Applied
Biosystems 7500HT Fast Real-Time PCR system equipment (Applied
Biosystems; Thermo Fisher Scientific, Inc.) with initial
denaturation at 95°C for 3 min, followed by a second denaturation
at 95°C for 30 sec and annealing at 60°C for 30 sec for 40 cycles.
The assays were performed using SYBR®-Green Master Mix
(Thermo Fisher Scientific, Inc.) following the manufacturer's
protocols and the quantitation cycle (cq) values were submitted to
a 2−∆∆Cq analysis (26).
The Universal Human Reference RNA (cat. no. 740000; Agilent
Technologies, Inc.) was used as reference sample, and as endogenous
controls, glyceraldehyde phosphate dehydrogenase, β-actin
(ACTB) and 18S rRNA were tested, and thereafter,
ACTB was selected as the endogenous control due to its lower
threshold cycle variation among the samples. All the primer
sequences are summarized in Table
I.
 | Table I.Oligonucleotides sequence and reverse
transcription-quantitative polymerase chain reaction
conditions. |
Table I.
Oligonucleotides sequence and reverse
transcription-quantitative polymerase chain reaction
conditions.
| Gene | Forward | Reverse | Amplicon | Slope | Efficiency | Primer
concentration, nM |
|---|
| PLCß2 |
CAGACAAGATGGCCCAGGAG |
CTCCCGTATCTGTTCCAGGC | 155 | −3.19 | 1.05 | 400 |
| PTDGS |
CTTCCTGCCCCAAACCGATA |
GCAGAGACATCCAGAGCGTG | 106 | −3.451 | 0.95 | 200 |
| 18S
rRNA |
GTAACCCGTTGAACCCCATT |
CCATCCAATCGGTAGTAGCG | 110 | −3.529 | 0.92 | 25 |
| GAPDH |
AATCCCATCACCATCTTCCA |
TGGACTCCACGACGTACTCA | 107 | −3.448 | 0.94 | 50 |
| ACTB |
TCCCTGGAGAAGAGCTACGA |
AGCACTGTGTTGGCGTACAG | 90 | −3.309 | 1.00 | 100 |
Protein expression by IHC using tissue
microarrays (TMA)
Histological slides were reviewed by an experienced
gynaecological pathologist in order to select the most
representative paraffin block from each tumour. Histological
subtype was revised based on World Health Organisation
classification of ovarian tumours (27). The degree of histological
differentiation was determined according to Malpica classification
(28). For TMA construction, two
representatives of 0.6-mm tumour cores were embedded on a recipient
paraffin block. Once the whole recipient block was finished, it was
baked at 42°C for 40 min and mapped in a spread table for
subsequent evaluation.
Immunohistochemical analysis was performed on 5-mm
thick TMA sections using a polyclonal antibody against PGD2 (Santa
Cruz Biotechnology, Inc., Dallas, TX, USA; cat. no. sc-201221A) at
1:100 dilution followed by Ventana detection system in a Discovery
XT automated instrument (Ventana Medical Systems, Inc., Tucson, AZ,
USA). The antibodies were incubated at 37°C for 32 min and the
complex was then visualized with hydrogen peroxide substrate and
3,3′-diaminobenzidine tetrahydrochloride chromogen and
counterstained with hematoxylin. All batches included cerebral
cortex, provided from the samples archives of the AC Camargo Cancer
Center, as positive controls, and omission of the primary antibody
was used as a negative control.
Slide digitization and IHC
analysis
Digital images of IHC-stained TMA slides were
obtained at ×20 magnification using a Panoramic 250 High Throughput
Scanner (3DHistech, Budapest, Hungary). Images were loaded and
visualized using a specialized server (Panoramic Viewer). PGD2
expression was noted as sharp, well-localized cytoplasmic staining
and the expression pattern was evaluated in a quantitative manner,
whereby the levels of expression were represented by the intensity
of staining and was scored on a scale of 1+ to 3+. All sections
were analysed in a blinded manner. For the descriptive statistics,
association tests and survival analysis, samples were classified
into 2 groups, namely those that exhibited weak expression of PGD2
and those that more strongly exhibited PGD2 (2+ and 3+) (29).
Statistical analysis
Statistical analysis was performed using SPSS
version 22.0 (IBM, Corp., Armonk, NY, USA) for Windows. The
association between categorical variables was analysed by
χ2 or Fisher's exact tests. Correlation among numerical
variables was determined by Spearman's correlation test for
non-normally distributed data. In a cohort of 114 patients used to
evaluate PGD2 expression, survival curves were constructed by
Kaplan-Meier analysis, and the comparison of survival curves for
each variable category was performed using a log-rank test.
Univariate and multivariate analyses were performed using Cox
regression. For multivariate analysis, all variables with P<0.20
in the univariate analysis were entered into the test (30). For all tests, P≤0.05 was considered
to indicate a statistically significant difference.
Results
cDNA microarray analysis
Whole tumour gene expression profiling was conducted
on 11 patients with HGSOC, ranging in age from 42 to 68 years
(median, 52 years), as shown in Table
II. The median follow-up time was 59 months, ranging from 21.40
to 98.08 months. A previous study showed that among patients who
present with advanced disease, 10–15% achieve long-term remission;
however, the remainder tends to undergo a progression of treatments
(31). The number of selected
patients for the initial approach in the present study were within
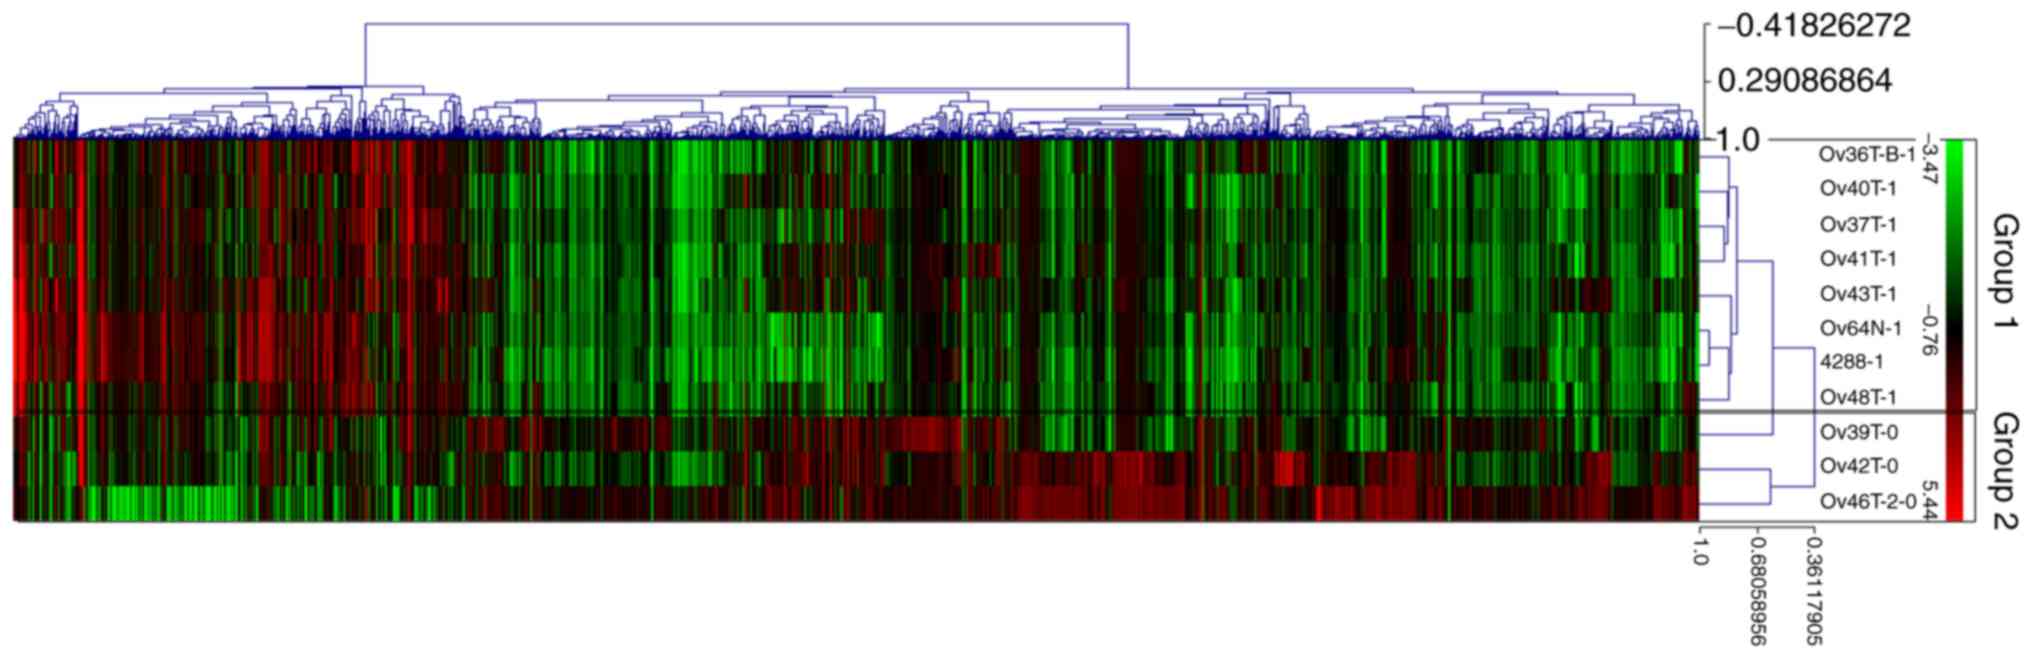
this range and showed a PFI of 21 months, with 8 patients (73%) who
underwent a relapse within 2 years (group 1: Short-term
disease-free patients) and 3 patients (27%) who were characterized
as long-term disease-free patients (group 2). Using these 2 groups,
the global gene expression was obtained, and observations from the
heat map (Fig. 1) showed a
molecular similarity between samples according to clinical
response. The colour distribution on the heat map assisted in
aggregating the data visually, aiding the detection of distribution
patterns.
| Table II.Samples selected for large-scale gene
expression analysis. |
Table II.
Samples selected for large-scale gene
expression analysis.
| Sample no. | Age at diagnosis,
years | RIN | Stage | Disease-free
survival, months | Microarray
analysis |
|---|
| 1 | 55 | 9.1 | IIIC | 23.9 | Long-term
disease-free patients |
| 2 | 45 | 8.8 | IIIC | 13.6 | Short-term
disease-free patients |
| 3 | 43 | 9.1 | IIIC |
8.9 | Short-term
disease-free patients |
| 4 | 43 | 5.1 | IIIC |
8.3 | Short-term
disease-free patients |
| 5 | 52 | 9.2 | IIIC |
2.0 | Short-term
disease-free patients |
| 6 | 58 | 8.6 | IIIC | 22.5 | Long-term
disease-free patients |
| 7 | 69 | 6.4 | IIIC |
6.3 | Short-term
disease-free patients |
| 8 | 71 | 5.1 | IIIC | 20.9 | Short-term
disease-free patients |
| 9 | 58 | 5.4 | IIIB | 21.2 | Short-term
disease-free patients |
| 10 | 68 | 6.5 | IIIC | 34.6 | Long-term
disease-free patients |
| 11 | 45 | 8.9 | IIIC | 14.0 | Short-term
disease-free patients |
Applying a threshold value, defined in relation to
fold-change |4.0|, 150 differently expressed genes, 97 of which
were downregulated and 53 of which were upregulated, were acquired
(data not shown). Enrichment analysis using two methods (IPA and
KOBAS) identified pathways that were significantly over-represented
(P<0.05) among the 150 differentially expressed genes (Table III). The enrichment analysis
performed using the IPA software paired with the enrichment
analysis of the KOBAS software generated 22 annotations of pathways
associated with the molecular mechanisms of cancer, some of which
were associated with mechanisms of ‘cell division and survival’,
‘invasion’, ‘regulatory mechanism’, ‘growth’, ‘angiogenesis’,
‘metabolism’ and ‘interaction with the immune system’ (Table III). The ‘p53 signalling pathway’,
a tumour suppressor protein pathway that is the most commonly
mutated in human cancer, along with a high frequency of alteration
in high-grade serous adenocarcinoma (32), appeared to negatively regulated in
the present data analysis (IPA, P<0.001; KOBAS, P=0,04) within
lipid metabolism. This illustrates the key role played by lipids in
maintaining homeostasis, which was also altered for molecular
function in IPA software (P≤0.001) and in the KOBAS database
(characterized as the regulation of ‘membrane lipid metabolic
process’, Gene Ontology: 0019216, P=0.03, and ‘arachidonic acid
metabolic process’, Kyoto Encylopaedia of Genes and Genomes
pathway, P=0.0072).
| Table III.Gene enrichment analyses using
Ingenuity Pathway Analysis and KOBAS 2.0 tools pathways of the 150
selected genes. |
Table III.
Gene enrichment analyses using
Ingenuity Pathway Analysis and KOBAS 2.0 tools pathways of the 150
selected genes.
| Molecular
mechanisms of cancer | Pathway | Database | ID | P-value |
|---|
| Cell division and
survival | Cell cycle | Reactome | REACT_111214 | 0.040 |
|
| Regulation of
extrinsic apoptotic signalling pathway via death domain
receptors | Gene Ontology | GO:1902041 | 0.027 |
|
| Regulation of
execution phase of apoptosis | Gene Ontology | GO:1900117 | 0.032 |
|
| p53 signalling
pathway | KEGG PATHWAY | hsa04115 | 0.040 |
| Invasion | TGF-β receptor
signalling in EMT | Reactome | REACT_120726 | 0.019 |
|
| Regulation of cell
migration | Gene Ontology | GO:0030334 | 0.006 |
|
| Cell-matrix
adhesion | Gene Ontology | GO:0007160 | 0.014 |
|
| Regulation of
cellular component movement | Gene Ontology | GO:0051270 | 0.024 |
|
| Cell junction
organization | Gene Ontology | GO:0034330 | 0.042 |
|
| Focal adhesion
assembly | Gene Ontology | GO:0048041 | 0.047 |
| Regulatory
mechanisms | mRNA transcription
from RNA polymerase II promoter | Gene Ontology | GO:0042789 | 0.017 |
|
| Drug binding | Gene Ontology | GO:0008144 | 0.041 |
|
| Positive regulation
of NF-κB import into nucleus | Gene Ontology | GO:0042346 | 0.044 |
|
| ER-nucleus
signalling pathway | Gene Ontology | GO:0006984 | 0.049 |
| Control of cell
growth | Regulation of SMAD
protein import into nucleus | Gene Ontology | GO:0060390 | 0.019 |
|
| Insulin receptor
binding | Gene Ontology | GO:0005158 | 0.011 |
|
| Cellular response
to gonadotropin stimulus | Gene Ontology | GO:0071371 | 0.029 |
| Angiogenesis | Angiogenesis
involved in wound healing | Gene Ontology | GO:0060055 | 0.019 |
|
| Positive regulation
vascular endothelial growth factor production | Gene Ontology | GO:0010575 | 0.044 |
| Metabolism | Arachidonic acid
metabolic process | KEGG PATHWAY | hsa00590 | 0.007 |
|
| Membrane lipid
metabolic process | Gene Ontology | GO:0006643 | 0.011 |
| Interaction with
immune system | Granulocyte
migration | Gene Ontology | GO:0097530 | 0.027 |
Validation of the selected transcripts
by RT-qPCR
RT-qPCR analysis was used to confirm transcriptome
alterations detected by microarray in all 11 selected samples.
Constitutive expression of ACTB was used to correct
variations and difference between RNA quantification (Table I). The average fold-change value was
extracted from each sample of the microarray assay and the RT-qPCR
in order to evaluate the correlation between the values obtained by
the two techniques. PLCB2 and PTGDS belonging to the
metabolism of lipids pathway were submitted to technique validation
and PTGDS showed a significant correlation between the
results of microarray and RT-qPCR (Table IV).
| Table IV.Fold-change of genes drivers obtained
by microarray and RT-qPCR and its correlation. |
Table IV.
Fold-change of genes drivers obtained
by microarray and RT-qPCR and its correlation.
|
| Fold-change |
|
|
|
|---|
|
|
|
|
|
|
|---|
|
| Microarray | RT-qPCR | Technique
validation |
|---|
|
|
|
|
|
|---|
| Gene | Group 1 | Group 2 | Group 1 | Group 2 | 95% CI | Correlation | P-value |
|---|
| PLCB2 | 3.08 | −0.22 | 2.71 | −0.41 | −0.4404–0.7418 | 0.236 | 0.484 |
| PTGDS | 4.30 | 1.63 | 6.15 | 1.60 | 0.7908–0.9866 | 0.945 |
<0.001a |
IHC analysis
Based on validation by RT-qPCR, the protein product
of PTGDS, PGD2, was chosen for further studies with IHC. A
larger set of HGSOC samples was available as formalin-fixed
paraffin-embedded sections for this analysis, providing 114
specimens for protein evaluation and correlation with
clinicopathological data and survival rates. The median age of this
cohort was 59 years, ranging from 33 to 82 years. A total of 97
(88.2%) patients out of 110 women who had this information in the
medical charts were diagnosed in advanced-stages (FIGO staging
III–IV), 91 out of 113 (80.5%) relapsed, 50 out of 114 (43.9%) were
alive at the time of the study and 30 out of 107 patients (28.0%)
were platinum-mjresistant. Clinicopathological features of all 114
patients are described in Table V.
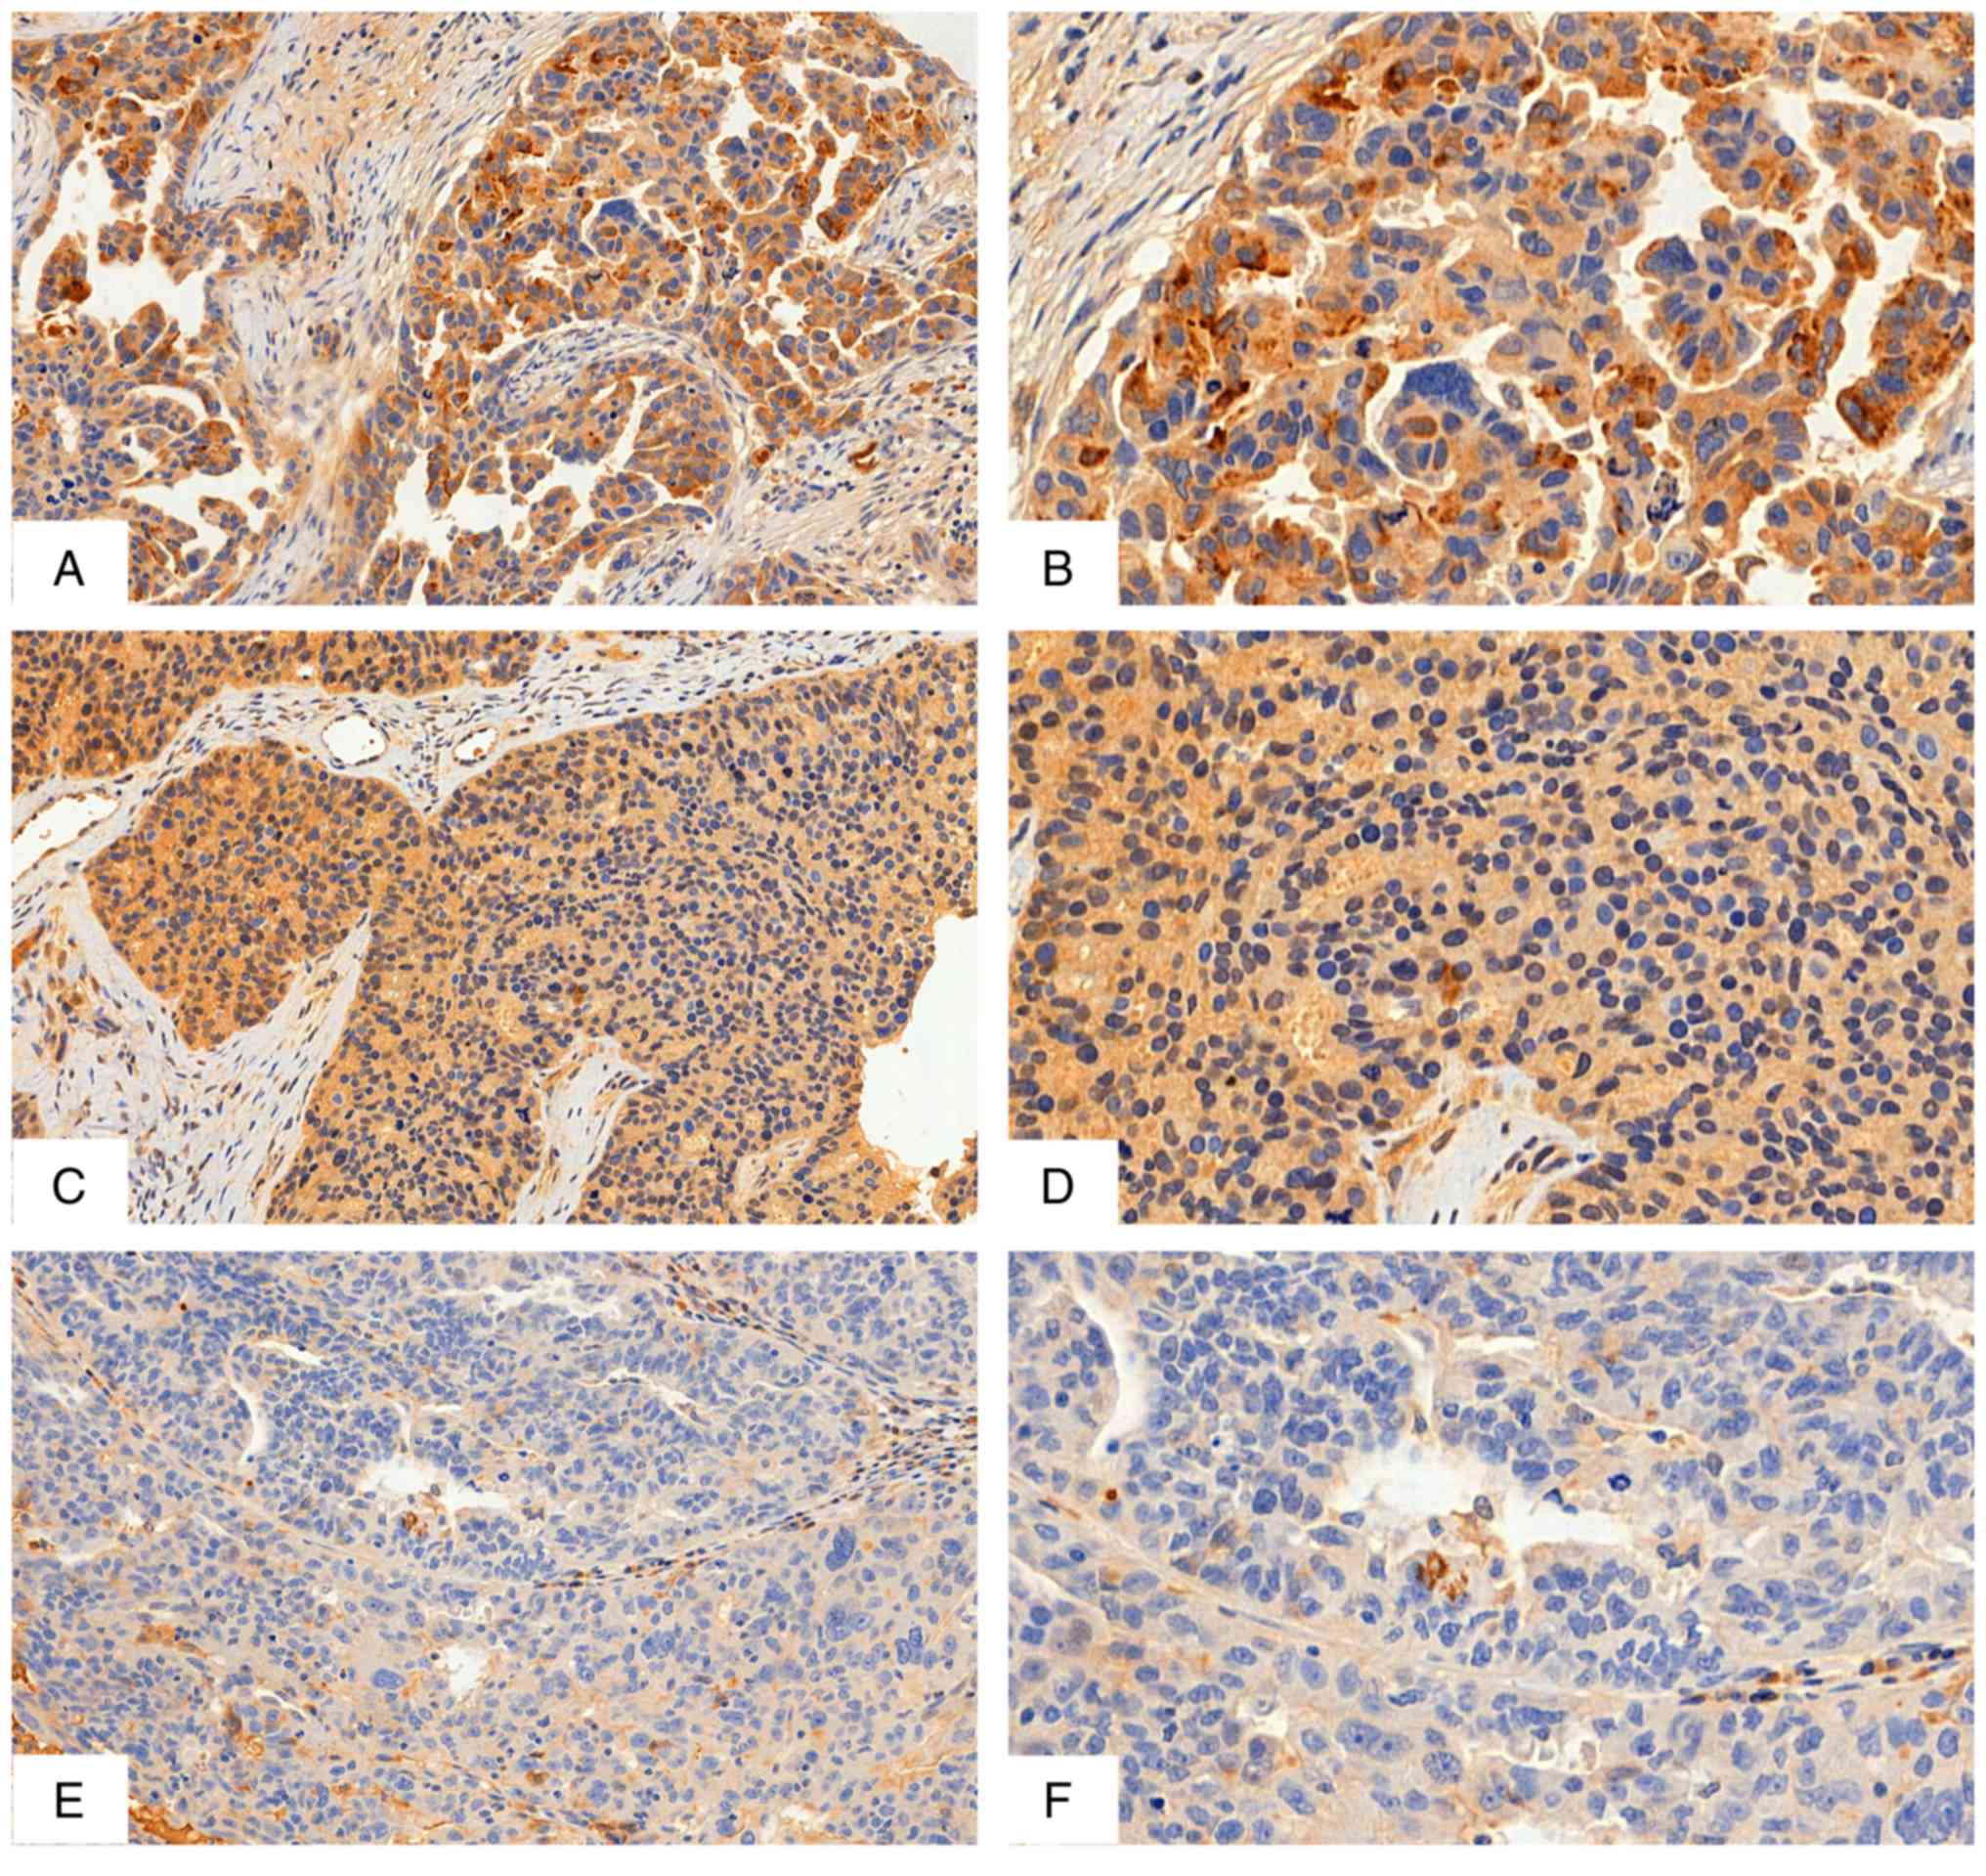
PGD2, a prostaglandin associated with suppression of inflammation
is visualised by IHC as well-defined cytoplasmic staining (Fig. 2). According to χ2 and
Fischer's exact tests, the lower intensity of PGD2 was associated
with mortality (P=0.05), relapse (P=0.039) and resistance to
platinum chemotherapy (P=0.016) (Table
VI).
| Table V.Clinicopathological features of 114
patients with high-grade serous ovarian carcinoma analysed in
formalin-fixed, paraffin-embedded samples. |
Table V.
Clinicopathological features of 114
patients with high-grade serous ovarian carcinoma analysed in
formalin-fixed, paraffin-embedded samples.
| Variables | Category | n/total n (%) |
|---|
| Staging | I/II | 13/110 (11.8) |
|
| III/IV | 97/110 (88.2) |
| CA125
(median/range) | <780 | 46/91
(50.5) |
|
| >780 | 45/91
(49.5) |
| ECOG PS | 0 | 40/89
(44.9) |
|
| 1, 2, 3 | 49/89
(55.1) |
| Age, years | <59 | 55/114 (48.2) |
|
| >59 | 59/114 (51.8) |
| Mortality | No | 50/114 (43.9) |
|
| Yes | 64/114 (56.1) |
| Relapse | No | 22/113 (19.5) |
|
| Yes | 91/113 (80.5) |
| Platinum
response |
Platinum-resistant | 30/107 (28) |
|
| Partially
platinum-sensitive | 20/107 (18.7) |
|
|
Platinum-sensitive | 20/107(18.7) |
|
| Responder | 37/107 (34.6) |
| Table VI.Distribution of high-grade serous
ovarian carcinoma samples according to intensity of prostaglandin
D2 protein and standard prognostic factors. |
Table VI.
Distribution of high-grade serous
ovarian carcinoma samples according to intensity of prostaglandin
D2 protein and standard prognostic factors.
| Variables | Category | +1, n (%) | 2+/3+, n (%) | P-value |
|---|
| Staging | I/II | 1 (4.8) | 12 (14.6) | 0.296a |
|
| III/IV | 20 (95.2) | 70 (85.40 |
|
| Pre-treatment CA125
(median/range) | >780 | 5 (33.3) | 39 (55.7) | 0.197b |
|
| <780 | 10 (66.7) | 31 (44.3) |
|
| Age, years | <59 | 12 (54.5) | 42 (50) | 0.889b |
|
| >59 | 10 (45.5) | 42 (50) |
|
| ECOG PS | 0 | 5 (27.8) | 35 (53) | 0.102b |
|
| 1, 2, 3 | 13 (72.2) | 31 (47) |
|
| Mortality | No | 5 (22.7) | 41 (48.8) | 0.05b,c |
|
| Yes | 17 (77.3) | 43 (51.2) |
|
| Relapse | No | 1 (4.5) | 21 (25) | 0.039a,c |
|
| Yes | 21 (95.5) | 64 (75) |
|
| Platinum
response |
Platinum-resistant | 11 (55) | 16 (20) | 0.016a,c |
|
| Partially
platinum-sensitive | 2 (10) | 17 (21.3) |
|
|
|
Platinum-sensitive | 4 (20) | 16 (20) |
|
|
| Responder | 3 (15) | 31 (38.8) |
|
Kaplan-Meier survival analysis and
multivariate Cox regression analysis of patient outcomes
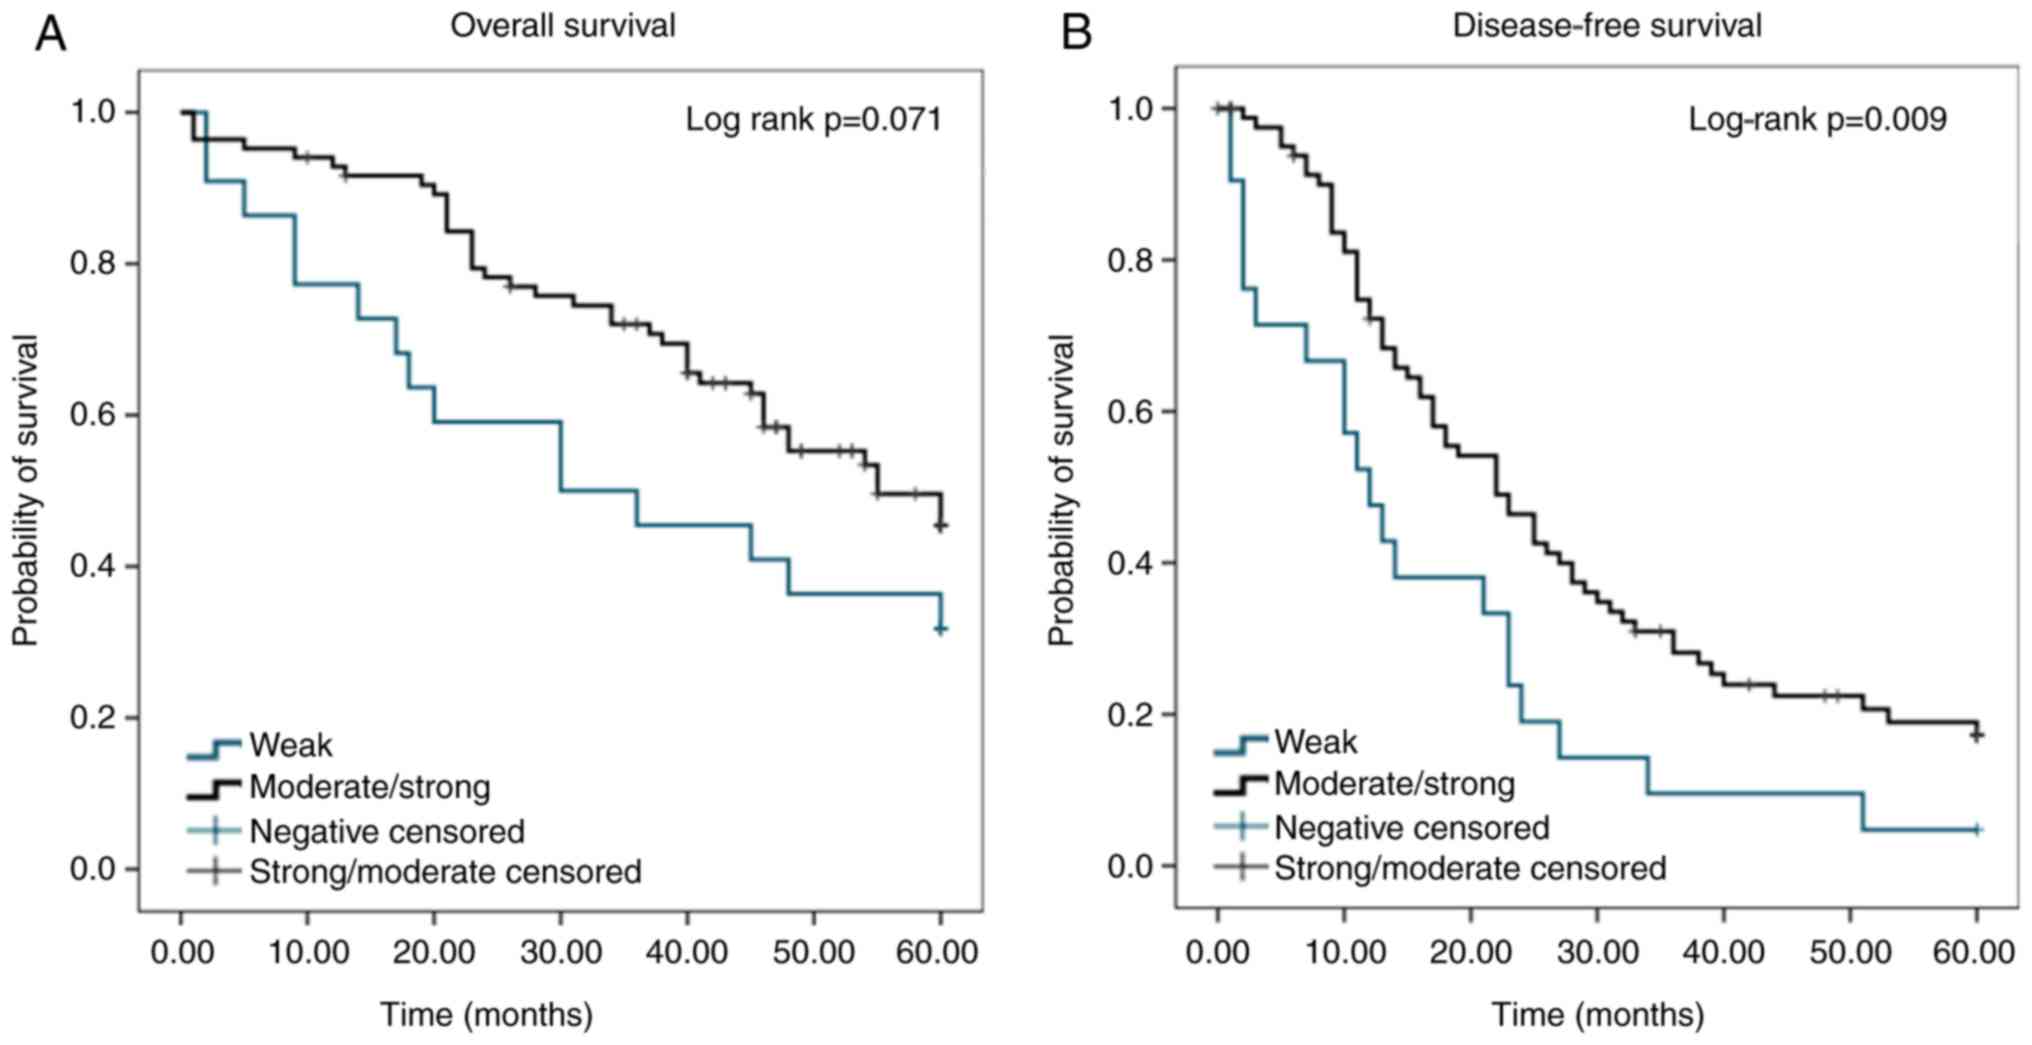
In a cohort of 114 patients used to evaluate PGD2
expression, survival curves (Fig.
3) were created to show the association between PGD2 expression
and outcome. The median disease-free survival for patients whose
tumours exhibited moderate to strong expression of PGD2 was 22
months, which was significantly higher than the median survival of
patients whose tumours exhibited weak PGD2 expression (12 months)
(P=0.009). A Cox proportional hazards regression model showed that
a score of 1+ for PGD2 protein expression in the tumour was a
strong predictor of poor disease-free survival [hazard ratio (HR),
0.52; 95% confidence interval, 0.31–0.86; P=0.01]. The prediction
of mortality was not statistically significant (HR, 0.58; 95%
confidence interval, 0.32–1.06; P=0.08).
Putative prognostic variables with P<0.20 in the
univariate analysis (data not shown) were entered into a
multivariate analysis to identify independent prognostic factors.
Multivariate analysis showed a significant association between a
lower level of PGD2 expression and a high risk of progression
following chemotherapy (HR, 0.37; 95% CI, 0.20–0.69; P=0.002)
(Table VII).
| Table VII.Estimation of parameters of multiple
Cox regression model for mortality and relapse in the tissue
microarray cohort. |
Table VII.
Estimation of parameters of multiple
Cox regression model for mortality and relapse in the tissue
microarray cohort.
|
| Mortality | Relapse |
|---|
|
|
|
|
|---|
| Feature | P-value | HR (95% CI) | P-value | HR (95% CI) |
|---|
| Surgery | 0.003a | 3.61
(1.53–8.48) | 0.002a | 2.50
(1.39–4.48) |
| Residual
disease | 0.004a | 3.12
(1.63–5.99) |
<0.001a | 2.55
(1.5–4.34) |
| ECOG PS | 0.003a | 3.01
(0.17–1.15) | – | – |
| PGD2 | – | – | 0.002a | 0.37
(0.20–0.69) |
Discussion
Disease heterogeneity is an under-appreciated
challenge in pre-diagnostic biomarker identification. Molecular
analysis is increasingly revealing that diseases that were once
considered monotypic are actually multiple molecular diseases
sharing a common clinical presentation (33). Ovarian cancer is no exception and
shows a huge genomic complexity among its different subtypes. A
molecular approach to ovarian cancer allows us to investigate
biological differences that are not otherwise visible through
morphology, and provides an indication of the potential impact of
genomics on cancer research and care. In the present study of
ovarian cancer, a set of 11 samples were carefully selected
according to well-established prognostic factors in order to
understand how samples with the same morphological features could
have such different clinical outcomes from the same treatment.
An in-silico analysis using IPA software
combined with the KOBAS database showed that the drivers
significantly expressed in the microarray platform were strongly
involved in molecular mechanisms of cancer. The enrichment analysis
that was undertaken for the gene list demonstrated their
participation in main networks that regulate several functions of
cancer development and progression, thus corroborating the
selection of potential drivers. Metabolic reprogramming is now
established as a hallmark of cancer (34) and metabolites that change
significantly provide insights into the biochemical consequences of
transformation and could be considered candidate biomarkers of
ovarian carcinogenesis (35). In
order to confirm our large-scale gene expression results,
PTGDS was selected and validated based on the metabolism of
lipids pathway.
PGs are a family of arachidonic acid and
metabolites, with specific roles for different proteins. Certain
PGs exhibit pro-carcinogenic effects, for example, PGE2, which is
associated with the proliferation of various types of cancer
(36–38), whilst others, such as PGD2, can
exhibit cancer-protective characteristics (12,39).
This enzyme-derived metabolite is known to act as a negative
feedback regulator of cyclooxygenase-2 (COX-2), and has been
reported to act as a ‘landscaping tumour promoter’ (40). In a previous study, the PGD2
metabolite 15d-PGJ2 suppressed the cytokine-induced expression of
COX-2 by peroxisome proliferator-activated receptor γ (PPARγ) in a
PPARγ-dependent and -independent manner. PPARγ is a member of the
nuclear hormone receptor superfamily and functions as a
ligand-dependent transcription factor (41). PPARγ/RXR heterodimer activated by
15d-PGJ2 upregulates transcription of IκB, which stops nuclear
factor-κB (NF-κB) from activating COX-2 transcription.
Additionally, PPARγ agonists can inhibit IκB kinase (IKK) in the
cytosol, thus preventing IκB phosphorylation, leading to the
nuclear translocation and activation of NF-kB, and thereby the
suppression of COX-2 gene transcription (42,43).
Certain studies previously evaluated mRNA in EOC
samples and reported that PTGDS was involved in disease
progression (44,45). Kaplan-Meier Plotter, a web
application for assessing the effect of gene expression and
survival rates using cancer samples (http://kmplot.com/analysis/index.php?p=service),
including HGSOC mRNA samples, showed that PTGDS mRNA
expression was associated with a worse prognosis in terms of
disease-free survival (HR, 1.5; P=0.0146). However, it is unwise to
focus on isolated information based on gene expression only.
It has been common practice to use mRNA
concentrations to deduce concentrations and activities of the
corresponding proteins, but this assumes that transcript abundance
is the main determinant of protein abundance. However,
transcriptional and post-transcriptional regulation, for example by
microRNA (miRNA/miR), cannot be ignored (46). During an investigation on miRNA
roles in tongue squamous cell carcinoma cell lines and a
cisplatin-resistant cell line, Yu et al (47) reported that miR-518c, and miRNA that
has PTGDS as a putative target, was differentially
expressed, with a high level of expression in the
cisplatin-resistant cell line. This suggested that PTGDS
transcripts may be regulated by miRNAs, and may explain the
discrepancy observed in the present results, in which mRNA levels
do not follow the same protein level pattern.
In the present study, the expression of PGD2
evaluated by IHC was associated with an improved prognosis, and
thus represented a potential molecular target involved in
determining the clinical outcome in patients with HGSOC. A study by
de Jong et al (47) in an
ovarian cancer cell line demonstrated the effects of PGD2
metabolite 15d-PGJ2 on apoptosis, cell migration, transformation
and drug resistance, indicating that 15d-PGJ2 may reduce drug
resistance and inhibit tumour metastasis by inhibiting NF-κB. These
results aid in improving our understanding of the complex actions
of the endogenous metabolite PGD2, suggesting its potential
therapeutic use as an anticancer agent (48).
Ovarian cancer is the most common cause of
gynaecological cancer-associated mortality among women in developed
countries. However, certain subgroups of patients experience
comparatively longer survival times. Research is currently being
performed for the identification of prognostic factors that
characterize such patients, and areas of investigation include
biomarker studies. Key aspects of biomarker development include
careful study design and sample selection to avoid bias,
comprehensive testing, validation and accurate reporting of the
results (49). The present study
provides evidence that IHC evaluation of PGD2 protein in HGSOC
surgical samples generates prognostic information in patients
treated with a standard approach, such as cisplatin or carboplatin,
and a taxane, such as paclitaxel. These findings can be used for
patient assessment in multiple clinical settings, including for the
estimation of the likelihood of disease-free survival and
determining possible platinum sensitivity. IHC evaluation of PDG2
was an independent marker of a good prognosis, thereby contributing
to our understanding of a mechanism of tumour regulation. Although
a number of challenges remain, the incorporation of properly
validated biomarkers into clinical practice holds great potential
for the improvement of HGSOC treatment.
Acknowledgements
The authors would like to thank Dr Corrado D'Arrigo
and Dr Sarah Wedden (both Poundbury Cancer Institute, Dorset,
England) for critical reading of the manuscript and all members
from Poundbury Cancer Institute, for their valuable technical
assistance on protein analysis.
Funding
Funding for this project was provided by the
Foundation for Research Support of the State of São Paulo and
Coordination for the Improvement of Higher Educational
Personnel.
Availability of data and materials
The datasets used and/or analyzed during the current
study are available from the corresponding author on reasonable
request.
Authors' contributions
Research and design: MRA, NSDA, LDB, AABADC, FAS and
RMR. Conducted the research: MRA, NSDA and FIDBS. Development of
methodology: MRA, NSDA, FAM, FIDBS and KCC. Acquisition of patient
data: AABADC and GB. IHC analysis and statistical analysis: MRA,
LDB, AABADC. Manuscript revision in terms of intellectual content:
AABADC and RMR. All the authors read and approved the final
manuscript.
Ethics approval and consent to
participate
This study was approved by the Regional Ethics
Committee at A.C. Camargo Cancer Center (São Paulo, Brazil;
1863/14).
Patient consent for publication
A consent form declaring that the patient is aware
of data publication was applied, evaluated and approved by the
Regional Ethics Committee at A.C. Camargo Cancer Center in 2014
(São Paulo, Brazil; 1863/14).
Competing interests
The authors declare that they have no competing
interests.
References
|
1
|
Siegel RL, Miller KD and Jemal A: Cancer
statistics, 2016. CA Cancer J Clin. 66:7–30. 2016. View Article : Google Scholar : PubMed/NCBI
|
|
2
|
Wang ZC, Birkbak NJ, Culhane AC, Drapkin
R, Fatima A, Tian R, Schwede M, Alsop K, Daniels KE, Piao H, et al:
Profiles of genomic instability in high-grade serous ovarian cancer
predict treatment outcome. Clin Cancer Res. 18:5806–5815. 2012.
View Article : Google Scholar : PubMed/NCBI
|
|
3
|
National institute for health and clinical
excellence, . Guidance on the use of paclitaxel in the treatment of
ovarian cancer. 2005.http://www.nice.org.uk/guidance/ta55
|
|
4
|
Goff BA: Advanced ovarian cancer: What
should be the standard of care? J Gynecol Oncol. 24:83–91. 2013.
View Article : Google Scholar : PubMed/NCBI
|
|
5
|
Pils D, Hager G, Tong D, Aust S, Heinze G,
Kohl M, Schuster E, Wolf A, Sehouli J, Braicu I, et al: Validating
the impact of a molecular subtype in ovarian cancer on outcomes: A
study of the OVCAD Consortium. Cancer Sci. 103:1334–1341. 2012.
View Article : Google Scholar : PubMed/NCBI
|
|
6
|
Smith WL: Prostanoid biosynthesis and
mechanisms of action. Am J Physiol. 263:F181–F191. 1992.PubMed/NCBI
|
|
7
|
Farhat A, Philibert P, Sultan C, Poulat F
and Boizet-Bonhoure B: Hematopoietic-prostaglandin D2 synthase
through PGD2 production is involved in the adult ovarian
physiology. J Ovarian Res. 4:32011. View Article : Google Scholar : PubMed/NCBI
|
|
8
|
Abdel-Halim MS, Hamberg M, Sjöquist B and
Anggård E: Identification of prostaglandin D2 as a major
prostaglandin in homogenates of rat brain. Prostaglandins.
14:633–643. 1977. View Article : Google Scholar : PubMed/NCBI
|
|
9
|
Saso L, Leone MG, Sorrentino C, Giacomelli
S, Silvestrini B, Grima J, Li JC, Samy E, Mruk D and Cheng CY:
Quantification of prostaglandin D synthetase in cerebrospinal
fluid: A potential marker for brain tumor. Biochem Mol Biol Int.
46:643–656. 1998.PubMed/NCBI
|
|
10
|
Kikuchi Y, Miyauchi M, Oomori K, Kita T,
Kizawa I and Kato K: Inhibition of human ovarian cancer cell growth
in vitro and in nude mice by prostaglandin D2. Cancer Res.
46:3364–3366. 1986.PubMed/NCBI
|
|
11
|
Yoshida T, Ohki S, Kanazawa M, Mizunuma H,
Kikuchi Y, Satoh H, Andoh Y, Tsuchiya A and Abe R: Inhibitory
effects of prostaglandin D2 against the proliferation of human
colon cancer cell lines and hepatic metastasis from colorectal
cancer. Surg Today. 28:740–745. 1998. View Article : Google Scholar : PubMed/NCBI
|
|
12
|
Payne CA, Maleki S, Messina M, O'Sullivan
MG, Stone G, Hall NR, Parkinson JF, Wheeler HR, Cook RJ, Biggs MT,
et al: Loss of prostaglandin D2 synthase: A key molecular event in
the transition of a low-grade astrocytoma to an anaplastic
astrocytoma. Mol Cancer Ther. 7:3420–3428. 2008. View Article : Google Scholar : PubMed/NCBI
|
|
13
|
Shyu RY, Wu CC, Wang CH, Tsai TC, Wang LK,
Chen ML, Jiang SY and Tsai FM: H-rev107 regulates prostaglandin D2
synthase-mediated suppression of cellular invasion in testicular
cancer cells. J Biomed Sci. 20:302013. View Article : Google Scholar : PubMed/NCBI
|
|
14
|
Tippin BL, Kwong AM, Inadomi MJ, Lee OJ,
Park JM, Materi AM, Buslon VS, Lin AM, Kudo LC, Karsten SL, et al:
Intestinal tumor suppression in ApcMin/+ mice by
prostaglandin D2 receptor PTGDR. Cancer Med.
3:1041–1051. 2014. View
Article : Google Scholar : PubMed/NCBI
|
|
15
|
du Bois A, Reuss A, Pujade-Lauraine E,
Harter P, Ray-Coquard I and Pfisterer J: Role of surgical outcome
as prognostic factor in advanced epithelial ovarian cancer: A
combined exploratory analysis of 3 prospectively randomized phase 3
multicenter trials: By the Arbeitsgemeinschaft Gynaekologische
Onkologie Studiengruppe Ovarialkarzinom (AGO-OVAR) and the Groupe
d'Investigateurs Nationaux Pour les Etudes des Cancers de l'Ovaire
(GINECO). Cancer. 115:1234–1244. 2009. View Article : Google Scholar : PubMed/NCBI
|
|
16
|
Cooke SL and Brenton JD: Evolution of
platinum resistance in high-grade serous ovarian cancer. Lancet
Oncol. 12:1169–1174. 2011. View Article : Google Scholar : PubMed/NCBI
|
|
17
|
Colombo PE, Fabbro M, Theillet C, Bibeau
F, Rouanet P and Ray-Coquard I: Sensitivity and resistance to
treatment in the primary management of epithelial ovarian cancer.
Crit Rev Oncol Hematol. 89:207–216. 2014. View Article : Google Scholar : PubMed/NCBI
|
|
18
|
Rustin GJ, Vergote I, Eisenhauer E,
Pujade-Lauraine E, Quinn M, Thigpen T, du Bois A, Kristensen G,
Jakobsen A, Sagae S, et al: Definitions for response and
progression in ovarian cancer clinical trials incorporating RECIST
1.1 and CA 125 agreed by the Gynecological Cancer Intergroup
(GCIG). Int J Gynecol Cancer. 21:419–423. 2011. View Article : Google Scholar : PubMed/NCBI
|
|
19
|
Alagoz T, Buller RE, Berman M, Anderson B,
Manetta A and DiSaia P: What is a normal CA125 level? Gynecol
Oncol. 53:93–97. 1994. View Article : Google Scholar : PubMed/NCBI
|
|
20
|
Taylor PT and Haverstick D: Re: New
guidelines to evaluate the response to treatment in solid tumors
(ovarian cancer). J Natl Cancer Inst. 97:151–152. 2005. View Article : Google Scholar : PubMed/NCBI
|
|
21
|
Rustin GJ, Quinn M, Thigpen T, du Bois A,
Pujade-Lauraine E, Jakobsen A, Eisenhauer E, Sagae S, Greven K,
Vergote I, et al: Re: New guidelines to evaluate the response to
treatment in solid tumors (ovarian cancer). J Natl Cancer Inst.
96:487–488. 2004. View Article : Google Scholar : PubMed/NCBI
|
|
22
|
Ritchie ME, Phipson B, Wu D, Hu Y, Law CW,
Shi W and Smyth GK: limma powers differential expression analyses
for RNA-sequencing and microarray studies. Nucleic Acids Res.
43:e472015. View Article : Google Scholar : PubMed/NCBI
|
|
23
|
McGuire WP, Hoskins WJ, Brady MF, Kucera
PR, Partridge EE, Look KY, Clarke-Pearson DL and Davidson M:
Cyclophosphamide and cisplatin compared with paclitaxel and
cisplatin in patients with stage III and stage IV ovarian cancer. N
Engl J Med. 334:1–6. 1996. View Article : Google Scholar : PubMed/NCBI
|
|
24
|
Neijt JP, Engelholm SA, Tuxen MK, Sorensen
PG, Hansen M, Sessa C, de Swart CA, Hirsch FR, Lund B and van
Houwelingen HC: Exploratory phase III study of paclitaxel and
cisplatin versus paclitaxel and carboplatin in advanced ovarian
cancer. J Clin Oncol. 18:3084–3092. 2000. View Article : Google Scholar : PubMed/NCBI
|
|
25
|
Xie C, Mao X, Huang J, Ding Y, Wu J, Dong
S, Kong L, Gao G, Li CY and Wei L: Kobas 2.0: A web server for
annotation and identification of enriched pathways and diseases.
Nucleic Acids Res 39 (Web Server Issue). W316–W322. 2011.
View Article : Google Scholar
|
|
26
|
Livak KJ and Schmittgen TD: Analysis of
relative gene expression data using realtime quantitative PCR and
the 2−ΔΔCT method. Methods. 25:402–408. 2001. View Article : Google Scholar : PubMed/NCBI
|
|
27
|
Kurman RJ, Carcangiu ML, Herrington CS and
Young RH: WHO Classification of Tumours of Female Reproductive
Organs. Vol 6. 4th edition. WHO Press. 2014.
|
|
28
|
Malpica A, Deavers MT, Lu K, Bodurka DC,
Atkinson EN, Gershenson DM and Silva EG: Grading ovarian serous
carcinoma using a two-tier system. Am J Surg Pathol. 28:496–504.
2004. View Article : Google Scholar : PubMed/NCBI
|
|
29
|
Alvarenga AW, Coutinho-Camillo CM,
Rodrigues BR, Rocha RM, Torres LF, Martins VR, da Cunha IW and Hajj
GN: A comparison between manual and automated evaluations of tissue
microarray patterns of protein expression. J Histochem Cytochem.
61:272–282. 2013. View Article : Google Scholar : PubMed/NCBI
|
|
30
|
Harrell FE Jr, Lee KL and Mark DB:
Tutorial in biostatistics mul-tivariable prognostic models: Issues
in developing models, evaluating assumptions and adequacy, and
measuring and re-ducing errors. Stat Med. 15:361–387. 1996.
View Article : Google Scholar : PubMed/NCBI
|
|
31
|
Ozols RF, Schwartz PE and Eifel PJ:
Relapsed ovarian cancer: Challenges and management strategies for a
chronic disease. Oncologist. 7 (Suppl 5):20–28. 2002. View Article : Google Scholar
|
|
32
|
Ahmed AA, Etemadmoghadam D, Temple J,
Lynch AG, Riad M, Sharma R, Stewart C, Fereday S, Caldas C, Defazio
A, et al: Driver mutations in TP53 are ubiquitous in high
grade serous carcinoma of the ovary. J Pathol. 221:49–56. 2010.
View Article : Google Scholar : PubMed/NCBI
|
|
33
|
Wallstrom G, Anderson KS and LaBaer J:
Biomarker discovery for heterogeneous diseases. Cancer Epidemiol
Biomarkers Prev. 22:747–755. 2013. View Article : Google Scholar : PubMed/NCBI
|
|
34
|
Hanahan D and Weinberg RA: Hallmarks of
cancer: The next generation. Cell. 144:646–674. 2011. View Article : Google Scholar : PubMed/NCBI
|
|
35
|
Petrillo M, Nero C, Amadio G, Gallo D,
Fagotti A and Scambia G: Targeting the hallmarks of ovarian cancer:
The big picture. Gynecol Oncol. 142:176–183. 2016. View Article : Google Scholar : PubMed/NCBI
|
|
36
|
Wang D and Dubois RN: Prostaglandins and
cancer. Gut. 55:115–122. 2006. View Article : Google Scholar : PubMed/NCBI
|
|
37
|
Wang MT, Honn KV and Nie D:
Cyclooxygenases, prostanoids, and tumour progression. Cancer
Metastasis Rev. 26:525–534. 2007. View Article : Google Scholar : PubMed/NCBI
|
|
38
|
Greenhough A, Smartt HJ, Moore AE, Roberts
HR, Williams AC, Paraskeva C and Kaidi A: The COX-2/PGE2 pathway:
Key roles in the hallmarks of cancer and adaptation to the tumour
microenvironment. Carcinogenesis. 30:377–386. 2009. View Article : Google Scholar : PubMed/NCBI
|
|
39
|
Kim J, Yang P, Suraokar M, Sabichi AL,
Llansa ND, Mendoza G, Subbarayan V, Logothetis CJ, Newman RA,
Lippman SM, et al: Suppression of prostate tumor cell growth by
stromal cell prostaglandin D synthase-derived products. Cancer Res.
65:6189–6198. 2005. View Article : Google Scholar : PubMed/NCBI
|
|
40
|
Kinzler KW and Vogelstein B: Landscaping
the cancer terrain. Science. 280:1036–1037. 1998. View Article : Google Scholar : PubMed/NCBI
|
|
41
|
Issemann I and Green S: Activation of a
member of the steroid hormone receptor superfamily by peroxisome
proliferators. Nature. 347:645–650. 1990. View Article : Google Scholar : PubMed/NCBI
|
|
42
|
Rossi A, Kapahi P, Natoli G, Takahashi T,
Chen Y, Karin M and Santoro MG: Anti-inflammatory cyclopentenone
prostaglandins are direct inhibitors of IkappaB kinase. Nature.
403:103–108. 2000. View
Article : Google Scholar : PubMed/NCBI
|
|
43
|
Wang C, Fu M, D'Amico M, Albanese C, Zhou
JN, Brownlee M, Lisanti MP, Chatterjee VK, Lazar MA and Pestell RG:
Inhibition of cellular proliferation through IkappaB
kinase-independent and peroxisome proliferator-activated receptor
gamma-dependent repression of cyclin D1. Mol Cell Biol.
21:3057–3070. 2001. View Article : Google Scholar : PubMed/NCBI
|
|
44
|
Su B, Guan M, Zhao R and Lu Y: Expression
of prostaglandin D synthase in ovarian cancer. Clin Chem Lab Med.
39:1198–1203. 2001. View Article : Google Scholar : PubMed/NCBI
|
|
45
|
Bachvarov D, L'esperance S, Popa I,
Bachvarova M, Plante M and Têtu B: Gene expression patterns of
chemoresistant and chemosensitive serous epithelial ovarian tumors
with possible predictive value in response to initial chemotherapy.
Int J Oncol. 29:919–933. 2006.PubMed/NCBI
|
|
46
|
Vogel C and Marcotte EM: Insights into the
regulation of protein abundance from proteomic and transcriptomic
analyses. Nat Rev Genet. 13:227–232. 2012. View Article : Google Scholar : PubMed/NCBI
|
|
47
|
Yu ZW, Zhong LP, Ji T, Zhang P, Chen WT
and Zhang CP: MicroRNAs contribute to the chemoresistance of
cisplatin in tongue squamous cell carcinoma lines. Oral Oncol.
46:317–322. 2010. View Article : Google Scholar : PubMed/NCBI
|
|
48
|
de Jong E, Winkel P, Poelstra K and
Prakash J: Anticancer effects of 15d-prostaglandin-J2 in
wild-type and doxorubicin-resistant ovarian cancer cells: Novel
actions on SIRT1 and HDAC. PLoS One. 6:e251922011. View Article : Google Scholar : PubMed/NCBI
|
|
49
|
Goossens N, Nakagawa S, Sun X and Hoshida
Y: Cancer biomarker discovery and validation. Transl Cancer Res.
4:256–269. 2015.PubMed/NCBI
|