Introduction
Renal cell carcinoma (RCC) is one of the most common
urologic cancer types. Its incidence rate is 2–3% of adult
malignant tumor cases (1). Clear
cell RCC (ccRCC) is the main subtype of RCC, and ~30% of patients
with ccRCC have distal metastasis at the time of diagnosis
(2,3). Additionally, 20–40% of patients will
suffer from local recurrence or distant metastasis following
resection (2,3). Therefore, investigating the molecular
mechanism is important for this deadly disease. Identifying novel
genes as diagnostic and therapeutic targets is beneficial for the
diagnosis of the disease and provides more options for
treatment.
Basic helix-loop-helix family member e41 (BHLHE41)
is a member of the BHLH family proteins that are involved in
differentiation, circadian rhythms and the response to hypoxia
(4–6). Previous studies demonstrated that
BHLHE41 serves a different role in tumors. BHLHE41 inhibits tumor
proliferation and metastasis in pancreatic (7) and gastric cancer (8). However, BHLHE41 is associated with
hypoxia inducible factor-1 (HIF-1) activation and promotes tumor
invasion in osteosarcoma (9).
BHLHE41 expression antagonizes paclitaxel-induced cell apoptosis in
human prostate cancer cells (10).
The roles of BHLHE41 in ccRCC cell proliferation and
migration have rarely been reported. In the present study, the
expression of BHLHE41 in ccRCC tissues, the tumor-promoting effects
of BHLHE41 in ccRCC cell lines A498 and CAKI-1, and the DNA
methylation level of the gene were examined.
Materials and methods
Clinical specimens
A total of 50 ccRCC tissues and their matched normal
adjacent tissues (>2 cm from the edge of the cancer tissue) were
obtained from Fuzhou General Hospital (Fuzhou, Fujian) from
November 2013 to November 2015. The separation and use of human
tissues was approved by the Human Research Ethics Review Committee
of Fuzhou General Hospital (approval no. 2013-017). Patients ranged
in age from 28–77 years with the mean age of 55.5 years. All
patients provided written informed consent. These patients were
staged according to the Tumor-Node-Metastasis classification system
of malignant tumors (7th) (11).
Table I presents the patient's
details.
 | Table I.List of 50 clear cell renal cell
carcinoma tissues. |
Table I.
List of 50 clear cell renal cell
carcinoma tissues.
|
Characteristics | n (%) |
|---|
| Sex |
|
|
Male | 35 (70) |
|
Female | 15 (30) |
| Age at surgery |
|
|
<60 | 30 (60) |
|
≥60 | 20 (40) |
| Tumor
extenta |
|
| T1 | 41 (82) |
| T2 | 7 (14) |
| T3 | 2 (4) |
| T4 | 0 (0) |
| Lymph node
metastasisa |
|
| N0 | 48 (96) |
|
≥N1 | 2 (4) |
| Distant metastasis
a |
|
| M0 | 48 (96) |
| M1 | 2 (4) |
| Tumor max diameter
(cm)a |
|
|
<7 | 41 (82) |
| ≥7 | 9 (18) |
| Fuhrman
gradeb |
|
| G1 | 16 (32) |
| G2 | 33 (66) |
| G3 | 1 (2) |
| G4 | 0 (0) |
Cell lines
A498 cells were obtained from the Shanghai Cell Bank
of the Chinese Academy of Sciences (Shanghai, China); CAKI-1 cells
were obtained from Shanghai GeneChem Co., Ltd. (Shanghai, China).
A498 cells are Von Hippel-Lindau tumor suppressor (VHL) mutant
cells and CAKI cells are VHL wild-type cells (12). The cell lines used were all
identified using short tandem repeat markers. A498 and CAKI-1 cells
were maintained at 37°C and 5% CO2 in RPMI-1640 medium
(Thermo Fisher Scientific, Inc., Waltham, MA, USA) supplemented
with 10% fetal bovine serum (Thermo Fisher Scientific Inc.), and 1%
penicillin/streptomycin (Thermo Fisher Scientific, Inc.).
Analysis of gene expression omnibus (GEO) and the
cancer genome atlas (TCGA) data of ccRCC. Oncomine (http://www.oncomine.org) was used to select highly
expressed genes in Beroukhim Renal_GSE14994 (13), Grumz Renal_GSE6344 (14), Jones Renal_GSE15641 (15) and Lenburg Renal_GSE781 (16). Gene expression microarray datasets
(GSE53757) (17) were analyzed and
normalized by GEODiver (http://www.geodiver.co.uk). The primary dataset was
downloaded from the NCBI GEO database (http://ncbi.nlm.nig.gov/geo) (18). Kidney Renal Clear Cell Carcinoma
(KIRC) mRNA expression and clinical data was downloaded from TCGA
(http://cancergenome.nig.gov) (19). The transcriptome profiling data
files for analysis were normalized and transferred into a txt file
using a Perl script. Subsequently, the package edgeR of
Bioconductor was used in RStudio (version 3.5.0; http://www.rstudio.com/) to screen out the
differentially-expressed genes (DEGs) with a fold change >2,
P< 0.01 and a false discovery rate value <0.01, which were
considered statistically significant (20). Relative gene expression of BHLHE41
was reflected by the intensity of the probe signal and plotted
using GraphPad Prism 6 software (GraphPad Software, Inc., La Jolla,
CA, USA). Kaplan-Meier survival curves were generated by Oncolnc
(http://www.oncolnc.org/) for patients with ccRCC
entered in TCGA database.
TCGA methylation analysis
Methylation data (Illumina Infinium Human
Methylation 450 K) (21), which
included 325 ccRCC tumor samples and 160 normal samples, were
downloaded from TCGA data portal in April 2018. Samples with
expression and methylation data were screened. Individual gene
methylation was extracted from the fasta file using a custom Perl
script. The correlation between DNA methylation/loci methylation
level and BHLHE41 gene expression was investigated with Spearman's
test.
Reverse transcription-quantitative
polymerase chain reaction (RT-qPCR)
Total RNA Kit II Kit (Omega Bio-Tek, Inc., Norcross,
GA, USA) was used to extract RNA from tissues. Subsequently, 3 µg
total RNA was reverse transcribed into cDNA using a RevertAid First
Strand cDNA Synthesis kit (Fermentas; Thermo Fisher Scientific,
Inc.). SYBR-Green select Master Mix (Applied Biosystems; Thermo
Fisher Scientific, Inc.) was used to qPCR. cDNA was subjected to
RT-qPCR with BHLHE41 and β-actin primers. BHLHE41 upstream primer,
5′-AAGGAGCATGAAACGAGACGA-3′, and downstream primer,
5′-CTCGGTTAAGGCGGTTAAAGC-3′. β-actin upstream primer,
5′-TGACGTGGACATCCGCAAAG-3′, and downstream primer,
5′-CTGGAAGGTGGACAGCGAGG-3′. PCR was conducted for 40 cycles with 20
pmol primers under the following conditions: 94°C for 30 sec, 56°C
for 30 sec and 72°C for 30 sec. Relative fold changes in mRNA
expression were calculated by normalization to β-actin mRNA using
the formula 2−∆∆Cq (22).
Western blot analysis
Tissue samples, and A498 and CAKI-1 cell extracts
were prepared by a Protein Extraction reagent (cat. no. P0013;
Beyotime Institute of Biotechnology, Haimen, China). A
Bicinchoninic acid protein assay kit (Pierce; Thermo Fisher
Scientific, Inc.) was used to quantify total protein. A total of 15
µg protein from each sample were separated on 10% SDS-PAGE and then
transferred onto polyvinylidene fluoride (PVDF) membranes
(Immobilon-P PVDF Membrane; EMD Millipore, Billerica, MA, USA).
Membranes were blocked with 5% non-fat milk at room temperature for
1 h, and then incubated with primary antibodies (BHLHE41, p-AKT,
AKT, p-p70S6K, p70S6K, β-catenin, E-cadherin and ACTIN) overnight
at 4°C. Subsequently, membranes were incubated with HRP-conjugated
secondary IgG antibodies (anti-rabbit IgG, cat. no. 7074; and
anti-mouse IgG, cat. no. 7076) (both 1:1,000; Cell Signaling
Technology, Inc., Danvers, MA, USA) at room temperature for 1 h.
Proteins were detected using a SuperSignal West Pico
chemiluminescent kit (Pierce; Thermo Fisher Scientific, Inc.).
BHLHE41 antibody (cat. no. ab190093; 1:1,000) was purchased from
Abcam (Cambridge, UK). phospho (p)-AKT (cat. no. 9271; 1:1,000),
AKT (cat. no. 9272; 1:1,000), p-p70S6K (cat. no. 9234; 1:1,000),
p70S6K (cat. no. 2708; 1:1,000), β-catenin (cat. no. 8480; 1:1,000)
and E-cadherin (cat. no. 3195; 1:1,000) antibodies were purchased
from Cell Signaling Technology Inc. β-actin antibody (cat. no.
A2228; 1:5,000) was purchased from Sigma-Aldrich (Merck KGaA,
Darmstadt, Germany).
Lentivirus production
BHLHE41 short hairpin RNA (shRNA;
pLKO.1-BHLHE41-shRNA, TRCN0000016946) and non-targeting control
SHCOO2 (shRNA-NC) vector were purchased from Sigma-Aldrich (Merck
KGaA). For virus packaging, 3 µg non-targeting sequence control or
BHLHE41 shRNA constructs were co-transfected with 1 µg pMD2.G and 2
µg psPax2 into 293T cells using Lipofectamine® 2000
(Invitrogen; Thermo Fisher Scientific, Inc.). A498 and CAKI-1 cells
were infected with virus media. The media was changed after 48 h
and RPMI-1640 medium supplemented with 10% fetal bovine serum and
1% penicillin/streptomycin containing 1 µg/ml puromycin was added
at 37°C for 10 days. Subsequently, the stably transfected cells
were obtained. Inhibition efficiency of gene expression detected by
RT-qPCR (data not shown) and verified with a western blot assay as
previously described.
WST-1 for cell proliferation
assay
Selected transgenic A498 and CAKI-1 cell
proliferation was measured using a WST-1 assay kit (Roche
Diagnostics GmbH, Mannheim, Germany). At 24, 48, 72 and 96 h after
cell plating at 37°C, 10% WST-1 solution was added to adherent
cells, and then incubated at 37°C for 45 min. The coloration of the
solution was measured at 450 nm using a microplate reader.
BrdU staining
Selected transgenic A498 and CAKI-1 cells were
seeded in a 24-well plate at 5×10³ cells/cm2,
and then cultured with RPMI-1640 medium supplemented with 10% fetal
bovine serum and 1% penicillin/streptomycin at 37°C for 1 day, the
cells were pulsed with 10 µM BrdU at 37°C for 1 h and fixed in 4%
polyparaformaldehyde at room temperature for 15 min. Fixed cells
were labeled with anti-BrdU antibody (cat. no. 5292; 1:100; Cell
Signaling Technology, Inc.) at 4°C overnight, and then washed 3
times. Subsequently, the cells were treated with anti-mouse
Alexa-488 (cat. no. 715-545-450; 1:100; Jackson ImmunoResearch
Laboratories, Inc., West Grove, PA, USA) at 37°C for 30 min, and
counterstained with DAPI (Sigma-Aldrich; Merck KGaA) at room
temperature for 5 min. Photomicrographs were captured using an
epifluorescence microscope (X81; Olympus Corporation, Tokyo, Japan;
×100).
Transwell migration assay
Selected transgenic A498 and CAKI-1 cells were
harvested for migration assays in 24-well plates with 8-µm pore
size Transwell microporous membranes (EMD Millipore). Subsequently,
200 µl of the A498 and CAKI-1 cell suspension (containing 3×10⁴
cells) was seeded in the upper chamber with serum-free RPMI-1640
medium, and the lower chamber was supplemented with 10% fetal
bovine serum with 500 µl RPMI-1640 medium. After incubating for 36
h at 37°C in a 5% CO2 atmosphere, the cells were washed
with PBS 3 times and fixed in 4% paraformaldehyde at room
temperature for 15 min. The cells on the upper surface of the
membrane were then removed with a cotton swab, and the migrating
cells on the bottom surface were stained with 0.5% crystal violet
at room temperature for 4 h. The number of cells in 5 random fields
was counted under an epifluorescence microscope (X81; Olympus
Corporation; ×100) and the mean was recorded.
Statistical processing
Data were collected from at least three technical
replicates and expressed as the mean ± standard deviation.
Statistical analyses of transcriptome profiling data results were
performed in RStudio (version 3.5.0) software. Statistical
differences between the groups were analyzed with the unpaired
Student's t-test or one-way analysis of variance with the
Bonferroni correction for multiple comparisons. All the data were
graphically displayed using GraphPad Prism 6 software. P<0.05
was considered to indicate a statistically significant difference.
Kaplan-Meier analysis of overall survival for patient's estimates
based on all available data and compared with the log-rank
test.
Results
BHLHE41 expression in GEO data
To search for ccRCC oncogenes, data mining was
performed on the Oncomine database and 4 datasets were selected,
which were analyzed using Affymetrix genome array (Human Genome
U133A Array) (the detection method of the reference data). BHLHE41
was determined to be one of the highly DEGs (Fig. 1A). Fig.
1B depicts that BHLHE41 was the only overlapping gene among all
of the 4 datasets. BHLHE41 is highly expressed in human ccRCC
samples, compared with adjacent normal renal tissues (Fig. 1C) (Beroukhim Renal non-hereditary
and hereditary ccRCC, n=59, fold change=19.414, P<0.001; Grumz
Renal ccRCC, n=10, fold change=1.47, P<0.001; Jones Renal ccRCC,
n=32, fold change=1.91, P<0.001; and Lenburg Renal ccRCC, n=12,
fold change=1.32, P<0.001).
Subsequently, analysis of BHLHE41 expression from a
large cohort ccRCC dataset (GSE53757, 72 pairs, HG-U133 Plus_2
array) was performed. BHLHE41 is one of the DEGs between ccRCC and
their adjacent tissues (Fig. 2A and
B). It was enhanced significantly in ccRCC tissues
(P<0.0001), as demonstrated by paired Student's t-test analysis
(Fig. 2C).
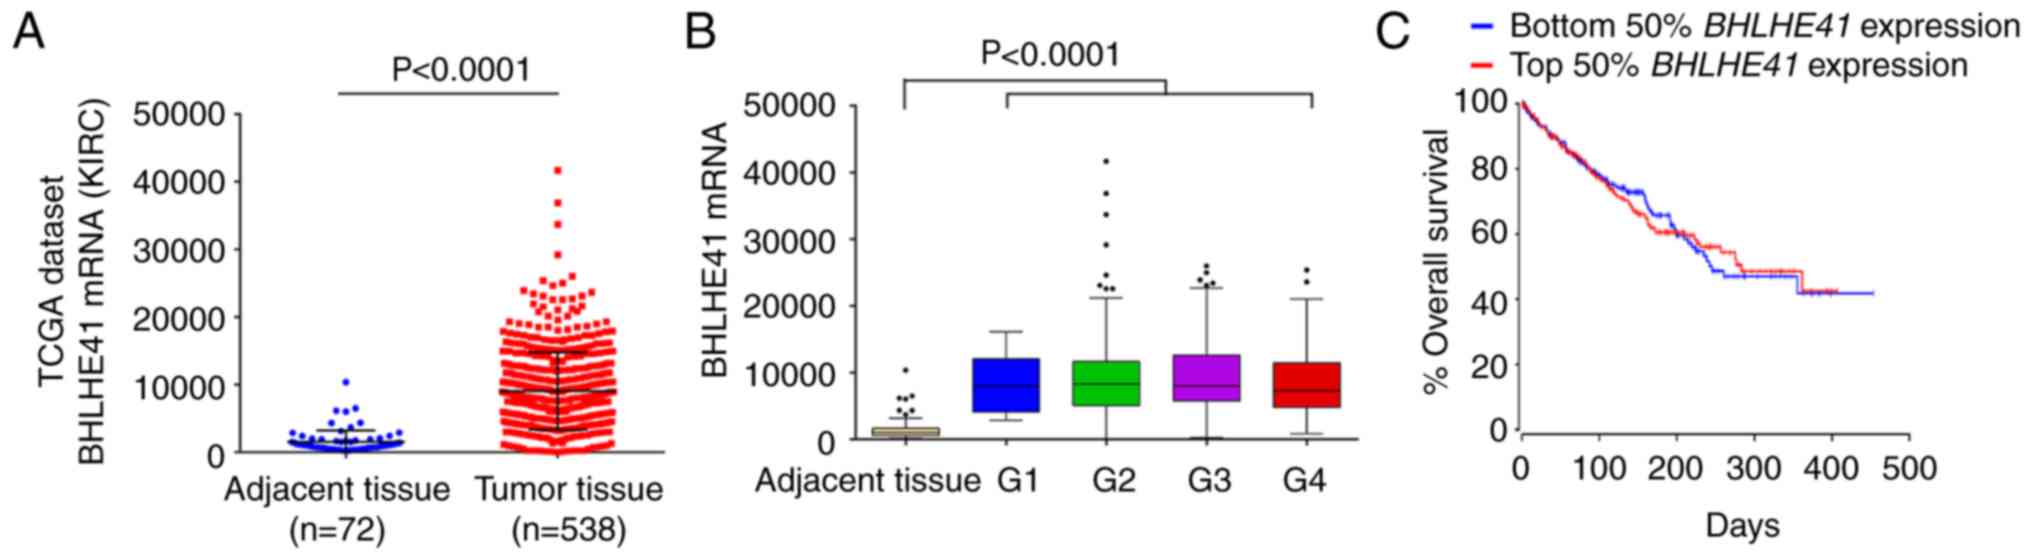
BHLHE41 expression in TCGA Data
To further investigate the role of BHLHE41 in ccRCC,
the expression of BHLHE41 was analyzed using TCGA's ccRCC (KIRC)
RNA-seq data (21). The analysis
results demonstrated that BHLHE41 was overexpressed in tumor
tissues (P<0.0001; Fig. 3A).
However, there were no significant differences among the various
pathological grades (Fig. 3B) and
high expression of BHLHE41 was not significantly associated with
the overall survival rate in patients with ccRCC (Fig. 3C).
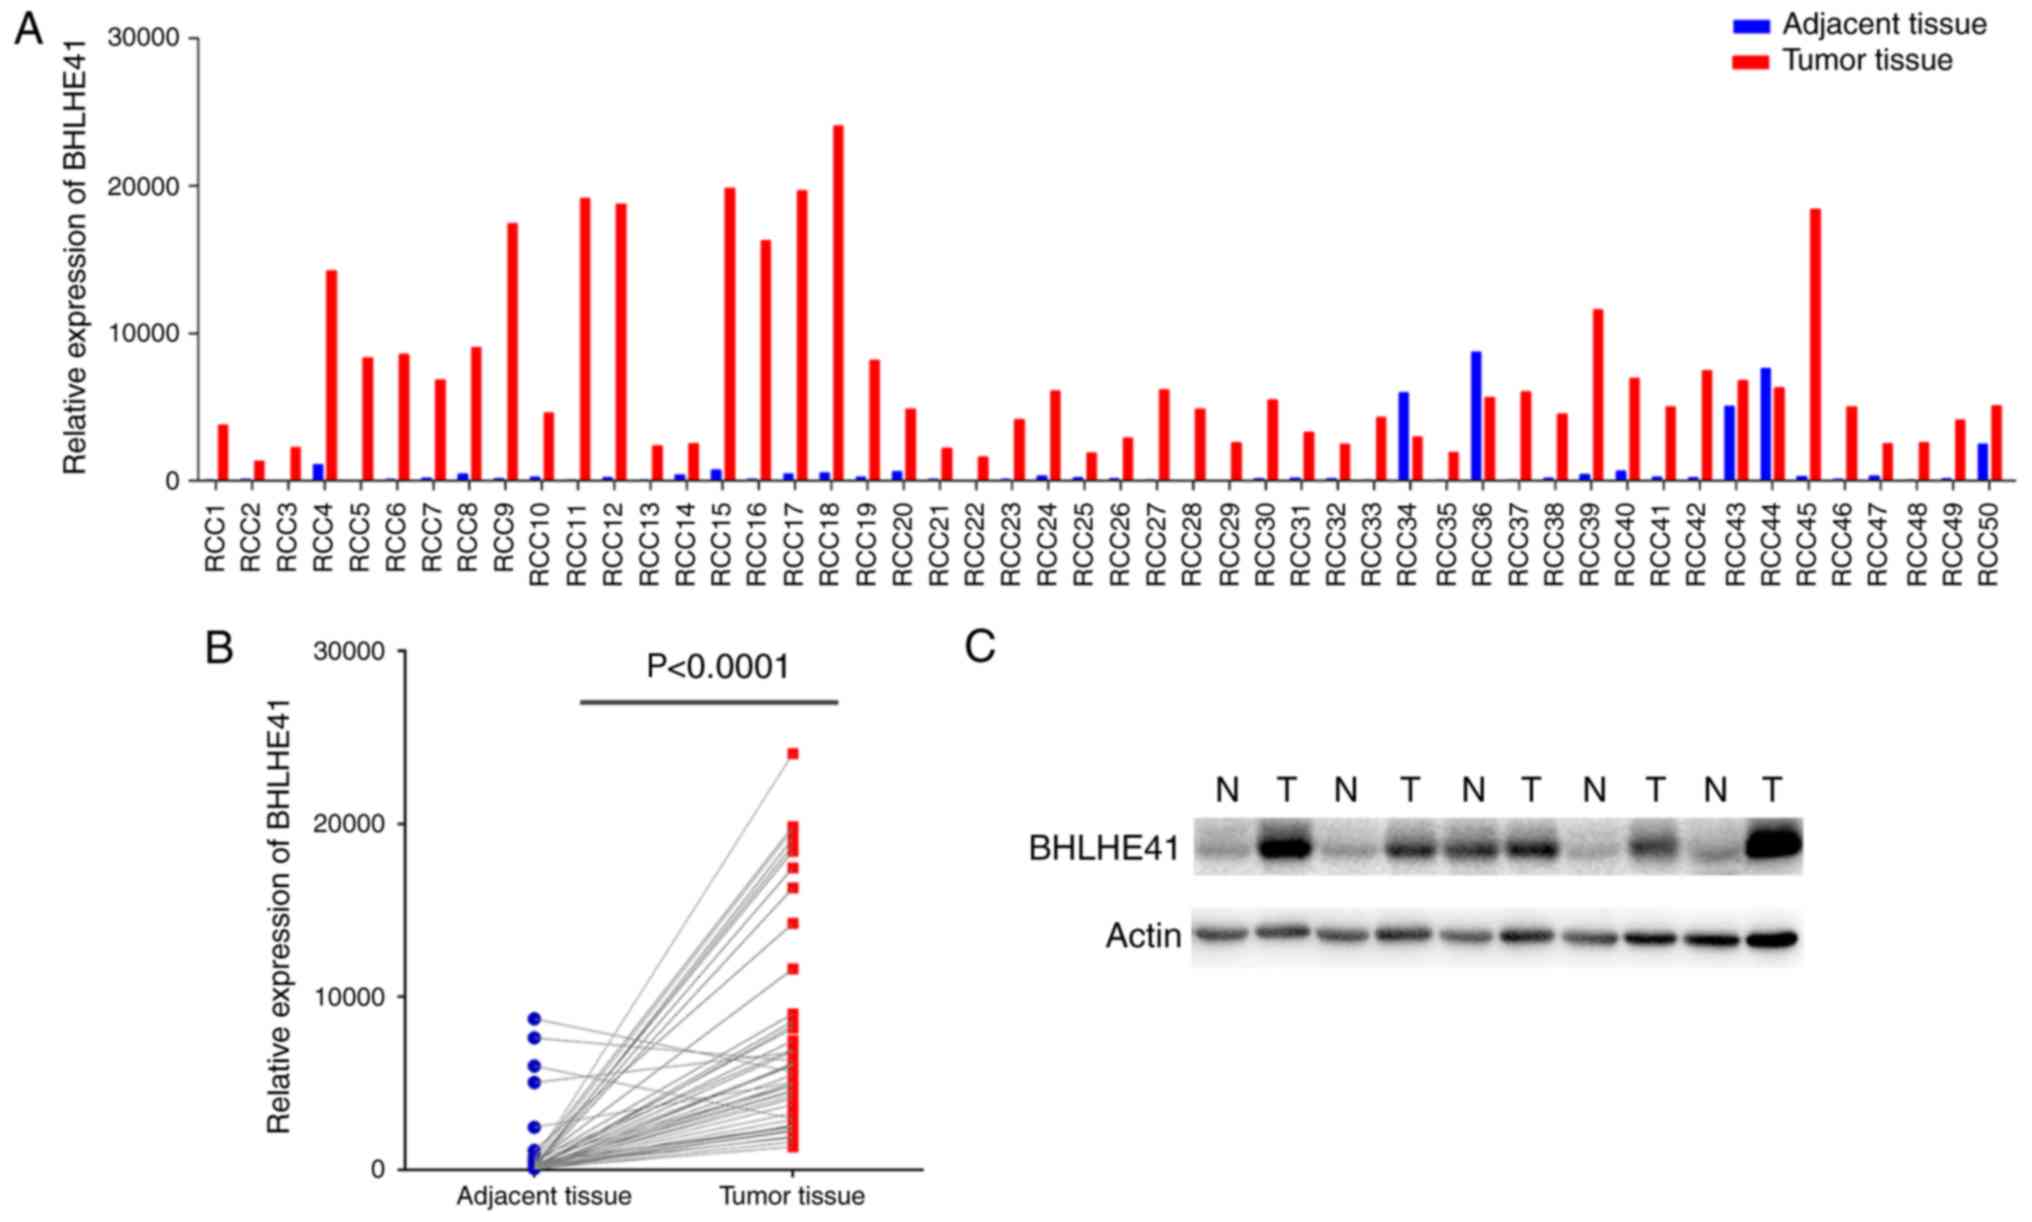
BHLHE41 expression in fresh ccRCC
tissues
A total of 50 pairs of pathology confirmed and
surgically removed ccRCC tissues, and their adjacent tissues, were
collected at the Fuzhou General Hospital. The RT-qPCR data
demonstrated that BHLHE41 was highly expressed in 94% of tumor
tissues (Fig. 4A). Paired Student's
t-test analysis revealed that BHLHE41 mRNA levels were
significantly elevated in ccRCC tissues (P<0.0001; Fig. 4B). Subsequently, 5 pairs of samples
were detected by western blot analysis. Fig. 4C indicates that the BHLHE41 protein
level was increased in tumor tissues. For the samples collected,
information on pathological Fuhrman grades (23), with the grades primarily being G1
and G2, was obtained, but there was no patient survival
information. Therefore, an association between BHLHE41 expression
and tumors was produced, but its association with tumor grade and
patient survival was not analyzed.
BHLHE41 knockdown impairs ccRCC cell
proliferation and migration
BHLHE41 was stably knocked down in A498 and CAKI-1
cells using a BHLHE41 shRNA (shRNA-BHLHE41) or a scrambled control
(shRNA-NC) to evaluate their proliferation and migration. Using
WST-1 assays, it was observed that the knockdown of BHLHE41 in A498
and CAKI-1 cells significantly suppressed cell proliferation at 48,
72 and 96 h detection time points (Fig.
5A and B). The BrdU assay demonstrated that BHLHE41-knockdown
cells proliferation rate was significantly reduced in both cell
lines (Fig. 5C and D).
BHLHE41-knockdown cell colonies were reduced, compared with
shRNA-NC cells, in the ccRCC cell lines (Fig. 5E and F). Subsequently, a Transwell
chamber assay was used to assess the effect of BHLHE41 on cell
migration. Cell migration was significantly decreased in
BHLHE41-knockdown A498 and CAKI-1 cells, compared with their
control cells (Fig. 5G). These data
indicate that BHLHE41 acts as a novel tumor-promoting molecule
regulating ccRCC growth.
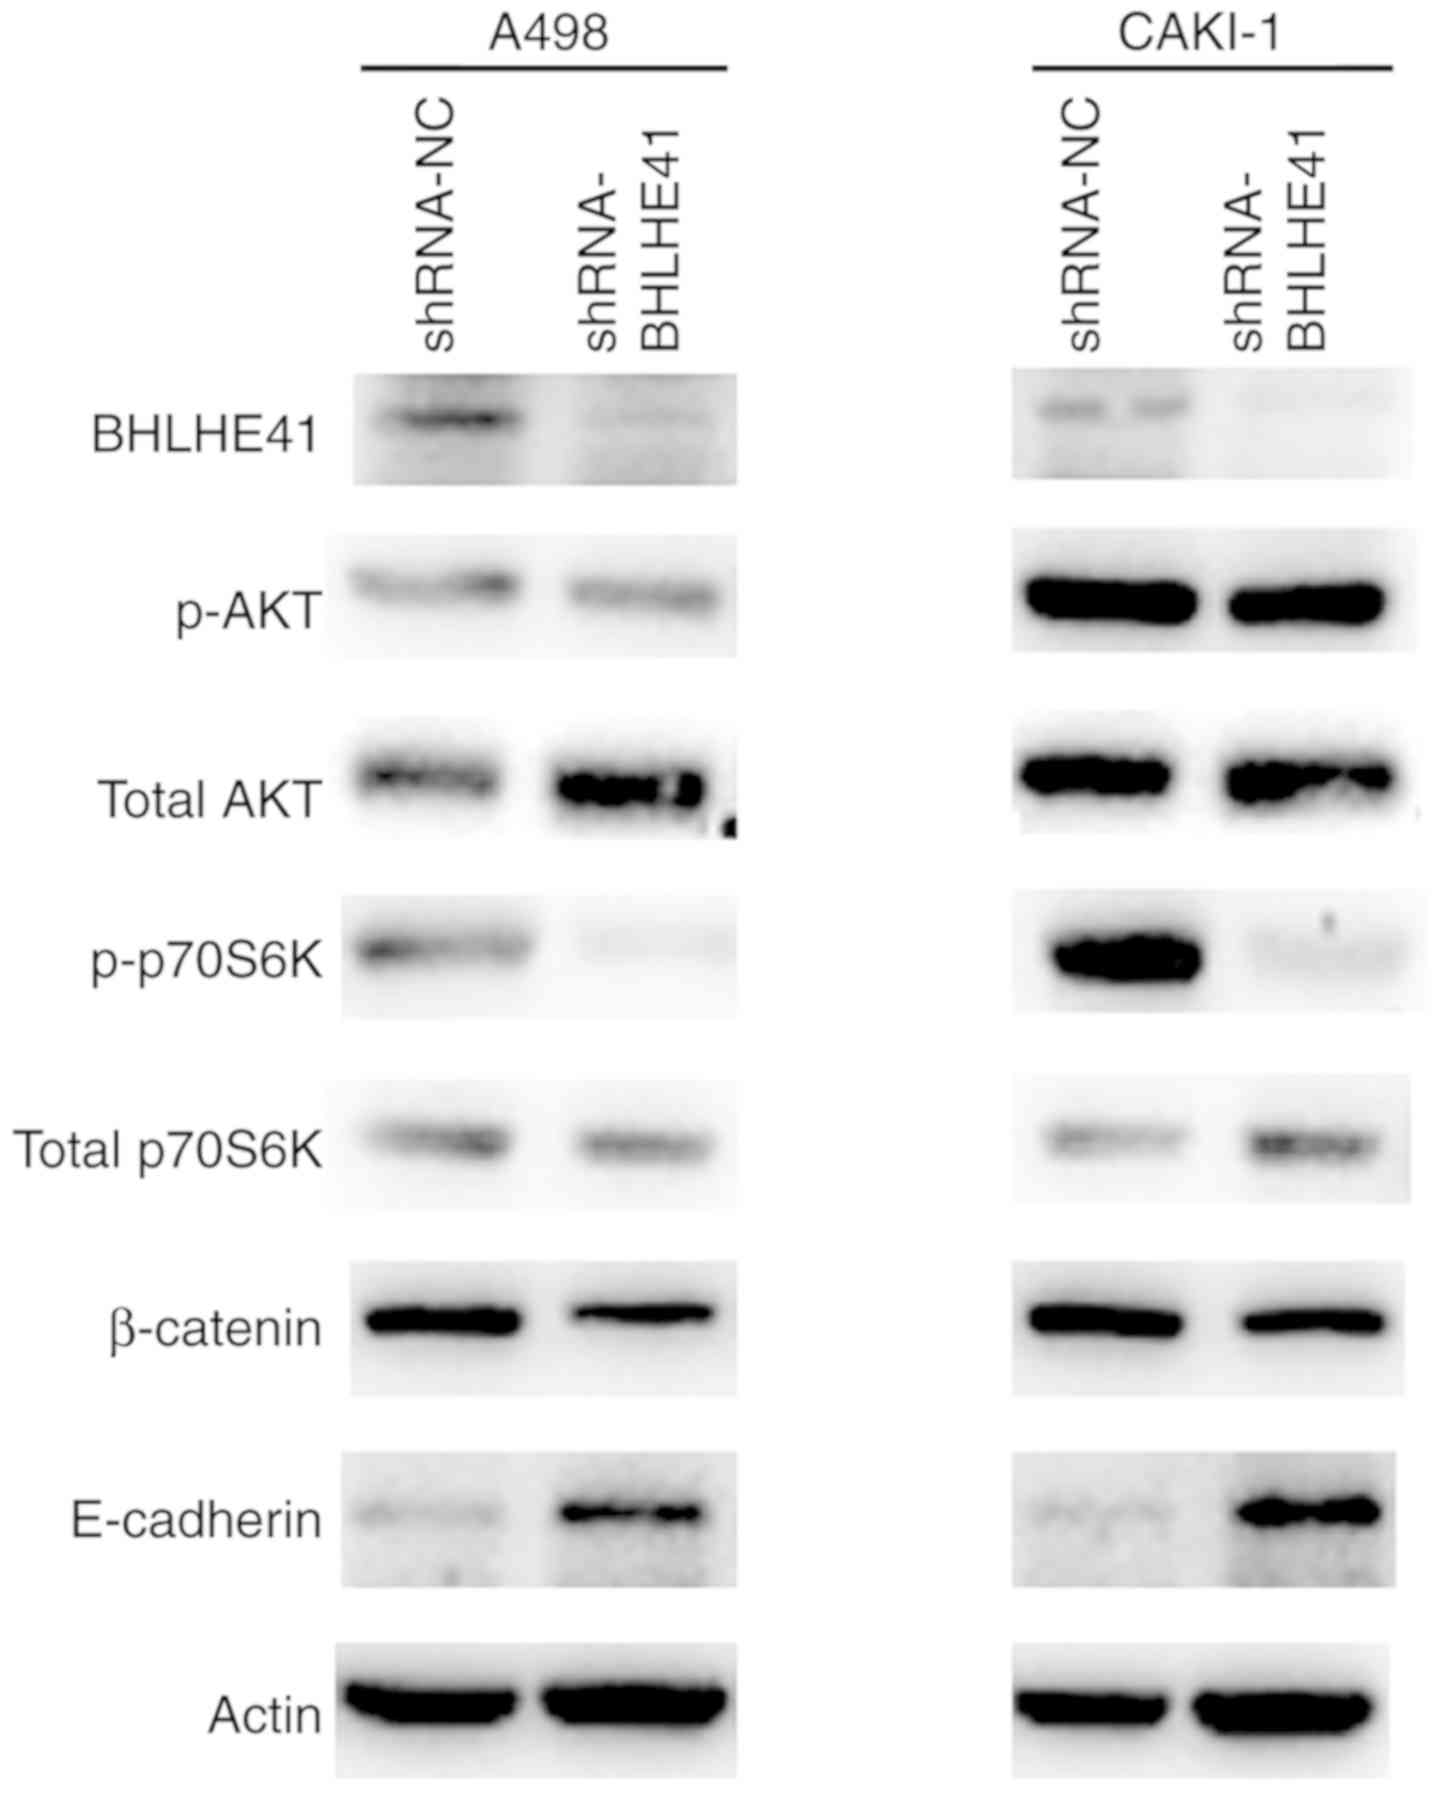
BHLHE41 ablation impairs signaling
pathways associated with tumor progression in ccRCC cells
Since mechanistic target of rapamycin kinase (mTOR),
AKT and epithelial-mesenchymal transition (EMT) signaling pathways
are common tumorigenic pathways (24,25),
to further determine the mechanism by which BHLHE41 drives the
ccRCC tumorigenesis, western blot analyses was performed with a
number of marker genes of mTOR, AKT and EMT signaling pathways.
p70S6K activity was significantly reduced in BHLHE41 knockdown A498
and CAKI-1 cells. p-AKT levels were incomparable between the
BHLHE41 knockdown and control cells. BHLHE41-knockdown cells and
shRNA-NC cells exhibited relative high expression levels of
E-cadherin protein in A498 and CAKI-1. There was no detected change
in the amount of β-catenin (Fig.
6). These data indicated that the p-p70S6K and E-cadherin
expression levels, which are involved in the mTOR and EMT pathways
(26,27) respectively, were coordinated by
BHLHE41.
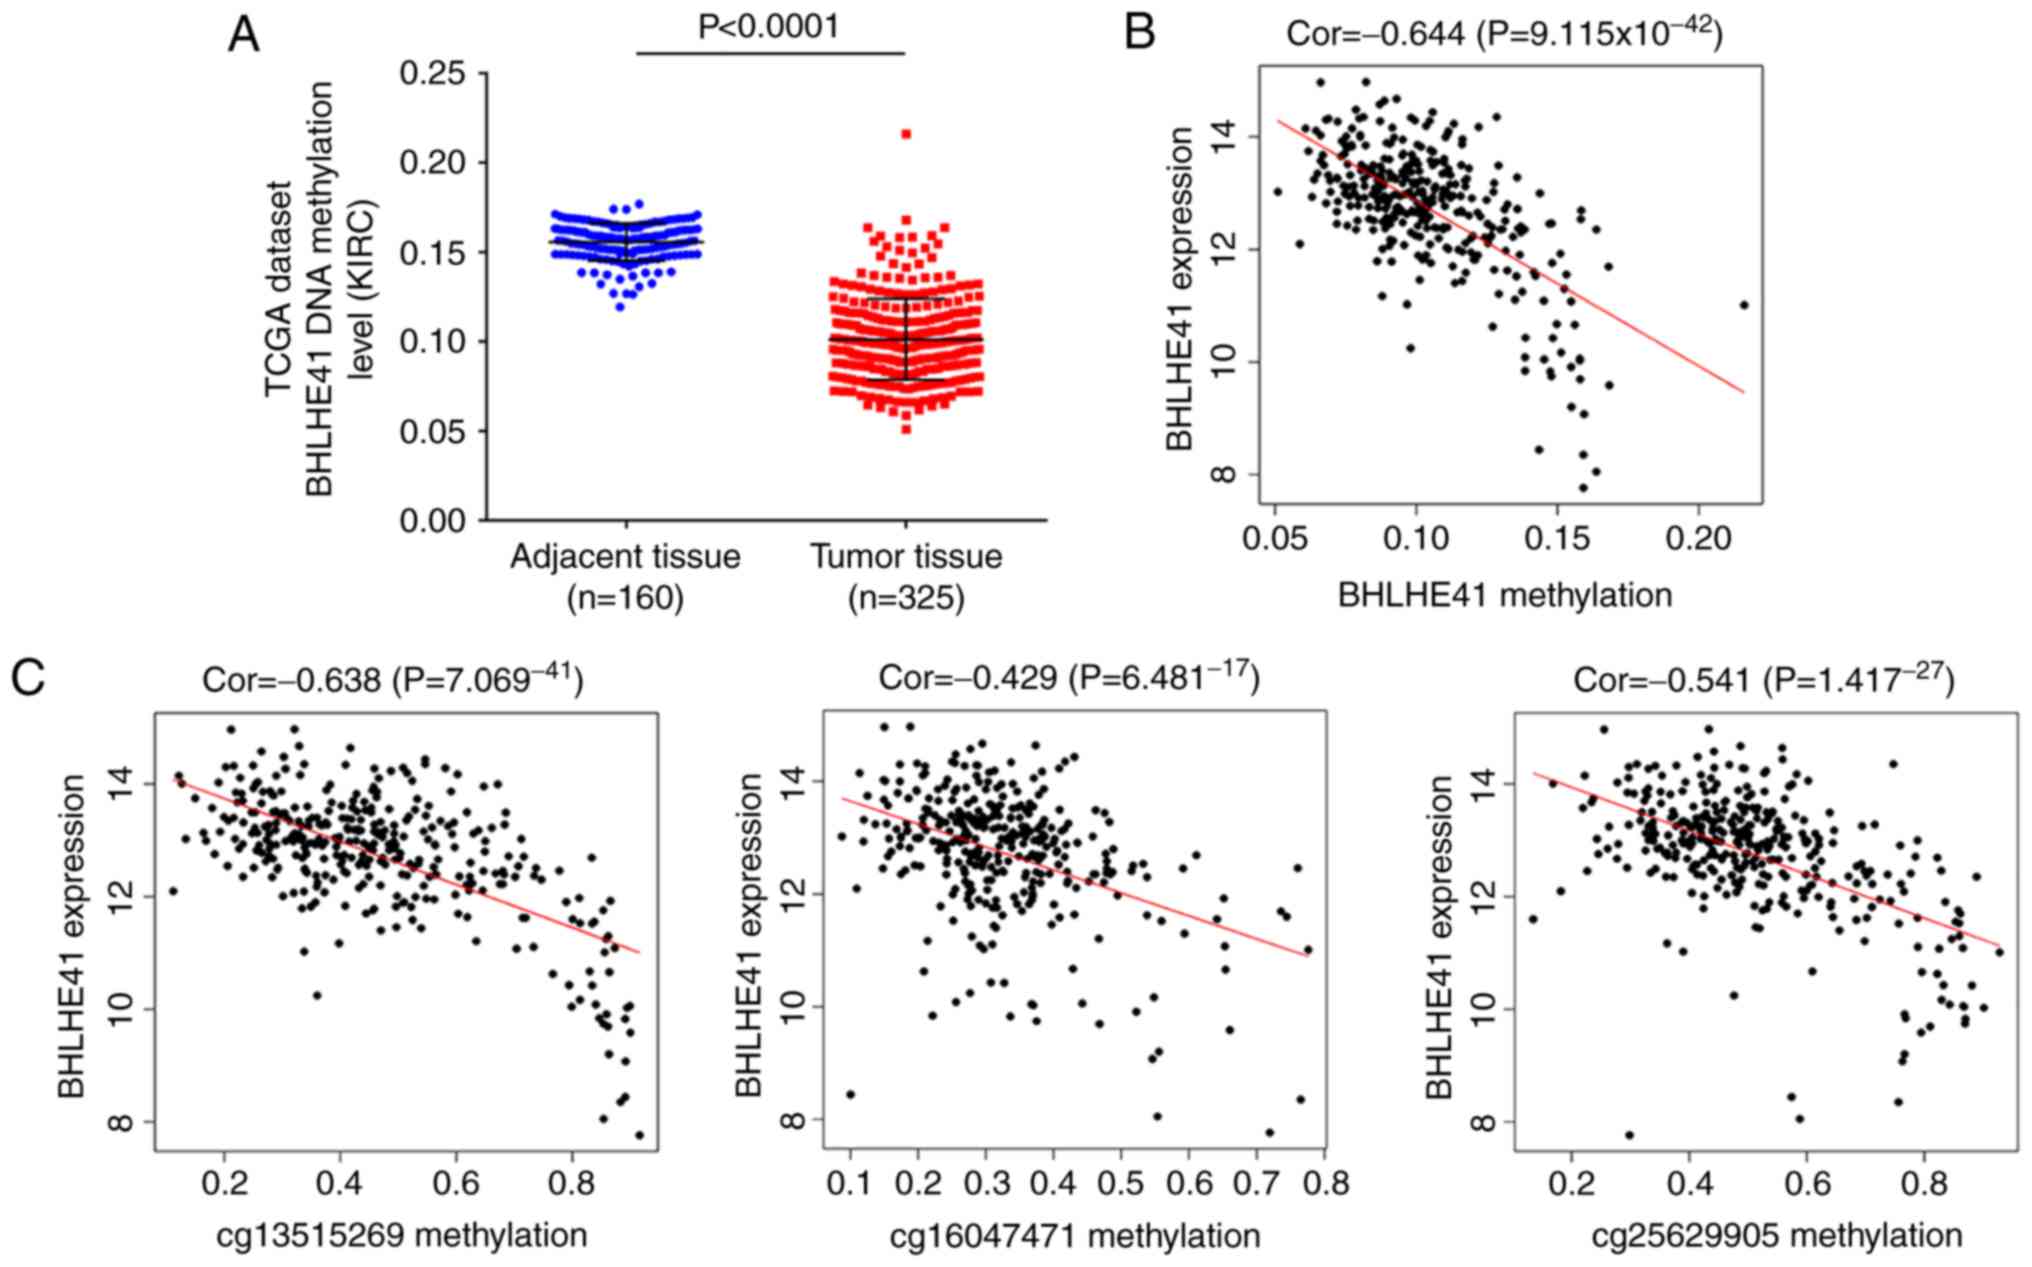
BHLHE41 3′untranslated region (UTR)
hypomethylation in patients with ccRCC in TCGA
The expression of BHLHE41 has been reported to be
regulated by HIF-1α (9). To further
investigate potential mechanisms underlying the transcriptional
enrichment of BHLHE41, DNA methylation levels and their association
between copy number changes were analyzed in TCGA ccRCC samples in
the present study. The analysis data demonstrated reduced DNA
methylation of BHLHE41 in tumor samples (Fig. 7A; P<0.0001). Potential
correlation between methylation and BHLHE41 gene expression was
statistically significant (cor=−0.644, P=9.115×10−42;
Fig. 7B). These results
demonstrated that methylation changes are associated with BHLHE41
expression.
A total of 17 probes of BHLHE41 were included in
further analysis, and 5 loci were determined to be significantly
reduced in tumor samples (Table
II). It was observed that the correlations between expression
and methylation of 3 loci (cg13515269, cg16047471 and cg25629905)
within the 3′UTR region were statistically significant (cor=−0.638
and P=7.069 ×10−41; cor=−0.429 an
P=6.481×10⁻¹⁷; and cor=−0.541 and
P=1.417×10⁻²⁷, respectively; Fig. 7C). These data indicated that
increased BHLHE41 expression in ccRCC samples is associated with
methylation level in the 3′UTR region.
| Table II.A total of 16 probes of BHLHE41
details in a dataset (21). |
Table II.
A total of 16 probes of BHLHE41
details in a dataset (21).
| Address ID | Strand | UCSC RefGene
name | UCSC RefGene
accession | UCSC RefGene
group | Normal mean | Tumor mean | Fold change | P-value |
|---|
| cg02429656 | F | BHLHE41 | NM_030762 | Body | 0.012550 | 0.015537 | 1.237957 |
8.54×10⁻³ |
| cg03046445 | R | BHLHE41 | NM_030762 | 1stExon; 5′UTR | 0.056084 | 0.052514 | 0.936354 |
6.05×10⁻² |
| cg05232853 | F | BHLHE41 | NM_030762 | Body | 0.075172 | 0.057177 | 0.760606 |
1.29×10⁻²² |
| cg05568797 | R | BHLHE41 | NM_030762 | Body | 0.035181 | 0.030349 | 0.862645 |
2.46×10⁻¹³ |
| cg08715914 | F | BHLHE41 | NM_030762 | TSS200 | 0.086382 | 0.091126 | 1.054917 |
6.15×10−05 |
| cg10049913 | R | BHLHE41 | NM_030762 | Body | 0.0228960 | 0.026840 | 1.172247 |
2.91×10−07 |
| cg10447982 | R | BHLHE41 | NM_030762 | TSS1500 | 0.013739 | 0.014931 | 1.086779 |
1.32×10−09 |
| cg13089947 | F | BHLHE41 | NM_030762 | 1stExon; 5′UTR | 0.035810 | 0.040915 | 1.142558 |
2.11×10−07 |
| cg13515269 | R | BHLHE41 | NM_030762 | 3′UTR | 0.818265 | 0.438801 | 0.536258 |
6.3×10−139 |
| cg15117548 | R | BHLHE41 | NM_030762 | TSS1500 | 0.022337 | 0.024664 | 1.104164 |
1.72×10−08 |
| cg15398617 | R | BHLHE41 | NM_030762 | 1stExon | 0.036305 | 0.036730 | 1.011723 | 8.08
×10−1 |
| cg16047471 | R | BHLHE41 | NM_030762 | 3′UTR | 0.510720 | 0.323131 | 0.632697 |
2.65×10−47 |
| cg16739118 | R | BHLHE41 | NM_030762 | Body | 0.013970 | 0.015794 | 1.130527 |
6.49×10⁻¹⁶ |
| cg19243777 | F | BHLHE41 | NM_030762 | TSS1500 | 0.036049 | 0.037575 | 1.042343 |
9.37×10⁻² |
| cg21335266 | R | BHLHE41 | NM_030762 | TSS1500 | 0.010229 | 0.013838 | 1.35275 |
4.12×10⁻² |
| cg25629905 | F | BHLHE41 | NM_030762 | 3′UTR | 0.817583 | 0.490316 | 0.599714 |
2.90×10−146 |
Discussion
BHLHE41, a member of circadian clock genes, is
involved in the regulation of biological circadian rhythms
(28). Disruption of circadian
rhythms results in sleep disturbance and the progression of cancer
(29,30). Therefore, the biological effects of
BHLHE41 are not limited to the regulation of biological rhythms.
BHLHE41 is involved in regulating the cellular immune (31) and hypoxia responses (32,33).
In the present study, it was determined that BHLHE41 expression was
elevated in the GSE53757 dataset and in TCGA ccRCC (KIRC). Despite
the lack of analysis of the association between BHLHE41 expression
and clinicopathological parameters in a large number of samples, an
elevated gene expression was demonstrated in 50 pairs of fresh
ccRCC tissues. BHLHE41 was knocked down in ccRCC cell lines (A498
and CAKI-1) through shRNA lentivirus infection. WST-1 and BrdU
assays indicated that downregulation of BHLHE41 inhibited A498 and
CAKI-1 cell proliferation. The colony formation ability of
shRNA-BHLHE41 cells was reduced significantly in these cell lines.
The number of migrated cells in BHLHE41-knockdown group was
decreased in Transwell migration assays. BHLHE41-knockdown cells
exhibited a significant reduction in p-p70S6K and protein
production of E-cadherin, indicating that BHLHE41 serves a critical
role in regulating tumor progression-associated signaling proteins
in ccRCC cells. In order to investigate the role of BHLHE41, a gene
array or more signaling pathways gene protein levels between
BHLHE41 expressed and control cells should be analyzed in future
studies. These results indicated that BHLHE41 may be a biomarker
and present a novel treatment option for ccRCC. Additionally,
through bioinformatics analysis, a decrease in the methylation
frequency of the 3′UTR region of BHLHE41 in ccRCC was reported.
This proposed a novel regulatory model for BHLHE41 gene
transcription.
Bigot et al (34) reported an association for a
single-nucleotide polymorphism rs7132434 and the risk for ccRCC.
The rs7132434 polymorphism influences BHLHE41 expression.
Overexpressing BHLHE41 produce a larger mouse xenograft tumor, but
no significant differences in ACHN cell growth rate or cell
migration were observed in in vitro experiments. In the
present study, BHLHE41 knockdown was determined to significantly
inhibit cell proliferation and migration in A498 and CAKI-1 ccRCC
cells. However, Bigot et al did not determine an association
between BHLHE41 expression and survival, as indicated in the
present study. This could be explained by BHLHE41 not contributing
to RCC disease progression robustly.
A previous study demonstrated an association between
BHLHE41 expression and the hypoxic adaptation (35). BHLHE41 genetic variants are selected
during adaptation to an anoxic environment (35). It is well known that the VHL/HIF
pathway is involved in the pathogenesis of ccRCC (36,37).
The present data demonstrated that the activity of the mTOR
signaling pathway gene, p70S6K, was attenuated by BHLHE41
downregulation in ccRCC cells, indicating that BHLHE41 activates
the mTOR pathway. Future studies must determine whether BHLHE41
regulates the VHL/HIF signaling pathways-induced mTOR activation
and mTOR inhibitors should be examined, as to whether they affect
the BHLHE41-induced proliferation, migration and clonogenic
activities of ccRCC cell-lines. Additionally, the present study
demonstrated that BHLHE41 regulated the expression of E-cadherin.
In a future study, to further clarify the impact of BHLHE41 on EMT
signaling pathways, further molecules, including TWIST and SNAILS,
need to be detected.
Studies on DNA methylation primarily concentrate on
the promoter regions (38,39). Other regulatory sequences, such as
the 3′UTR, and other non-coding and coding regions remain poorly
understood. However, a number of studies have reported the role of
DNA methylation in the 3′UTR on the regulation of gene expression
(40,41). 3′UTR hypermethylation interferes
p15INK4b gene expression in primary lymphomas (40). The 3′UTR hypermethylation levels of
pancreatic and duodenal homeobox 1 and orthodenticle homeobox 1
genes were observed in colorectal cancer cases, with a decrease in
gene expression (41). These
studies demonstrated that the methylation of the 3′UTR can affect
the occurrence of tumors by regulating the level of RNA and/or
protein. Therefore, regulation of the BHLHE41 gene expression may
come from combinatorial mechanisms. The specific function and
regulated mechanism will also be required to be verified through
cell experiments in vitro.
In summary, BHLHE41 expression is significantly
upregulated in ccRCC tissues, compared with normal renal tissues.
BHLHE41 knockdown reduced cell proliferation and migration of ccRCC
cells. Additionally, 3′UTR hypomethylation could be a potential
mechanism that affects BHLHE41 expression.
Acknowledgements
The authors would like to thank TCGA and GEO
projects for providing high-quality clinical data on clear cell
renal carcinoma.
Funding
The present study was supported by The National
Natural Science Foundation of China (grant no. 81570748) and
Natural Science Foundation of Fujian Province (grant nos.
2018J01345 and 2017XQ1194).
Availability of data and materials
The analyzed data sets generated during the study
are available from the corresponding author on reasonable
request.
Authors' contributions
JL and ZS designed the experiments. ZS, LZ, CZ and
XC performed the experiments. JL provided the patient samples. JL,
LZ, CZ and XC analyzed the data. JL wrote the manuscript. All
authors read and approved the manuscript and agree to be
accountable for all aspects of the research in ensuring that the
accuracy or integrity of any part of the work are appropriately
investigated and resolved.
Ethics approval and consent to
participate
The use of human tissues was approved by the Fuzhou
General Hospital IRB (Fuzhou, China) (approval no. 2013-017). All
the tissue detections were conducted following the receipt of
informed written consent from the patients.
Patient consent for publication
All patients agree to the publication of the
article.
Competing interests
The authors declare that they have no competing
interests.
References
|
1
|
Jonasch E, Gao J and Rathmell WK: Renal
cell carcinoma. BMJ. 349:g47972014. View Article : Google Scholar : PubMed/NCBI
|
|
2
|
Motzer RJ, Hutson TE, Cella D, Reeves J,
Hawkins R, Guo J, Nathan P, Staehler M, de Souza P, Merchan JR, et
al: Pazopanib versus sunitinib in metastatic renal-cell carcinoma.
N Engl J Med. 369:722–731. 2013. View Article : Google Scholar : PubMed/NCBI
|
|
3
|
Sato Y, Yoshizato T, Shiraishi Y, Maekawa
S, Okuno Y, Kamura T, Shimamura T, Sato-Otsubo A, Nagae G, Suzuki
H, et al: Integrated molecular analysis of clear-cell renal cell
carcinoma. Nat Genet. 45:860–867. 2013. View Article : Google Scholar : PubMed/NCBI
|
|
4
|
Miyazaki K, Kawamoto T, Tanimoto K,
Nishiyama M, Honda H and Kato Y: Identificat ion of functional
hypoxia response elements in the promoter region of the DEC1 and
DEC2 genes. J Biol Chem. 277:47014–47021. 2002. View Article : Google Scholar : PubMed/NCBI
|
|
5
|
Gorski JP and Price JL: Bone muscle
crosstalk targets muscle regeneration pathway regulated by core
circadian transcriptional repressors DEC1 and DEC2. Bonekey Rep.
5:8502016. View Article : Google Scholar : PubMed/NCBI
|
|
6
|
Sato F, Bhawal UK, Yoshimura T and
Muragaki Y: DEC1 and DEC2 crosstalk between circadian rhythm and
tumor progression. J Cancer. 7:153–159. 2016. View Article : Google Scholar : PubMed/NCBI
|
|
7
|
Sato F, Kawamura H, Wu Y, Sato H, Jin D,
Bhawal UK, Kawamoto T, Fujimoto K, Noshiro M, Seino H, et al: The
basic helix-loop-helix transcription factor DEC2 inhibits
TGF-β-induced tumor progression in human pancreatic cancer BxPC-3
cells. Int J Mol Med. 30:495–501. 2012. View Article : Google Scholar : PubMed/NCBI
|
|
8
|
Li P, Jia YF, Ma XL, Zheng Y, Kong Y,
Zhang Y, Zong S, Chen ZT and Wang YS: DEC2 suppresses tumor
proliferation and metastasis by regulating ERK/NF-kappaB pathway in
gastric cancer. Am J Cancer Res. 6:1741–1757. 2016. View Article : Google Scholar : PubMed/NCBI
|
|
9
|
Hu T, He N, Yang Y, Yin C, Sang N and Yang
Q: DEC2 expression is positively correlated with HIF-1 activation
and the invasiveness of human osteosarcomas. J Exp Clin Cancer Res.
34:222015. View Article : Google Scholar : PubMed/NCBI
|
|
10
|
Liu Q, Wu Y, Yoshizawa T, Yan X, Morohashi
S, Seino H, Kato Y and Kijima H: Basic helix-loop-helix
transcription factor DEC2 functions as an anti-apoptotic factor
during paclitaxel-induced apoptosis in human prostate cancer cells.
Int J Mol Med. 38:1727–1733. 2016. View Article : Google Scholar : PubMed/NCBI
|
|
11
|
Sobin L Gosparowicz MK and Wittekind C:
TNM classification of malignant tumours. 7th edition. (New York,
Wiley). 2009.
|
|
12
|
Feng C, Sun Y, Ding G, Wu Z, Jiang H, Wang
L, Ding Q and Wen H: PI3Kβ inhibitor TGX221 selectively inhibits
renal cell carcinoma cells with both VHL and SETD2 mutations and
links multiple pathways. Sci Rep. 5:94652015. View Article : Google Scholar : PubMed/NCBI
|
|
13
|
Beroukhim R, Brunet JP, Di Napoli A, Mertz
KD, Seeley A, Pires MM, Linhart D, Worrell RA, Moch H, Rubin MA, et
al: Patterns of gene expression and copy-number alterations in
von-hippel lindau disease-associated and sporadic clear cell
carcinoma of the kidney. Cancer Res. 69:4674–4681. 2009. View Article : Google Scholar : PubMed/NCBI
|
|
14
|
Gumz ML, Zou H, Kreinest PA, Childs AC,
Belmonte LS, LeGrand SN, Wu KJ, Luxon BA, Sinha M, Parker AS, et
al: Secreted frizzled-related protein 1 loss contributes to tumor
phenotype of clear cell renal cell carcinoma. Clin Cancer Res.
13:4740–4749. 2007. View Article : Google Scholar : PubMed/NCBI
|
|
15
|
Jones J, Otu H, Spentzos D, Kolia S, Inan
M, Beecken WD, Fellbaum C, Gu X, Joseph M, Pantuck AJ, et al: Gene
signatures of progression and metastasis in renal cell cancer. Clin
Cancer Res. 11:5730–5739. 2005. View Article : Google Scholar : PubMed/NCBI
|
|
16
|
Lenburg ME, Liou LS, Gerry NP, Frampton
GM, Cohen HT and Christman MF: Previously unidentified changes in
renal cell carcinoma gene expression identified by parametric
analysis of microarray data. BMC Cancer. 3:312003. View Article : Google Scholar : PubMed/NCBI
|
|
17
|
von Roemeling CA, Radisky DC, Marlow LA,
Cooper SJ, Grebe SK, Anastasiadis PZ, Tun HW and Copland JA:
Neuronal pentraxin 2 supports clear cell renal cell carcinoma by
activating the AMPA-selective glutamate receptor-4. Cancer Res.
74:4796–4810. 2014. View Article : Google Scholar : PubMed/NCBI
|
|
18
|
Barrett T, Troup DB, Wilhite SE, Ledoux P,
Rudnev D, Evangelista C, Kim IF, Soboleva A, Tomashevsky M,
Marshall KA, et al: NCBI GEO: Archive for high-throughput
functional genomic data. Nucleic Acids Res. 37:D885–D890. 2009.
View Article : Google Scholar : PubMed/NCBI
|
|
19
|
Tomczak K, Czerwinska P and Wiznerowicz M:
The cancer genome atlas (TCGA): An immeasurable source of
knowledge. Contemp Oncol. 19:A68–A77. 2015.
|
|
20
|
Robinson MD, McCarthy DJ and Smyth GK:
edgeR: A Bioconductor package for differential expression analysis
of digital gene expression data. Bioinformatics. 26:139–140. 2010.
View Article : Google Scholar : PubMed/NCBI
|
|
21
|
Cancer Genome Atlas Research Network, .
Comprehensive molecular characterization of clear cell renal cell
carcinoma. Nature. 499:43–49. 2013. View Article : Google Scholar : PubMed/NCBI
|
|
22
|
Livak KJ and Schmittgen TD: Analysis of
relative gene expression data using real-time quantitative PCR and
the 2−ΔΔCT method. Methods. 25:402–408. 2001. View Article : Google Scholar : PubMed/NCBI
|
|
23
|
Fuhrman SA, Lasky LC and Limas C:
Prognostic significance of morphologic parameters in renal cell
carcinoma. Am J Surg Pathol. 6:655–663. 1982. View Article : Google Scholar : PubMed/NCBI
|
|
24
|
Hay N: The Akt-mTOR tango and its
relevance to cancer. Cancer Cell. 8:179–183. 2005. View Article : Google Scholar : PubMed/NCBI
|
|
25
|
Ozes ON, Akca H, Mayo LD, Gustin JA,
Maehama T, Dixon JE and Donner DB: A phosphatidylinositol
3-kinase/Akt/mTOR pathway mediates and PTEN antagonizes tumor
necrosis factor inhibition of insulin signaling through insulin
receptor substrate-1. Proc Natl Acad Sci USA. 98:4640–4645. 2001.
View Article : Google Scholar : PubMed/NCBI
|
|
26
|
Shaw RJ, Bardeesy N, Manning BD, Lopez L,
Kosmatka M, DePinho RA and Cantley LC: The LKB1 tumor suppressor
negatively regulates mTOR signaling. Cancer Cell. 1:91–99. 2004.
View Article : Google Scholar
|
|
27
|
Huber MA, Kraut N and Beug H: Molecular
requirements for epithelial mesenchymal transition during tumor
progression. Curr Opin Cell Biol. 17:548–558. 2005. View Article : Google Scholar : PubMed/NCBI
|
|
28
|
He Y, Jones CR, Fujiki N, Xu Y, Guo B,
Holder JL Jr, Rossner MJ, Nishino S and Fu YH: The transcriptional
repressor DEC2 regulates sleep length in mammals. Science.
325:866–870. 2009. View Article : Google Scholar : PubMed/NCBI
|
|
29
|
Gery S and Koeffler HP: Circadian rhythms
and cancer. Cell Cycle. 9:1097–1103. 2010. View Article : Google Scholar : PubMed/NCBI
|
|
30
|
Innominato PF, Palesh O, Dhabhar FS, Levi
F and Spiegel D: Regulation of circadian rhythms and
hypothalamic-pituitary-adrenal axis: An overlooked interaction in
cancer. Lancet Oncol. 11:816–817. 2010. View Article : Google Scholar : PubMed/NCBI
|
|
31
|
Olkkonen J, Kouri VP, Hynninen J,
Konttinen YT and Mandelin J: Differentially expressed in
chondrocytes 2 (DEC2) increases the expression of IL-1β and is
abundantly present in synovial membrane in rheumatoid arthritis.
PLoS One. 10:e01452792015. View Article : Google Scholar : PubMed/NCBI
|
|
32
|
Nakamura H, Tanimoto K, Hiyama K, Yunokawa
M, Kawamoto T, Kato Y, Yoshiga K, Poellinger L, Hiyama E and
Nishiyama M: Human mismatch repair gene, MLH1, is
transcriptionally repressed by the hypoxia-inducible transcription
factors. DEC1 and DEC2. Oncogene. 27:4200–4209. 2008. View Article : Google Scholar : PubMed/NCBI
|
|
33
|
Montagner M, Enzo E, Forcato M, Zanconato
F, Parenti A, Rampazzo E, Basso G, Leo G, Rosato A, Bicciato S, et
al: SHARP1 suppresses breast cancer metastasis by promoting
degradation of hypoxia-inducible factors. Nature. 487:380–384.
2012. View Article : Google Scholar : PubMed/NCBI
|
|
34
|
Bigot P, Colli LM, Machiela MJ, Jessop L,
Myers TA, Carrouget J, Wagner S, Roberson D, Eymerit C, Henrion D,
et al: Functional characterization of the 12p12.1 renal
cancer-susceptibility locus implicates BHLHE41. Nat Commun.
7:120982016. View Article : Google Scholar : PubMed/NCBI
|
|
35
|
Huerta-Sanchez E, Degiorgio M, Pagani L,
Tarekegn A, Ekong R, Antao T, Cardona A, Montgomery HE, Cavalleri
GL, Robbins PA, et al: Genetic signatures reveal high-altitude
adaptation in a set of ethiopian populations. Mol Biol Evol.
30:1877–1888. 2013. View Article : Google Scholar : PubMed/NCBI
|
|
36
|
Gossage L and Eisen T: Alterations in VHL
as potential biomarkers in renal-cell carcinoma. Nat Rev Clin
Oncol. 7:277–288. 2010. View Article : Google Scholar : PubMed/NCBI
|
|
37
|
Vanharanta S, Shu W, Brenet F, Hakimi AA,
Heguy A, Viale A, Reuter VE, Hsieh JJ, Scandura JM and Massagué J:
Epigenetic expansion of VHL-HIF signal output drives multiorgan
metastasis in renal cancer. Nat Med. 19:50–56. 2013. View Article : Google Scholar : PubMed/NCBI
|
|
38
|
Bird A: DNA methylation patterns and
epigenetic memory. Genes Dev. 16:6–21. 2002. View Article : Google Scholar : PubMed/NCBI
|
|
39
|
Schubeler D: Function and information
content of DNA methylation. Nature. 517:321–326. 2015. View Article : Google Scholar : PubMed/NCBI
|
|
40
|
Malumbres M, Perez de Castro I, Santos J,
Fernandez Piqueras J and Pellicer A: Hypermethylation of the cell
cycle inhibitor p15INK4b 3′-untranslated region interferes with its
transcriptional regulation in primary lymphomas. Oncogene.
18:385–396. 1999. View Article : Google Scholar : PubMed/NCBI
|
|
41
|
Smith JF, Mahmood S, Song F, Morrow A,
Smiraglia D, Zhang X, Rajput A, Higgins MJ, Krumm A, Petrelli NJ,
et al: Identification of DNA methylation in 3′ genomic regions that
are associated with upregulation of gene expression in colorectal
cancer. Epigenetics. 2:161–172. 2007. View Article : Google Scholar : PubMed/NCBI
|