Introduction
Gastric cancer is one of the four most malignant
tumors, accounting for ~10% of cancer-associated mortalities
worldwide in 2015 (1–3). There are established treatments for
gastric cancer, as well as therapies under development, yet it
remains a lethal malignancy and was the second leading cause of
cancer-associated mortalities in East Asia in 2012, due to the high
morbidity and late diagnosis (2).
The 5-year overall survival rate in gastric cancer, particularly
the advanced and recurrent types, is <25% (4). Gastric or stomach adenocarcinoma
(STAD) accounted for ~90% of gastric cancer cases worldwide in 2014
(5). The majority of patients with
STAD in Western countries are diagnosed at advanced or metastatic
stages (6). The early diagnosis of
STAD or gastric cancer greatly improves the outcome of the patient.
Therefore, diagnostic and prognostic biomarkers are urgently
required for improving STAD diagnosis and predicting patient
outcomes.
Prognostic markers implicate the close monitoring
and treatment of high-risk patients to prolong their overall
survival time (7). Traditional
prognostic markers of gastric cancer used in clinical practice are
principally clinicopathological variables, including age, tumor
stage, Helicobacter pylori infection, response to
chemotherapy and recurrence (8–11). The
discoveries of novel prognostic biomarkers contribute to
introducing and designing novel treatment strategies to improve
patient survival. With the development and application of genetic
engineering methods, large-scale genomic analyses have revealed
various molecular signatures associated with gastric cancer
outcomes, including gene mutations, mRNAs and non-coding RNAs
[microRNAs (miRNAs/miRs) and long non-coding RNAs (lncRNAs)]
(1,12–15).
The association of a single molecule with a disease is limited to
the complex mechanism of disease development, whereas multifactor
signatures have exhibited superior diagnostic and prognostic
abilities (7,13,15,16).
Over the past 5 years, various prognostic or
diagnostic models based on sets of factors have been identified in
gastric cancer, including several potential diagnostic miRNA
signatures (7,13,15,16).
Huang et al (1) identified a
6-miRNA signature comprised of 6 overexpressed miRNAs (miR-10b-5p,
miR-132-3p, miR-185-5p, miR-195-5p, miR-20a-3p and miR-296-5p)
detected in the serum of patients. Zhu et al (13) defined a 5-miRNA signature (miR-16,
miR-25, miR-92a, miR-451 and miR-486-5p) as a potential diagnostic
biomarker. The majority of these miRNAs, including miR-25, miR-92a,
miR-132-3p, miR-296-5p, miR-195-5p, miR-451 and miR-486-5p, were
associated with the development of gastric cancer and the survival
time of the patients (17–23). The emergence of novel miRNA
signatures with diagnostic and prognostic abilities has attracted a
great amount of interest, and suggests that there is unlimited
potential in mining valuable multifactor prognostic sets with
predictive capacity for patients with solid tumors.
The present study was designed to identify a model
prognostic miRNA set with predictive power in the outcome of
patients with STAD. miRNAs associated with the prognosis of
patients from The Cancer Genome Atlas (TCGA) database were
identified using two-step Cox regression analysis. A predictive
risk model based on the miRNA signature was established and
validated using a sample-splitting method. The validation and
assessment of the performance of the risk model was conducted using
a Kaplan-Meier log-rank test and the area under the curve (AUC)
following time-independent receiver operating characteristic (ROC)
analysis. Stratification analyses were performed to assess the
prognostic value of clinical variables. The potential of using the
miRNA signature as a prognostic model for the outcome of patients
with STAD was defined.
Materials and methods
Data collection
STAD miRNA-seq data, based on the Illumina HiSeq
2000 RNA Sequencing platform (Illumina, Inc., San Diego, CA, USA),
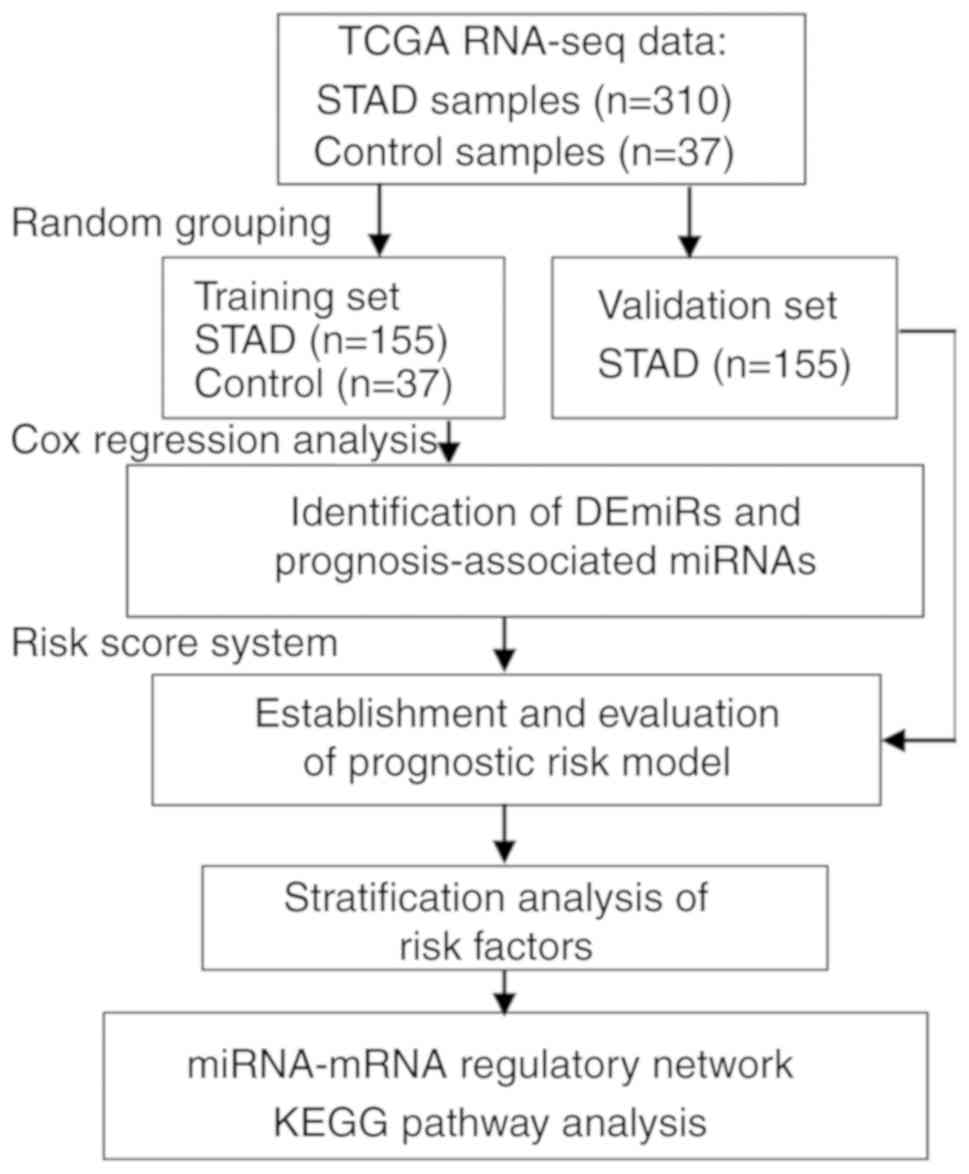
were downloaded from TCGA database (https://portal.gdc.cancer.gov/) in May 10, 2018. Only
data with information on patient survival and prognosis were
selected (n=310), and the cases were randomly assigned into
training and validation sets according to the analysis design
(Fig. 1). Non-tumor samples (n=37)
were assigned into the training group and were employed for the
identification of differentially expressed miRNAs (DEmiRs), whereas
the validation data were used for the evaluation and assessment of
the risk model.
Identification and hierarchical
clustering analysis of DEmiRs
The DEmiRs between the STAD (n=155) and control
samples (n=37) in the training set were identified using the edgeR
package (version 3.20.9; http://bioconductor.org/packages/release/bioc/html/edgeR.html)
(24). miRNAs were considered to be
statistically significantly expressed in STAD samples with false
discovery rate (FDR) <0.05 and
|log2[fold-change(FC)]|≥0.5. DEmiRs were subjected to a
two-way hierarchical clustering analysis using the centered
Pearson's correlation algorithm in the Pheatmap package (version
1.0.8; http://cran.r-project.org/web/packages/pheatmap/index.html)
(25,26). The analysis was performed in R
(version 3.4.1; http://www.r-project.org/).
Selection of prognostic DEmiRs
associated with the outcome of patients with STAD
Univariate and multivariate Cox regression analyses
in the survival package (version 2.41.3; http://cran.r-project.org/web/packages/survival/index.html)
(27) in R (version 3.4.1) were
performed to define the prognostic DEmiRs. The hazard ratio (HR)
and 95% confidence interval (CI) were estimated. The prognostic
DEmiRs with a Kaplan-Meier log-rank test P-value of <0.05 were
defined as independent prognostic factors for patients with
STAD.
Establishment and evaluation of
prognostic risk model
Step I: Determination of the optimal
cut-off values of miRNA expression
Optimal cut-off values of the expression levels of
the prognostic DEmiRs were defined using X-Tile Bio-Informatics
software (version 2.41.3; http://medicine.yale.edu/lab/rimm/research/software.aspx)
(28) based on the survival
analysis (χ2 test). Monte Carlo sampling P<0.05 was
set as the threshold for the cut-off value. The status of each
DEmiR was defined as 0 (expression level < cut-off) or 1
(expression level > cut-off) (29).
Step II: Establishment of the risk
model
The prognostic index, defined as the miR score or
risk score of each sample, was calculated using the linear
combination of the expression values weighted by the multivariate
Cox regression coefficient (β) and expression status: miR score =
Σβ miRNA n × status miRNA n, where status is 0 or 1 as previously
defined, and n represents the miRNA name. The corresponding data
were stratified into high- and low-risk groups according to whether
their miR scores were higher or lower than the median.
Step III: Evaluation of the risk
model
The prognostic difference between the high- and
low-risk groups was analyzed using a Kaplan-Meier log-rank test,
and the AUC of the time-independent ROC curve was used to evaluate
the performance of the risk model in predicting high- and low-risk
patients (30). P<0.05 was
considered to indicate statistically a significant difference in
the Kaplan-Meier log-rank test. The validation set was used for the
evaluation and assessment for the performance of the risk
model.
Analysis of risk factors
Univariate and multivariate Cox regression analyses
were performed to define the independent prognostic risk factors
for STAD, with the threshold of the Kaplan-Meier log-rank test
being P<0.05. Stratification analyses of the potential clinical
prognostic factors for patients with STAD were performed.
Furthermore, Cox regression analyses were performed to identify the
association between the clinical factors and the survival times of
high- and low-risk patients. P<0.05 was considered to indicate
statistically significant differences. A Kaplan-Meier survival
analysis was performed for factors that were revealed to be
significantly associated with the survival time of the
patients.
miRNA-mRNA regulatory network and
functional enrichment analysis
To identify the biological functions associated with
the prognostic DEmiRs, a functional enrichment analysis was
performed to identify the predicted targets of DEmiRs. Paired
mRNA-seq data from patients assigned into the high- and low-risk
groups were downloaded from TCGA, and differentially expressed
genes (DEGs) were identified using the edgeR package with a cut-off
of FDR<0.05 and |log2FC|≥0.5. Potential mRNA targets
of the prognostic DEmiRs were predicted using TargetScan (version
7.2; http://www.targetscan.org/vert_72/) (31). Overlapping genes between the
identified DEGs and the predicted targets of the DEmiRs were
selected for the construction of an miRNA-mRNA regulatory network
using Cytoscape (version 3.6.1; http://www.cytoscape.org/) (32). The DEG-associated Kyoto Encyclopedia
of Genes and Genomes (KEGG) pathways were identified using Gene Set
Enrichment Analysis (GSEA; version 3.0; http://software.broadinstitute.org/gsea/index.jsp)
(33), with P<0.05 considered to
indicate statistical significance.
Results
Baseline characteristics of the
patients
Data from a total of 310 patients with STAD and 37
healthy controls were included in the present study. Accordingly,
data from 155 patients and the 37 controls were assigned as the
training set and used for the identification of DEmiRs and
definition of the risk model. The data from the remaining 155
patients were included into the validation set for validation of
the risk model (Fig. 1). The
baseline characteristics of the 310 patients are listed in Table I.
 | Table I.Baseline characteristics of all
patients with stomach adenocarcinoma. |
Table I.
Baseline characteristics of all
patients with stomach adenocarcinoma.
| Clinical
characteristics | Training set
(n=155) | Validation set
(n=155) | Entire set
(n=310) |
|---|
| Age, years (mean ±
SD) | 63.58±10.76 | 66.32±9.56 | 64.95±10.16 |
| Sex, n |
|
|
|
|
Male | 99 | 103 | 202 |
|
Female | 56 | 52 | 108 |
| Reflux, n |
|
|
|
|
Yes | 20 | 16 | 36 |
| No | 77 | 85 | 162 |
|
N/A | 58 | 54 | 112 |
| Anti-reflux
treatment, n |
|
|
|
|
Yes | 14 | 15 | 29 |
| No | 67 | 70 | 137 |
|
N/A | 74 | 70 | 144 |
| H. pylori
infection, n |
|
|
|
|
Yes |
6 | 13 | 19 |
| No | 64 | 77 | 141 |
|
N/A | 85 | 65 | 150 |
| Radiation therapy,
n |
|
|
|
|
Yes | 30 | 27 | 57 |
| No | 120 | 127 | 247 |
|
N/A |
5 |
1 |
6 |
| Metastasis stage,
n |
|
|
|
| M0 | 142 | 142 | 284 |
| M1 | 10 |
5 | 15 |
|
N/A |
3 |
8 | 11 |
| Node stage, n |
|
|
|
| N0 | 48 | 45 | 93 |
| N1 | 41 | 41 | 82 |
| N2 | 35 | 25 | 60 |
| N3 | 29 | 40 | 69 |
|
N/A |
2 |
4 |
6 |
| Tumor stage |
|
|
|
| T1 |
8 | 18 | 26 |
| T2 | 38 | 47 | 85 |
| T3 | 61 | 78 | 139 |
| T4 | 47 | 12 | 59 |
|
N/A |
1 |
0 |
1 |
| Pathological stage,
n |
|
|
|
| I | 25 |
7 | 32 |
| II | 49 | 26 | 75 |
|
III | 67 | 76 | 143 |
| IV | 13 | 46 | 59 |
|
N/A |
1 |
0 |
1 |
| Grade, n |
|
|
|
| 1 |
4 |
3 |
7 |
| 2 | 51 | 58 | 109 |
| 3 | 95 | 90 | 185 |
|
N/A |
5 |
4 |
9 |
| Recurrence, n |
|
|
|
|
Yes | 24 | 19 | 43 |
| No | 108 | 110 | 218 |
|
N/A | 23 | 26 | 49 |
| Survival, n |
|
|
|
|
Succumbed | 61 | 60 | 121 |
|
Alive | 94 | 95 | 189 |
| Overall
survival time, months (mean ± SD) | 18.74±17.36 | 18.56±17.53 | 18.65±17.45 |
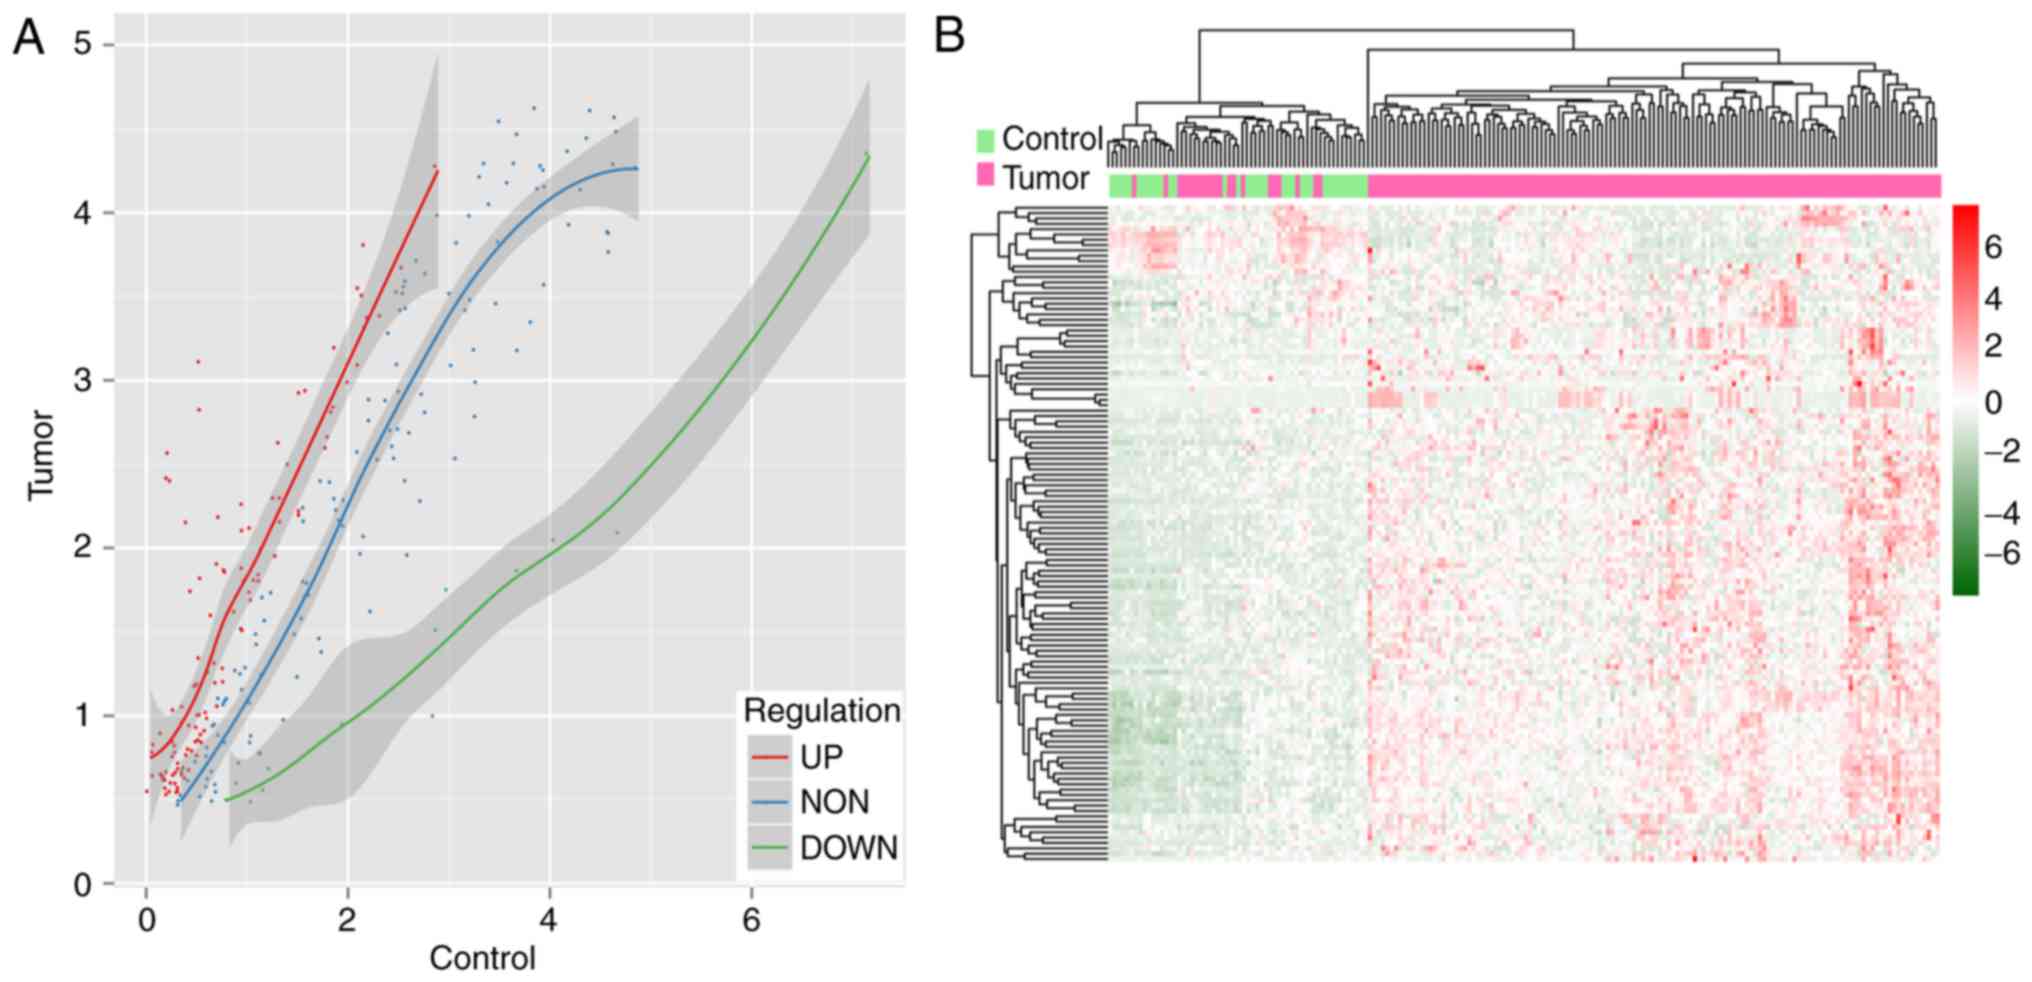
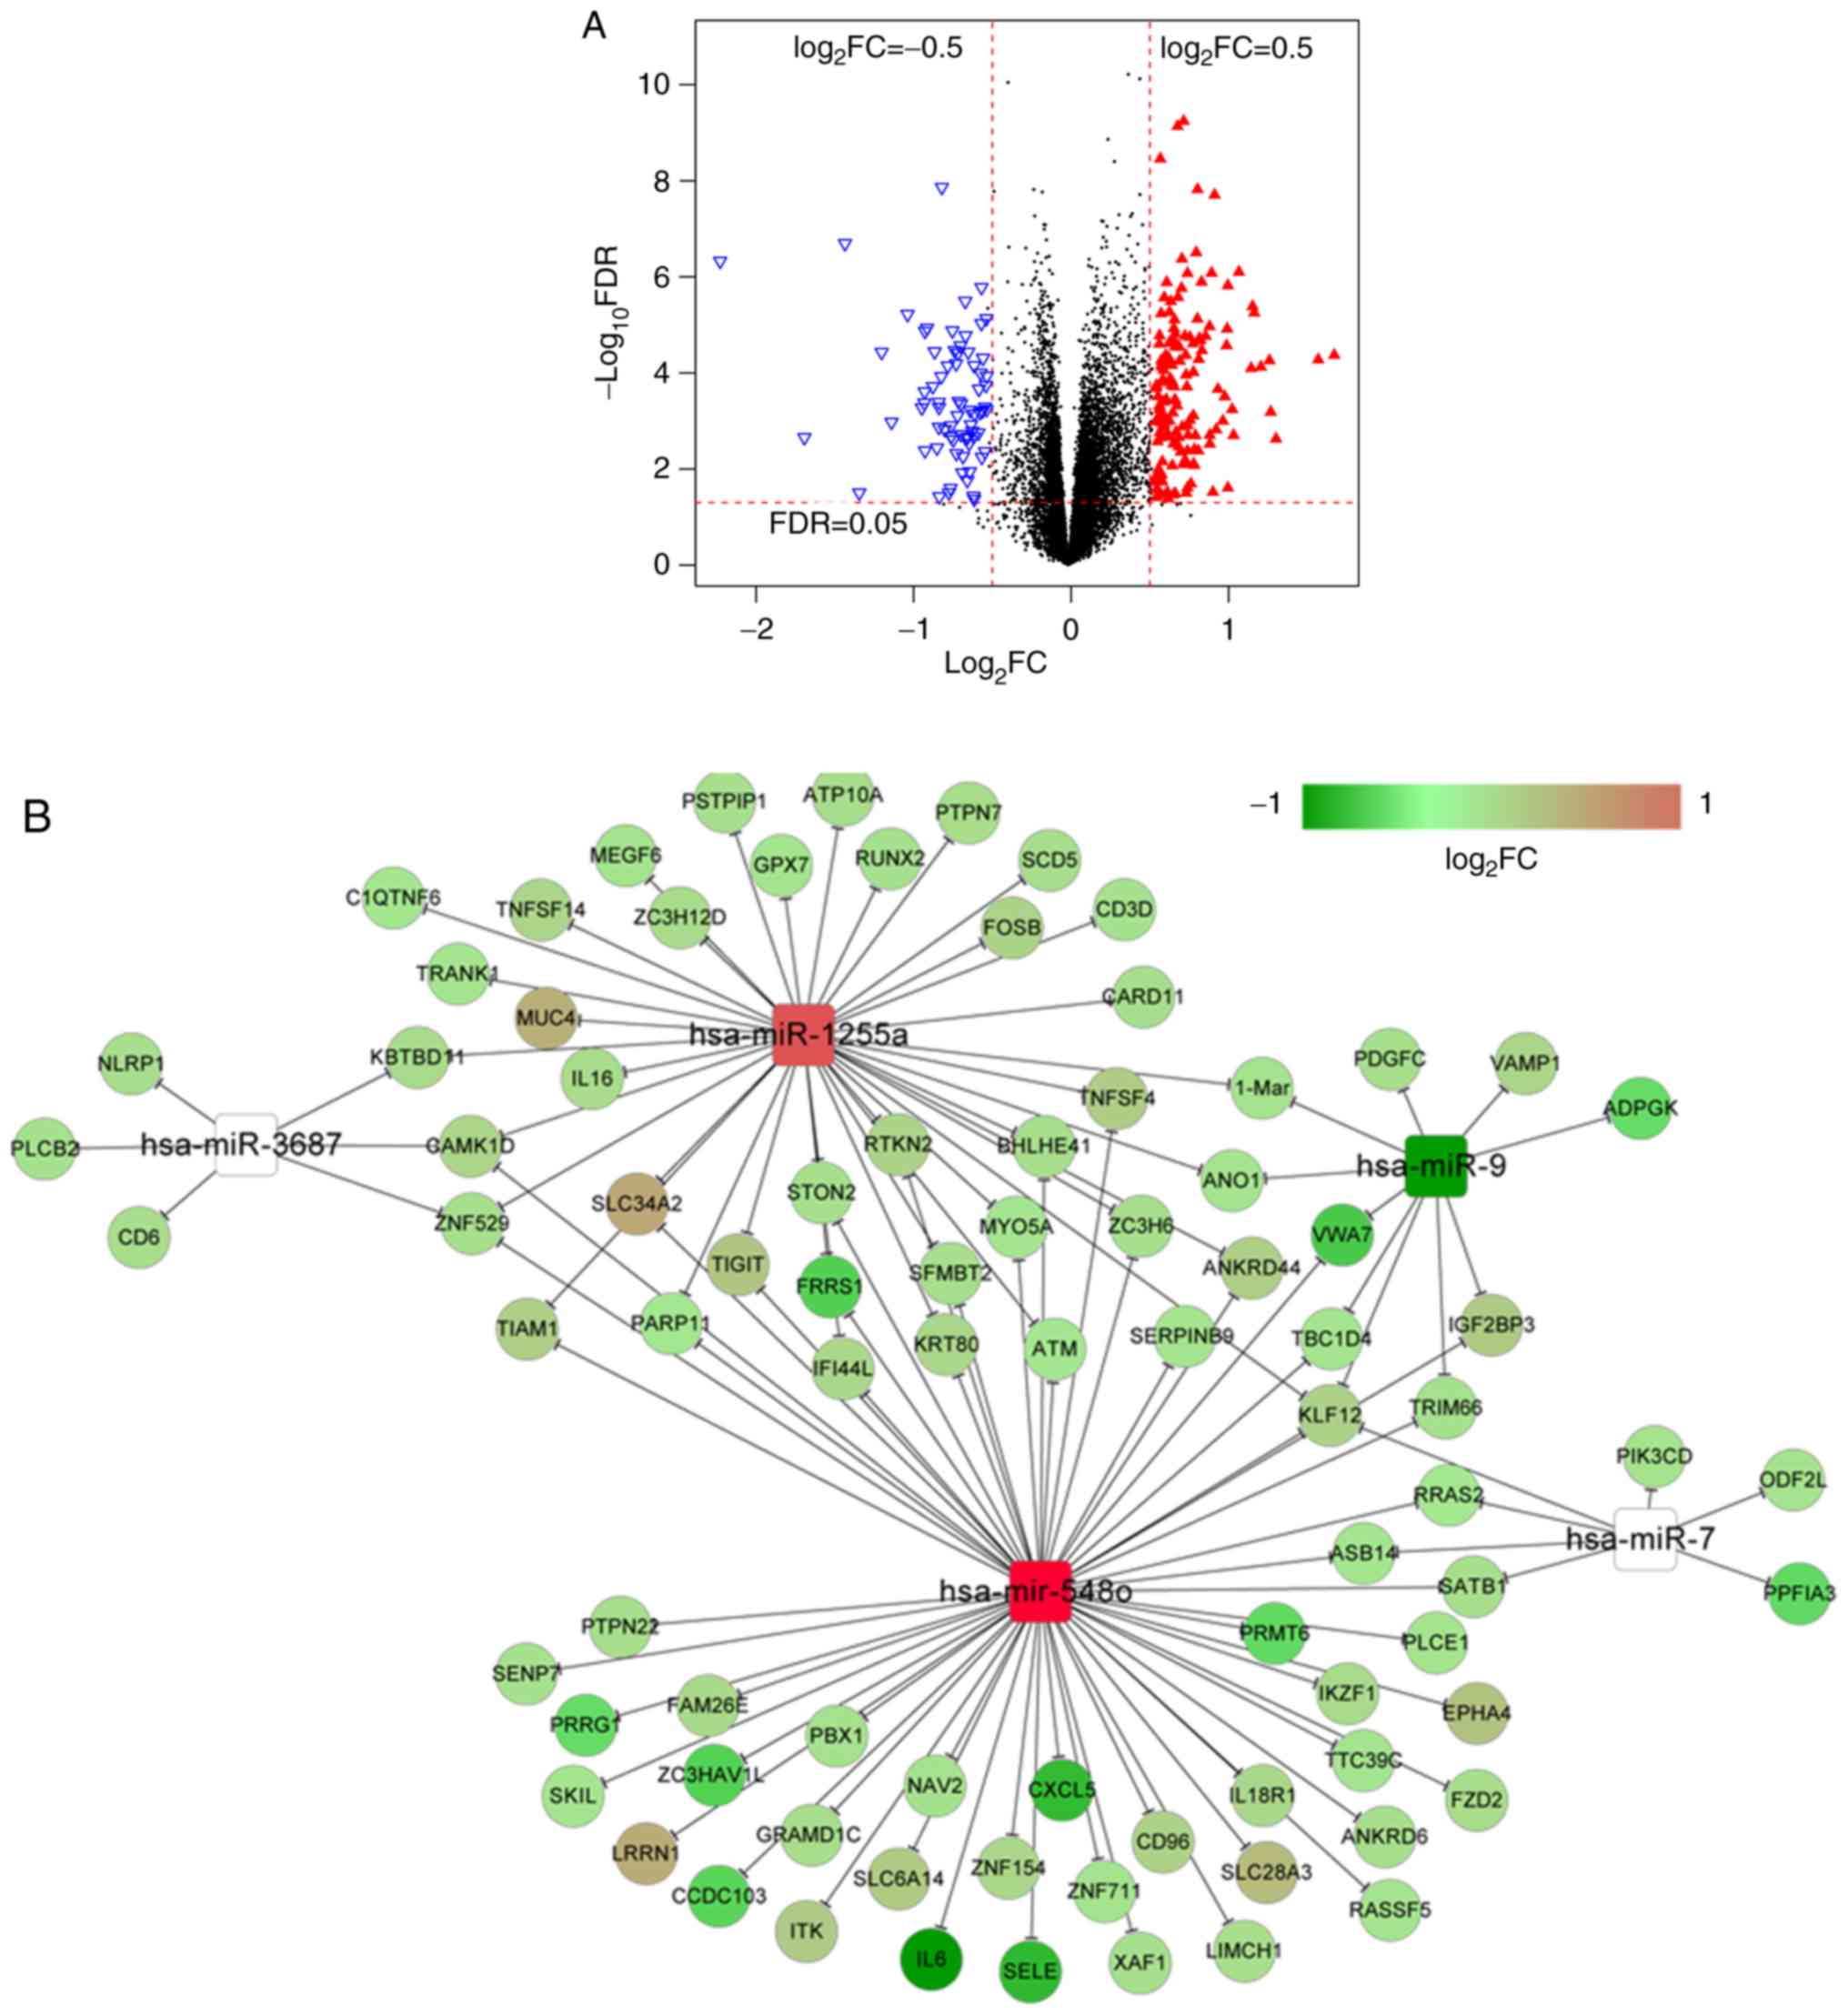
Identification of DEmiRs
A total of 124 DEmiRs (Table SI) were identified following a
comparative analysis of the miRNA-seq data from the training set
(155 tumor samples and 37 controls) using the edgeR package, with
the criteria of FDR<0.05 and |log2FC|≥0.5. The
majority of the DEmiRs (88.71%; 110/124 miRNAs) were upregulated
and 14 (11.29%) were downregulated (Fig. 2A). A two-way hierarchical clustering
analysis of the DEmiRs revealed the distinct expression profiles of
these miRNAs in tumor and control samples (Fig. 2B).
Identification of prognostic
DEmiRs
The expression data of the 124 DEmiRs were subjected
to a univariate Cox regression analysis with overall survival time
as the dependent variable, and 13 potential prognostic DEmiRs were
defined (log-rank test P<0.05; Table II). These potential prognostic
DEmiRs were then subjected to a multivariate Cox regression
analysis with overall survival time as the dependent variable, and
5 DEmiRs were ultimately identified to be prognostic miRNAs within
the training group (P<0.05; Table
II).
| Table II.Univariate and multivariate Cox
regression analysis of miRNAs associated with survival of patients
with stomach adenocarcinoma. |
Table II.
Univariate and multivariate Cox
regression analysis of miRNAs associated with survival of patients
with stomach adenocarcinoma.
|
| Univariate
analysis | Multivariate
analysis |
|
|---|
|
|
|
|
|
|---|
| miRNA | β | HR (95% CI) | P-value | β | HR (95% CI) | P-value | Cut-off
pointa |
|---|
| hsa-mir-1255a | 0.376 | 1.456
(0.941–2.252) | 0.046b | 0.827 | 2.286
(1.268–4.121) | 0.006b | 0.63 |
| hsa-mir-3687 | 0.216 | 1.241
(0.966–1.593) | 0.046b | 0.360 | 1.433
(1.068–1.925) | 0.017b | 1.21 |
| hsa-mir-548o | −0.520 | 0.595
(0.354–0.999) | 0.025b | −0.800 | 0.449
(0.230–0.877) | 0.019b | 0.33 |
| hsa-mir-9-3 | 0.390 | 1.477
(1.015–2.148) | 0.021b | 0.523 | 1.687
(1.083–2.629) | 0.021b | 0.68 |
| hsa-mir-7-2 | −0.274 | 0.761
(0.583–0.992) | 0.022b | −0.381 | 0.683
(0.476–0.982) | 0.039b | 1.08 |
| hsa-mir-216a | 0.351 | 1.420
(1.061–1.901) | 0.009b | 0.342 | 1.408
(0.964–2.058) | 0.077 | N/A |
| hsa-mir-618 | −0.520 | 1.339
(0.971–1.848) | 0.038b | 0.410 | 1.506
(0.938–2.418) | 0.090 | N/A |
| hsa-mir-504 | 0.306 | 1.357
(0.953–1.934) | 0.046b | 0.331 | 1.392
(0.882–2.197) | 0.155 | N/A |
| hsa-mir-556 | −0.401 | 0.670
(0.455–0.983) | 0.021b | −0.179 | 0.836
(0.522–1.339) | 0.457 | N/A |
| hsa-mir-493 | 0.268 | 1.308
(0.977–1.749) | 0.036b | 0.070 | 1.073
(0.684–1.683) | 0.761 | N/A |
| hsa-mir-1228 | 0.270 | 1.310
(0.951–1.803) | 0.049b | 0.042 | 1.043
(0.689–1.577) | 0.844 | N/A |
| hsa-mir-541 | 0.494 | 1.639
(0.996–2.695) | 0.026b | −0.058 | 0.944
(0.502–1.774) | 0.857 | N/A |
| hsa-mir-496 | 0.409 | 1.506
(1.070–2.118) | 0.009b | 0.043 | 1.044
(0.609–1.787) | 0.877 | N/A |
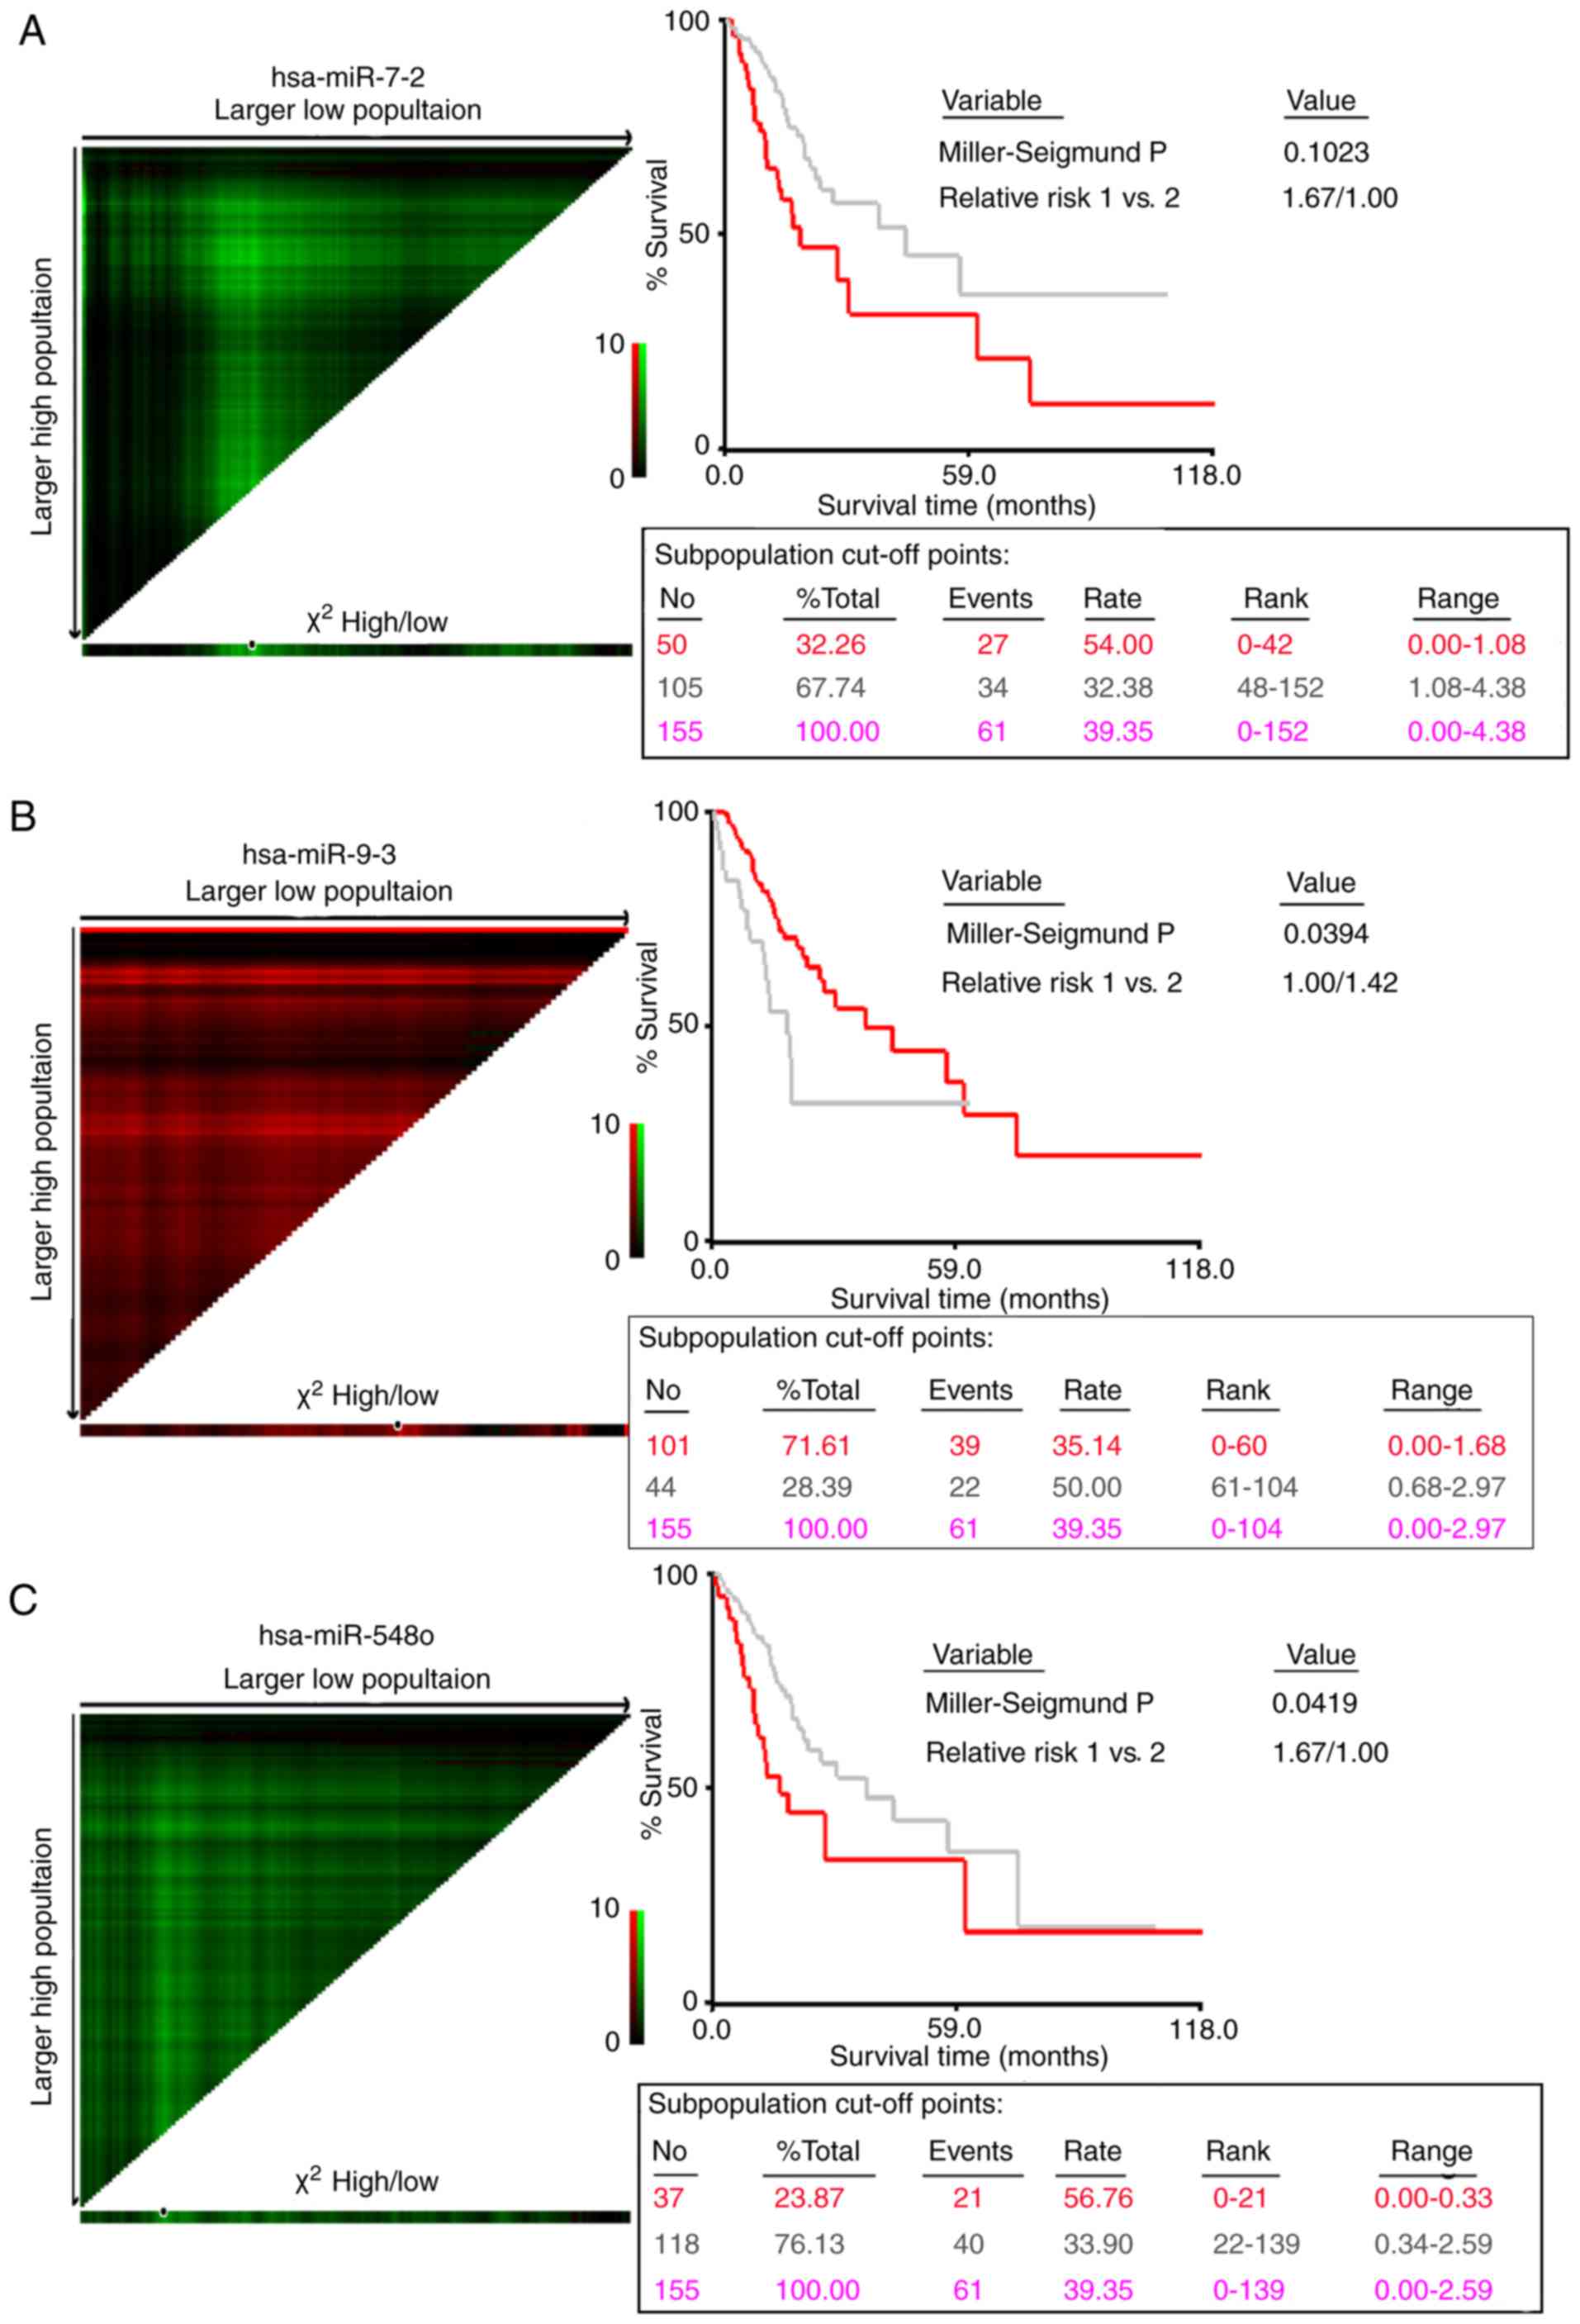
The optimal cut-off values of the expression levels
of the prognostic DEmiRs are listed in Table II and the graphical representation
of the optimal cut-off points is displayed in Fig. 3. The expression of miRNAs
hsa-mir-1255a (β, 0.827; HR, 2.286; 95% CI, 1.268–4.121; P=0.006),
hsa-mir-3687 (β, 0.360; HR=1.433; 95% CI=1.068–1.925; P=0.017) and
hsa-mir-9-3 (β, 0.523; HR, 1.687; 95% CI, 1.083–2.629; P=0.021) was
negatively associated with the overall survival time; that of
hsa-mir-548o (β, −0.800; HR, 0.449; 95% CI, 0.230–0.877; P=0.019)
and hsa-mir-7-2 (β, −0.381; HR, 0.683; 95% CI, 0.476–0.982;
P=0.039) was positively associated. Expressly, patients with high
levels of hsa-mir-1255a, hsa-mir-3687 and hsa-mir-9-3 had high risk
scores and short survival times, and patients with high levels of
hsa-mir-548o and hsa-mir-7-2 had low risk scores and longer
survival times (Fig. 3). These
findings indicate that elevated expression levels of hsa-mir-1255a,
hsa-mir-3687 and hsa-mir-9-3, combined with low levels of
hsa-mir-548o and hsa-mir-7-2, are associated with a poor
prognosis.
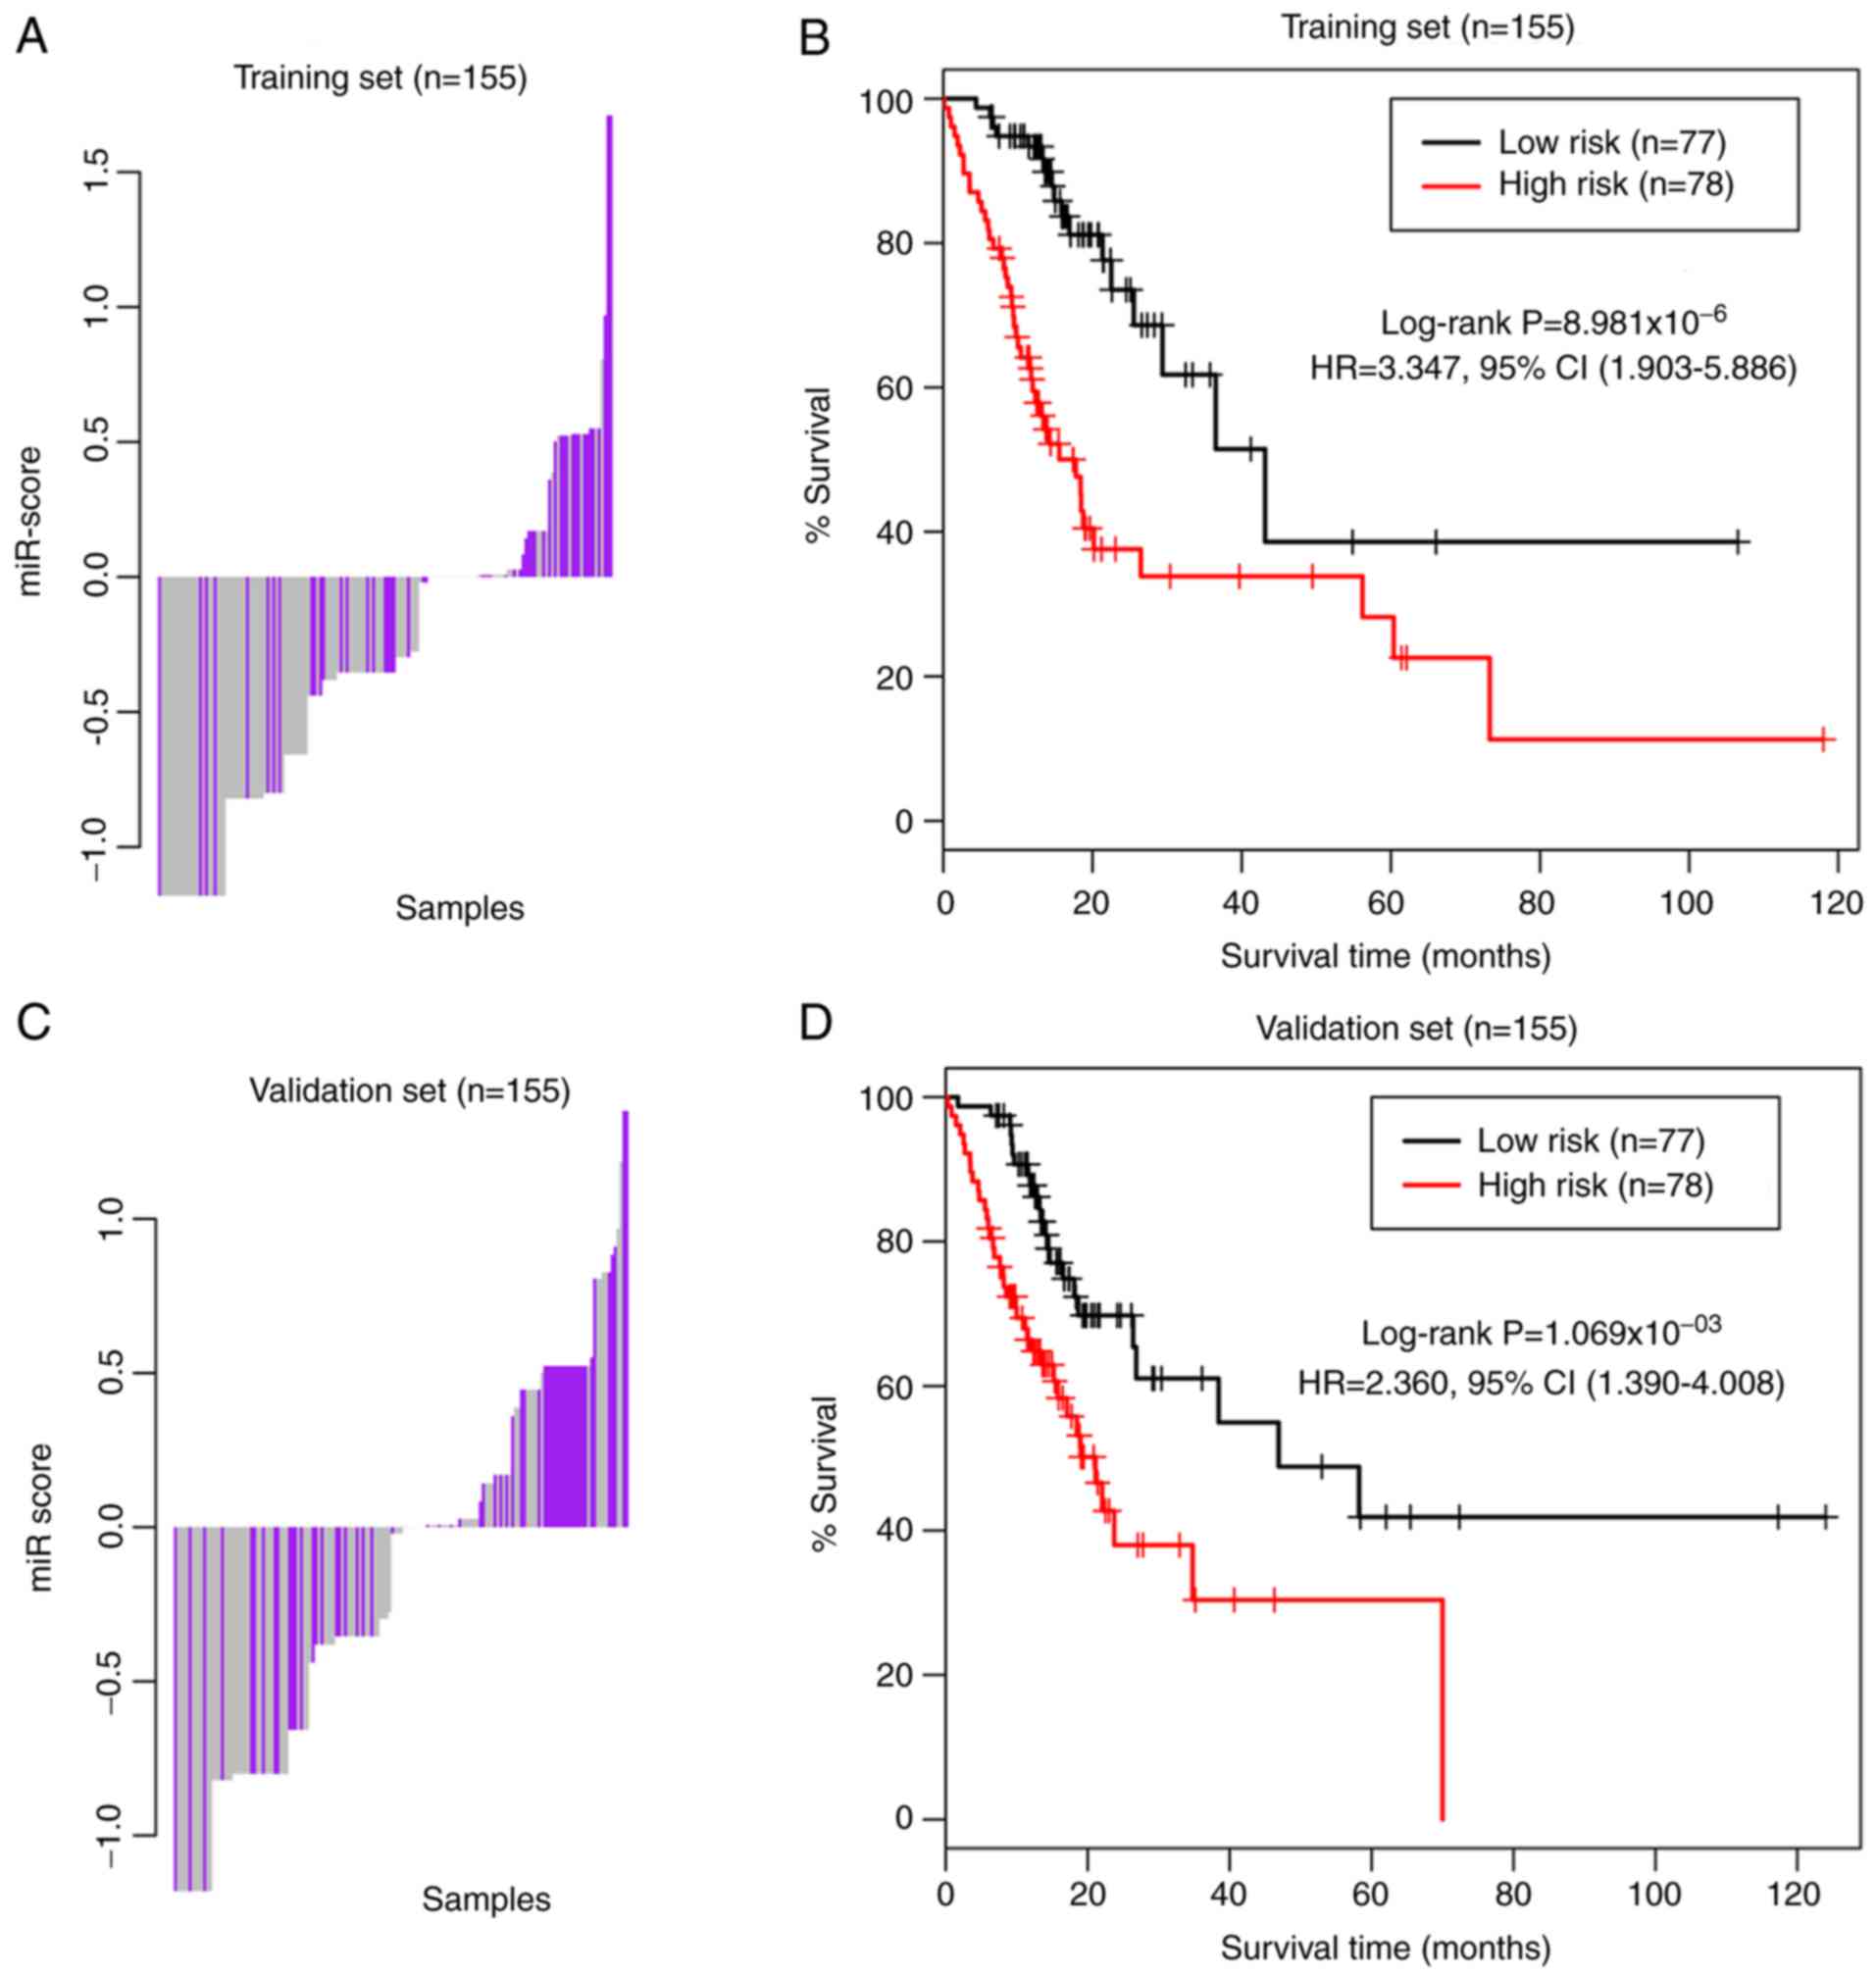
Risk model training
The risk score was calculated with coefficients from
the multivariate Cox regression analysis by incorporating the 5
prognostic miRNAs. The predictive risk model for the training data
using the 5-miRNA signature was constructed using the formula:
miR=(0.827) × Status_hsa-mir-1255a + (0.360) × Status_hsa-mir-3687
+ (−0.800) × Status_hsa-mir-548o + (0.523) × Status_hsa-mir-9-3 +
(−0.381) × Status_hsa-mir-7-2. Overall, 77 (49.68%) and 78 samples
(50.32%) from the training set were assigned into low-risk
(−1.18047<miR≤-0.354) and high-risk (−0.354<miR≤1.710)
groups, respectively, according to the distribution and the median
value (−0.354) of the risk score for the patients (Fig. 4A). The overall survival rate within
the low-risk group during the follow-up period was 79.22% (61/77
patients), whereas that within the high-risk group was 42.31%
(33/78 patients). The Kaplan-Meier log-rank test revealed that the
patients in the high-risk group were associated with significantly
shorter survival times than those in the low-risk group (HR, 3.347;
95% CI, 1.903–5.886; P<0.01; Fig.
4B).
Risk model validation
Data from TCGA validation set were used to evaluate
the performance and prognostic power of the predictive risk model
based on the 5-miRNA signature. Fig.
4C displays the risk score distribution for patients with STAD
based on the 5 prognostic miRNAs. Overall, 77 (49.7%) and 78
(50.3%) patients were assigned into the low-risk
(−1.180<miR≤-0.021) and high-risk (−0.021<miR≤1.350) groups,
respectively. During the follow-up period, the overall survival
rate within the low-risk group was 70.1% (54/77 patients), whereas
that within the high-risk group was 52.6% (41/78 patients). As
expected, the Kaplan-Meier log-rank test demonstrated that the
high-risk group exhibited shorter survival times. A significant
difference in survival times was observed between the low- and
high-risk groups (HR, 2.360; 95% CI, 1.39–4.008; P<0.01;
Fig. 4D).
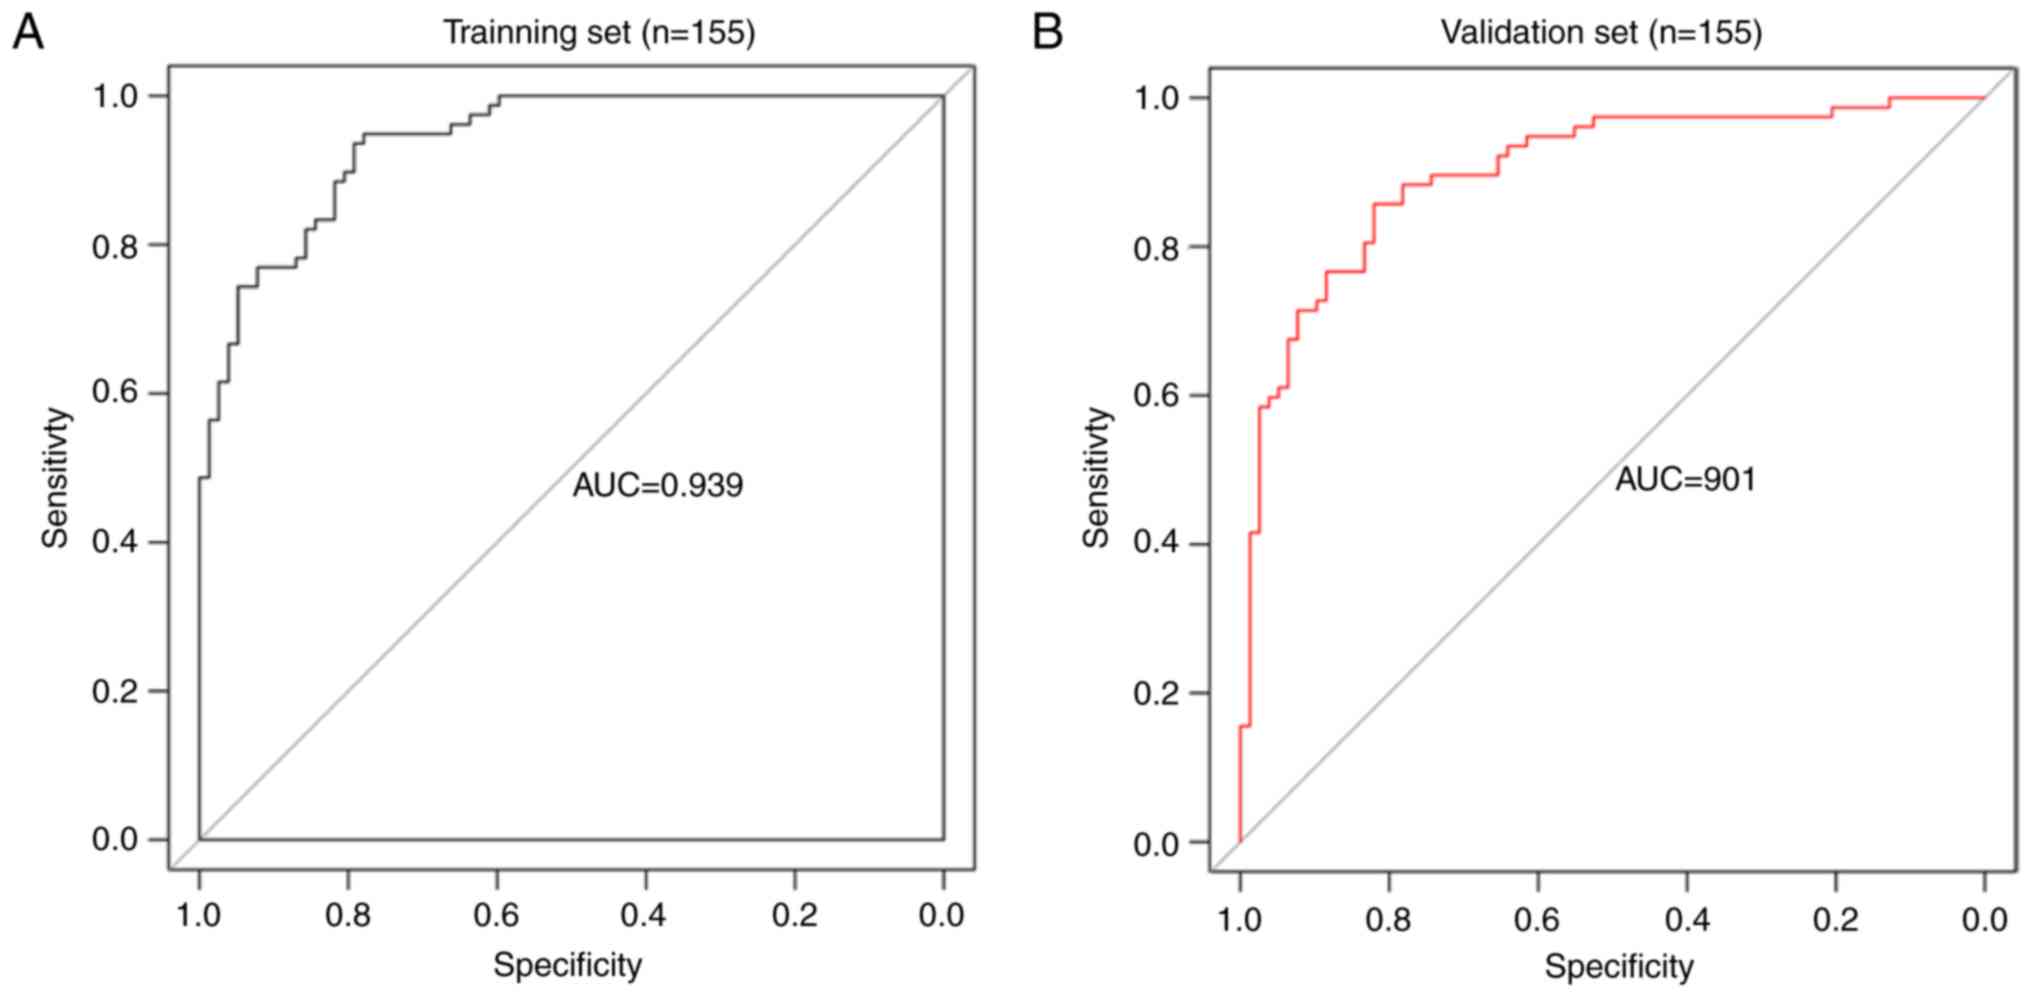
Assessment of the risk model
The performance of the 5-miRNA signature risk model
was evaluated by constructing a time-independent ROC curve.
Fig. 5 displays the ROC curves and
AUCs of the risk model. The AUC for the training and validation
sets was 0.939 and 0.901, respectively (Fig. 5A and B). These results indicate the
high performance and prognostic ability of the 5-miRNA signature
risk model in predicting high- and low-risk patients with STAD.
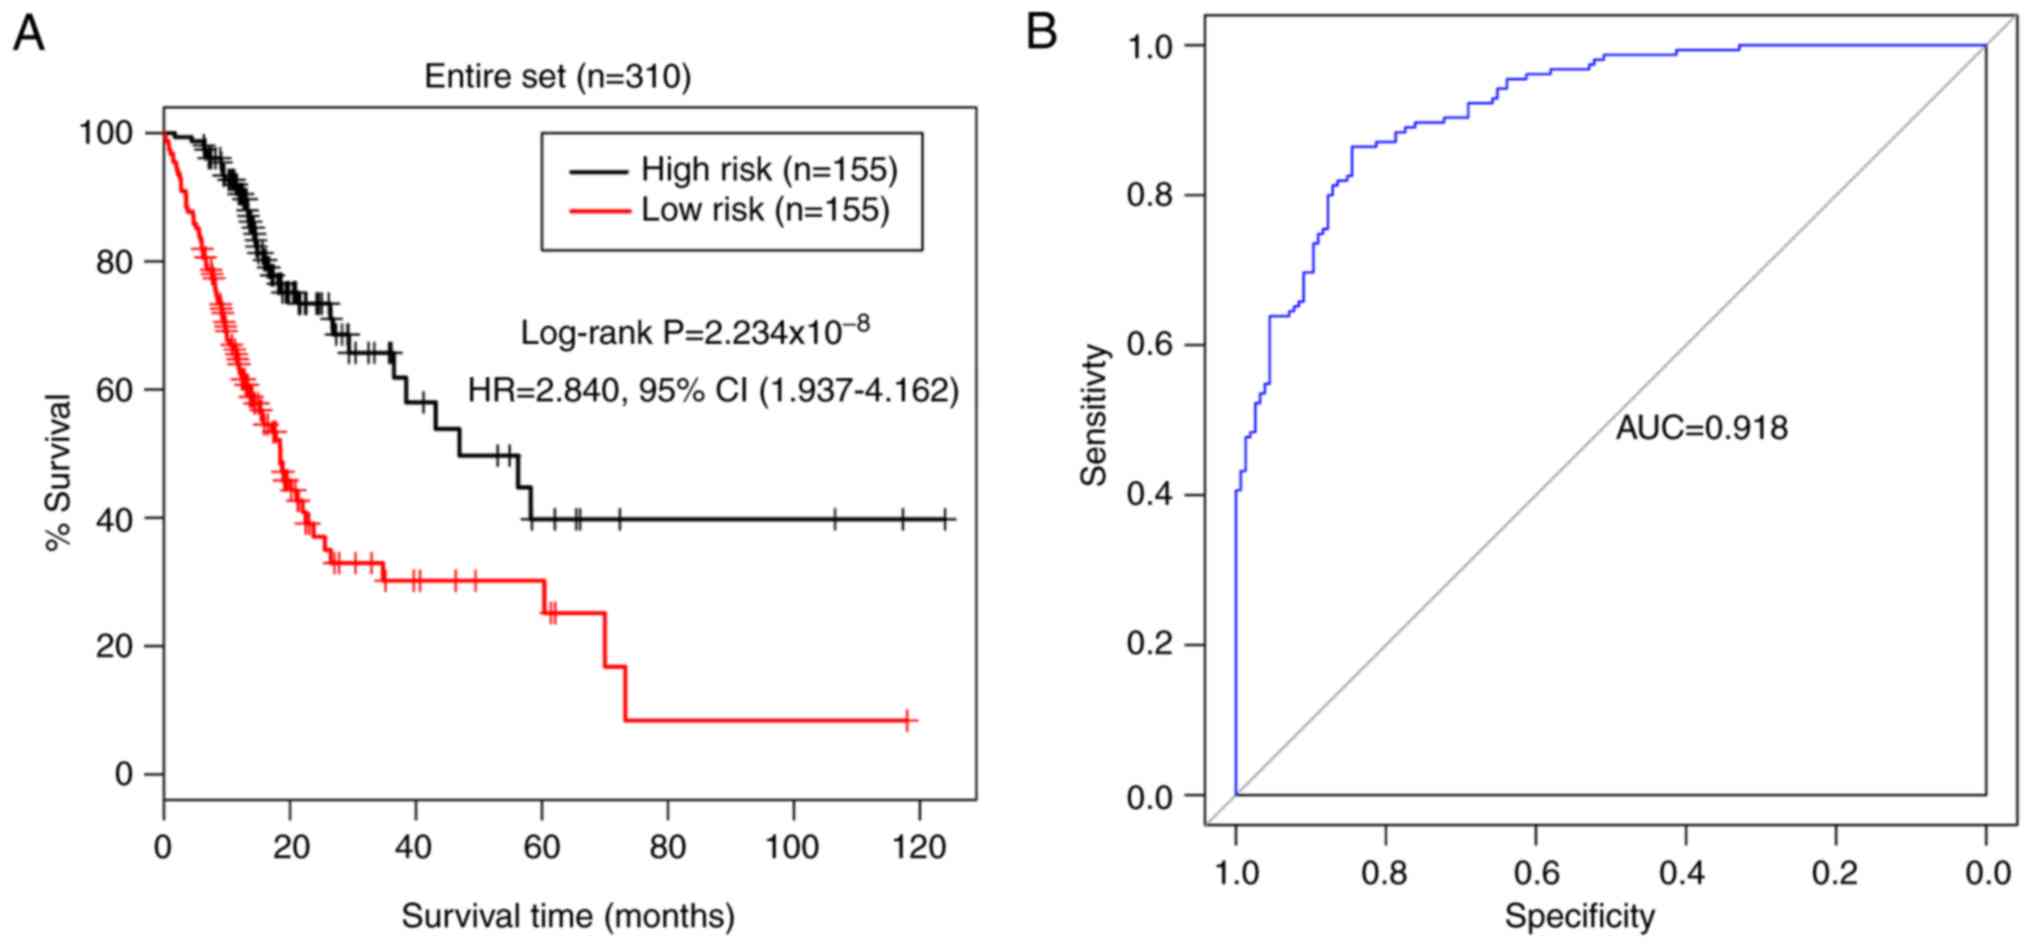
Validation of the entire cohort
A similar risk stratification was revealed when the
5-miRNA signature was applied to the entire TCGA STAD cohort
(Fig. 6). The training and
validation cohorts were pooled together and all patients were
assigned into low- (n=155) and high-risk (n=155) groups, based on
the 5-miRNA signature risk score of the patients. The Kaplan-Meier
log-rank test revealed that the patients in the low-risk group had
significantly longer survival times than those in the high-risk
group (HR, 2.840; 95% CI, 1.937–4.162; P<0.01; Fig. 6A). The AUC of risk model for the
entire cohort was 0.918 (Fig. 6B),
demonstrating the predictive power of the 5-miRNA signature
prognostic model in estimating the overall survival time of
patients with STAD.
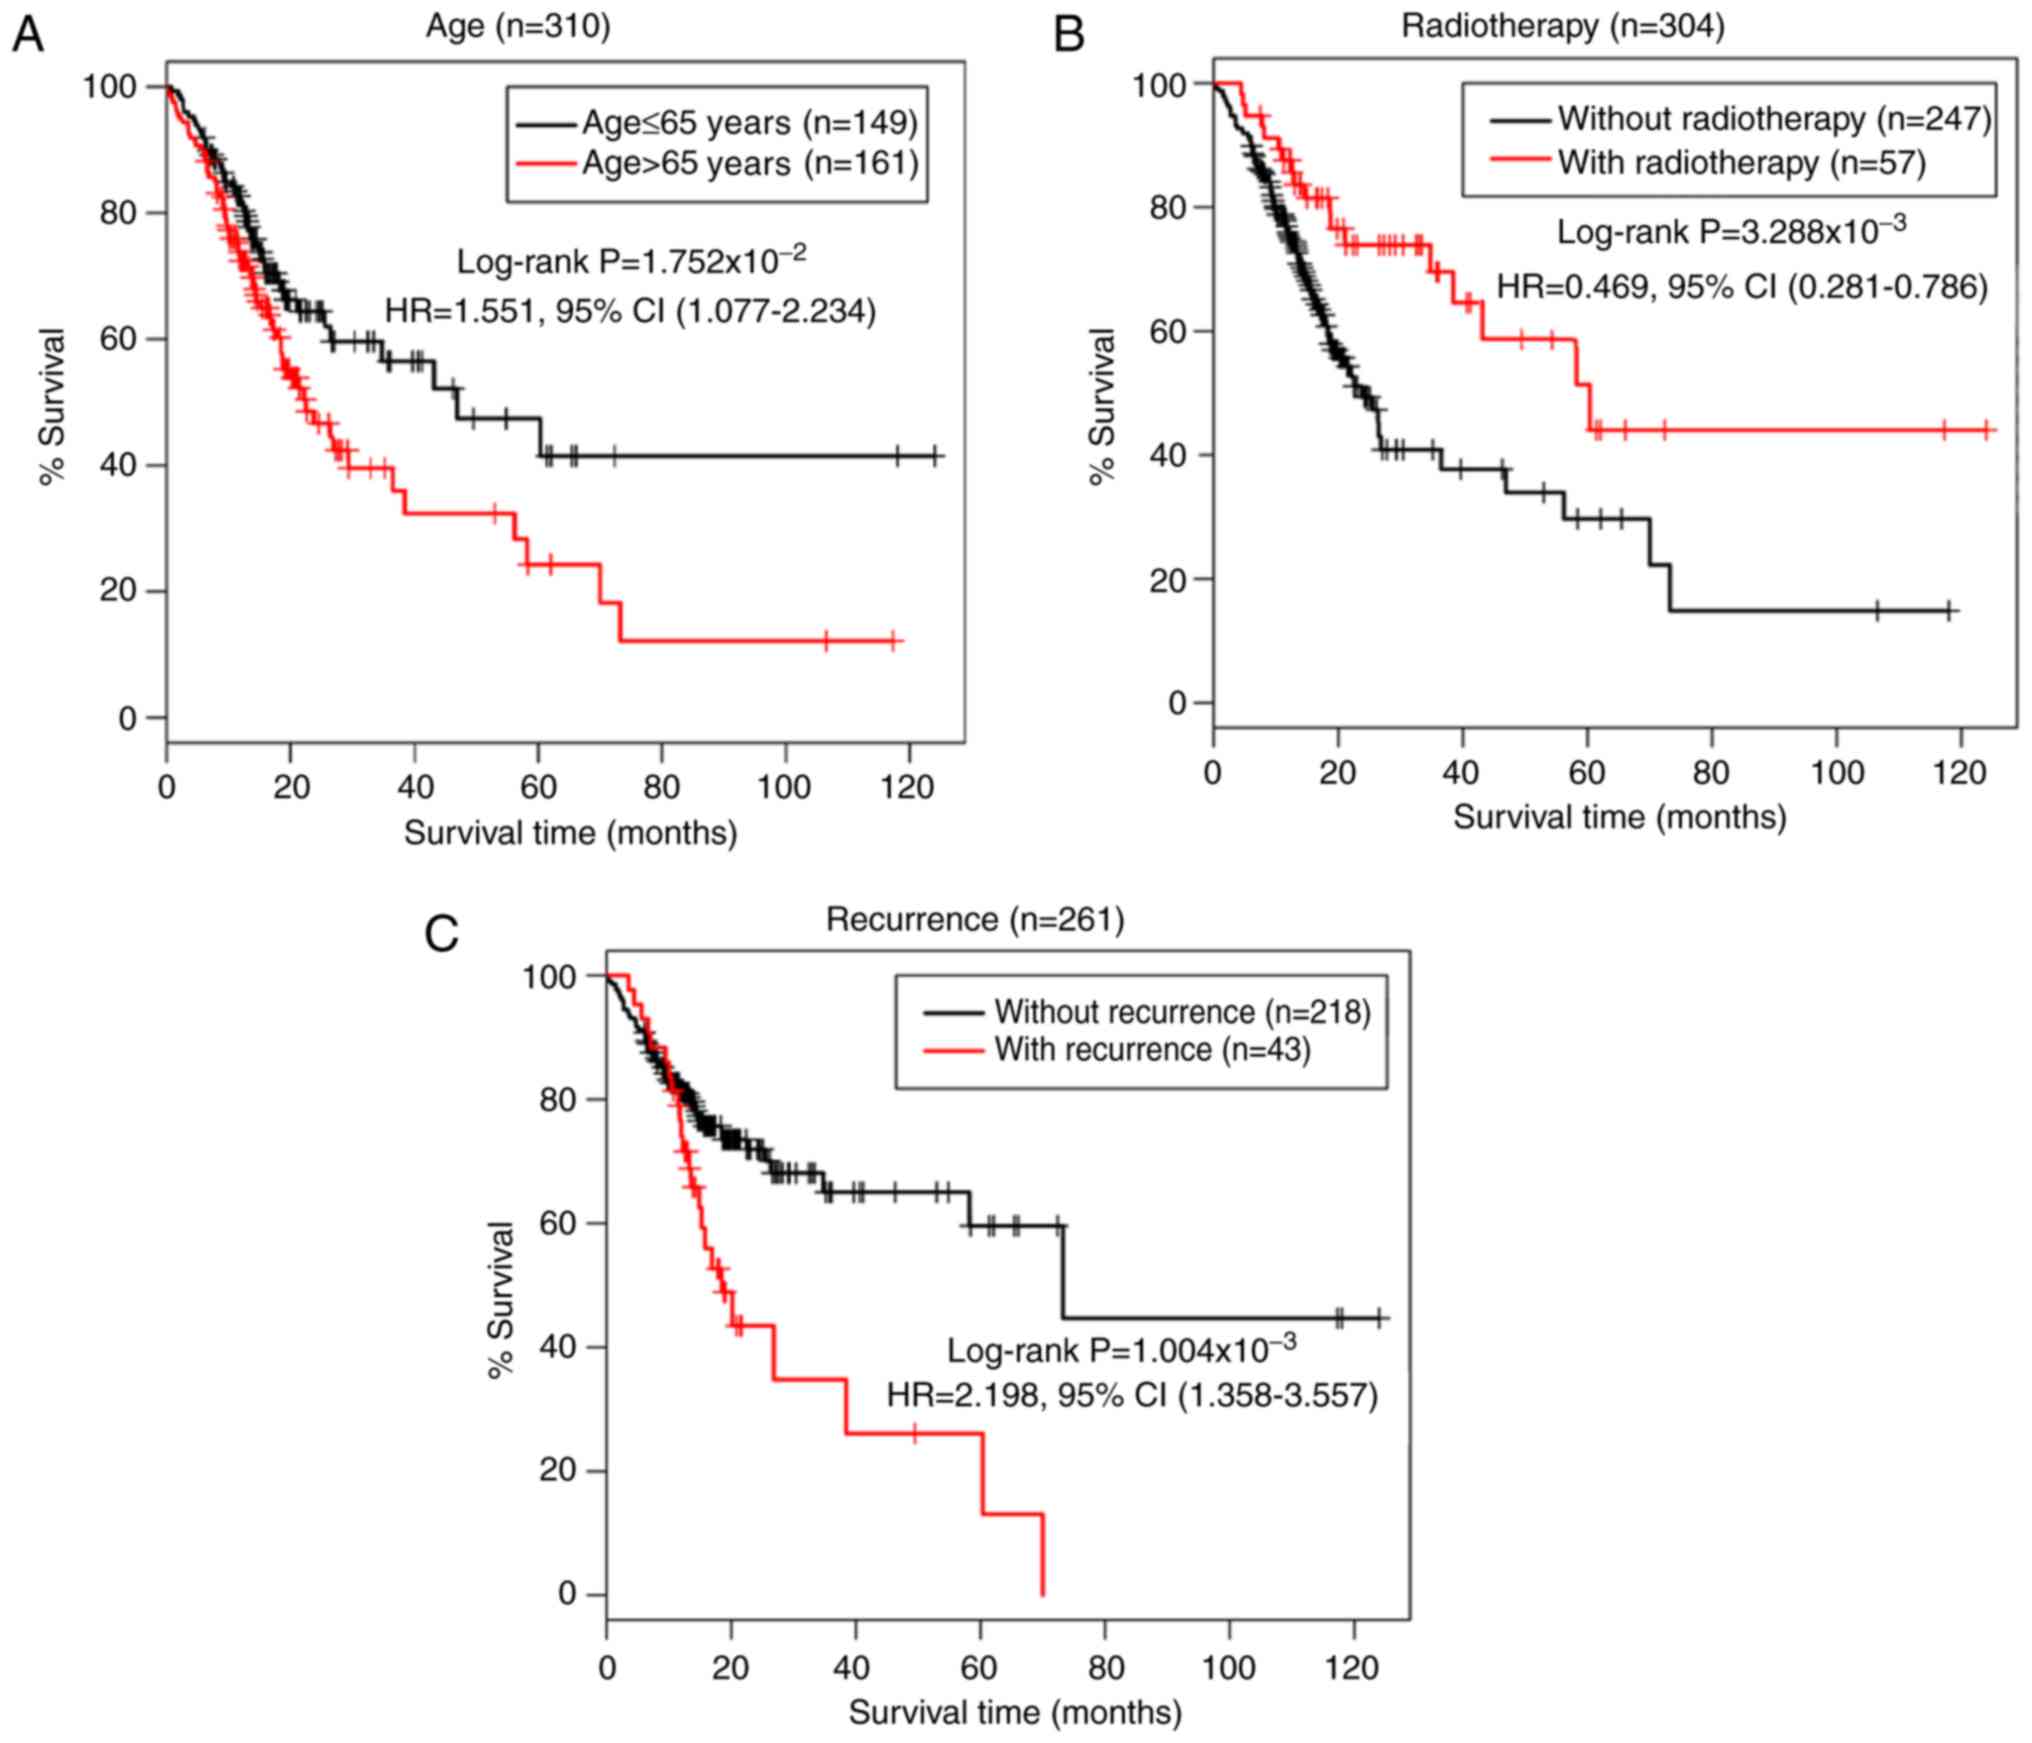
Prognostic value of clinical
variables
The prognostic values of clinical variables were
analyzed using univariate and multivariate Cox regression analyses
(Table III). Overall, 7 of these
parameters, including age, radiotherapy, pathological
differentiation, classification, stage and recurrence, were
identified in the univariate analysis. The multivariate analysis
ultimately identified 3 independent prognostic clinical variables
as risk factors, including age (HR, 1.953; 95% CI, 1.176–3.242;
P=0.010), recurrence (HR, 2.529; 95% CI, 1.491–4.289; P=0.006) and
radiotherapy (HR, 0.410; 95% CI, 0.198–0.849; P=0.016) (Table III; Fig. 7).
| Table III.Analysis of the prognostic value of
clinical variables in the entire tested dataset (n=310) of patients
with stomach adenocarcinoma. |
Table III.
Analysis of the prognostic value of
clinical variables in the entire tested dataset (n=310) of patients
with stomach adenocarcinoma.
|
| Univariate
analysis | Multivariate
analysis |
|---|
|
|
|
|
|---|
| Variables | HR (95% CI) | P-value | HR (95% CI) | P-value |
|---|
| Age, years
(≤65/>65) | 1.551
(1.077–2.234) | 0.018a | 1.953
(1.176–3.242) | 0.010a |
| Sex
(male/female) | 1.462
(0.979–2.182) | 0.061 | N/A | N/A |
| Reflux
(yes/no) | 0.728
(0.375–1.412) | 0.345 | N/A | N/A |
| Anti-reflux
treatment (yes/no) | 0.842
(0.459–1.543) | 0.577 | N/A | N/A |
| H. pylori
infection (yes/no) | 0.435
(0.173–1.092) | 0.069 | N/A | N/A |
| Radiation therapy
(yes/no) | 0.469
(0.281–0.786) | 0.003a | 0.410
(0.198–0.849) | 0.016a |
| Metastasis stage
(M0/M1) | 2.497
(1.301–4.795) | 0.004a | 2.569
(1.115–5.915) | 0.267 |
| Node stage
(N0-N1/N2-N3) | 1.605
(1.116–2.308) | 0.010a | 0.995
(0.507–1.953) | 0.989 |
| Tumor stage
(T1-T2/T3-T4) | 1.661
(1.050–2.627) | 0.028a | 1.703
(0.889–3.259) | 0.108 |
| Pathological stage
(I–II/III–IV) | 1.959
(1.329–2.887) | 0.001a | 1.548
(0.723–3.316) | 0.261 |
| Grade (1/2/3) | 1.323
(0.906–1.933) | 0.146 | N/A | N/A |
| Recurrence
(yes/no/N/A) | 2.198
(1.358–3.557) | 0.001a | 2.529
(1.491–4.289) | 0.001a |
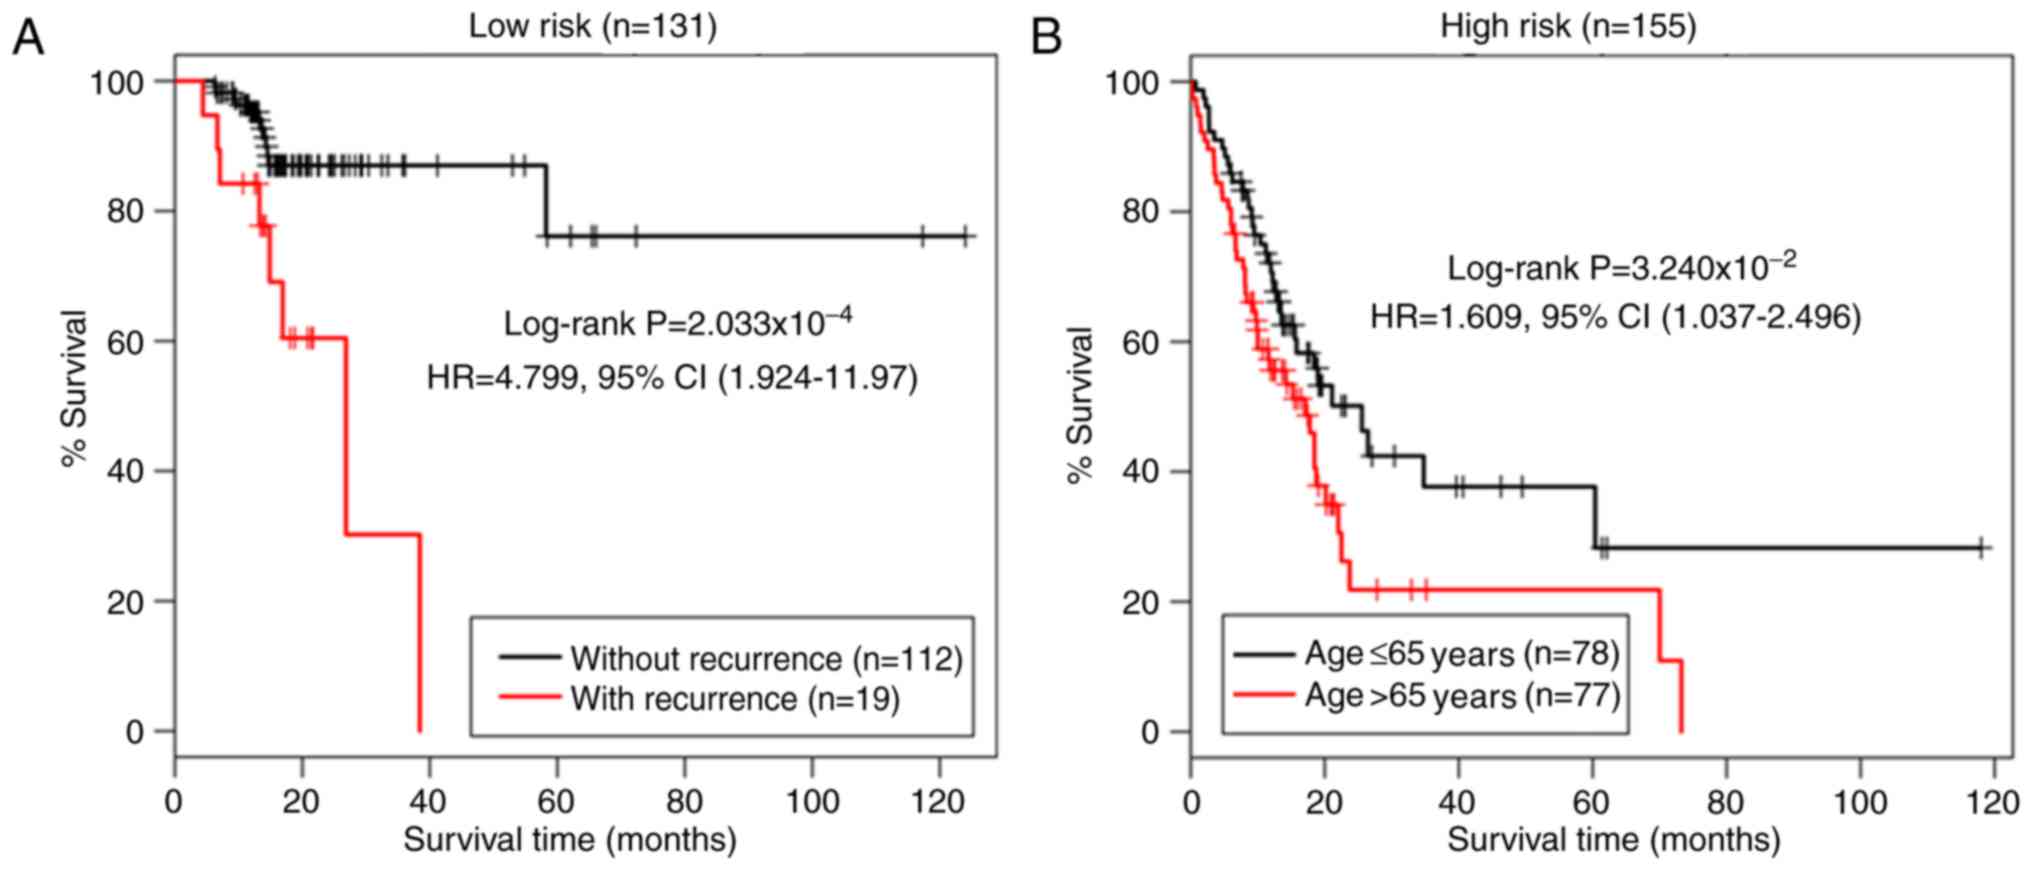
Stratification analysis of the
prognostic clinical variables
Stratification analyses were performed for the 3
independent clinical prognostic variables in the high- and low-risk
groups. The information regarding tumor-node-metastasis stage,
neoplasm histological grade and pathological stage of the tumors
was obtained from TCGA. All patients were assigned into high-
(n=155) and low-risk (n=155) groups, according to their 5-miRNA
signature risk score. In the univariate analysis, radiotherapy,
pathological stage and recurrence were significant risk factors in
the low-risk group; whereas age, pathological node status and
pathological stage were significant in the high-risk group
(P<0.05; Table IV). In the
multivariate analysis, recurrence (HR, 3.852; 95% CI, 1.439–10.313;
P=0.007) and age (HR, 1.696; 95% CI, 1.081–2.660; P=0.022) were the
only significant prognostic variables in the low- and high-risk
groups, respectively.
| Table IV.Stratification analysis of the
prognostic value of clinical variables in low-risk and high-risk
group. |
Table IV.
Stratification analysis of the
prognostic value of clinical variables in low-risk and high-risk
group.
|
| Low risk group
(n=155) | High risk group
(n=155) |
|---|
|
|
|
|
|---|
|
| Univariate
analysis | Multivariate
analysis | Univariate
analysis | Multivariate
analysis |
|---|
|
|
|
|
|
|
|---|
| Variables | HR (95% CI) | P-value | HR (95% CI) | P-value | HR (95% CI) | P-value | HR (95% CI) | P-value |
|---|
| Age, years
(≤65/>65) | 1.936
(0.980–3.824) | 0.053 | N/A | N/A | 1.609
(1.037–2.496) | 0.032a | 1.696
(1.081–2.660) | 0.022a |
| Sex
(male/female) | 1.704
(0.806–3.599) | 0.158 | N/A | N/A | 1.331
(0.826–2.144) | 0.239 | N/A | N/A |
| Reflux
(yes/no) | 0.806
(0.241–2.692) | 0.725 | N/A | N/A | 0.703
(0.314–1.574) | 0.389 | N/A | N/A |
| Anti-reflux
treatment (yes/no) | 1.324
(0.503–3.484) | 0.568 | N/A | N/A | 0.475
(0.198–1.141) | 0.089 | N/A | N/A |
| H. pylori
infection (yes/no) | 0.487
(0.145–1.638) | 0.236 | N/A | N/A | 0.476
(0.114–1.986) | 0.297 | N/A | N/A |
| Radiation therapy
(yes/no) | 0.388
(0.165–0.912) | 0.025a | 0.455
(0.123–1.676) | 0.236 | 0.639
(0.336–1.217) | 0.169 | N/A | N/A |
| Metastasis stage
(M0/M1) | 4.707
(1.401–5.821) | 0.006a | 3.808
(0.785–18.466) | 0.397 | 1.847
(0.842–4.052) | 0.126 | N/A | N/A |
| Node stage
(N0-N1/N2-N3) | 1.570
(0.831–2.965) | 0.161 | N/A | N/A | 1.676
(1.071–2.621) | 0.022a | 1.200
(0.675–2.135) | 0.534 |
| Tumor stage
(T1-T2/T3-T4) | 1.670
(0.736–3.789) | 0.215 | N/A | N/A | 1.736
(0.965–3.122) | 0.062 | N/A | N/A |
| Pathological stage
(I–II/III–IV) |
2.136(1.063–4.293) | 0.029a | 2.106
(0.686–6.460) | 0.193 | 1.960
(1.219–3.150) | 0.005a | 1.699
(0.917–3.147) | 0.092 |
| Grade (1/2/3) |
1.087(0.577–2.047) | 0.797 | N/A | N/A | 1.374
(0.848–2.226) | 0.195 | N/A | N/A |
| Recurrence
(yes/no/N/A) | 4.799
(1.924–11.97) | 0.000a | 3.852
(1.439–10.313) | 0.007a | 1.397
(0.784–2.49) | 0.255 | N/A | N/A |
The Kaplan-Meier survival analyses revealed that
patients without recurrence in the low-risk group survived longer
than those with recurrence (HR, 4.799; 95% CI, 1.924–11.970;
P<0.01; Fig. 8A), and patients
aged >65 years in the high-risk group had notably shorter
survival times than those ≤65 years old (HR, 1.609; 95% CI,
1.037–2.196; P=0.032; Fig. 8B).
Together, the findings suggest that age and recurrence are
independent risk factors for patients with STAD with higher and
lower risk scores, respectively.
Functional characteristics of the
prognostic miRNAs
Since the 5-miRNA signature was calculated to be an
independent risk factor for patients with STAD, a functional
analysis was performed on the targets of the 5 prognostic DEmiRs.
The corresponding mRNA-seq data from patients in the high- and
low-risk groups were downloaded and a total of 244 DEGs
(FDR<0.05 and |log2FC|≥0.5; Fig. 9A) were identified, as were 86
predicted targets of the 5 prognostic DEmiRs using TargetScan. The
244 DEGs are listed in Table SII.
The miRNA-mRNA regulatory network was comprised of 91 nodes and 119
interactions (Fig. 9B). The GSEA
KEGG pathway enrichment analysis revealed 4 pathways involving
target genes, including ‘T cell receptor signaling pathway’
(P=0.011), ‘Cytokine cytokine receptor interaction’ (P=0.011),
‘Cell adhesion molecules (CAMs)’ (P=0.021) and ‘Toll-like receptor
signaling pathway’ (P=0.029) (Table
V), indicating the potential roles of the 5 prognostic DEmiRs
and their targets in the development of STAD.
| Table V.Significant GSEA KEGG pathways
associated with target genes of the 5 prognostic microRNAs. |
Table V.
Significant GSEA KEGG pathways
associated with target genes of the 5 prognostic microRNAs.
| Pathway | ES | NES | NOM P-value | Genes |
|---|
| ‘T cell receptor
signaling pathway’ | 0.508 | 1.692 | 0.011 | ITK, PIK3CD, CD8B,
CD8A, CD3G, CD3E, CD3D, RASGRP1,ZAP70, CARD11 |
| ‘Cytokine cytokine
receptor interaction’ | −0.399 | −1.710 | 0.011 | CXCL6, CSF3, CXCL5,
BMP2, IL6, IL1B |
| ‘Cell adhesion
molecules’ | 0.561 | 1.537 | 0.021 | ITGAL, CD2, CD6,
ITGB7, CD8B, CD8A |
| ‘Toll like receptor
signaling pathway’ | −0.646 | −1.503 | 0.029 | IL6, IL1B |
Discussion
Outcome-associated molecular signatures have
implications on prognosis and the molecular mechanisms underlying
diseases and cancer types (34–37).
In the present study, a comprehensive analysis of miRNA expression
profiles was performed on TCGA datasets from patients with STAD. A
5-miRNA prognostic signature with prediction power for survival was
identified using Cox regression analysis and sample splitting
techniques. Of the 5 miRNAs, 3 (hsa-mir-1255a, hsa-mir-3687 and
hsa-mir-9-3) were associated with short survival times, and 2
(hsa-mir-548o and hsa-mir-7-2) were associated with longer survival
times in patients with STAD. The performance and prognostic ability
of the 5-miRNA risk model was determined using a 155-sample TCGA
validation cohort. Furthermore, the 5-miRNA signature, patient age
and tumor recurrence were revealed to be independent risk factors
for patients with STAD.
It has been reported that the incidence of gastric
cancer rises progressively with age. The risk and occurrence of
gastric cancer are low in individuals <30 years old, and they
gradually increase with age, peaking at >50 years old (5,10,11,38,39).
Studies have reported that older age (>60 years) and H.
pylori infection are independent risk factors for gastric
cancer, and that H. pylori infection is more prevalent in
individuals of older ages (10,11).
Several studies have reported that the eradication of H.
pylori infection led to a lower incidence and recurrence of
gastric cancer (40–42). It has been demonstrated that
recurrence of malignancies affects the prognosis of patients
(11,43). Local recurrence of malignant tumors
may be associated with distant tumor metastasis, poor overall
survival time and mortality (44–46).
In the present study, the stratification analysis of patients with
high and low risk scores suggested that age and recurrence were
independent risk factors of a poor overall survival time in
patients with high and low 5-miRNA signature risk scores,
respectively. These findings support the high performance and
prognostic power of the 5-miRNA signature risk model in predicting
the overall survival time of patients with STAD.
Numerous oncogenic and tumor-suppressor genes,
miRNAs, lncRNAs and individual signatures have been identified and
demonstrated to be diagnostic or prognostic markers for patients
with many types of cancer, including gastric cancer (13,16,47,48).
In the present study, a 5-miRNA signature (hsa-mir-1255a,
hsa-mir-3687, hsa-mir-9-3, hsa-mir-548o and hsa-mir-7-2) was
identified as an independent prognostic predictor of survival time
in patients with STAD. Among these 5 miRNAs, downregulated miR-9-3
in human colorectal cancer (CRC) (49), hsa-mir-548o in glioblastoma
(50) and hsa-mir-7-2 in thyroid
cancer (51) had been identified,
as well as upregulated hsa-mir-1255a in cirrhotic hepatocellular
carcinoma (52), hsa-mir-3687 in
prostate cancer cell lines (53)
and hsa-mir-7-2 in renal cell carcinoma (54). To the best of our knowledge, no
study has reported either the association of these miRNAs with the
prognosis of patients with cancer, or their association with STAD.
The performance of the 5-miRNA risk model in predicting the
survival time of high-risk patients suggests that the 5-miRNA
signature is a novel prognostic marker in STAD.
In the prediction of the targets of the identified 5
miRNAs, Kelch repeat and BTB domain-containing protein 11 (KBTBD11)
and calcium/calmodulin-dependent protein kinase type 1D (CAMK1D)
were two common targets of hsa-mir-1255a and hsa-mir-3687 (Fig. 9). KBTBD11 has been reported to
function as a putative tumor suppressor in CRC, with its knockdown
leading to enhanced CRC cell proliferation (55). Gong et al (55) demonstrated that the KBTBD11
polymorphism rs11777210 regulates the binding with Myc
proto-oncogene protein, a transcription factor that negatively
regulates the expression of KBTBD11 (56). One study reported the elevation of
CAMK1D in metastatic breast cancer, with its upregulation in breast
epithelial cells triggering cell proliferation,
epithelial-mesenchymal transition, migration and invasion
abilities, and reduced cell adhesion (57). The upregulation of CAMK1D in gastric
adenocarcinoma has been reported following gene expression analysis
using a DNA microarray (58). These
studies imply the oncogenic potential of KBTBD11 inhibition and
CAMK1D expression. In addition, Fussek et al (53) revealed that miR-3687 was involved in
cell cycle regulation and was elevated in the
G0/G1 phase. In the present study, the
upregulation of the KBTBD11 and CAMK1D genes was demonstrated in
STAD samples (fold-change >0.7). Furthermore, CAMK1D was
confirmed to be downregulated by the protective miRNA hsa-mir-548o
(Fig. 9). These results indicate
the complex and important roles of hsa-mir-548o, hsa-mir-1255a and
hsa-mir-3687 in STAD development.
Krüppel-like factor 12 (KLF12) is a transcription
repressor and a known participating factor in the progression of
human gastric cancer (59).
Nakamura et al (59)
reported that KLF12 mRNA levels were associated with tumor size and
progression of gastric cancer. The study demonstrated that KLF12
enhanced gastric cancer cell proliferation and invasion, and the
selective knockdown of KLF12 in gastric cancer HGC27 cells,
resulted into marked proliferation arrest by deregulating the
expression of proliferation-associated genes. miR-137 is frequently
inhibited in gastric cancer (60).
It has been reported that miR-137 expression inhibits cell
proliferation and migration and arrests cell cycle at the
G0/G1 phase in gastric cancer cells by
regulating KLF12 (61).
Furthermore, Mak et al (62)
demonstrated that KLF12 was regulated by miR-141, and the knockdown
of KLF12 promoted cell proliferation, tumor growth, metastasis and
anoikis resistance in ovarian cancer cells. In the present study,
KLF12 was revealed to be regulated by two miRNA risk factors
(hsa-mir-1255a and hsa-mir-9-3) and two protective miRNAs
(hsa-mir-548o and hsa-mir-7-2). The target mRNAs of these 5 miRNAs
were associated with the ‘Cell adhesion molecules (CAMs)’ pathway.
These findings imply the complex mechanisms underlying
KLF12-mediated cell proliferation, which may contribute to STAD
prognosis.
In conclusion, the present study identified a novel
5-miRNA signature risk model (hsa-mir-1255a, hsa-mir-3687,
hsa-mir-9-3, hsa-mir-548o and hsa-mir-7-2) with prominent
performance in predicting high risk scores and the overall survival
time of patients with STAD. These circulating miRNAs may be
monitored as risk factors (hsa-mir-1255a, hsa-mir-3687, and
hsa-mir-9-3) or protective indicators (hsa-mir-548o and
hsa-mir-7-2) with prognostic ability in patients with STAD. Future
efforts should focus on uncovering the molecular mechanism
associated with the 5-miRNA signature in STAD.
Supplementary Material
Supporting Data
Supporting Data
Acknowledgements
Not applicable.
Funding
No funding was received.
Availability of data and materials
The genomic datasets and primary clinical materials
analyzed in the present study are all available on The Cancer
Genome Atlas (TCGA) database (https://gdc-portal.nci.nih.gov/). All data generated
or analyzed during this study are included in this published
article.
Authors' contributions
HX was involved in the study conception and design,
and in revising the manuscript. RZ, LZ and XX performed the data
mining, data analysis and drafting the manuscript. LZ performed the
statistical analysis. All authors read and approved the final
version of the manuscript.
Ethics approval and consent to
participate
Not applicable.
Patient consent for publication
Not applicable.
Competing interests
The authors declare that they have no competing
interests.
References
|
1
|
Huang Z, Zhu D, Wu L, He M, Zhou X, Zhang
L, Zhang H, Wang W, Zhu J, Cheng W, et al: Six serum-based miRNAs
as potential diagnostic biomarkers for gastric cancer. Cancer
Epidemiol Biomarkers Prev. 26:188–196. 2016. View Article : Google Scholar : PubMed/NCBI
|
|
2
|
Chen W, Zheng R, Baade PD, Zhang S, Zeng
H, Bray F, Jemal A, Yu XQ and He J: Cancer statistics in China,
2015. CA Cancer J Clin. 66:115–132. 2016. View Article : Google Scholar : PubMed/NCBI
|
|
3
|
Torre LA, Bray F, Siegel RL, Ferlay J,
Lortet-Tieulent J and Jemal A: Global cancer statistics, 2012. CA
Cancer J Clin. 65:87–108. 2015. View Article : Google Scholar : PubMed/NCBI
|
|
4
|
Rugge M, Meggio A, Pravadelli C,
Barbareschi M, Fassan M, Gentilini M, Zorzi M, Pretis G, Graham DY
and Genta RM: Gastritis staging in the endoscopic follow-up for the
secondary prevention of gastric cancer: A 5-year prospective study
of 1755 patients. Gut. 68:11–17. 2019. View Article : Google Scholar : PubMed/NCBI
|
|
5
|
Karimi P, Islami F, Anandasabapathy S,
Freedman ND and Kamangar F: Gastric cancer: Descriptive
epidemiology, risk factors, screening, and prevention. Cancer
Epidemiol Biomarkers Prev. 23:700–713. 2014. View Article : Google Scholar : PubMed/NCBI
|
|
6
|
Ohtsu A, Shah MA, Van Cutsem E, Rha SY,
Sawaki A, Park SR, Lim HY, Yamada Y, Wu J, Langer B, et al:
Bevacizumab in combination with chemotherapy as first-line therapy
in advanced gastric cancer: A randomized, double-blind,
placebo-controlled phase III study. J Clin Oncol. 29:3968–3976.
2011. View Article : Google Scholar : PubMed/NCBI
|
|
7
|
Shen S, Bai J, Wei Y, Wang G, Li Q, Zhang
R, Duan W, Yang S, Du M, Zhao Y, et al: A seven-gene prognostic
signature for rapid determination of head and neck squamous cell
carcinoma survival. Oncol Rep. 38:3403–3411. 2017.PubMed/NCBI
|
|
8
|
Meng Z, Sun Y, Sun Y, Xu W, Zhang Z, Zhao
H, Zhong Z and Sun J: Comprehensive analysis of lncRNA expression
profiles reveals a novel lncRNA signature to discriminate
nonequivalent outcomes in patients with ovarian cancer. Oncotarget.
7:32433–32448. 2016.PubMed/NCBI
|
|
9
|
Parsonnet J, Friedman GD, Vandersteen DP,
Chang Y, Vogelman JH, Orentreich N and Sibley RK: Helicobacter
pylori Infection and the risk of gastric carcinoma. N Engl J
Med. 325:1127–1131. 1991. View Article : Google Scholar : PubMed/NCBI
|
|
10
|
Neugut AI, Hayek M and Howe G:
Epidemiology of gastric cancer. World J Gastroenterol.
23:2812006.
|
|
11
|
Kwon YH, Heo J, Lee HS, Cho CM and Jeon
SW: Failure of Helicobacter pylori eradication and age are
independent risk factors for recurrent neoplasia after endoscopic
resection of early gastric cancer in 283 patients. Aliment
Pharmacol Ther. 39:609–618. 2014. View Article : Google Scholar : PubMed/NCBI
|
|
12
|
Alexandrov LB, Nik-Zainal S, Siu HC, Leung
SY and Stratton MR: A mutational signature in gastric cancer
suggests therapeutic strategies. Nat Commun. 6:86832015. View Article : Google Scholar : PubMed/NCBI
|
|
13
|
Zhu C, Ren C, Han J, Ding Y, Du J, Dai N,
Dai J, Ma H, Hu Z, Shen H, et al: A five-microRNA panel in plasma
was identified as potential biomarker for early detection of
gastric cancer. Br J Cancer. 110:2291–2299. 2014. View Article : Google Scholar : PubMed/NCBI
|
|
14
|
Ellmark P, Ingvarsson J, Carlsson A,
Lundin BS, Wingren C and Borrebaeck CA: Identification of protein
expression signatures associated with Helicobacter pylori
infection and gastric adenocarcinoma using recombinant antibody
microarrays. Mol Cell Proteomics. 5:1638–1646. 2006. View Article : Google Scholar : PubMed/NCBI
|
|
15
|
Zhu X, Tian X, Yu C, Shen C, Yan T, Hong
J, Wang Z, Fang JY and Chen H: A long non-coding RNA signature to
improve prognosis prediction of gastric cancer. Mol Cancer.
15:602016. View Article : Google Scholar : PubMed/NCBI
|
|
16
|
Shin VY, Ng EK, Chan VW, Kwong A and Chu
KM: A three-miRNA signature as promising non-invasive diagnostic
marker for gastric cancer. Mol Cancer. 14:2022015. View Article : Google Scholar : PubMed/NCBI
|
|
17
|
Gong J, Cui Z, Li L, Ma Q, Wang Q, Gao Y
and Sun H: MicroRNA-25 promotes gastric cancer proliferation,
invasion, and migration by directly targeting F-box and WD-40
Domain Protein 7, FBXW7. Tumor Biol. 36:7831–7840. 2015. View Article : Google Scholar
|
|
18
|
Ren C, Wang W, Han C, Chen H, Fu D, Luo Y,
Yao H, Wang D, Ma L, Zhou L, et al: Expression and prognostic value
of miR-92a in patients with gastric cancer. Tumor Biol.
37:9483–9491. 2016. View Article : Google Scholar
|
|
19
|
Zhang Y, Wang B, Jin W and Hu C: Reduction
of miR-132-3p contributes to gastric cancer proliferation mainly by
targeting MUC13. Int J Clin Experimental Med. 9:8023–8030.
2016.
|
|
20
|
Li T, Lu YY, Zhao XD, Guo HQ, Liu CH, Li
H, Zhou L, Han YN, Wu KC, Nie YZ, et al: MicroRNA-296-5p increases
proliferation in gastric cancer through repression of
Caudal-related homeobox 1. Oncogene. 33:783–793. 2014. View Article : Google Scholar : PubMed/NCBI
|
|
21
|
Gorur A, Balci Fidanci S, Dogruer Unal N,
Ayaz L, Akbayir S, Yildirim Yaroglu H, Dirlik M, Serin MS and Tamer
L: Determination of plasma microRNA for early detection of gastric
cancer. Mol Biol Rep. 40:2091–2096. 2013. View Article : Google Scholar : PubMed/NCBI
|
|
22
|
Bandres E, Bitarte N, Arias F, Agorreta J,
Fortes P, Agirre X, Zarate R, Diaz-Gonzalez JA, Ramirez N, Sola JJ,
et al: microRNA-451 regulates macrophage migration inhibitory
factor production and proliferation of gastrointestinal cancer
cells. Clin Cancer Res. 15:2281–2290. 2009. View Article : Google Scholar : PubMed/NCBI
|
|
23
|
Chen H, Ren C, Han C, Wang D, Chen Y and
Fu D: Expression and prognostic value of miR-486-5p in patients
with gastric adenocarcinoma. PLoS One. 10:e01193842015. View Article : Google Scholar : PubMed/NCBI
|
|
24
|
Robinson MD, Mccarthy DJ and Smyth GK:
edgeR: A Bioconductor package for differential expression analysis
of digital gene expression data. Bioinformatics. 26:139–140. 2010.
View Article : Google Scholar : PubMed/NCBI
|
|
25
|
Wang L, Cao C, Ma Q, Zeng Q, Wang H, Cheng
Z, Zhu G, Qi J, Ma H, Nian H, et al: RNA-seq analyses of multiple
meristems of soybean: Novel and alternative transcripts,
evolutionary and functional implications. BMC Plant Biol.
14:1692014. View Article : Google Scholar : PubMed/NCBI
|
|
26
|
Eisen MB, Spellman PT, Brown PO and
Botstein D: Cluster analysis and display of genome-wide expression
patterns. Proc Natl Acad Sci USA. 95:14863–14868. 1998. View Article : Google Scholar : PubMed/NCBI
|
|
27
|
Wang P, Wang Y, Hang B, Zou X and Mao JH:
A novel gene expression-based prognostic scoring system to predict
survival in gastric cancer. Oncotarget. 7:55343–55351.
2016.PubMed/NCBI
|
|
28
|
Camp RL, Dolledfilhart M and Rimm DL:
X-tile: A new bio-informatics tool for biomarker assessment and
outcome-based cut-point optimization. Clin Cancer Res.
10:7252–7259. 2004. View Article : Google Scholar : PubMed/NCBI
|
|
29
|
Chen L, Wen Y, Zhang J, Sun W, Lui VW, Wei
Y, Chen F and Wen W: Prediction of radiotherapy response with a
5-microRNA signature-based nomogram in head and neck squamous cell
carcinoma. Cancer Med. 7:726–735. 2018. View Article : Google Scholar : PubMed/NCBI
|
|
30
|
Huang K, Sun H, Li X, Hu T, Yang R, Wang
S, Jia Y, Chen Z, Tang F, Shen J, et al: Prognostic risk model
development and prospective validation among patients with cervical
cancer stage IB2 to IIB submitted to neoadjuvant chemotherapy. Sci
Rep. 6:275682016. View Article : Google Scholar : PubMed/NCBI
|
|
31
|
Agarwal V, Bell GW, Nam JW and Bartel DP:
Predicting effective microRNA target sites in mammalian mRNAs.
Elife. 42015.doi: 10.7554/eLife.05005.
|
|
32
|
Shannon P, Markiel A, Ozier O, Baliga NS,
Wang JT, Ramage D, Amin N, Schwikowski B and Ideker T: Cytoscape: A
software environment for integrated models of biomolecular
interaction networks. Genome Res. 13:2498–2504. 2003. View Article : Google Scholar : PubMed/NCBI
|
|
33
|
Subramanian A, Tamayo P, Mootha VK,
Mukherjee S, Ebert BL, Gillette MA, Paulovich A, Pomeroy SL, Golub
TR, Lander ES and Mesirov JP: Gene set enrichment analysis: A
knowledge-based approach for interpreting genome-wide expression
profiles. Proc Natl Acad Sci USA. 102:15545–15550. 2005. View Article : Google Scholar : PubMed/NCBI
|
|
34
|
Bonome T, Levine DA, Shih J, Randonovich
M, Pise-Masison CA, Bogomolniy F, Ozbun L, Brady J, Barrett JC,
Boyd J, et al: A gene signature predicting for survival in
suboptimally debulked patients with ovarian cancer. Cancer Res.
68:5478–5486. 2008. View Article : Google Scholar : PubMed/NCBI
|
|
35
|
Spentzos D, Levine DA, Ramoni MF, Joseph
M, Gu X, Boyd J, Libermann TA and Cannistra SA: Gene expression
signature with independent prognostic significance in epithelial
ovarian cancer. J Clin Oncol. 22:4700–4710. 2004. View Article : Google Scholar : PubMed/NCBI
|
|
36
|
Ong CW, Maxwell P, Alvi MA, McQuaid S,
Waugh D, Mills I and Salto-Tellez M: A gene signature associated
with PTEN activation defines good prognosis intermediate risk
prostate cancer cases. J Pathol Clin Res. 4:103–113. 2018.
View Article : Google Scholar : PubMed/NCBI
|
|
37
|
Weiler S, Wolf T, Pinna F, Roessler S,
Lutz T, Wan S, Marquardt J, Lang H, Schirmacher P and Breuhahn K:
Abstract 4269: A gene signature defines chromosomal instability
(CIN) and poor survival in liver cancer patients. Cancer Res.
75:4269. 2015. View Article : Google Scholar
|
|
38
|
Daniyal M, Ahmad S, Ahmad M, Asif HM,
Akram M, Ur Rehman S and Sultana S: Risk factors and epidemiology
of gastric cancer in Pakistan. Asian Pac J Cancer Prev.
16:4821–4824. 2015. View Article : Google Scholar : PubMed/NCBI
|
|
39
|
Ong HS and Smithers BM: Epidemiology of
gastric cancer. Cancer Rev Asia Pacific. 2:1–7. 2012. View Article : Google Scholar
|
|
40
|
Uemura N, Mukai T, Okamoto S, Yamaguchi S,
Mashiba H, Taniyama K, Sasaki N, Haruma K, Sumii K and Kajiyama G:
Effect of Helicobacter pylori eradication on subsequent development
of cancer after endoscopic resection of early gastric cancer.
Cancer Epidemiol Biomarkers Prev. 6:639–642. 1997.PubMed/NCBI
|
|
41
|
Lee YC, Chiang TH, Chou CK, Tu YK, Liao
WC, Wu MS and Graham DY: Association between Helicobacter
pylori eradication and gastric cancer incidence: A systematic
review and Meta-analysis. Gastroenterology. 150:1113–1124.e5. 2016.
View Article : Google Scholar : PubMed/NCBI
|
|
42
|
Bae SE, Jung HY, Kang J, Park YS, Baek S,
Jung JH, Choi JY, Kim MY, Ahn JY, Choi KS, et al: Effect of
Helicobacter pylori eradication on metachronous recurrence
after endoscopic resection of gastric neoplasm. Am J Gastroenterol.
109:60–67. 2014. View Article : Google Scholar : PubMed/NCBI
|
|
43
|
Viganò L, Capussotti L, Lapointe R,
Barroso E, Hubert C, Giuliante F, Ijzermans JN, Mirza DF, Elias D
and Adam R: Early recurrence after liver resection for colorectal
metastases: Risk factors, prognosis, and treatment. A
LiverMetSurvey-based study of 6,025 patients. Ann Surg Oncol.
21:1276–1286. 2014. View Article : Google Scholar : PubMed/NCBI
|
|
44
|
Van GM, Verslegers I, Biltjes I and
Parizel PM: MR is/is not a useful diagnostic tool for breast cancer
management. Acta Chir Belg. 107:267–270. 2007. View Article : Google Scholar : PubMed/NCBI
|
|
45
|
Shan J, Zhang S, Wang Z, Fu Y, Li L and
Wang X: Breast malignant phyllodes tumor with rare pelvic
metastases and long-term overall survival: A case report and
literature review. Medicine. 95:e49422016. View Article : Google Scholar : PubMed/NCBI
|
|
46
|
Hohaus K, Kostler EJ, Klemm E and Wollina
U: Merkel cell carcinoma-a retrospective analysis of 17 cases. J
Eur Acad Dermatol Venereol. 17:20–24. 2003. View Article : Google Scholar : PubMed/NCBI
|
|
47
|
Li X, Zhang Y, Zhang Y, Ding J, Wu K and
Fan D: Survival prediction of gastric cancer by a seven-microRNA
signature. Gut. 59:579–585. 2010. View Article : Google Scholar : PubMed/NCBI
|
|
48
|
Liu R, Zhang C, Hu Z, Li G, Wang C, Yang
C, Huang D, Chen X, Zhang H, Zhuang R, et al: A five-microRNA
signature identified from genome-wide serum microRNA expression
profiling serves as a fingerprint for gastric cancer diagnosis. Eur
J Cancer. 47:784–791. 2011. View Article : Google Scholar : PubMed/NCBI
|
|
49
|
Bandres E, Agirre X, Bitarte N, Ramirez N,
Zarate R, Roman-Gomez J, Prosper F and Garcia-Foncillas J:
Epigenetic regulation of microRNA expression in colorectal cancer.
Int J Cancer. 125:2737–2743. 2009. View Article : Google Scholar : PubMed/NCBI
|
|
50
|
Roth P, Wischhusen J, Happold C, Chandran
PA, Hofer S, Eisele G, Weller M and Keller A: A specific miRNA
signature in the peripheral blood of glioblastoma patients. J
Neurochem. 118:449–457. 2011. View Article : Google Scholar : PubMed/NCBI
|
|
51
|
Zhang X, Jhiang S, Fernandez S and Coombes
K: miR-551b and SEMA3D as potential therapeutic targets in
papillary thyroid cancer. Translational Data Analytics @ Ohio
State. November 14–2016http://hdl.handle.net/1811/79454
|
|
52
|
Fittipaldi S, Vasuri F, Bonora S,
Degiovanni A, Santandrea G, Cucchetti A, Gramantieri L, Bolondi L
and D'Errico A: miRNA signature of hepatocellular carcinoma
vascularization: How the controls can influence the signature. Dig
Dis Sci. 62:2397–2407. 2017. View Article : Google Scholar : PubMed/NCBI
|
|
53
|
Fussek S, Rönnau C, Span PN, Burchardt M,
Verhaegh GW and Schalken JA: 246 The castration-resistant prostate
cancer-associated miRNAs, miR-3687 and miR-4417, are involved in
tumour cell hypoxia response and tumour cell migration. Eur Urol
Suppl. 15:e246. 2016. View Article : Google Scholar
|
|
54
|
Gottardo F, Liu CG, Ferracin M, Calin GA,
Fassan M, Bassi P, Sevignani C, Byrne D, Negrini M, Pagano F, et
al: Micro-RNA profiling in kidney and bladder cancers. Urol Oncol.
25:387–392. 2007. View Article : Google Scholar : PubMed/NCBI
|
|
55
|
Gong J, Tian J, Lou J, Wang X, Ke J, Li J,
Yang Y, Gong Y, Zhu Y, Zou D, et al: A polymorphic MYC response
element in KBTBD11 influences colorectal cancer risk, especially in
interaction with a MYC regulated SNP rs6983267. Ann Oncol.
29:632–639. 2018. View Article : Google Scholar : PubMed/NCBI
|
|
56
|
Dang CV, Resar LM, Emison E, Kim S, Li Q,
Prescott JE, Wonsey D and Zeller K: Function of the c-Myc oncogenic
transcription factor. Exp Cell Res. 253:63–77. 1999. View Article : Google Scholar : PubMed/NCBI
|
|
57
|
Bergamaschi A, Kim YH, Kwei KA, La Choi Y,
Bocanegra M, Langerød A, Han W, Noh DY, Huntsman DG, Jeffrey SS, et
al: CAMK1D amplification implicated in epithelial-mesenchymal
transition in basal-like breast cancer. Mol Oncol. 2:327–339. 2008.
View Article : Google Scholar : PubMed/NCBI
|
|
58
|
Marimuthu A: Identification and validation
of differentially expressed genes in gastric Adenocarcinoma.
Manipal University. 2012, http://shodhganga.inflibnet.ac.in/handle/10603/4994
|
|
59
|
Nakamura Y, Migita T, Hosoda F, Okada N,
Gotoh M, Arai Y, Fukushima M, Ohki M, Miyata S, Takeuchi K, et al:
Krüppel-like factor 12 plays a significant role in poorly
differentiated gastric cancer progression. Int J Cancer.
125:1859–1867. 2009. View Article : Google Scholar : PubMed/NCBI
|
|
60
|
Chen Q, Chen X, Zhang M, Fan Q, Luo S and
Cao X: miR-137 is frequently down-regulated in gastric cancer and
is a negative regulator of Cdc42. Dig Dis Sci. 56:2009–2016. 2011.
View Article : Google Scholar : PubMed/NCBI
|
|
61
|
Du Y, Chen Y, Wang F and Gu L: miR-137
plays tumor suppressor roles in gastric cancer cell lines by
targeting KLF12 and MYO1C. Tumour Biol. 37:13557–13569. 2016.
View Article : Google Scholar : PubMed/NCBI
|
|
62
|
Mak CS, Yung MM, Hui LM, Leung LL, Liang
R, Chen K, Liu SS, Qin Y, Leung TH, Lee KF, et al: MicroRNA-141
enhances anoikis resistance in metastatic progression of ovarian
cancer through targeting KLF12/Sp1/survivin axis. Mol Cancer.
16:112017. View Article : Google Scholar : PubMed/NCBI
|