Introduction
Hepatocellular carcinoma (HCC) is one of the main
causes of tumor-associated mortality, being the fifth most common
malignancy worldwide (1). In 2018,
the number of new cases and liver cancer-associated mortalities was
841,080 and 781,631, respectively, worldwide (2). Many risk factors, including dietary
aflatoxin exposure (3), hepatitis B
and C virus (HBV) infection (4) and
cirrhosis, contribute to the initiation and progression of HCC. To
date, many diagnostic and treatment procedures, including
ultrasound, computed tomography, liver resection, liver
transplantation, radiofrequency, thermal and non-thermal ablation,
trans-arterial chemoembolization (5), immunotherapies and therapeutic cancer
vaccines (4), have been used for
patients with HCC. However, the prognosis of HCC is remains poor
and the 5-year relative survival rate is ~12% due to tumor
metastasis and recurrence (6,7). Due
to the characteristics of systemic disease, the evolution and
progression of HCC involves deregulation of genes, cells and
tissues (1). Therefore, it is
crucial to identify novel biomarkers that may be involved in the
course of tumor metastasis and recurrence, for early diagnosis and
recurrence prediction for HCC.
Phospholipase C (PLC) is encoded by four genes,
PLCA, PLCB, PLCC and PLCD, and is involved in the
pathogenesis of several bacterial infections, including
Clostridium perfringens, Listeria monocytogene, and
Pseudomonas aeruginosa (8,9). The
activity of PLCA and PLCB in L. monocytogenes appears to
overlap in the course of intracellular infection (10). In Listeria, three genes,
PLCA, PLCB and PLCC, are clustered together on the
same chromosome, whereas the PCLD gene is located in another
region (11,12). Under the transcriptional control of
PrfA regulator, PLCA, PLCB and HLY (encoding
listeriolysin O precursor) have a role encoding the Listeria
Pathogenicity Island 1, leading to the escape from endocytic and
secondary vacuoles (13–15). PLCB isoforms in mice include
PLCB1, PLCB2, PLCB3 and PLCB4, which are stimulated
by G protein activation (Gαq/11 and/or Gβγ) (16,17).
The roles of PLCB isoforms in immune defense and escape, and their
functions in tumors are currently being investigated. PLCB1
has been reported to be associated with HCC prognosis in tumor
proliferation (1) and an aberrant
expression pattern has been reported in patients with schizophrenia
(18). The PLCB2 and
PLCB4 genes were found to be differentially expressed in
human breast cancer MCF-7 cells, and to be associated with
multidrug resistance using RNA-seq technology (19). PLCB3 has been reported to be
regulated by multiple protein kinases and to control hormonal
signaling (20).
HBV infection is regarded as a main risk factor for
the development of HCC (4). HBV is
classified into ten genotypes, from A to J, and >40 associated
sub-genotypes (21). The 10
genotypes are based on an intergroup divergence of ≥8% in the
complete nucleotide sequence; whereas the sub-genotypes are based
on a divergence of 4–7.5% (22,23).
Notably, genotypes A and B are associated with earlier hepatitis B
e antigen seroconversion, less active liver disease, and a slower
rate of progression to cirrhosis and HCC compared with genotypes C
and D (24–27).
Some PLCB isoforms have been explored with regard
their associations with tumor development; therefore, the present
study aimed to explore the association between four PLCB
genes and HCC.
Materials and methods
Patient data collection
The GSE14520 dataset was used for analysis
(ncbi.nlm.nih.gov/geo/query/acc.cgi?acc=GSE14520;
accessed June 10th, 2018) (28,29).
This dataset contains two platforms: GPL571 (GeneChip®
Human Genome U133A 2.0 Array; Thermo Fisher Scientific, Inc.,
Waltham, MA, USA) and GPL3921 (GeneChip® HT Human Genome
U133 Array Plate Set; Thermo Fisher Scientific, Inc.). To avoid a
batch effect, patients from GPL3921 were used. Patients with HBV
infection were used, including a total of 212 patients. In
addition, patient survival, including overall survival (OS) and
recurrence-free survival (RFS), validated findings in the GSE14520
dataset using the Gene Expression Profiling Interactive Analysis
(GEPIA; gepia.cancer-pku.cn/index.html; accessed June 10th,
2018) website with data from The Cancer Genome Atlas (TCGA)
database (30).
Gene, protein and tissue expression,
and the body map
Gene expression, the body map and transcripts per
million of the PLCB genes were collected from the GEPIA
website (gepia.cancer-pku.cn/index.html; accessed June 12th,
2018). Tissue and protein expression of the PLCB genes were
collected from the GTEx portal (gtexportal.org/home/; accessed June 12th, 2018)
(31) and The Human Protein Atlas
(proteinatlas.org/; accessed June 12th, 2018)
(32) websites, respectively.
Gene set enrichment analysis
(GSEA)
GSEA (software.broadinstitute.org/gsea/index.jsp) was
performed to explore potential mechanisms that PLCB genes are
involved in, including biological processes and metabolic pathways.
Datasets of c2.cp.kegg.v6.1.symbols.gmt, c5.bp.b6.1.symbols.gmt,
c5.cc.v6.1.symbols.gmt, c5.mf.v6.1.symbols.gmt and
c5.all.v6.1.symbols.gmt were used to analyze statistically
significant Gene Ontology (GO) terms, including biological process
(BP), cellular component (CC), and molecular function (MF), and
Kyoto Encyclopedia of Genes and Genomes (KEGG) pathways (33,34).
Association and interaction
analysis
The Pearson correlation matrix among PLCB genes was
constructed using R version 3.5.0 (r-project.org/). Pearson correlation and associations
between PLCB gene expression and tumor stage were validated using
the GEPIA website. The co-expression interactive network of
gene-gene interactions was constructed using the geneMANIA plugin
of Cytoscape software version 3.6.0 (35,36).
The protein-protein interaction (PPI) network was constructed using
the STRING (string-db.org/cgi/input.pl, accessed June 20th, 2018)
website (37). GO enrichment
analysis was visualized using the BiNGO plugin of Cytoscape
software version 3.6.0 (38).
Diagnostic and prognostic analysis and
stratified, joint-effect analysis
Diagnostic receiver operating characteristic (ROC)
curves were constructed using the expression of PLCB genes in tumor
and non-tumor tissues. Gene expressions were categorized into two
groups of low and high expression at a cut-off value of median
expression levels. OS and RFS were calculated using the
Kaplan-Meier and Cox proportional hazards regression models.
Statistically significant clinical factors were adjusted for
multivariate Cox models. Then, prognosis-associated genes were
further stratified for analysis by clinical factors. In addition,
prognosis-associated genes were combined for a joint-effect
analysis with α-fetoprotein (AFP) based low and high
expression.
Expression model and nomogram
construction
To further explore prognosis-associated genes for
HCC survival, expression models for OS and RFS prediction were
constructed. Gene expression, patient survival status, expression
heatmaps and prognostic ROC curves were constructed in the model
(39–42). Nomograms for OS and RFS were also
constructed using clinical factors and genes to predict patient
survival probability at 1, 3 and 5 years.
Genome-wide analysis of
prognosis-associated genes
Prognosis-associated genes were further explored in
genome-wide analysis. A cut-off value of 0.4 was determined for
further analysis. The cut-off 0.4 can filter a lot of genes with
weak relationships with PLCB1 and leads to a better presentation of
GO and pathway results compared with other cut-off values.
Gene-gene interactions, and BP, CC and MF were constructed using
Cytoscape software.
Statistical analysis
Unpaired t test was used to analyze expressions of
PLCBs in tumor and non-tumor tissues. Box plots and survival plots
were generated using GraphPad software version 7.0 (GraphPad
Software, Inc., La Jolla, CA, USA). Survival analyses were
performed using SPSS software version 16.0 (SPSS, Inc., Chicago,
IL, USA). Median survival time and log-rank P-value were calculated
by the Kaplan-Meier method, and the 95% confidence interval (CI)
and hazard ratio (HR) were calculated by univariate and
multivariate Cox proportional hazards regression models,
respectively. P<0.05 was considered to indicate a statistically
significant difference.
Results
Demographic and clinical
characteristics
Data from 212 patients (GSE14520) with
HBV-associated HCC were used in the study. AFP, BCLC stage, tumor
size and cirrhosis were associated with OS (P=0.049, P<0.0001,
P=0.002 and P=0.041, respectively). Gender, cirrhosis and BCLC
stage were associated with RFS (P=0.002, P=0.036 and P<0.0001,
respectively). Other factors were not associated with prognosis
(P>0.05; Table SI).
Gene, protein, tissue expressions and
transcription analysis
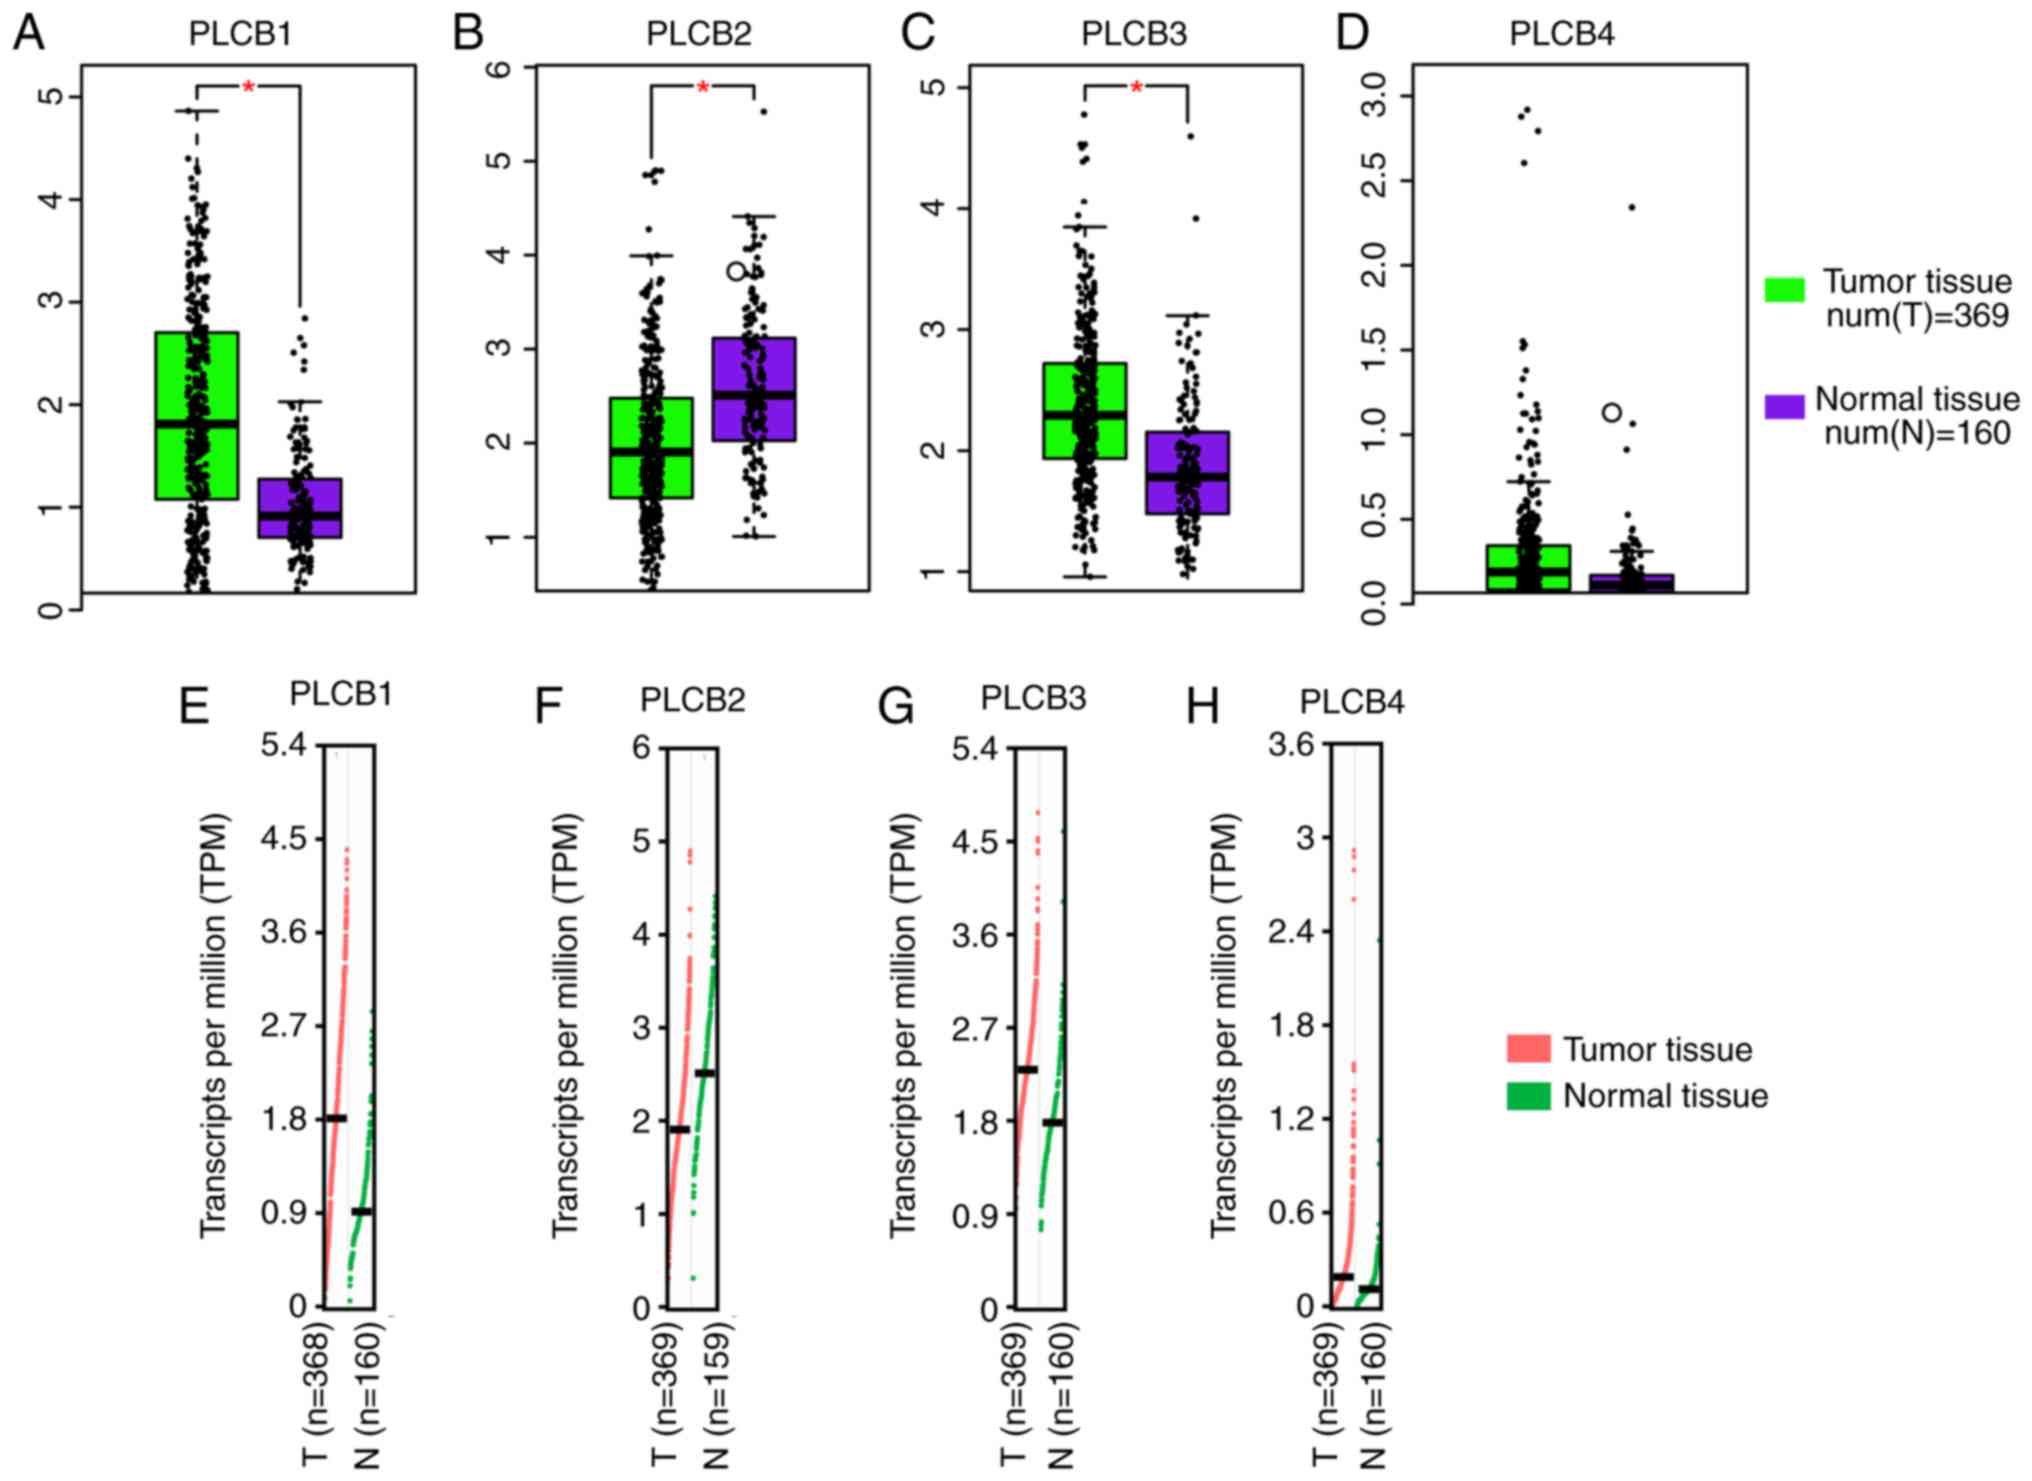
PLCB1 and PLCB3 were highly expressed
in tumor tissues compared with normal tissue, whereas PLCB2
had the opposite result (all P≤0.05; Fig. 1A-C). However, there was no
difference in PLCB4 expression between the tumor and normal
tissue (Fig. 1D). Transcriptional
analysis indicated that PLCB1, PLCB3 and PLCB4
consistently exhibited higher transcripts per millions in tumor
tissues compared with normal tissues (Fig. 1E-H). Tissue and protein expression
of the PLCB genes were collected from the GTEx portal.
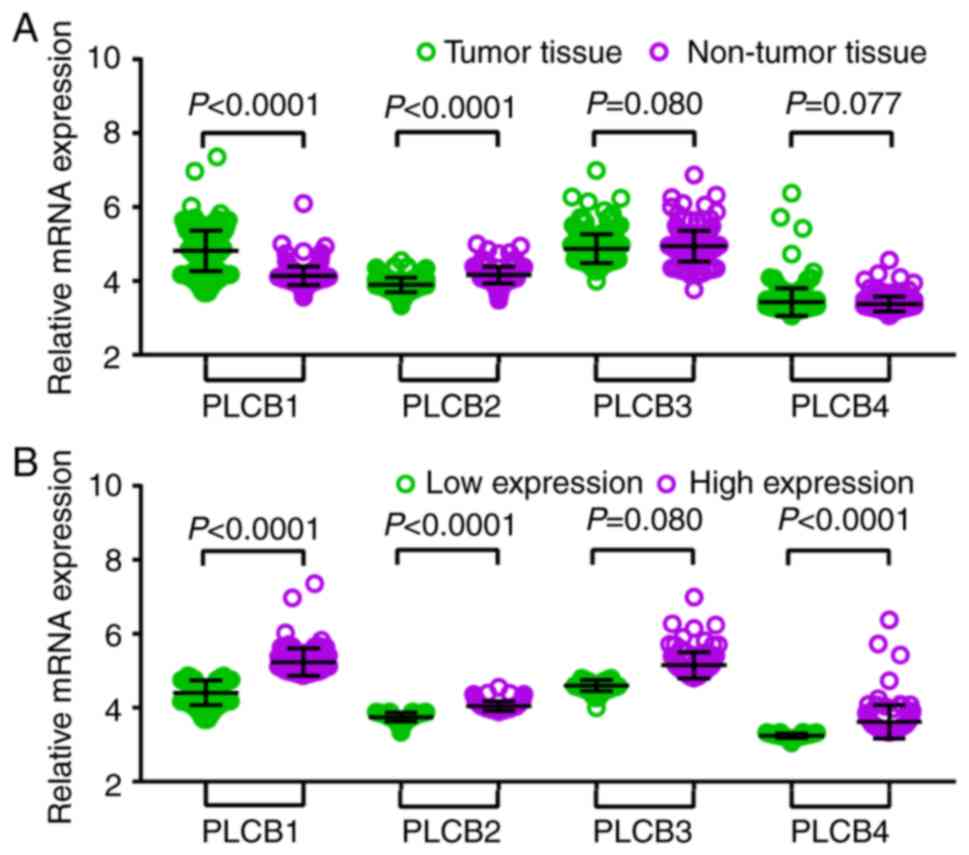
Gene expression levels in 212 patients with HBV-HCC
(GSE14520) indicated that there were significant differences in
PLCB1 and PLCB2 expression between tumor and
non-tumor tissues, whereas there was not difference in PLCB3
and PLCB4 between the samples (Fig. 2A). In addition, when tumor samples
were divided into high and low expression groups using the median
as the cutoff there were significant differences in PLCB1,
PLCB2 and PLCB4; whereas PLCB3 did not exhibit
significance (Fig. 2B). The bodymap
distribution of PLCB genes in different organs is shown in Fig. S1. Protein expression levels
demonstrated that PLCB2 is the most highly expressed of the PLCB
family (Fig. S2). The different
tissue expression levels of PLCB family members demonstrated that
all were expressed at low levels in the liver (Fig. S3).
Diagnostic and prognostic
analysis
In the diagnostic analysis of PLCB genes, PLCB1 and
PLCB2 exhibited diagnostic value for HCC, while PLCB3 showed
potential diagnostic value [P<0.0001, P<0.0001 and P=0.018,
respectively; area under the curve (AUC), 0.869, 0.836 and 0.567,
respectively; Fig. 3A-C]. However,
PLCB4 did not have any diagnostic value (P=0.811; Fig. 3D). In the combined diagnostic
analysis for PLCB1, PLCB2 and PLCB3, the combinations of PLCB1 +
PLCB2, PLCB1 + PLCB3, and PLCB1 + PLCB2 + PLCB3 exhibited
diagnostic value for HCC with an advantage over PLCB1, PLCB2 or
PLCB3 alone (AUC, 0.905, 0.877 and 0.920, respectively; all
P<0.05; Fig. 3E, F and H). The
combination of PLCB2 and PLCB3 exhibited potential diagnostic value
for HCC (AUC, 0.604; P=0.0003; Fig.
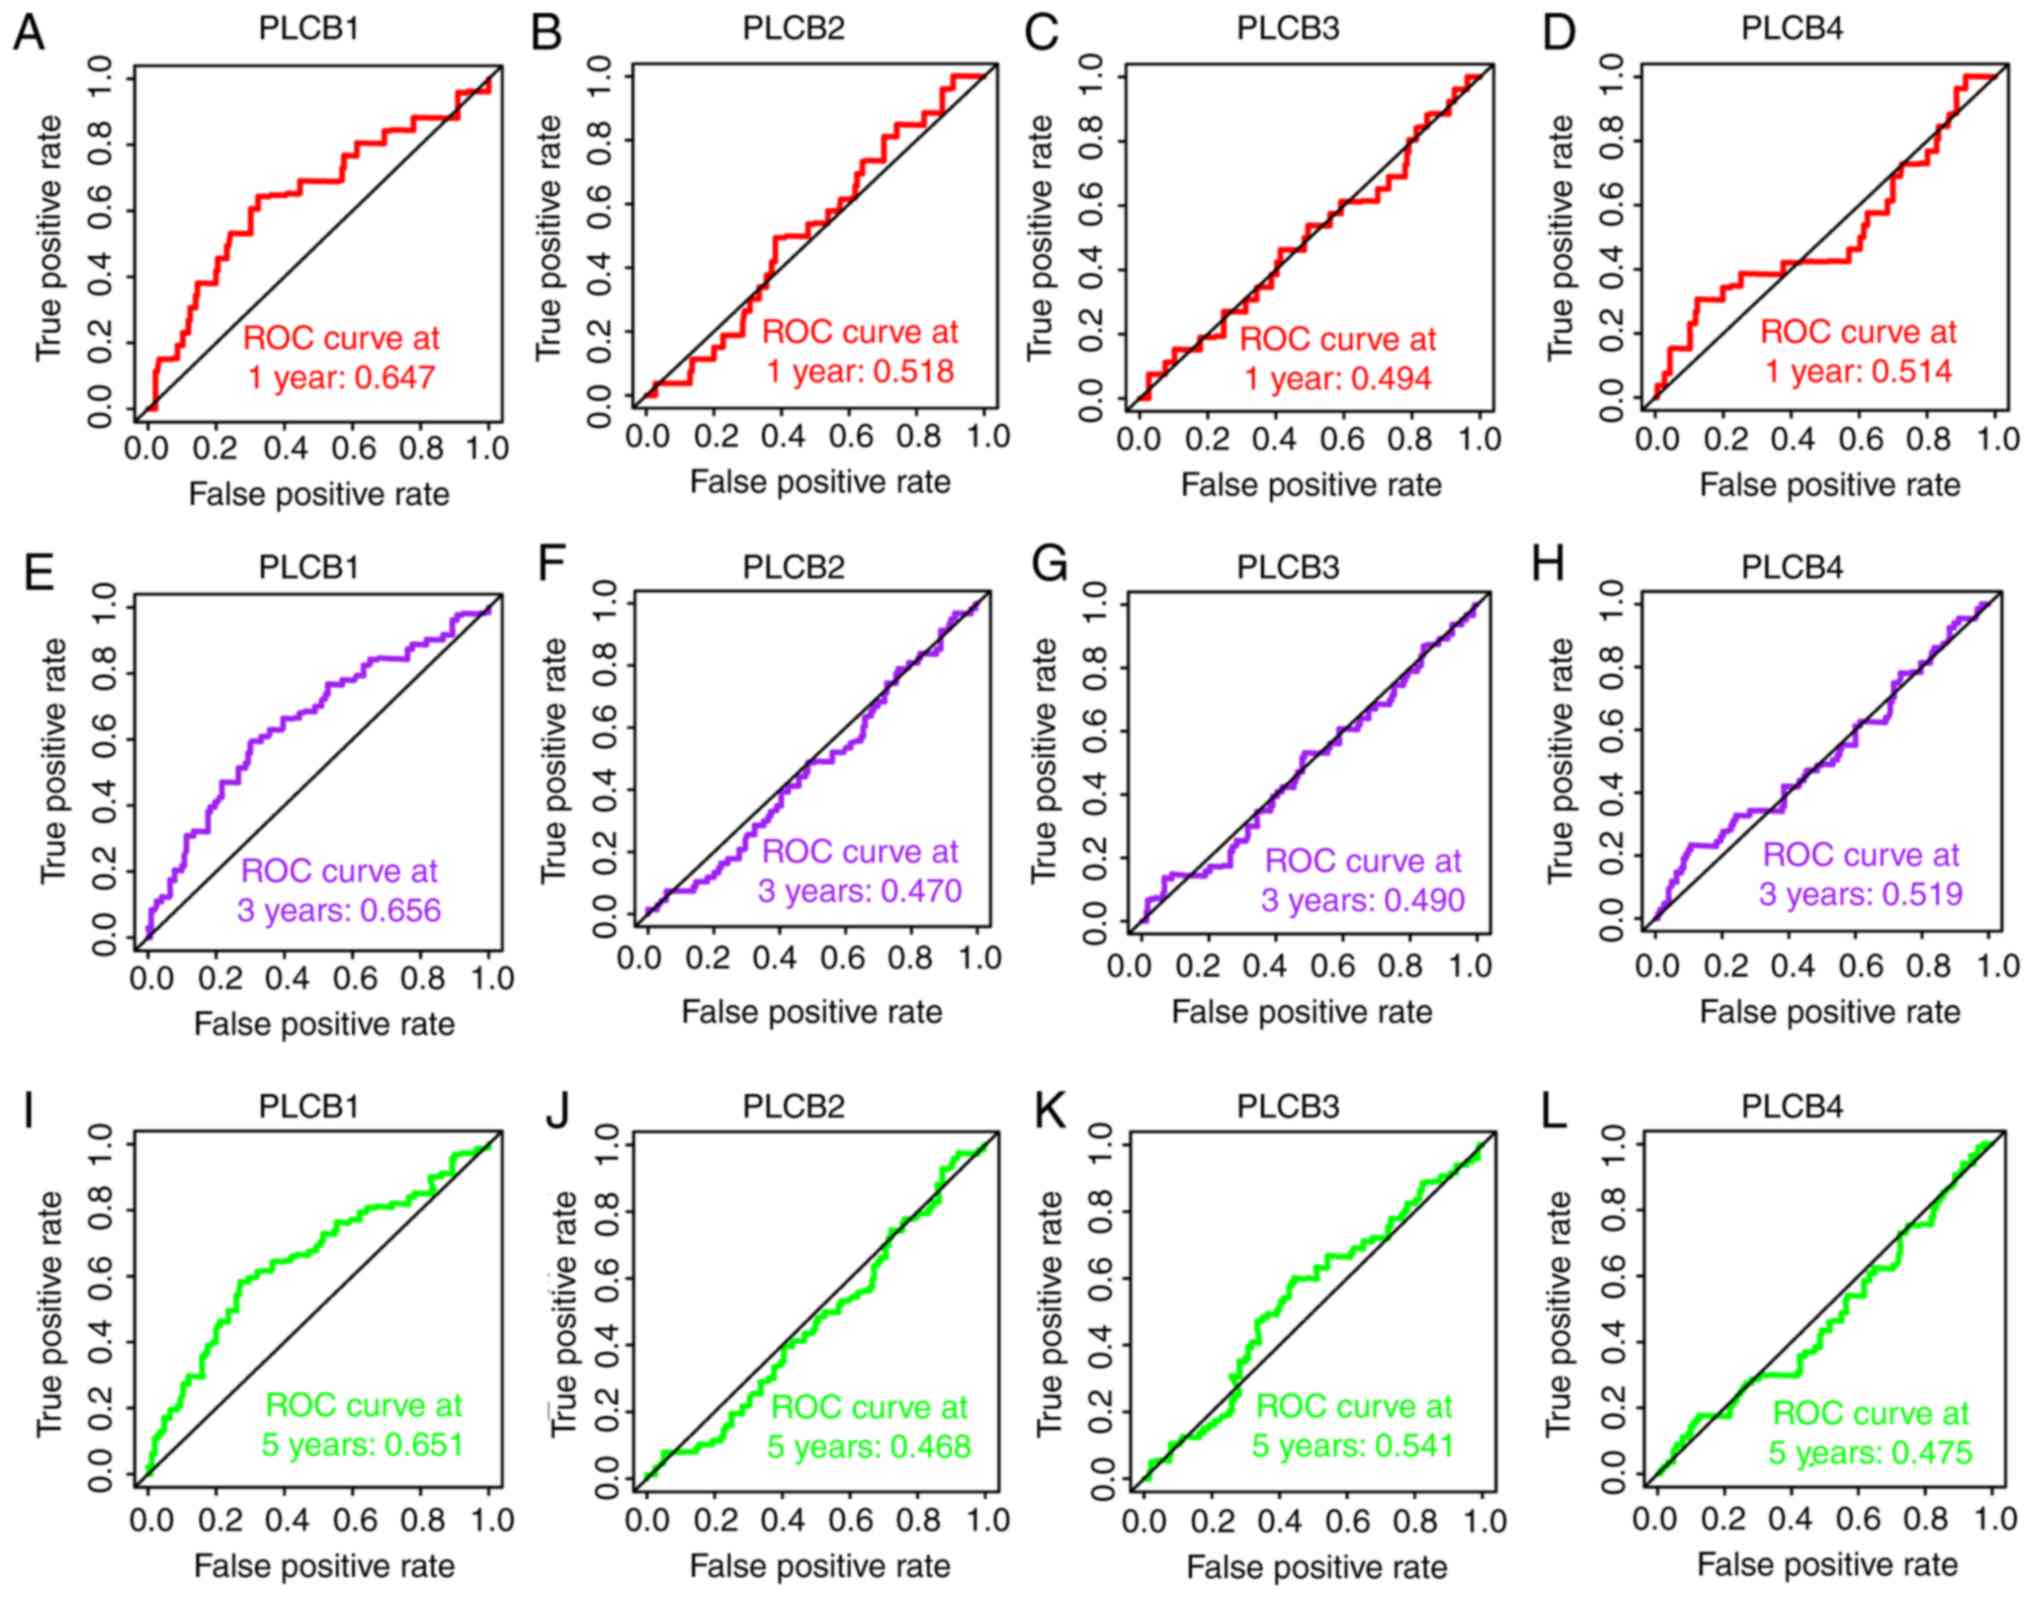
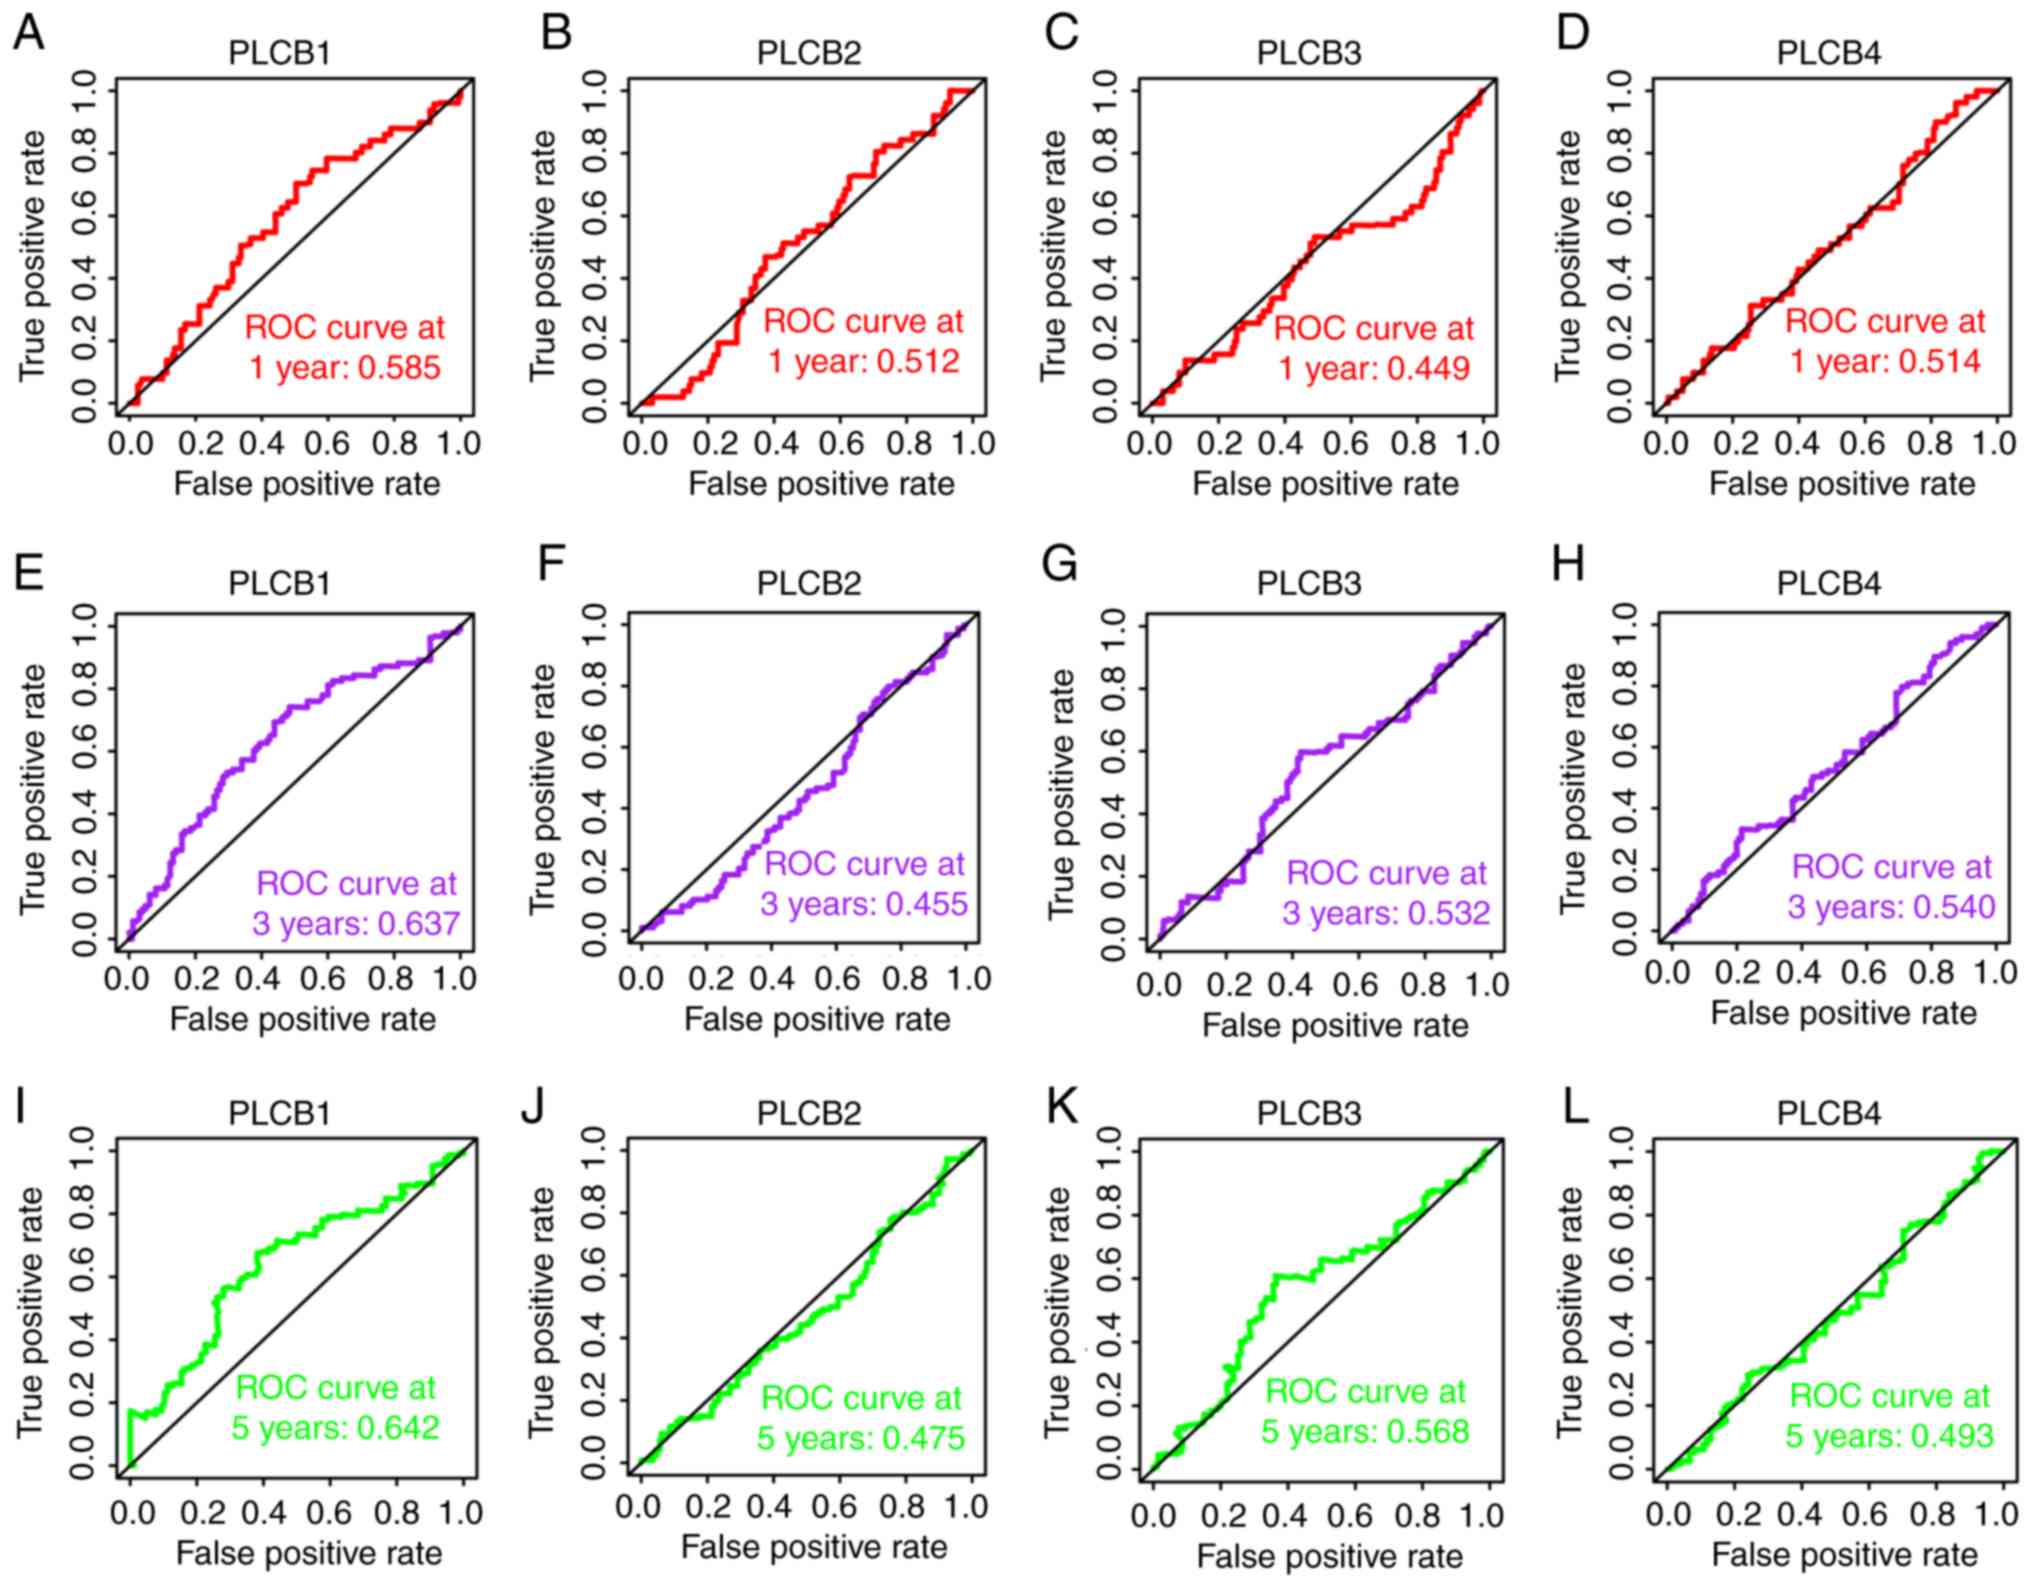
3G). In the prognostic analysis (Figs. 4 and 5), only PLCB1 expression was associated
with patient OS at 1-, 3- and 5-years (all AUC >0.6; Fig. 4A, E and I). In addition, PLCB1
expression was associated with patient RFS at 3- and 5-years (both
AUC >0.6; Fig. 5E and I).
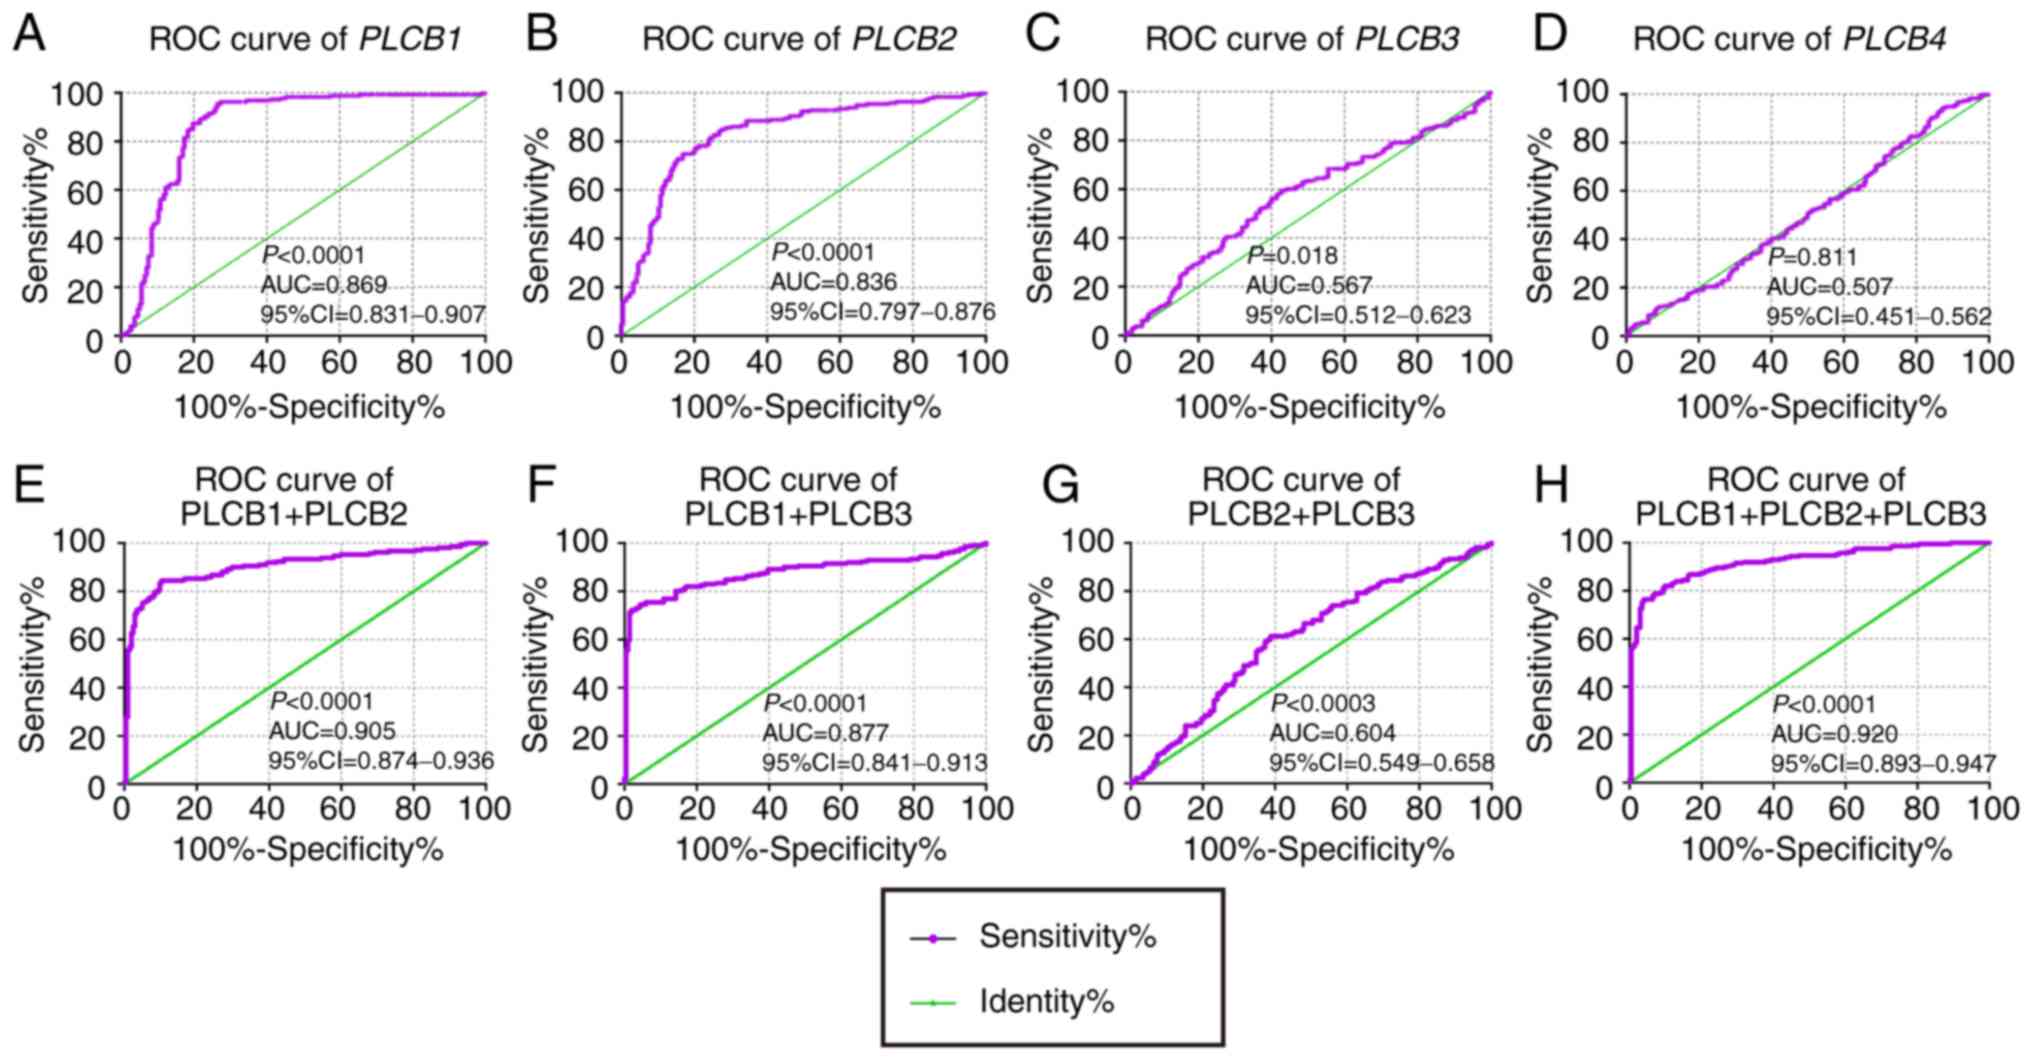 | Figure 3.Diagnostic ROC curves of PLCB1-4.
A-D: Diagnostic ROC curves of (A) PLCB1, (B) PLCB2, (C) PLCB3 and
(D) PLCB4; Diagnostic ROC curves of combination of (E) PLCB1 and
PLCB2, (F) PLCB1 and PLCB3, (G) PLCB2 and PLCB3, and (H) PLCB1,
PLCB2 and PLCB3. ROC, receiver operating characteristics; PLCB,
phospholipase C β; AUC, area under the curve; CI, confidence
interval. |
In the univariate analysis (Tables I and II; Fig.
6), PLCB1 expression was associated with OS (crude
P=0.002; Fig. 6A); PLCB1 and
PLCB3 expression was associated with RFS (crude P=0.001 and
P=0.042, respectively; Fig. 6E and
G). In the multivariate analysis, PLCB1 expression was
associated with OS and RFS (adjusted P=0.002 and 0.001,
respectively; Tables I and II). Other genes were not associated with
prognosis (adjusted P>0.05; Tables
I and II).
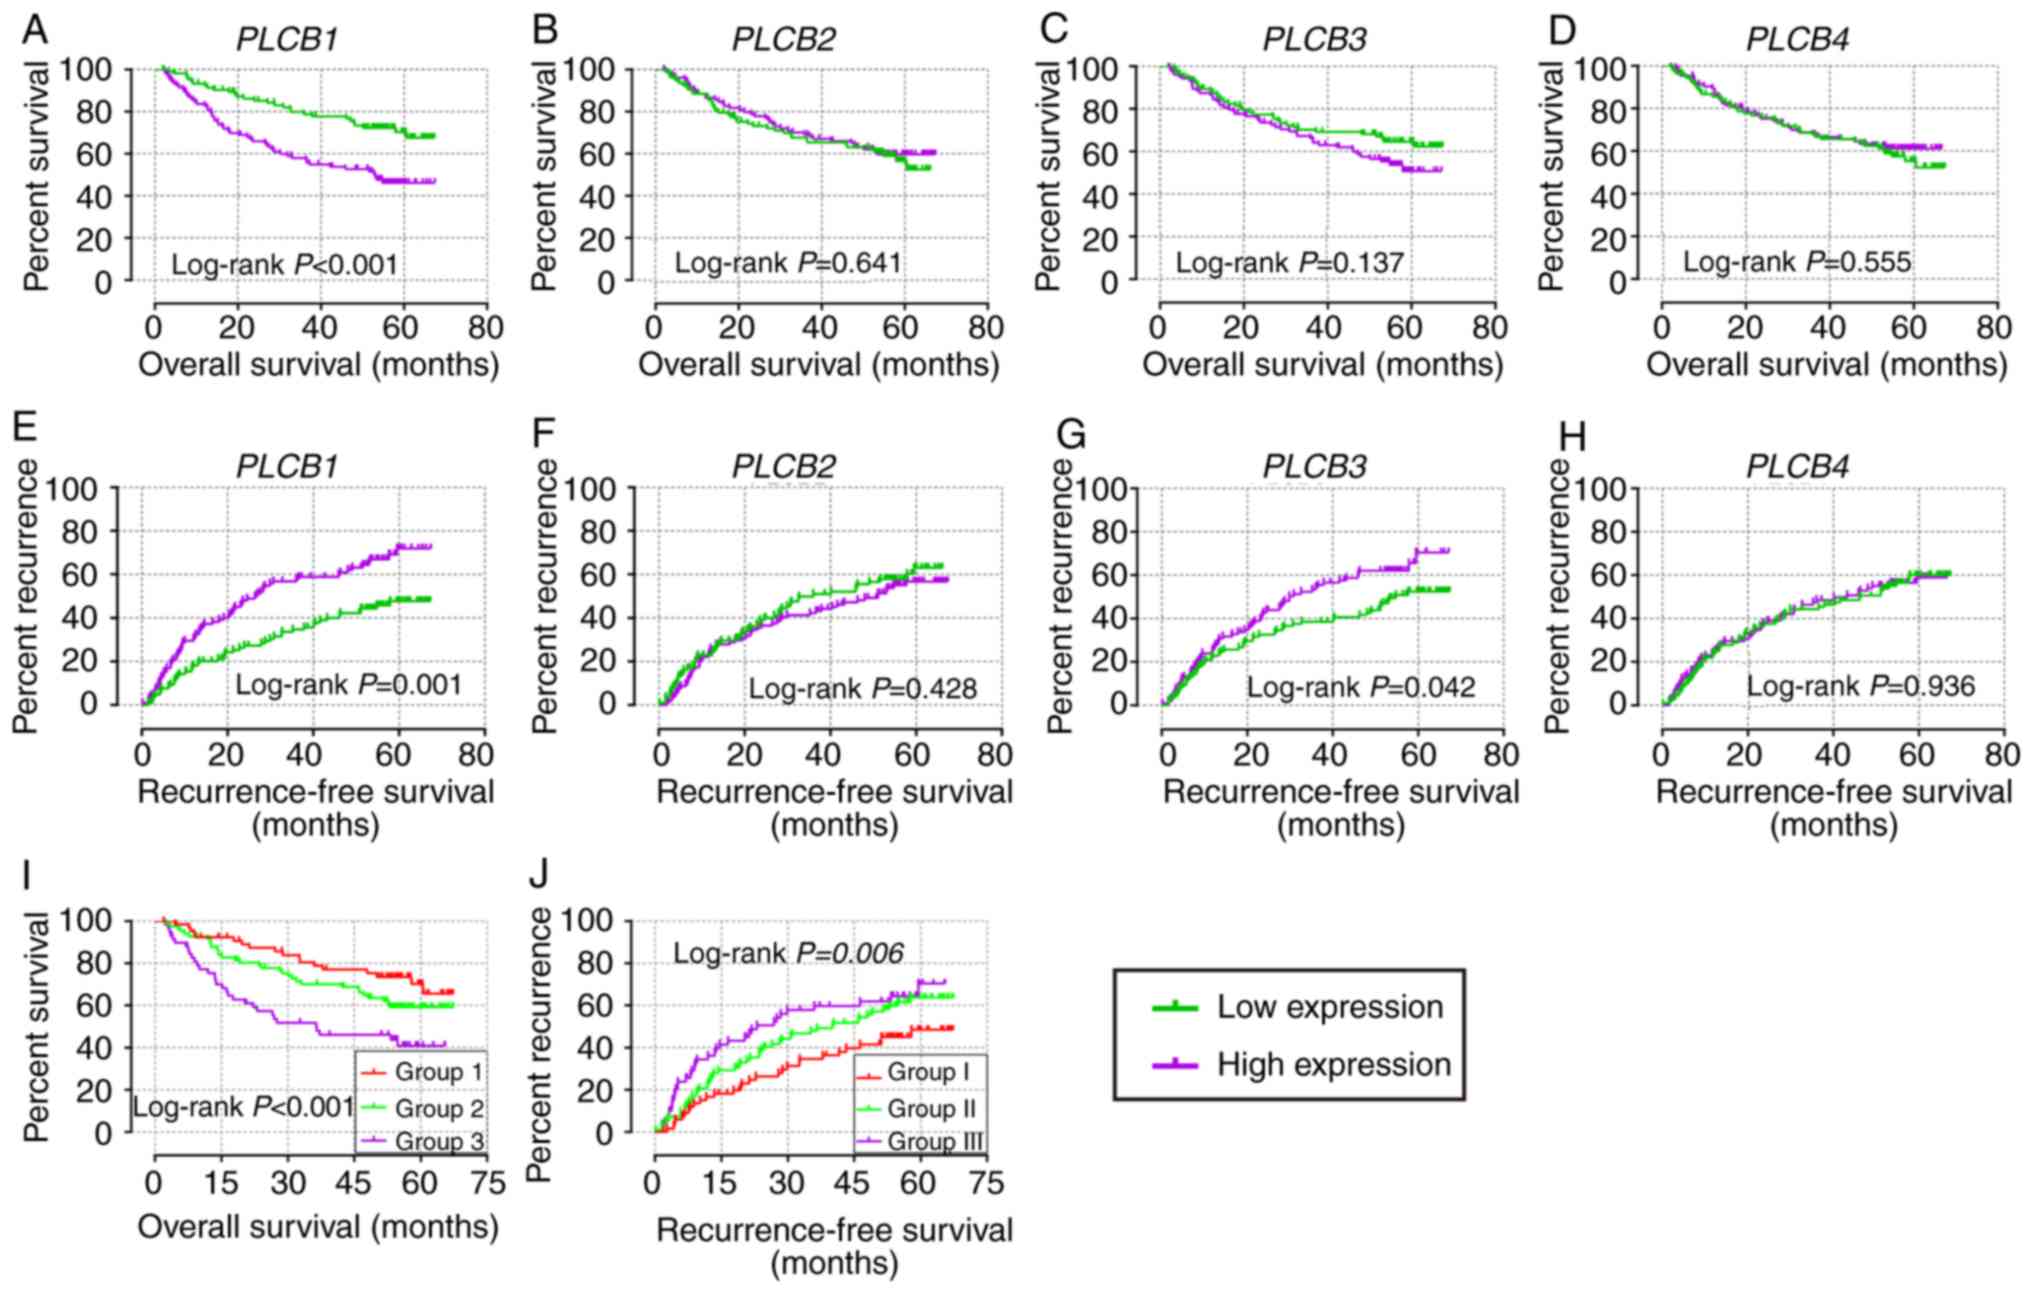 | Figure 6.Overall survival and recurrence-free
survival analysis plots of PLCB1-4. Overall survival analysis plot
of (A) PLCB1, (B) PLCB2, (C) PLCB3 and (D) PLCB4; recurrence-free
survival analysis plot (E) PLCB1, (F) PLCB2, (G) PLCB3 and (H)
PLCB4; joint-effects analysis of (I) α-fetoprotein and (J) PLCB1
for overall survival and recurrence-free survival. Group 1, AFP low
expression and PLCB1 low expression; Group 2, AFP low expression
and PLCB1 high expression, and AFP high expression and PLCB1 low
expression; Group 3, AFP high expression and PLCB1 high expression;
Group I, AFP low expression and PLCB1 low expression; Group II, AFP
low expression and PLCB1 high expression, and AFP high expression
and PLCB1 low expression; Group III, AFP high expression and PLCB1
high expression. PLCB, phospholipase C β. |
 | Table I.Prognostic analysis of PLCB genes for
overall survival. |
Table I.
Prognostic analysis of PLCB genes for
overall survival.
| Variable | Patients
(n=212) | No. of events | MST (months) | HR (95% CI) | Crude P-value | HR (95% CI) | Adjusted
P-valuea |
|---|
| PLCB1 |
|
|
|
|
|
|
|
| Low
expression | 106 | 29 | NA | Ref. |
| Ref. |
|
| High
expression | 106 | 53 | 53 | 2.246
(1.426–3.536) |
<0.001 | 2.100
(1.310–3.367) | 0.002 |
| PLCB2 |
|
|
|
|
|
|
|
| Low
expression | 106 | 41 | NA | Ref. |
| Ref. |
|
| High
expression | 106 | 41 | NA | 0.902
(0.585–1.391) | 0.641 | 1.041
(0.660–1.641) | 0.863 |
| PLCB3 |
|
|
|
|
|
|
|
| Low
expression | 106 | 36 | NA | Ref. |
| Ref. |
|
| High
expression | 106 | 46 | NA | 1.394
(0.900–2.159) | 0.137 | 1.035
(0.659–1.625) | 0.882 |
| PLCB4 |
|
|
|
|
|
|
|
| Low
expression | 106 | 44 | NA | Ref. |
| Ref. |
|
| High
expression | 106 | 38 | NA | 0.877
(0.568–1.354) | 0.555 | 0.870
(0.555–1.363) | 0.534 |
| Table II.Prognostic analysis of PLCB genes for
recurrence-free survival. |
Table II.
Prognostic analysis of PLCB genes for
recurrence-free survival.
| Variable | Patients
(n=212) | No. of events | MST (months) | HR (95% CI) | Crude P-value | HR (95% CI) | Adjusted
P-valuea |
| PLCB1 |
|
|
|
|
|
|
|
| Low
expression | 106 | 46 | NA | Ref. |
| Ref. |
|
| High
expression | 106 | 70 | 26.9 | 1.914
(1.318–2.781) | 0.001 | 1.861
(1.273–2.271) | 0.001 |
| PLCB2 |
|
|
|
|
|
|
|
| Low
expression | 106 | 59 | 36.0 | Ref. |
| Ref. |
|
| High
expression | 106 | 57 | 51.1 | 0.863
(0.599–1.243) | 0.429 | 0.956
(0.654–1.398) | 0.817 |
| PLCB3 |
|
|
|
|
|
|
|
| Low
expression | 106 | 52 | 54.8 | Ref. |
| Ref. |
|
| High
expression | 106 | 64 | 29.9 | 1.466
(1.015–2.118) | 0.042 | 1.244
(0.853–1.814) | 0.257 |
| PLCB4 |
|
|
|
|
|
|
|
| Low
expression | 106 | 59 | 46.3 | Ref. |
| Ref. |
|
| High
expression | 106 | 57 | 43.2 | 1.015
(0.705–1.461) | 0.936 | 0.962
(0.664–1.395) | 0.840 |
Stratified and joint-effect survival
analysis
Stratification analysis was performed for
PLCB1 on OS and RFS. Male gender, age <60 years, chronic
carrying of HBV, cirrhosis, single nodular, AFP levels <300
ng/ml, and A stage in the BCLC staging system were associated with
OS and RFS (all adjusted P≤0.05; Table III). Tumor size <5 cm was
associated with OS and any group of tumor size was associated with
RFS (all adjusted P≤0.05; Table
III).
| Table III.Stratified analysis of PLCB1
for overall survival and recurrence-free survival. |
Table III.
Stratified analysis of PLCB1
for overall survival and recurrence-free survival.
|
| Overall
survival | Recurrence-free
survival |
|---|
|
|
|
|
|---|
| Variable | Low | High | Adjusted HR (95%
CI) | Adjusted
P-value | Low | High | Adjusted HR (95%
CI) | Adjusted
P-value |
|---|
| Sex |
|
|
|
|
|
|
|
|
|
Male | 86 | 89 | 1.967
(1.174–3.24) | 0.010 | 86 | 89 | 1.877
(1.249–2.820) | 0.002 |
|
Female | 20 | 17 | 2.619
(0.711–9.652) | 0.148 | 20 | 17 | 0.754
(0.168–3.382) | 0.713 |
| Age (years) |
|
|
|
|
|
|
|
|
|
≤60 | 91 | 92 | 2.252
(1.370–3.702) | 0.001 | 91 | 92 | 1.736
(1.129–2.670) | 0.012 |
|
>60 | 15 | 14 | 0.850
(0.140–5.148) | 0.860 | 15 | 14 | 2.043
(0.701–5.953) | 0.191 |
| HBV |
|
|
|
|
|
|
|
|
|
AVR-CC | 20 | 36 | 1.987
(0.695–5.687) | 0.200 | 20 | 36 | 1.486
(0.663–3.332) | 0.336 |
| CC | 86 | 70 | 1.957
(1.114–3.438) | 0.020 | 86 | 70 | 1.864
(1.166–2.979) | 0.009 |
| Tumor size
(cm) |
|
|
|
|
|
|
|
|
| ≤5 | 75 | 62 | 2.100
(1.149–3.838) | 0.016 | 75 | 62 | 1.627
(1.012–2.616) | 0.045 |
|
>5 | 30 | 44 | 1.790
(0.821–3.901) | 0.143 | 30 | 44 | 2.204
(1.049–4.629) | 0.037 |
| Cirrhosis |
|
|
|
|
|
|
|
|
|
Yes | 93 | 102 | 1.922
(1.196–3.091) | 0.007 | 93 | 102 | 1.678
(1.124–2.503) | 0.011 |
| No | 13 | 4 | 476.586
(5.21E-12-4.36E16) | 0.707 | 13 | 4 | 3.758
(0.379–37.311) | 0.258 |
| Multinodular |
|
|
|
|
|
|
|
|
|
Yes | 21 | 24 | 1.399
(0.544–3.598) | 0.487 | 21 | 24 | 1.186
(0.474–2.965) | 0.716 |
| No | 85 | 82 | 2.662
(1.522–4.656) | 0.001 | 85 | 82 | 2.163
(1.395–3.355) | 0.001 |
| AFP (ng/ml) |
|
|
|
|
|
|
|
|
|
≤300 | 68 | 47 | 2.098
(1.097–4.015) | 0.025 | 68 | 47 | 2.180
(1.307–3.635) | 0.003 |
|
>300 | 35 | 59 | 1.886
(0.934–3.806) | 0.077 | 35 | 59 | 1.294
(0.710–2.359) | 0.399 |
| BCLC stage |
|
|
|
|
|
|
|
|
| 0 | 8 | 12 | 0.535
(0.033–8.559) | 0.658 | 8 | 12 | 0.597
(0.097–3.665) | 0.577 |
| A | 79 | 64 | 2.214
(1.210–4.051) | 0.010 | 79 | 64 | 1.928
(1.200–3.097) | 0.007 |
| B | 10 | 12 | 0.746
(0.225–2.478) | 0.633 | 10 | 12 | 0.903
(0.310–2.627) | 0.851 |
| C | 9 | 18 | 2.746
(0.836–9.021) | 0.096 | 9 | 18 | 2.370
(0.774–7.252) | 0.131 |
In the joint-effect analysis (OS/RFS: group 1/I, AFP
low + PLCB1 low; group 2/II, AFP low + PLCB1 high, and AFP high +
PLCB1 low; groups 3/III, AFP high + PLCB1 high), when combining
PLCB1 and AFP, prognostic significance was observed among
the three groups for OS (adjusted P=0.008; Table IV); group 3 exhibited the worst
prognosis [adjusted P=0.002, adjusted HR (95% CI)=4.382
(1.703–11.276); Table IV].
Prognostic significance was not observed among the three groups in
RFS (adjusted P=0.075; Table IV).
However, group III exhibited the worst prognosis [adjusted P=0.045,
adjusted HR (95% CI)=1.670 (1.012–2.755); Table IV].
| Table IV.Joint-effect analysis of PLCB1 and
AFP for overall survival and recurrence-free survival. |
Table IV.
Joint-effect analysis of PLCB1 and
AFP for overall survival and recurrence-free survival.
| A, Overall
survival |
|---|
|
|---|
| Group | AFP expression | PLCB1
expression | Events/total | MST (months) | Adjusted HR (95%
CI) | Adjusted
P-value |
|---|
| 1 | Low | Low | 18/68 | NA | Ref. | 0.008 |
| 2 | Low | High | 32/82 | NA | 2.162
(1.143–4.089) | 0.018 |
|
| High | Low |
|
|
|
|
| 3 | High | High | 32/59 | 36.4 | 4.382
(1.703–11.276) | 0.002 |
|
| B, Recurrence-free
survival |
|
| Group | AFP expression | PLCB1
expression | Events/total | MST (months) | Adjusted HR (95%
CI) | Adjusted
P-value |
|
| I | Low | Low | 29/68 | NA | Ref. | 0.075 |
| II | Low | High | 50/82 | 40.1 | 1.613
(1.019–2.555) | 0.041 |
|
| High | Low |
|
|
|
|
| III | High | High | 37/59 | 23.0 | 1.670
(1.012–2.755) | 0.045 |
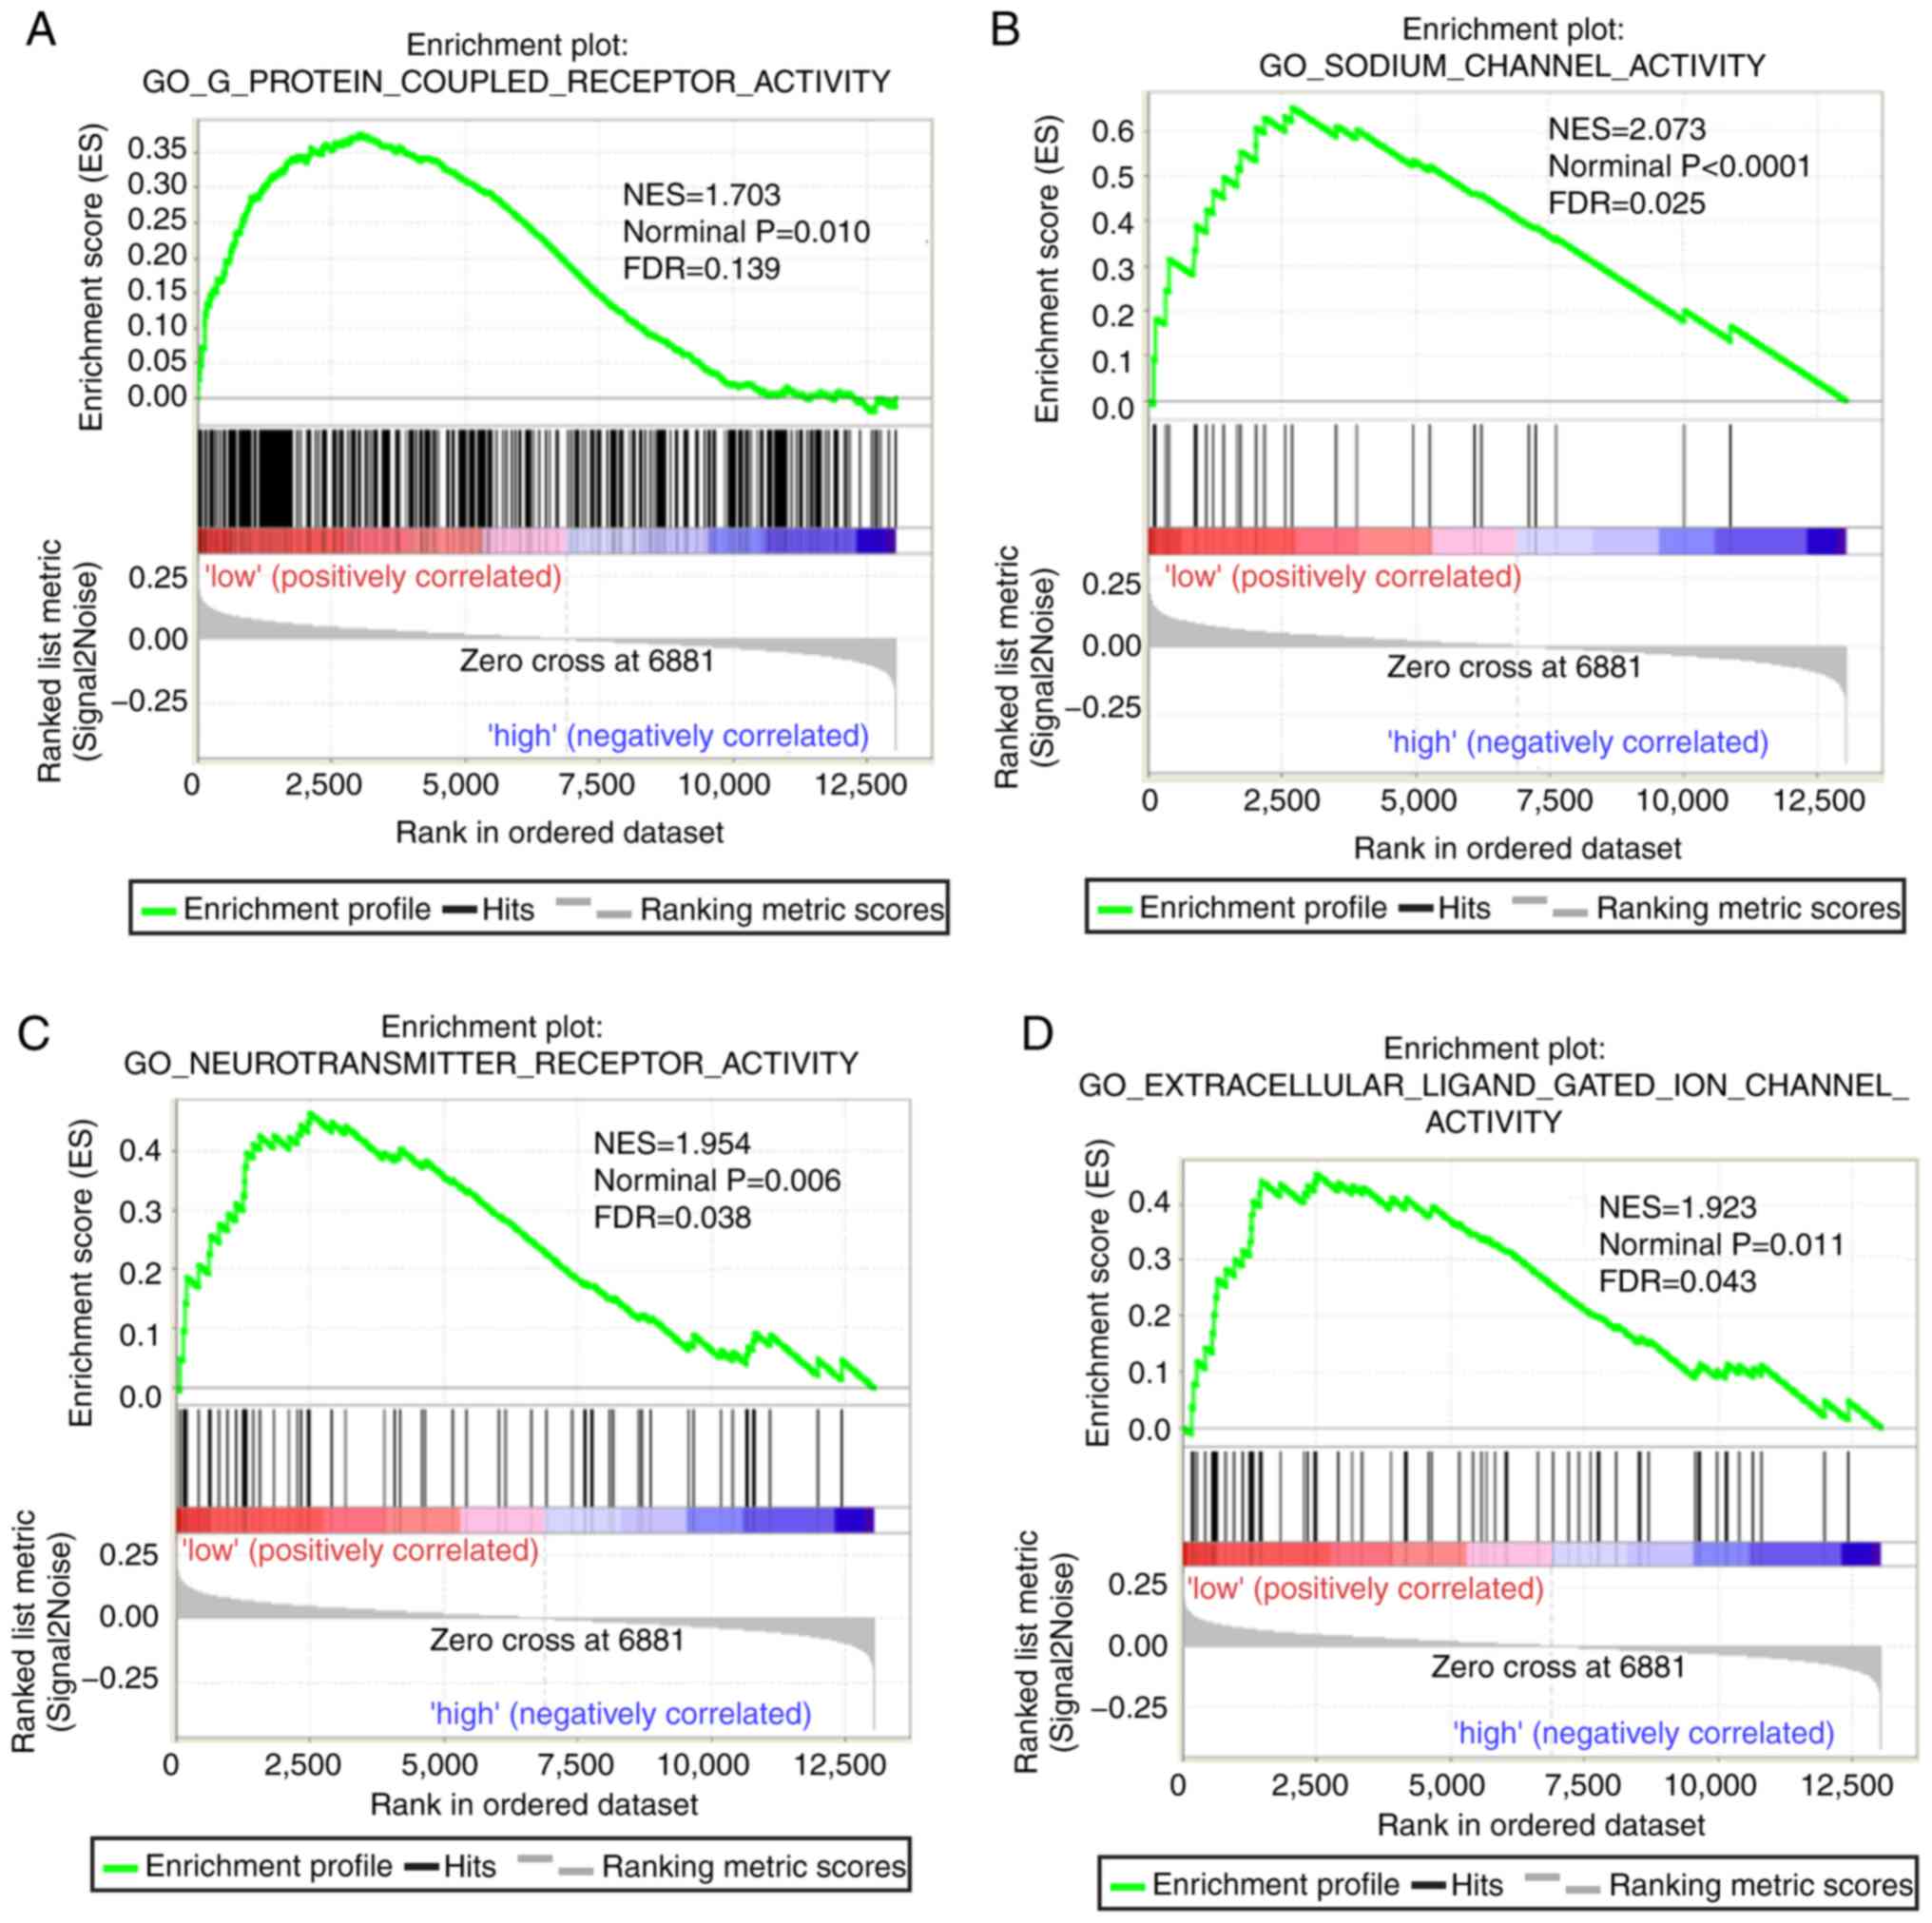
GSEA
Both diagnostic- and prognostic-associated genes
were explored to investigate the mechanisms that PLCBs are involved
in. Enriched GO terms and KEGG pathways annotated with PLCB1
included ‘G protein coupled receptor activity’, ‘sodium channel
activity’, ‘extracellular ligand gated ion channel activity’ and
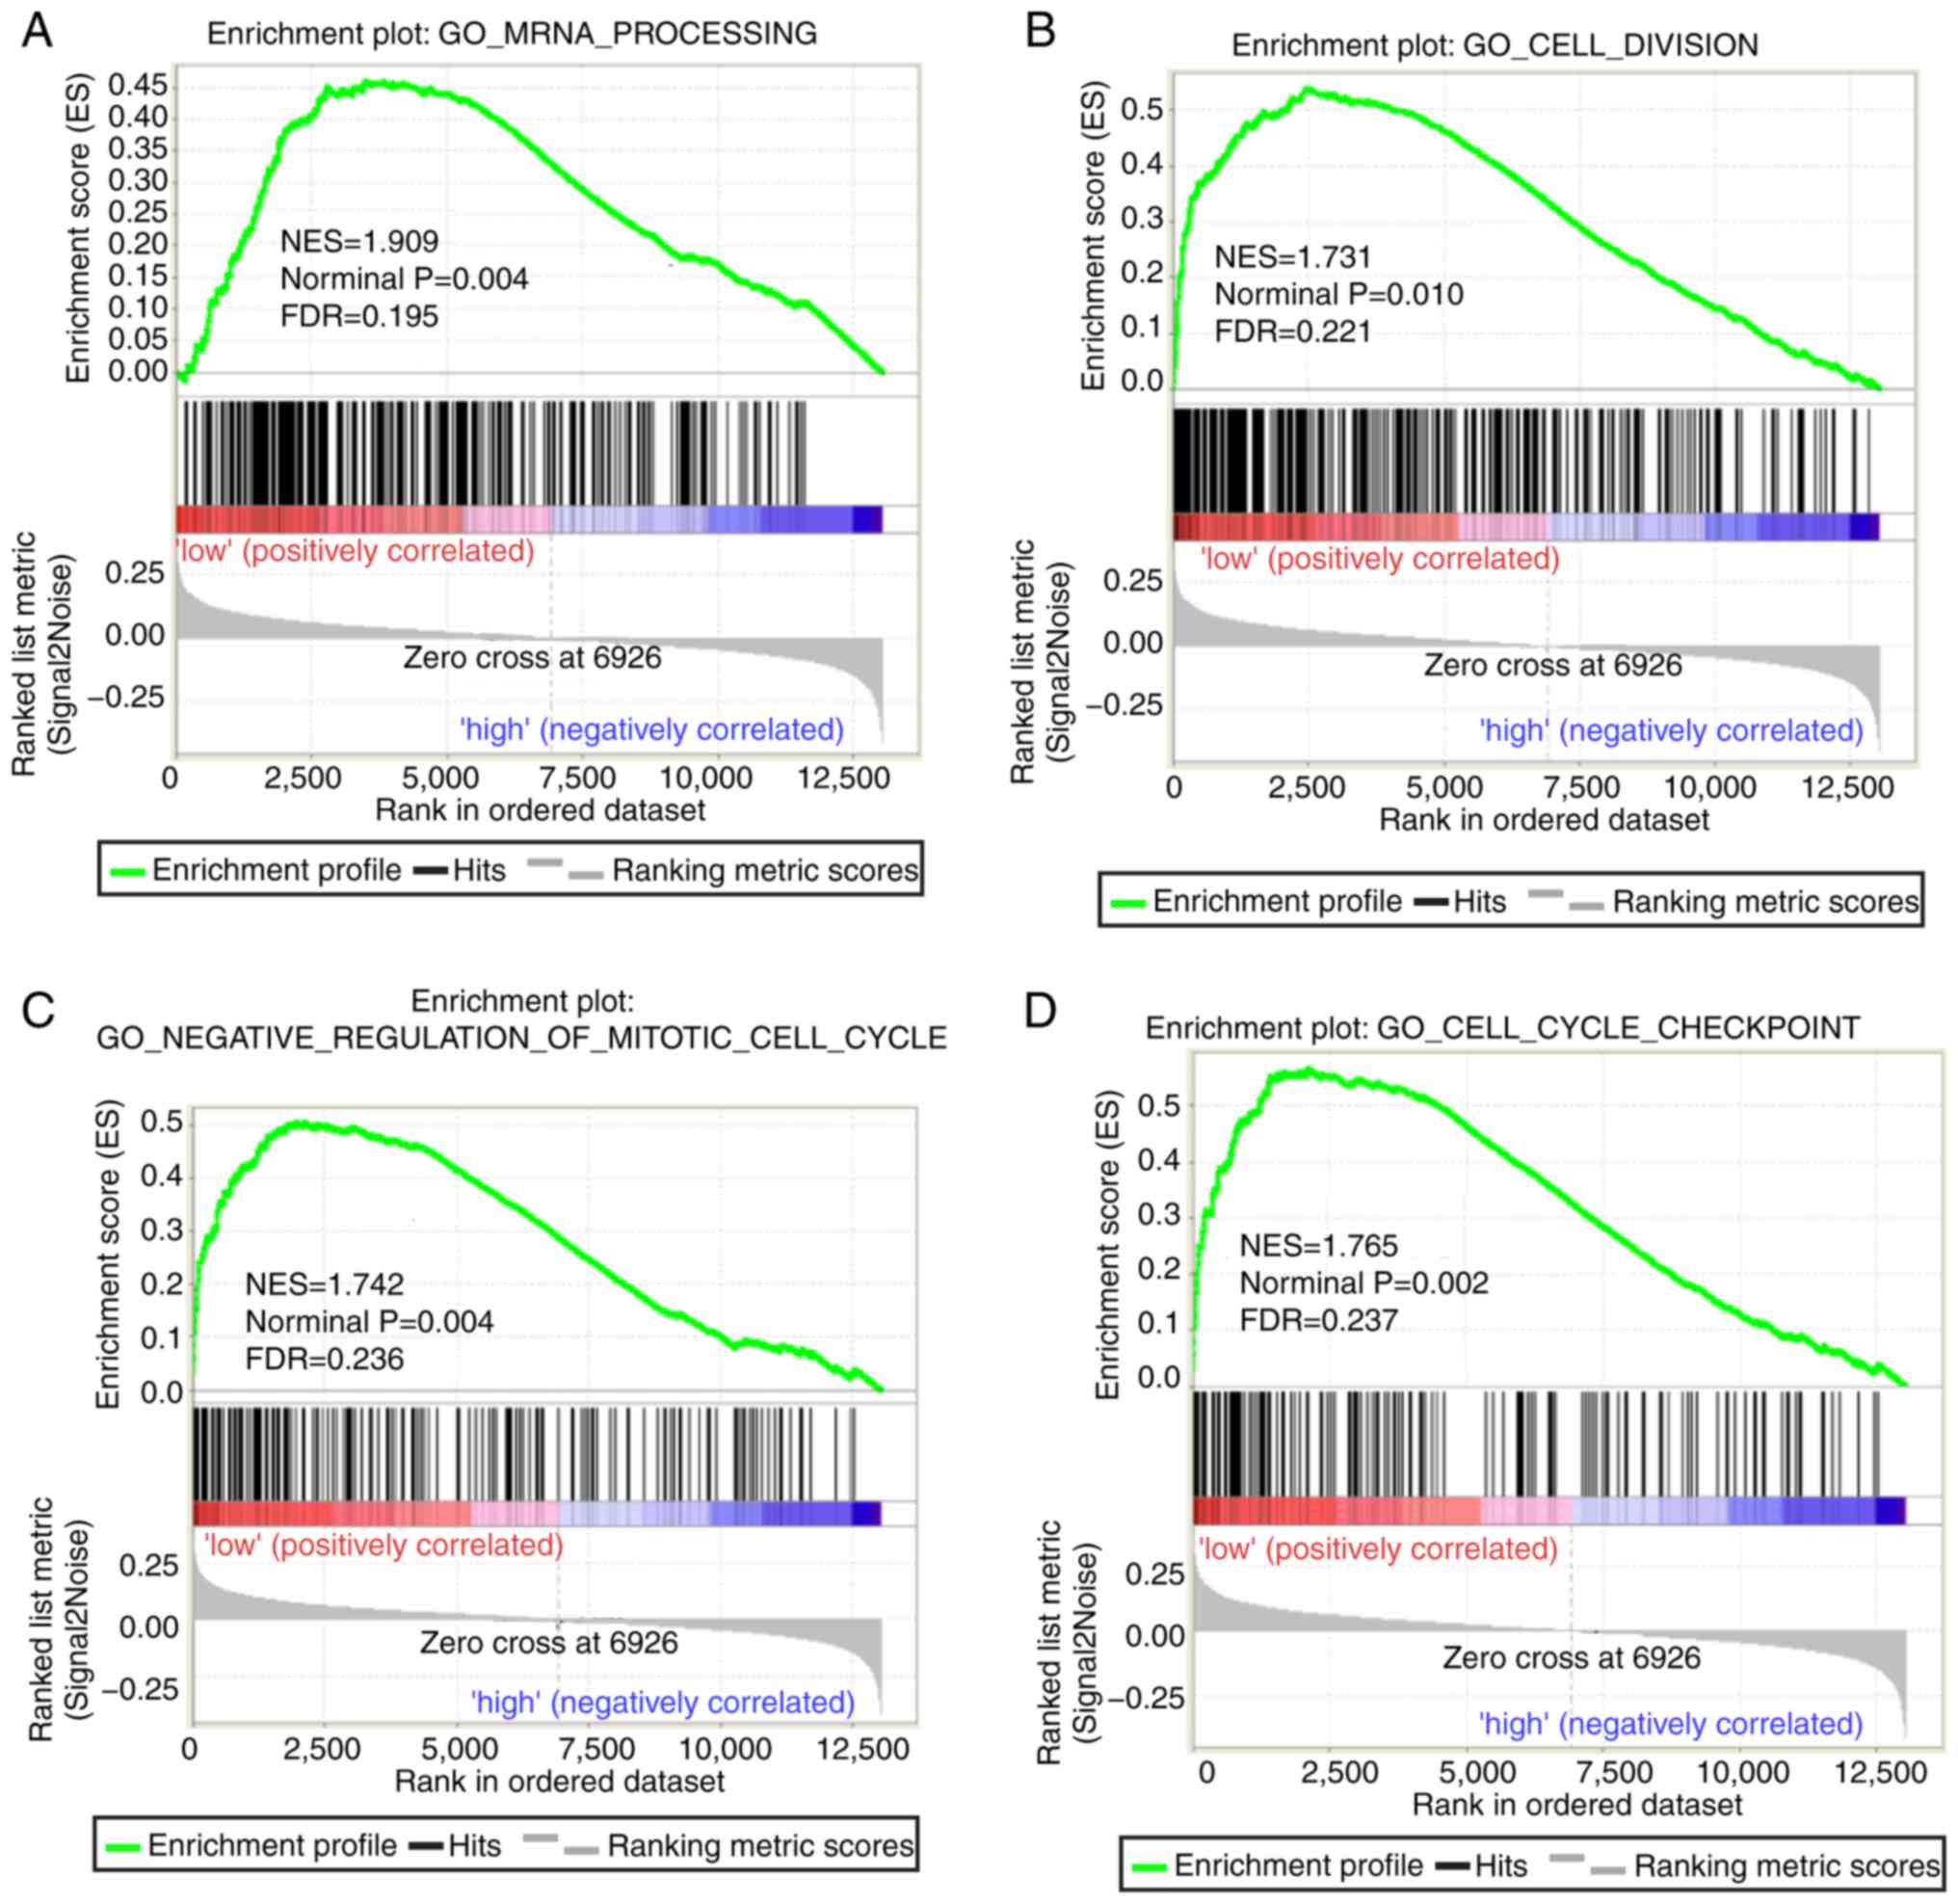
‘taste transduction pathway’, among others (Fig. 7). Enriched GO terms and KEGG
pathways annotated with PLCB2 included ‘mRNA processing’,
‘cell division’, ‘cell cycle checkpoints’, ‘DNA repair’, ‘PPAR
signaling pathway’, ‘metabolism of xenobiotics by cytochrome P450’
and ‘adipocytokine signaling pathway’ among others (Fig. 8).
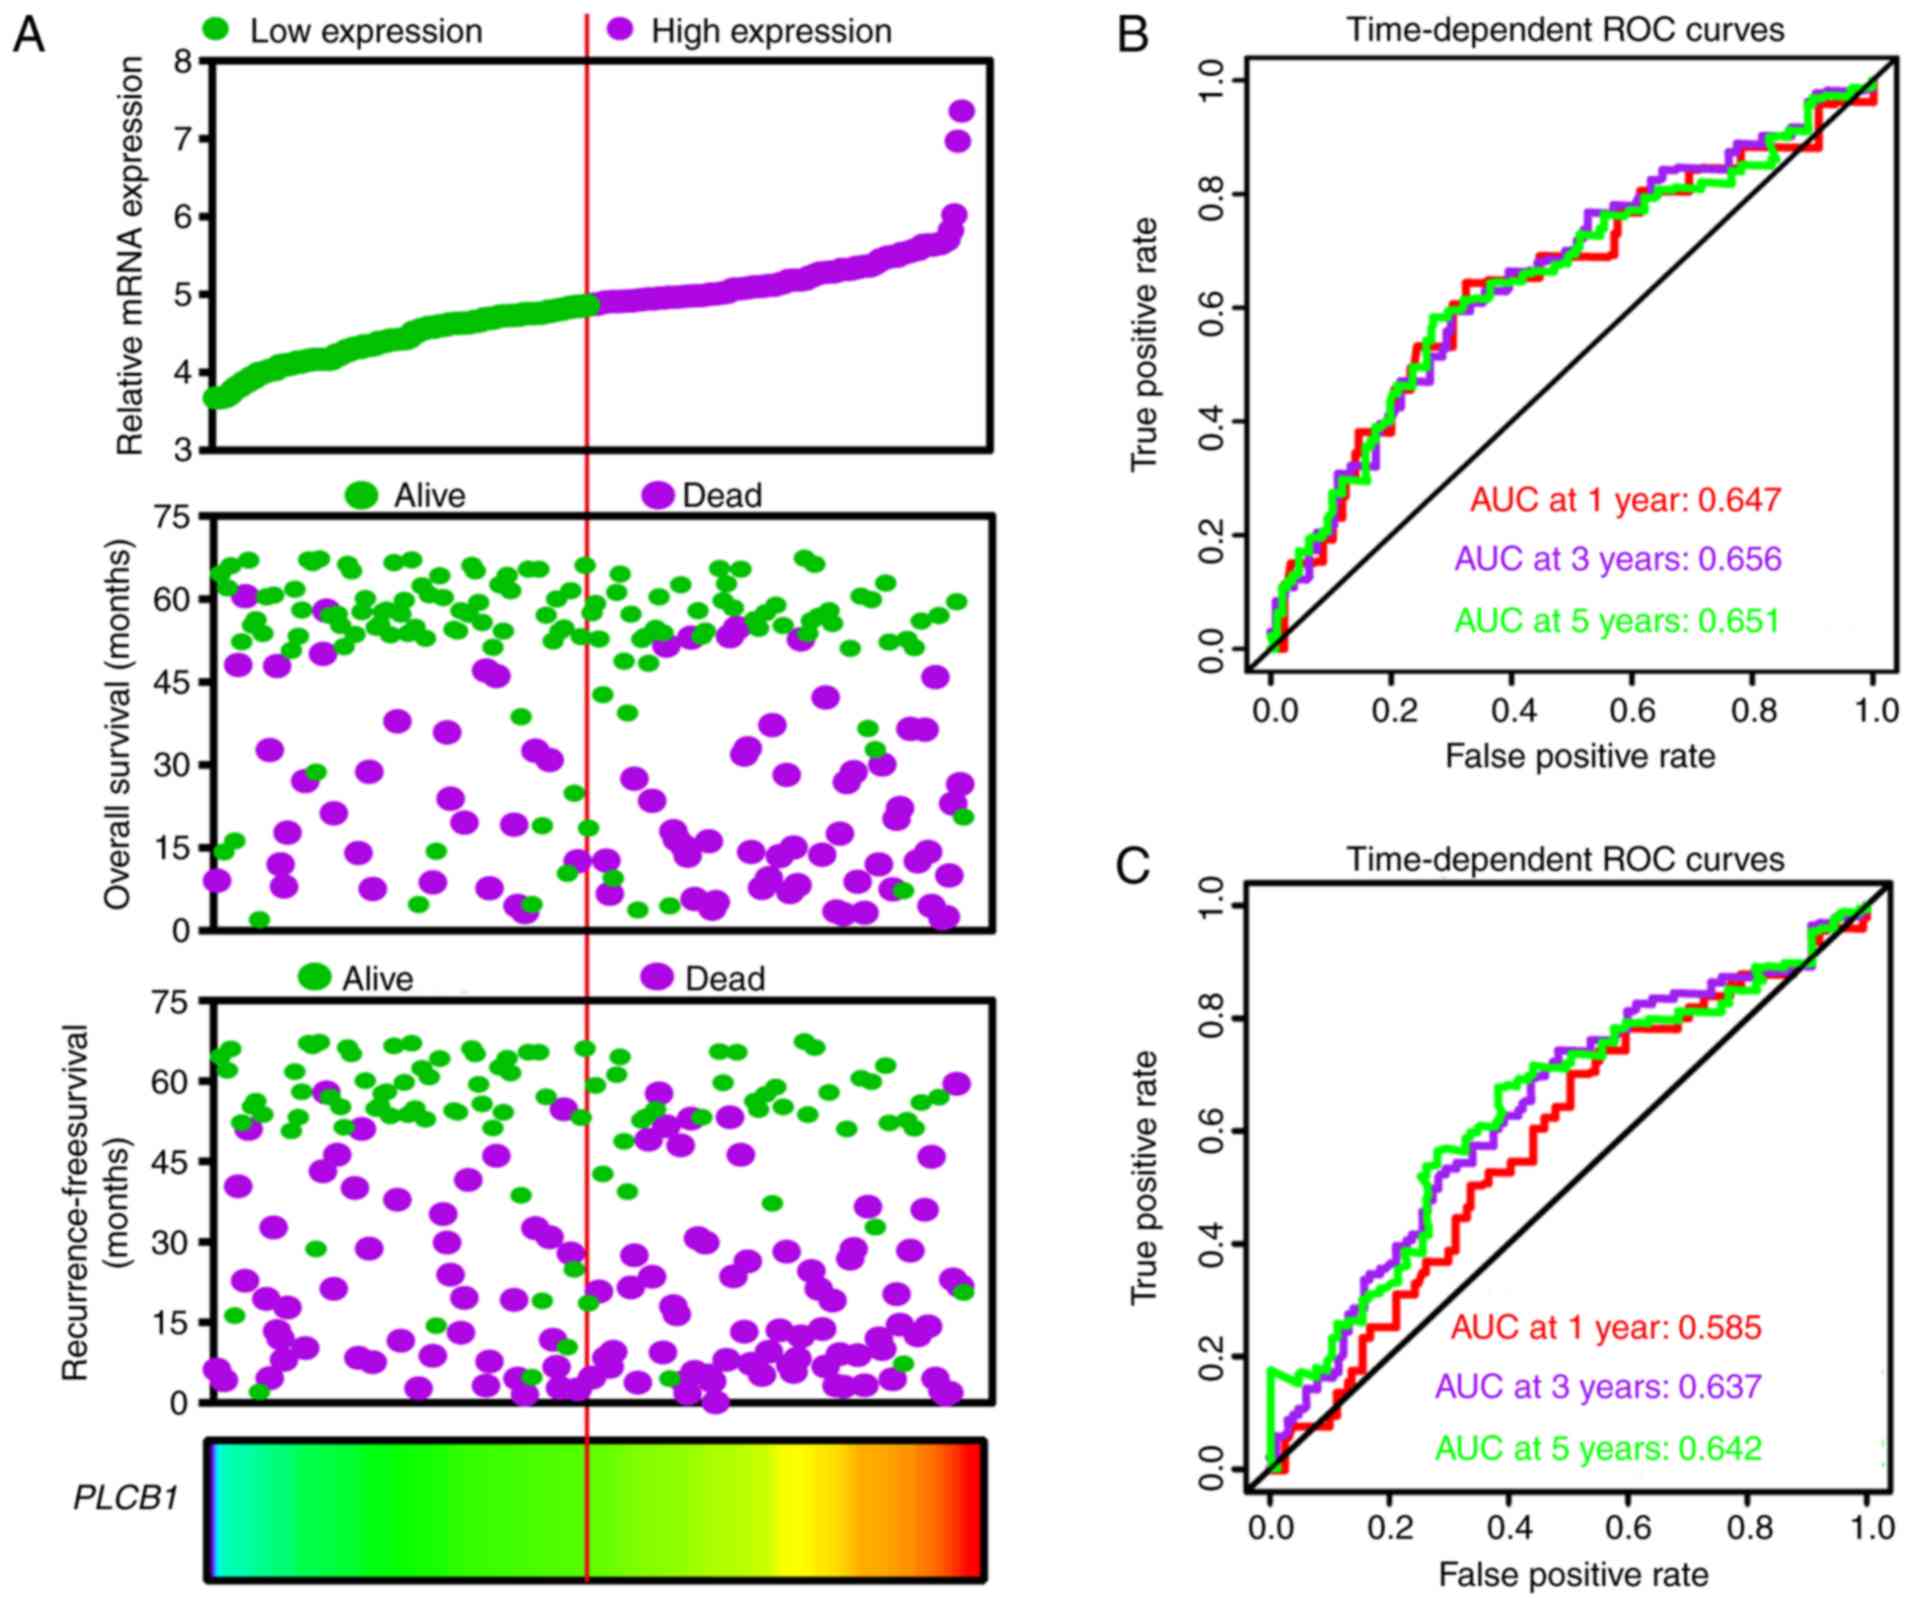
Expression model and nomogram
construction
An expression model was constructed for OS and RFS
prognosis prediction (Fig. 9).
PLCB1 expression, OS and RFS survival status, and PLCB1
expression heatmaps are shown in Fig.
9A, and prognostic ROC curves demonstrated that PLCB1
expression has prognostic value for OS and RFS (Fig. 9B and C).
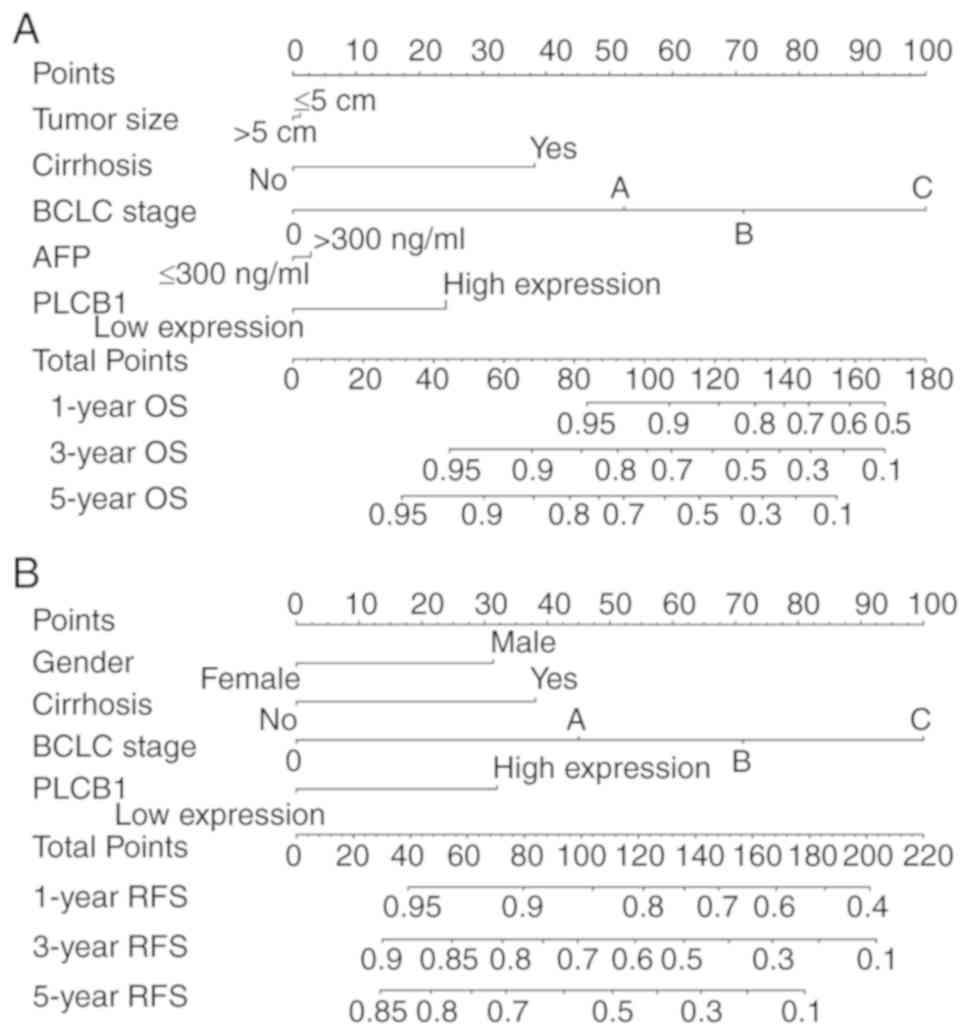
Furthermore, nomograms were constructed for clinical
factors and PLCB1. High expression always led to low points.
The same points indicated a higher probability of survival at 1
year, yet a lower probability of survival at 5 years for both OS
and RFS. Survival probability at 3 years was seated in the middle
(Fig. 10).
Interaction and co-expression networks
and enrichment analysis
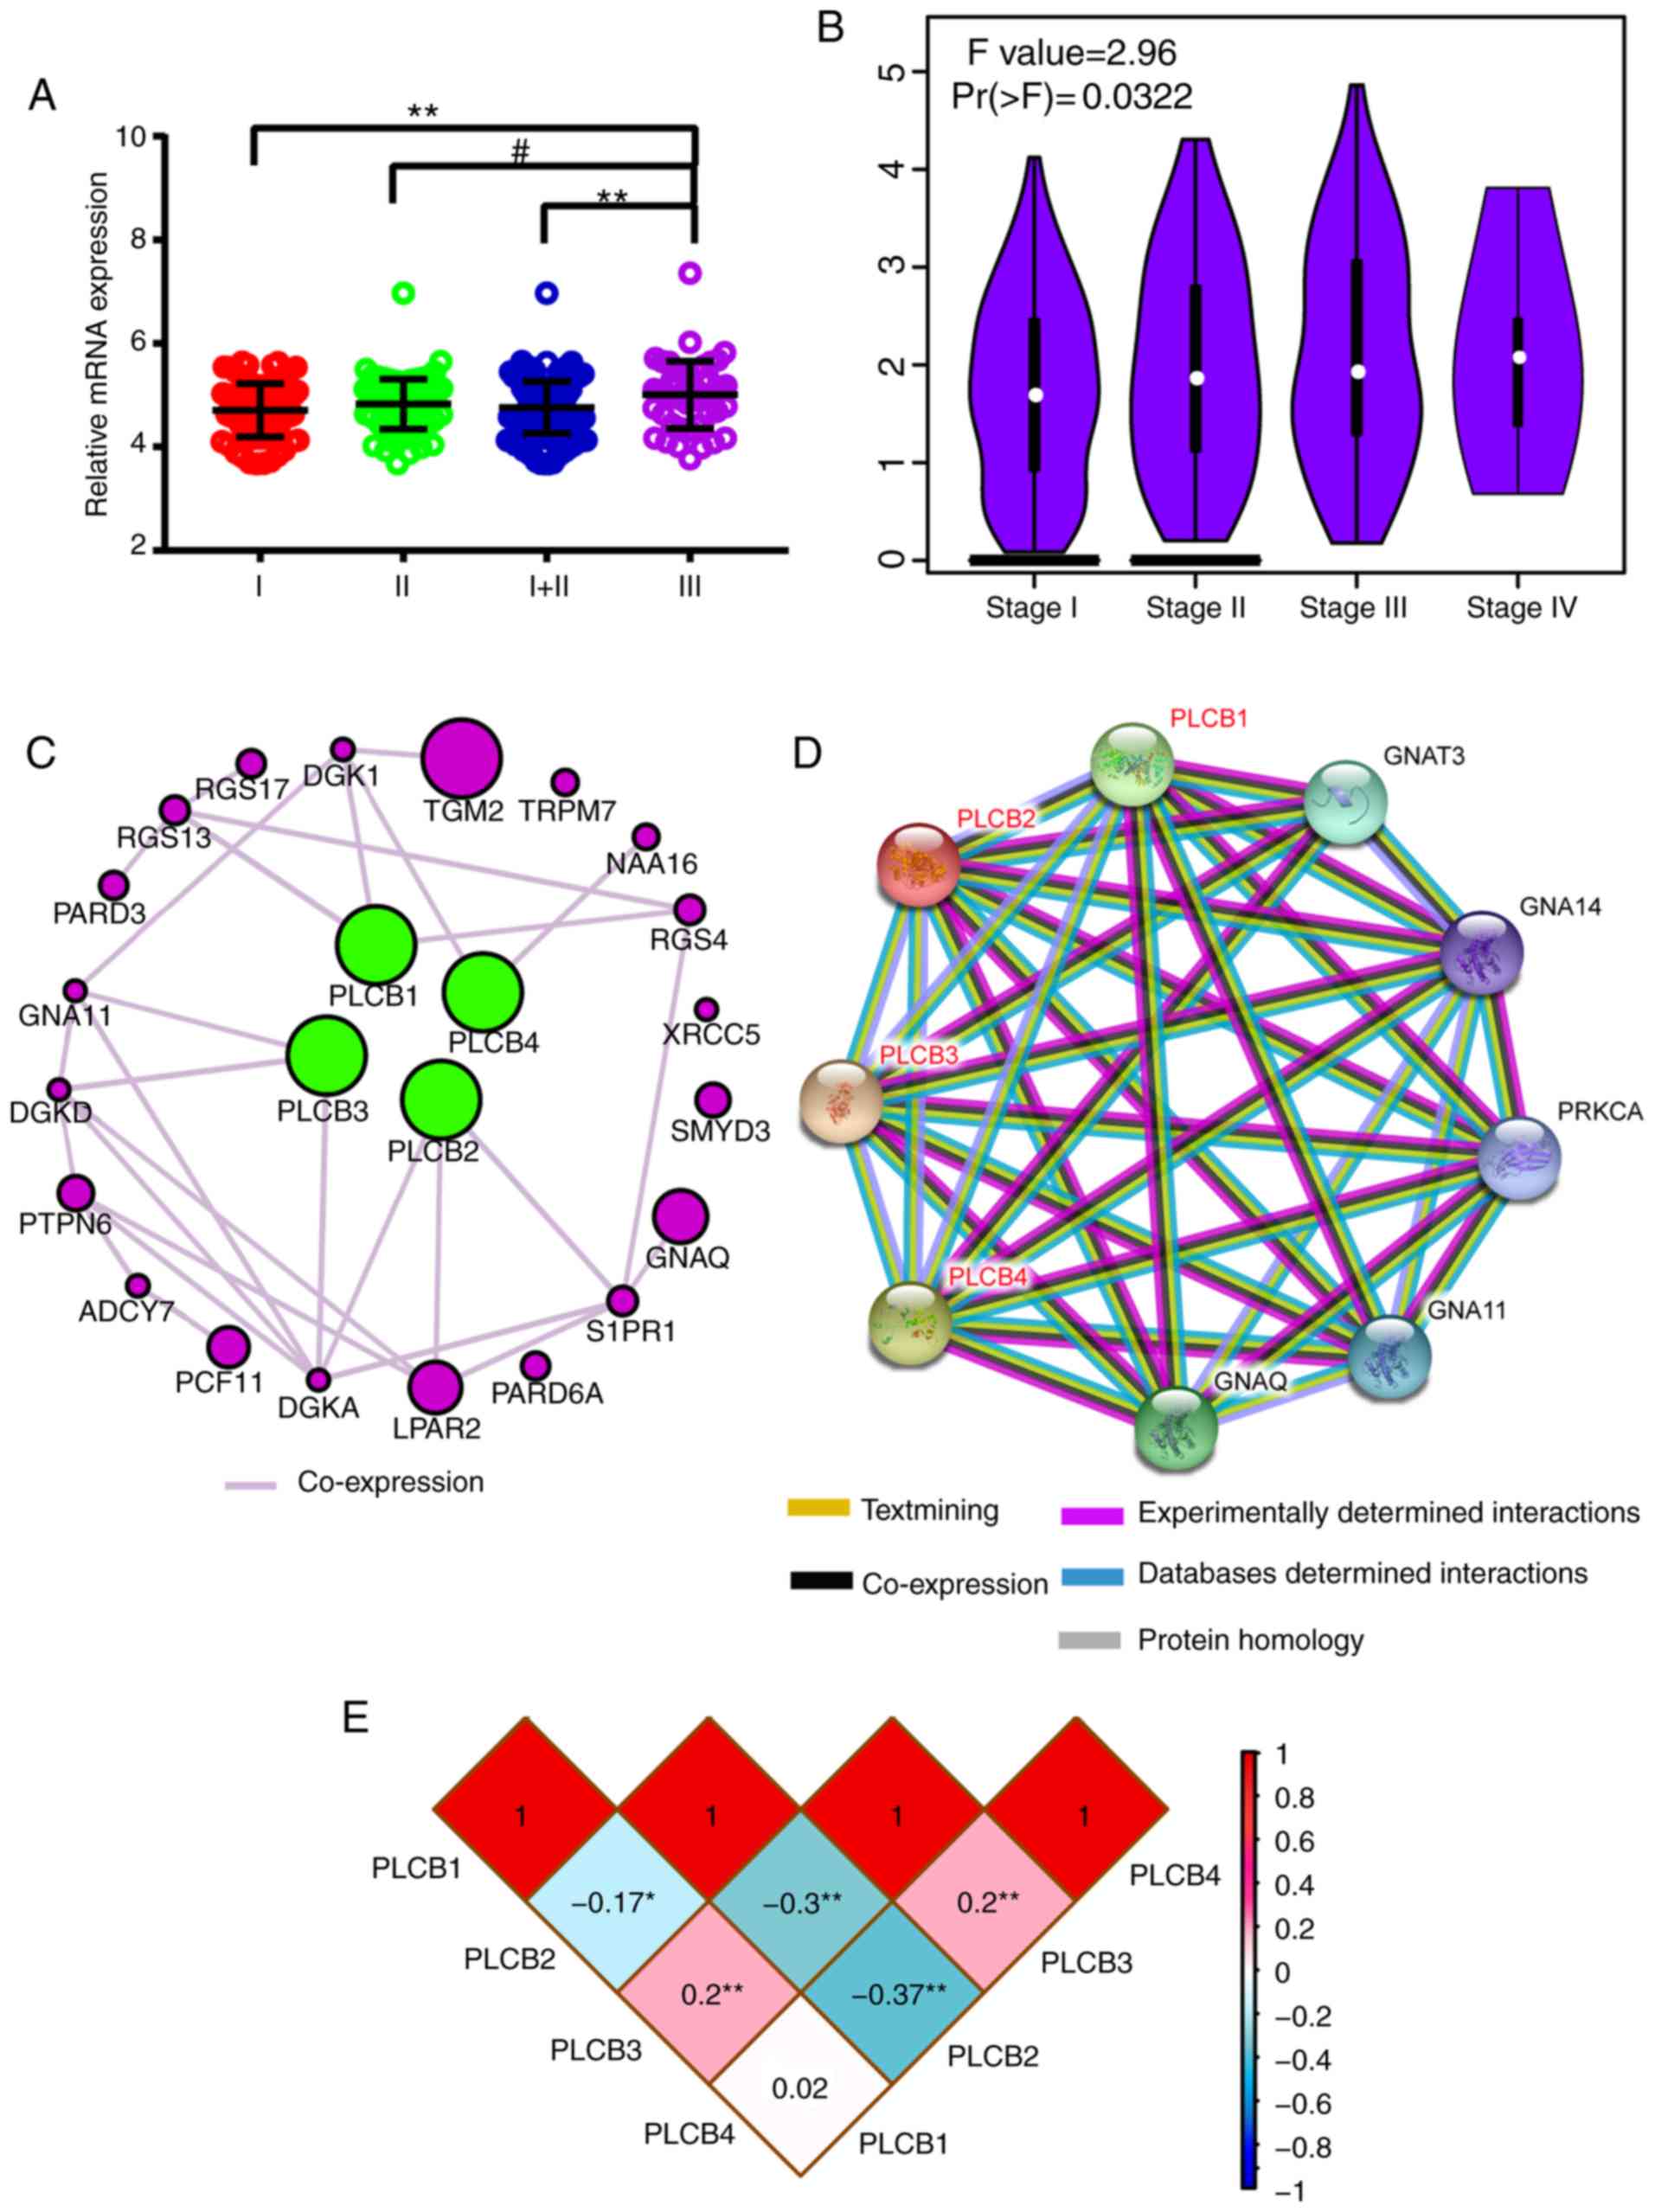
Associations between gene expression and TNM stage
(I, II, III) were visualized; PLCB1 gene expression of 212
HBV-HCC was significantly different in early (I, II) stages
compared with advanced (III) stage in (P≤0.01; Fig. 11A). Associations between gene
expressions and TNM stage (I, II and III) in GEPIA indicated that
PLCB1 expression was different in different tumor stages
(Fig. 11B). Gene-gene
co-expression interactions and PPI networks demonstrated
interactions between PLCB members (Fig. 11C and D). The Pearson correlation
matrix showed an association between PLCB members (Fig. 11E).
Furthermore, enriched GO terms are presented in
Fig. S4A-C. KEGG pathways that
PLCB members are involved in are presented in Fig. S5. All members were involved in
diacylglycerol and IP3 metabolism and finally induced sustained
angiogenesis, thus evading apoptosis and proliferation effects.
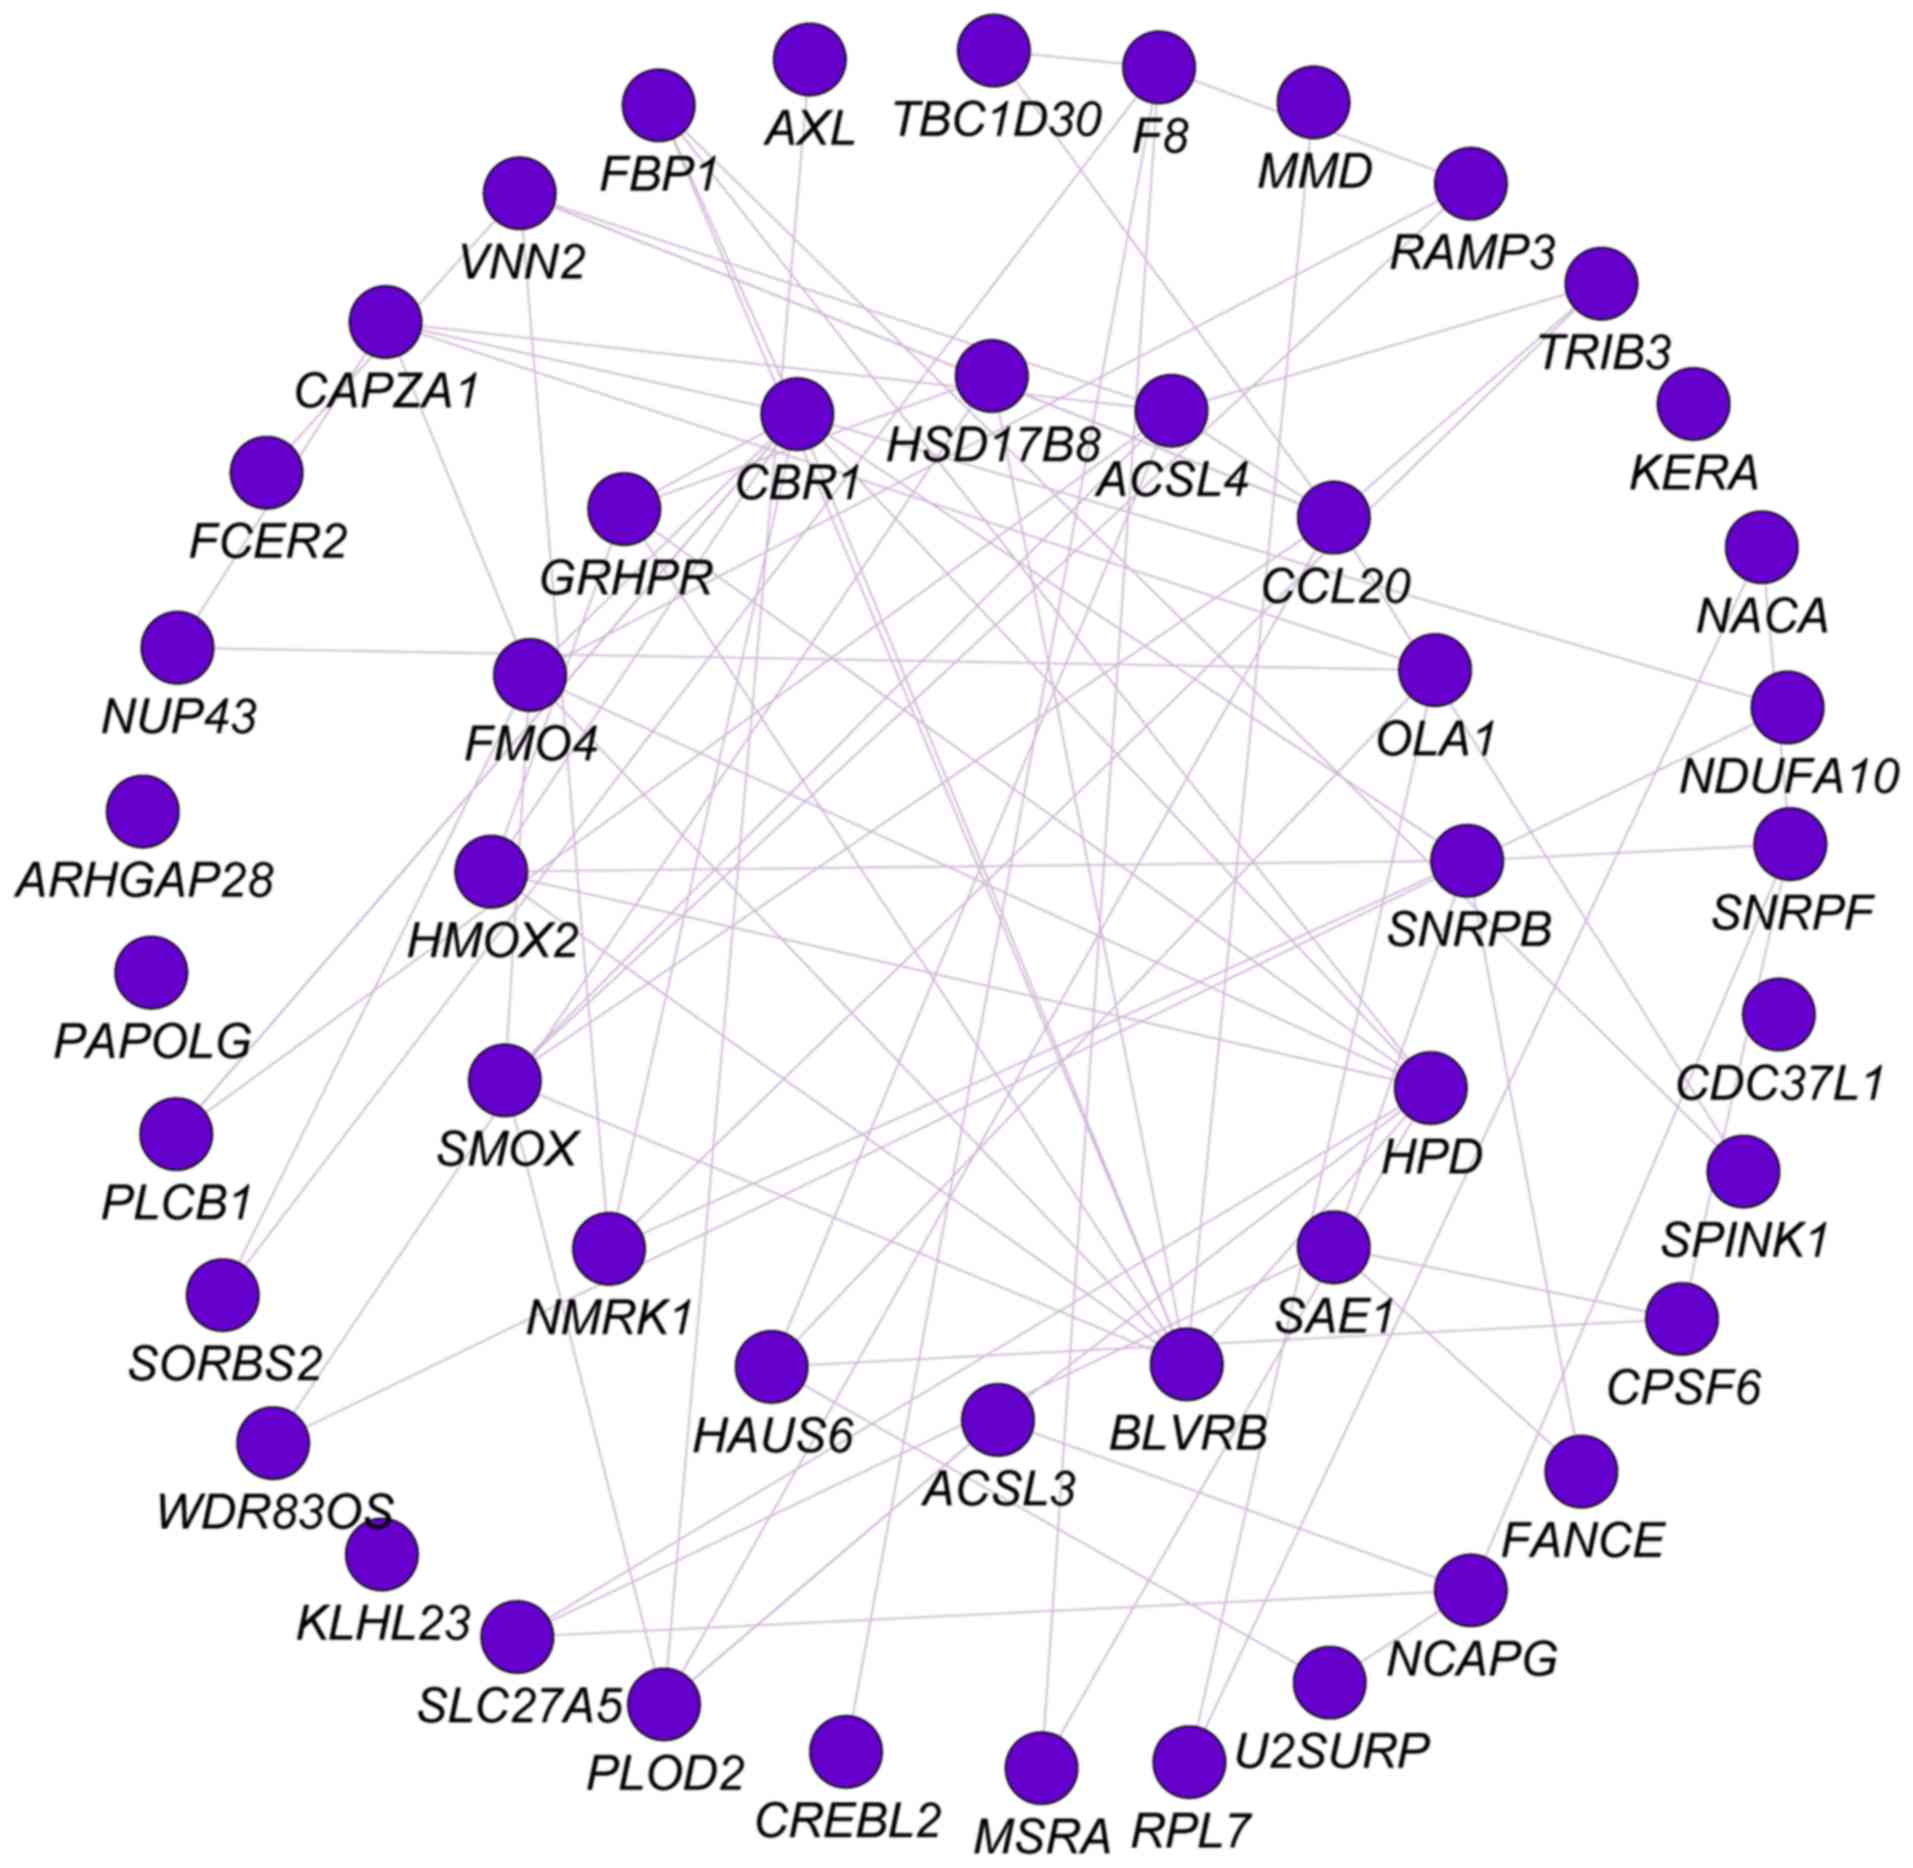
Analysis of PLCB1 and associated genes
genome-wide
Pearson correlation analysis was performed for PLCB1
genome-wide. A total of 53 genes were identified at r≥0.4.
Gene-gene interaction analysis was constructed and presented in
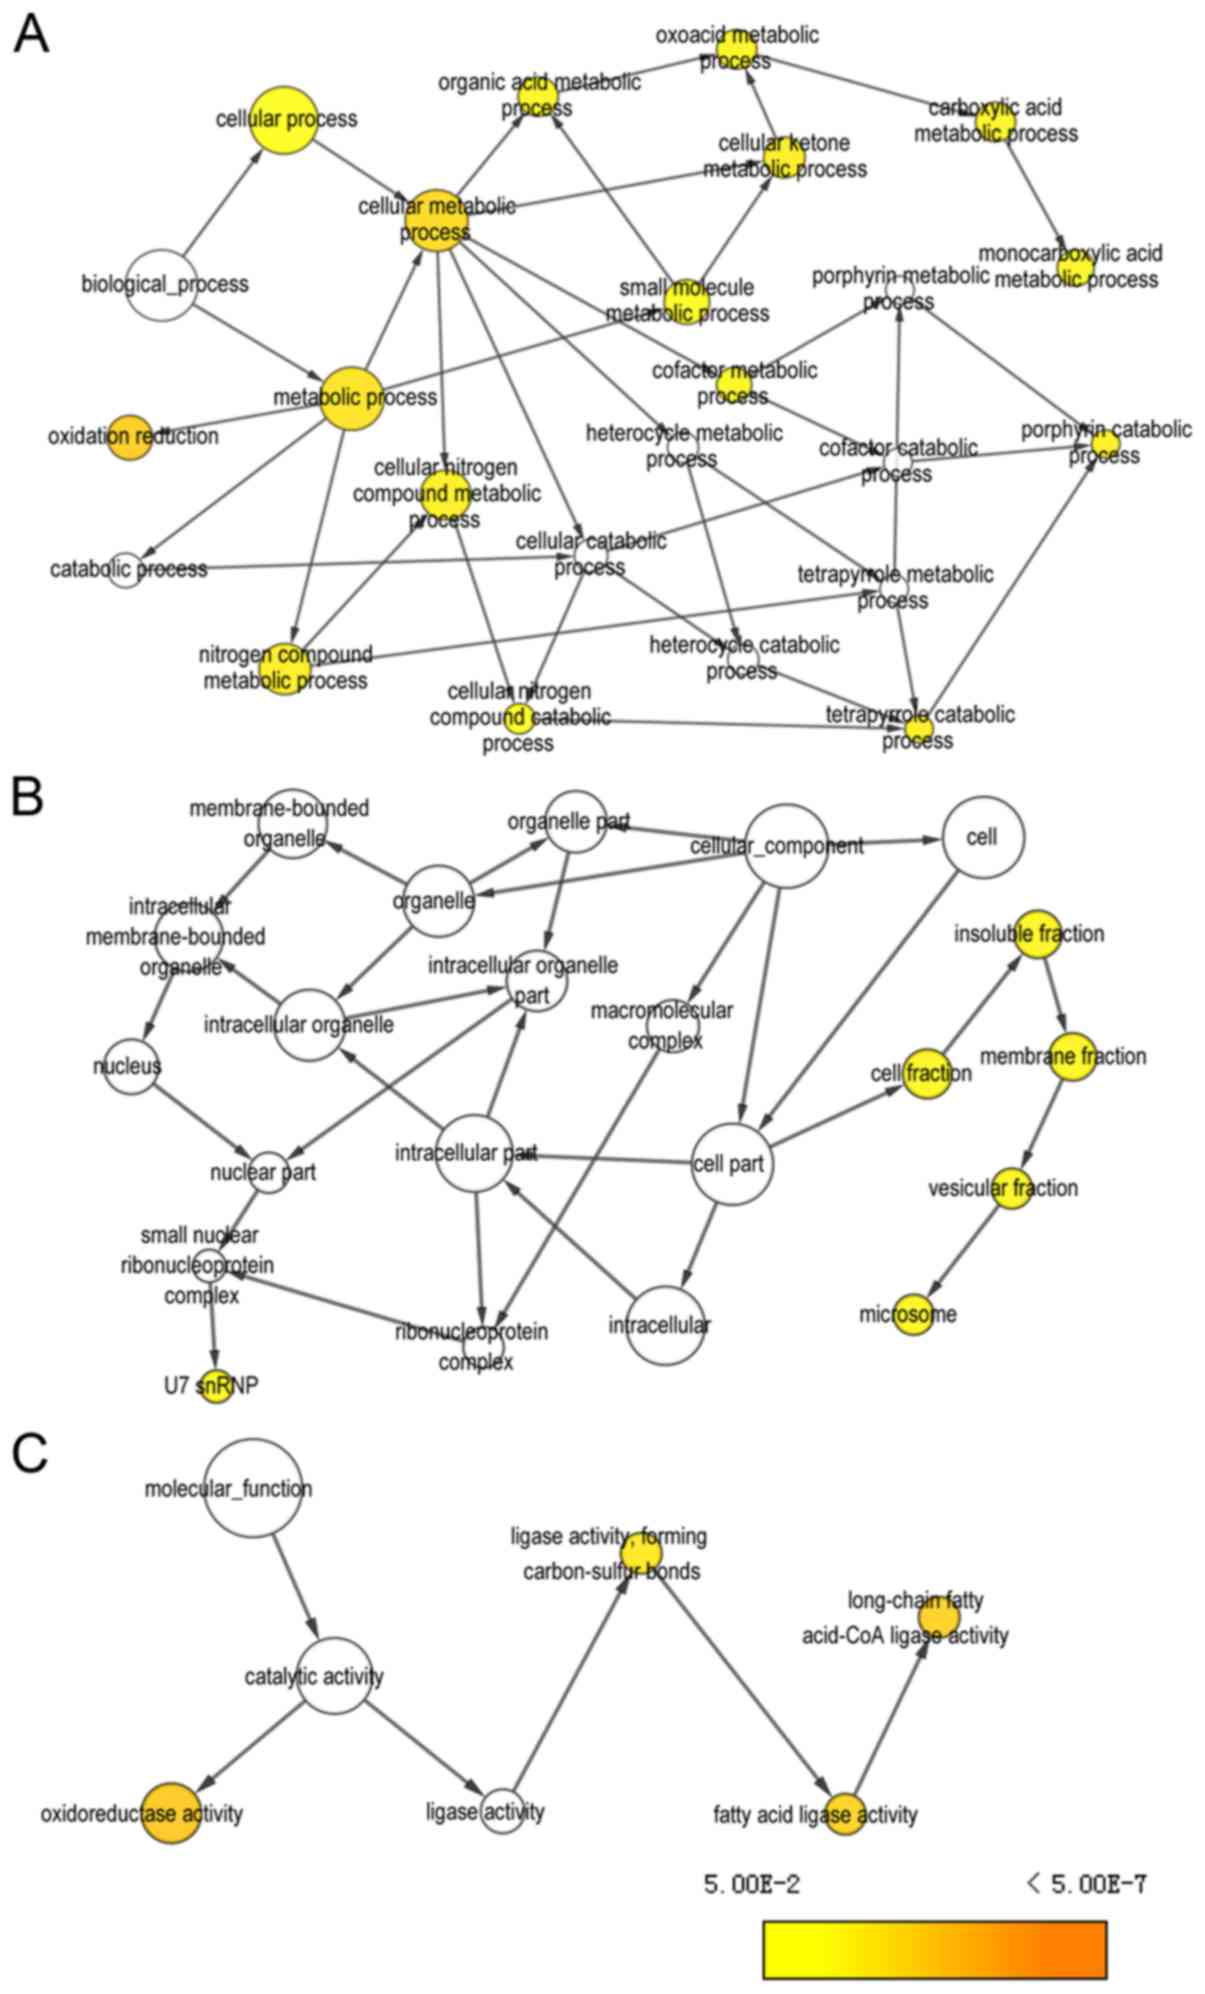
Fig. 12. Networks of BP, CC and MF
terms were constructed (Fig. 13).
Enriched GO terms and KEGG pathways annotated by PLCB1 and
correlated genes are presented in Table
V.
| Table V.Enrichment results of gene ontologies
and KEGG pathways of phospholipase B1 with genome-wide associated
genes. |
Table V.
Enrichment results of gene ontologies
and KEGG pathways of phospholipase B1 with genome-wide associated
genes.
| Category | Term | Count | P-value | False discovery
rate | Genes |
|---|
| Biological
process | Oxidation-reduction
process | 11 | 1.15E-06 | 0.001521 | FMO4, CBR1, MSRA,
PLOD2, BLVRB, F8, SMOX, GRHPR, NDUFA10, HPD, HSD17B8 |
| Molecular
function | Long-chain fatty
acid-CoA ligase activity | 3 | 0.000399 | 0.455909 | ACSL4, ACSL3,
SLC27A5 |
| Cellular
component | Extracellular
exosome | 16 | 0.000748 | 0.826682 | NACA, FCER2,
CAPZA1, FBP1, AXL, SPINK1, GRHPR, CBR1, MSRA, RPL7, PLOD2, BLVRB,
SNRPB, ACSL4, PLCB1, HPD |
| Biological
process | Long-chain fatty
acid metabolic process | 3 | 0.001186 | 1.559498 | ACSL4, ACSL3,
SLC27A5 |
| Cellular
component | Cytosol | 17 | 0.001409 | 1.552995 | CAPZA1, FBP1,
ARHGAP28, TRIB3, SAE1, GRHPR, CBR1, MSRA, RPL7, NCAPG, BLVRB,
SNRPB, SMOX, PLCB1, SNRPF, NUP43, HPD |
| Cellular
component | Endoplasmic
reticulum membrane | 7 | 0.012018 | 12.55815 | FMO4, HMOX2, PLOD2,
ACSL4, ACSL3, SLC27A5, HPD |
| Cellular
component | Actin
cytoskeleton | 4 | 0.012886 | 13.40731 | MSRA, SORBS2,
NCAPG, CAPZA1 |
| Cellular
component | U7 snRNP | 2 | 0.015645 | 16.05626 | SNRPB, SNRPF |
| Biological
process | Heme catabolic
process | 2 | 0.01697 | 20.28229 | HMOX2, BLVRB |
| Molecular
function | Decanoate-CoA
ligase activity | 2 | 0.018337 | 19.08795 | ACSL4, ACSL3 |
| Molecular
function | Very long-chain
fatty acid-CoA ligase activity | 2 | 0.02287 | 23.26214 | ACSL4, SLC27A5 |
| Cellular
component | U4 snRNP | 2 | 0.024478 | 24.04788 | SNRPB, SNRPF |
| Cellular
component | Methylosome | 2 | 0.026674 | 25.92421 | SNRPB, SNRPF |
| Biological
process | Cellular protein
modification process | 3 | 0.027107 | 30.50786 | MSRA, PLOD2,
SAE1 |
| Cellular
component | Small nucleolar
ribonucleoprotein complex | 2 | 0.028865 | 27.75428 | SNRPB, SNRPF |
| Biological
process | Histone mRNA
metabolic process | 2 | 0.028919 | 32.20282 | SNRPB, SNRPF |
| Biological
process | Positive regulation
of nitric-oxide synthase biosynthetic process | 2 | 0.031291 | 34.36424 | CCL20, FCER2 |
| Molecular
function | RNA binding | 5 | 0.036659 | 34.78158 | RPL7, SNRPB, CPSF6,
PAPOLG, SNRPF |
| Cellular
component | Intracellular
ribonucleoprotein complex | 3 | 0.037507 | 34.57769 | RPL7, SNRPB,
CPSF6 |
| Cellular
component | Small nuclear
ribonucleoprotein complex | 2 | 0.037582 | 34.63438 | SNRPB, SNRPF |
| Cellular
component | SMN-Sm protein
complex | 2 | 0.037582 | 34.63438 | SNRPB, SNRPF |
| Cellular
component | U1 snRNP | 2 | 0.041912 | 37.82519 | SNRPB, SNRPF |
| Biological
process | Nuclear import | 2 | 0.043071 | 44.18227 | SNRPB, SNRPF |
| Cellular
component | U12-type
spliceosomal complex | 2 | 0.056916 | 47.81769 | SNRPB, SNRPF |
| Biological
process | Metabolic
process | 3 | 0.063294 | 57.93576 | GRHPR, ACSL4,
ACSL3 |
| Biological
process | Drug metabolic
process | 2 | 0.063922 | 58.30767 | FMO4, CBR1 |
| Biological
process | Spliceosomal snRNP
assembly | 2 | 0.066211 | 59.63802 | SNRPB, SNRPF |
| Biological
process | mRNA
polyadenylation | 2 | 0.066211 | 59.63802 | CPSF6, PAPOLG |
| Biological
process | Regulation of
glucose transport | 2 | 0.077575 | 65.68049 | TRIB3, NUP43 |
| Biological
process | Regulation of
G-protein coupled receptor protein signaling pathway | 2 | 0.091035 | 71.75149 | RAMP3, PLCB1 |
| Biological
process | Long-chain
fatty-acyl-CoA biosynthetic process | 2 | 0.097693 | 74.37219 | ACSL4, ACSL3 |
| KEGG pathway | PPAR signaling
pathway | 3 | 0.031778 | 29.78018 | ACSL4, ACSL3,
SLC27A5 |
| KEGG pathway | Fatty acid
biosynthesis | 2 | 0.053251 | 45.0671 | ACSL4, ACSL3 |
| KEGG pathway | Metabolic
pathways | 10 | 0.058505 | 48.31368 | CBR1, FBP1, GRHPR,
ACSL4, PLCB1, NDUFA10, ACSL3, SLC27A5, HPD, HSD17B8 |
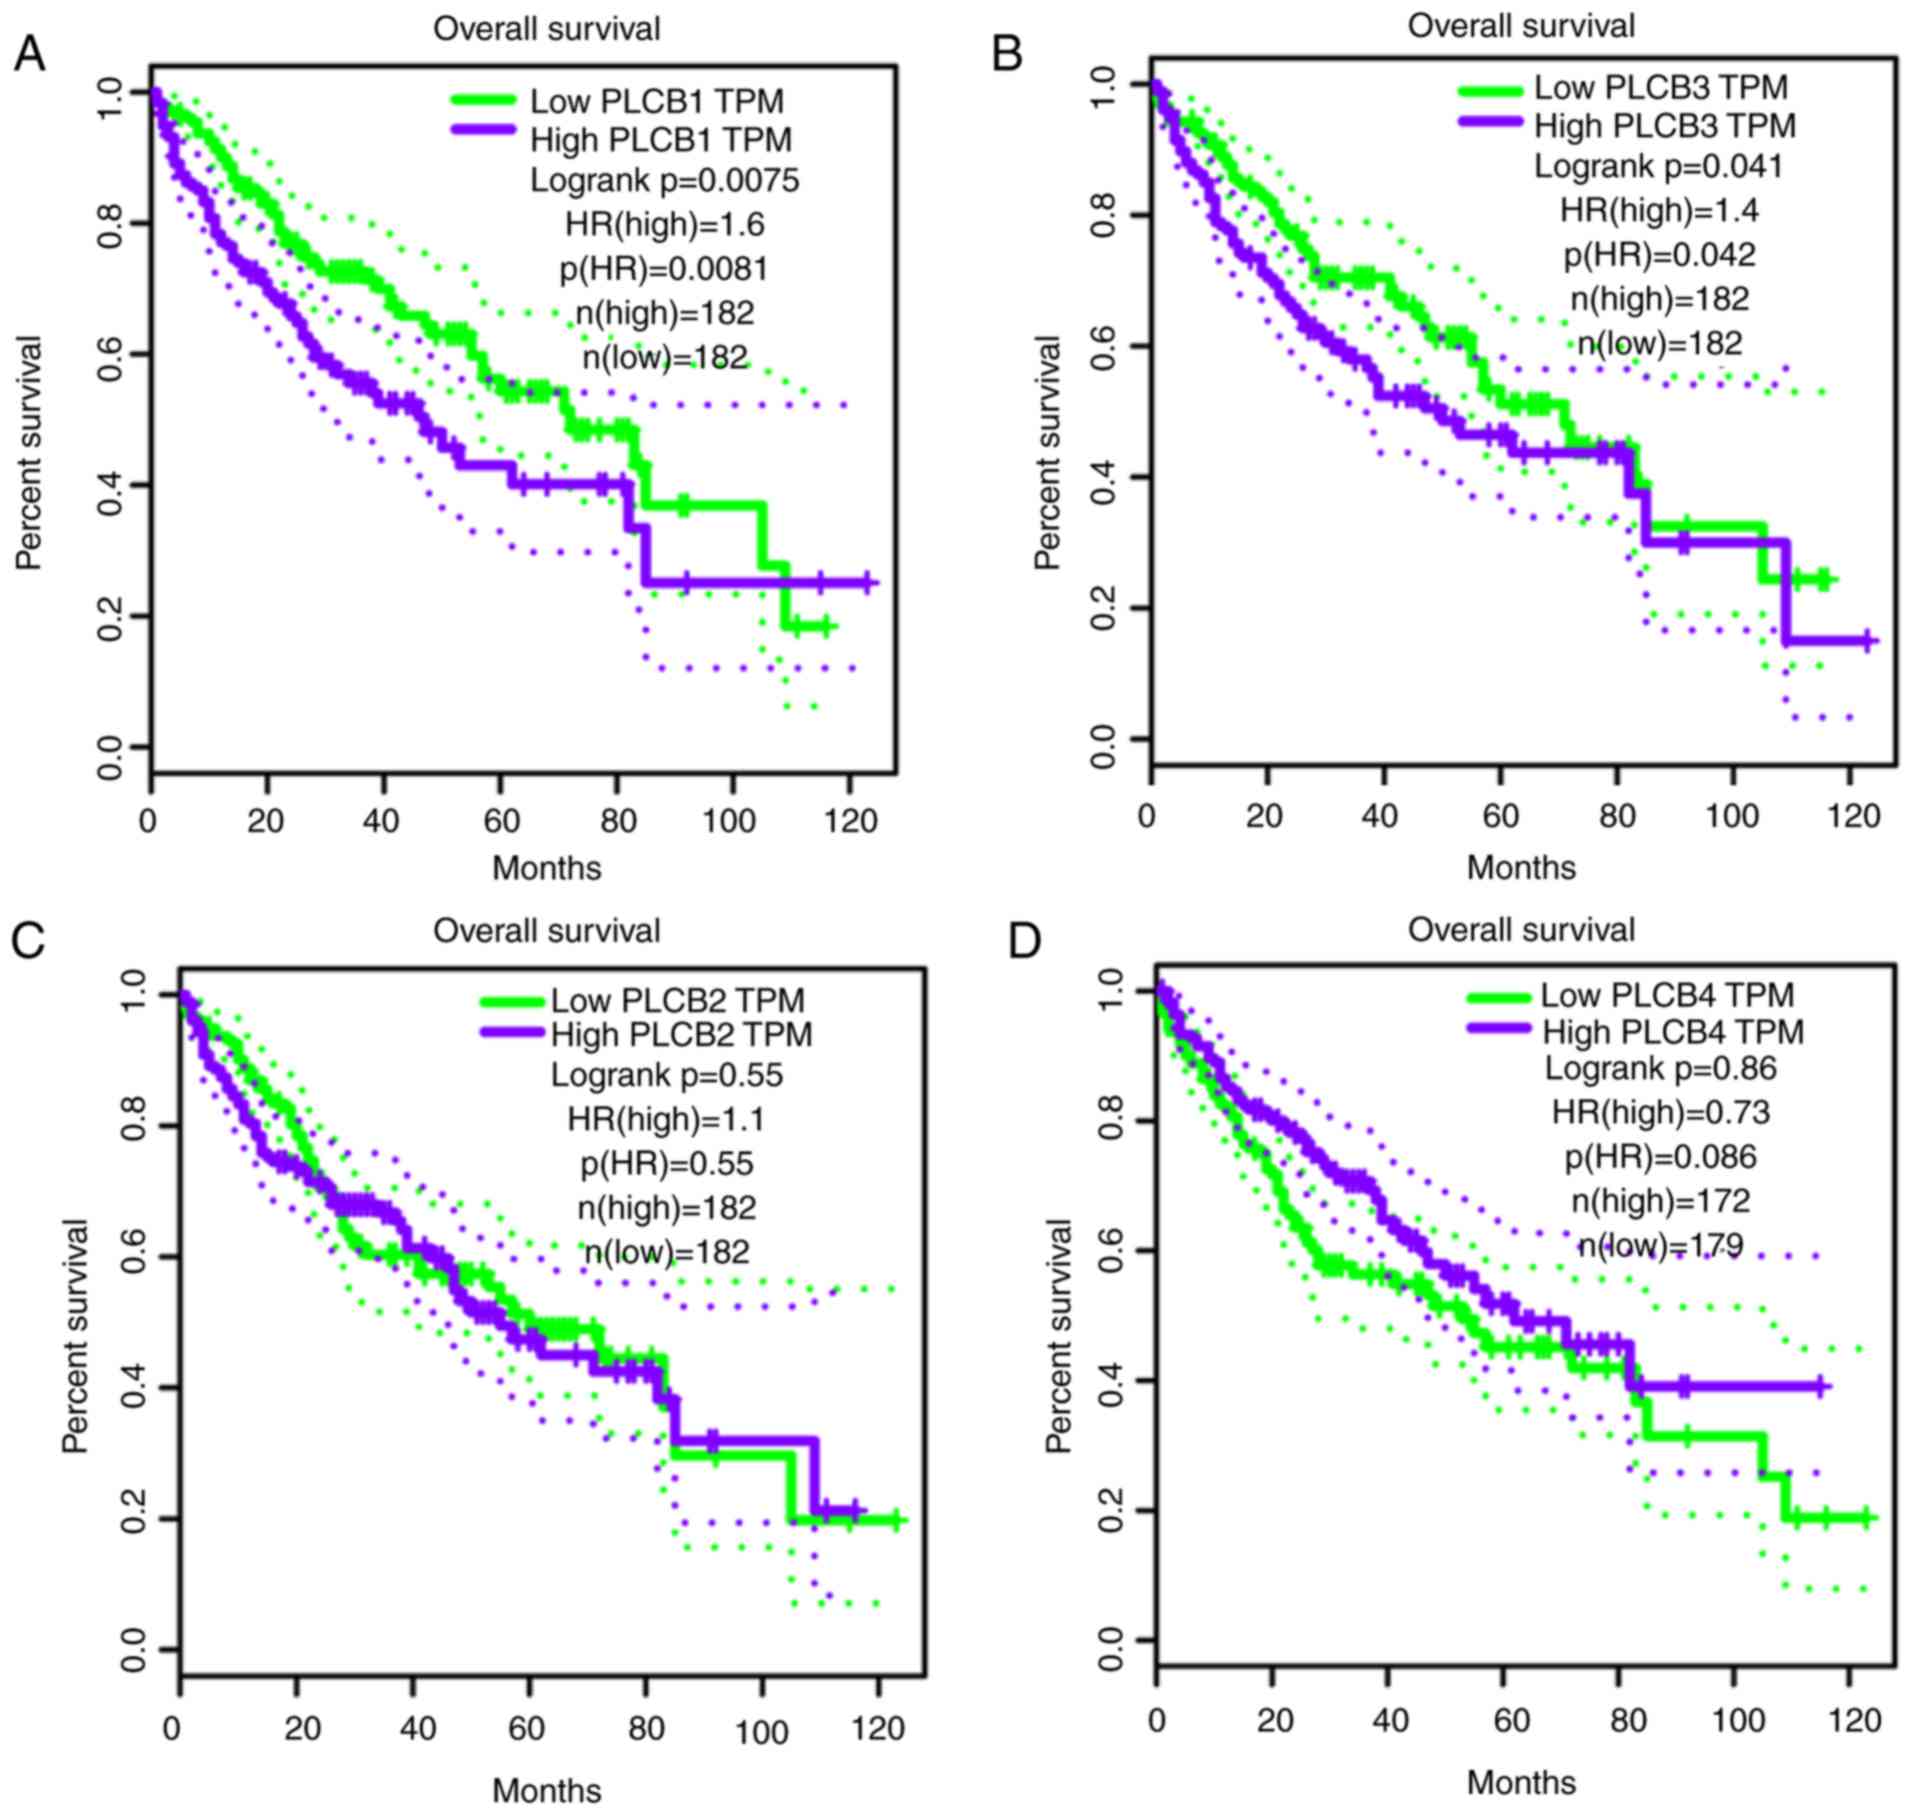
Validation of prognostic values of
PLCB genes
PLCB genes were further validated in GEPIA for OS
and RFS (Fig. 14). PLCB1
and PLCB2 were associated with OS (P=0.0075 and P=0.041,
respectively; Fig. 14A and B). In
addition, PLCB1 and PLCB4 were associated with RFS
(P<0.0001 and P<0.018, respectively; Fig. 14E and H). Other genes were not
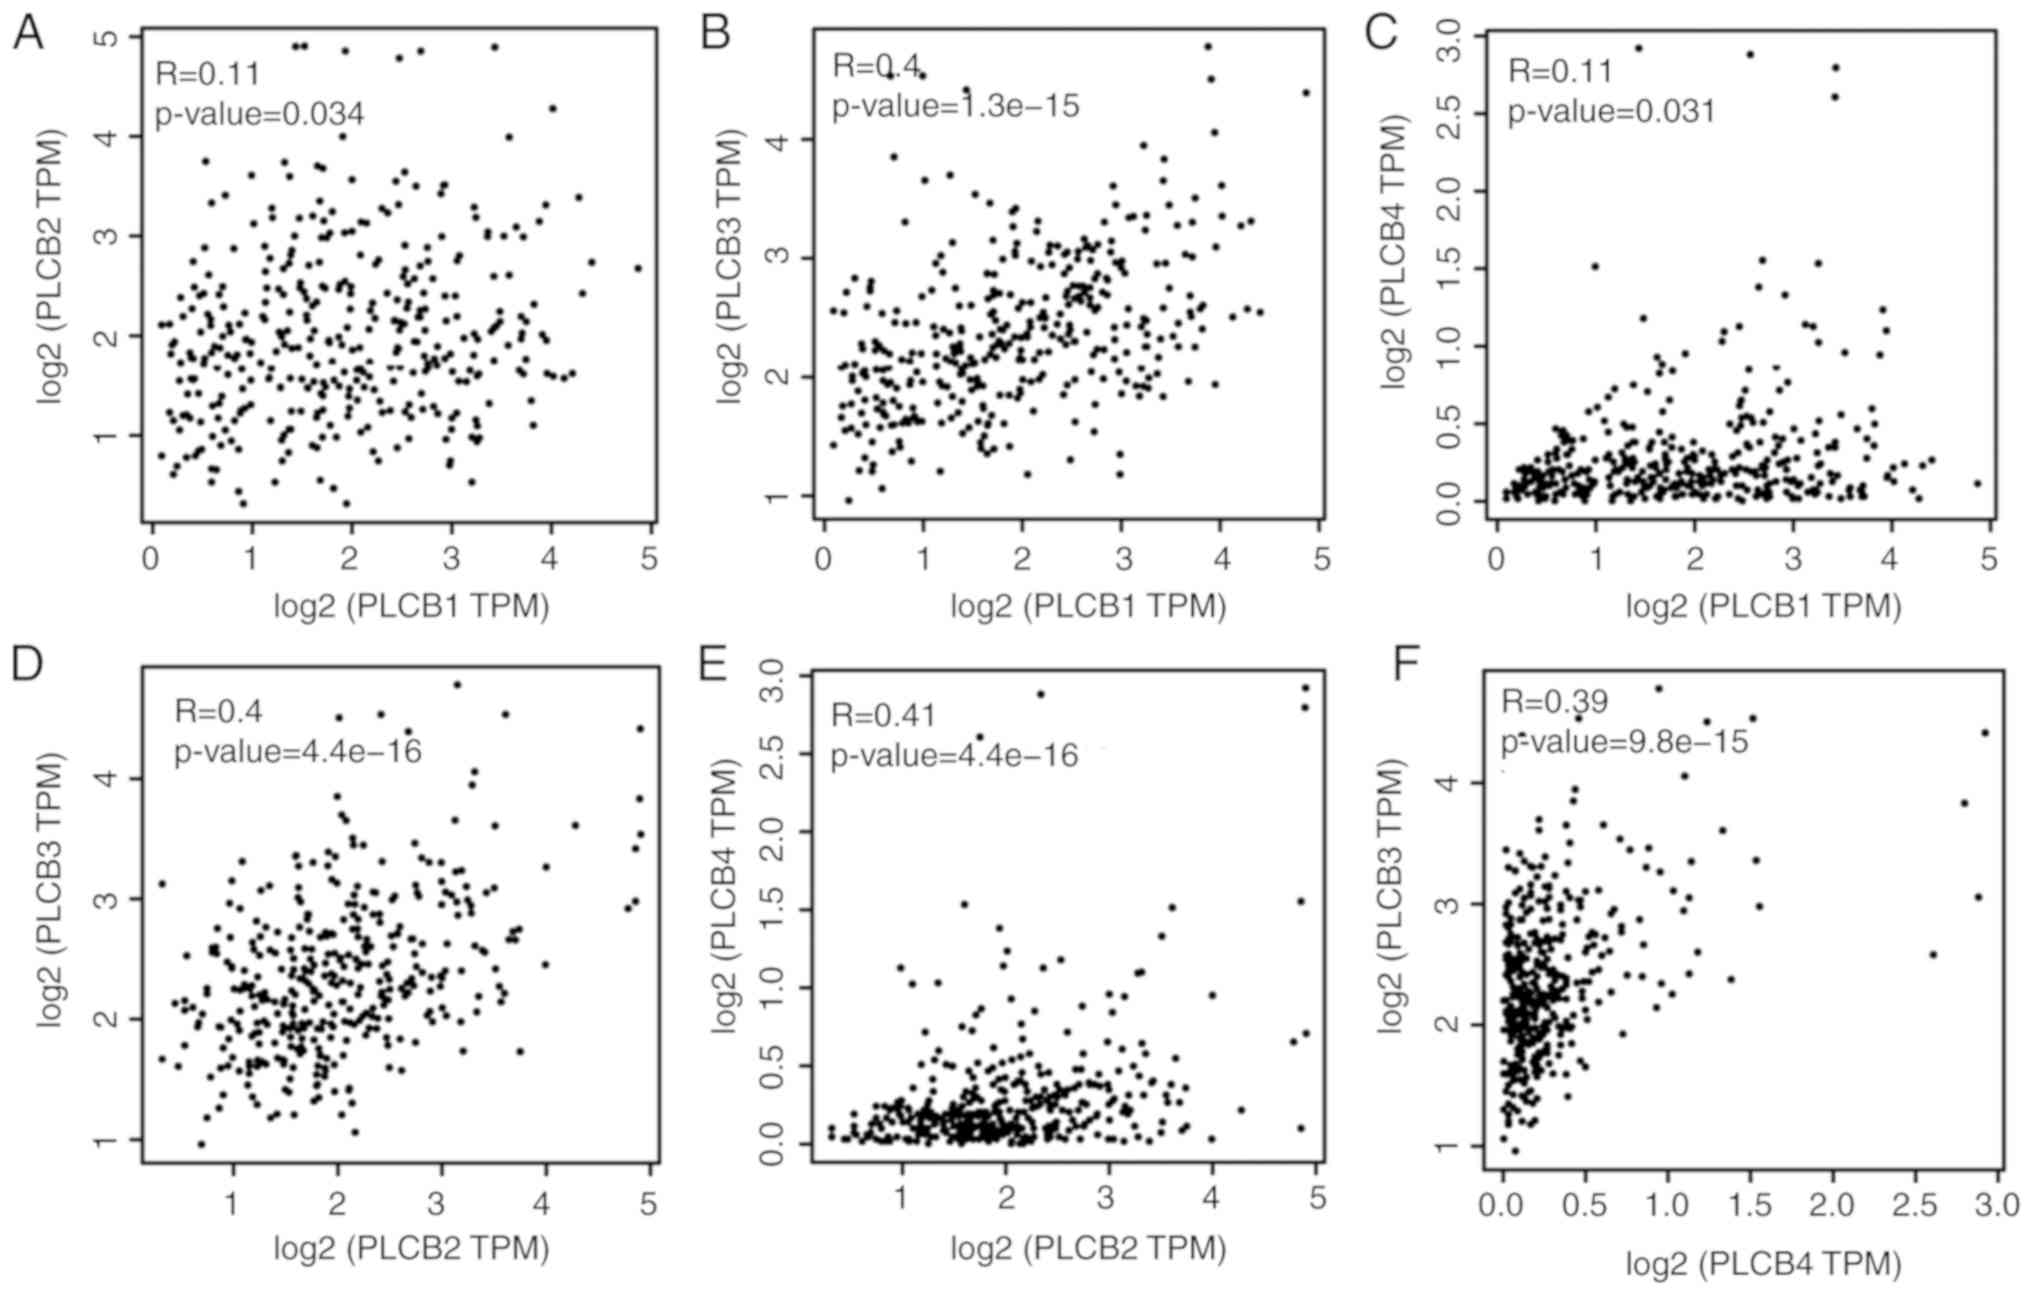
associated with OS or RFS (all P>0.05; Fig. 14). Pearson correlation in GEPIA
(Fig. 15) indicated that
PLCB1 was positively correlated with PLC3 and
PLCB4, while PLCB3 was positively correlated with
PLCB4, which is consistent with Fig. 11E.
Discussion
In the current study, it was identified that
PLCB1 and PLCB2 genes are differently expressed in
tumor and normal tissues. PLCB1 and PLCB2 have
diagnostic value for HCC, while PLCB3 has potential
diagnostic value for HCC. Combinations of these genes have an
advantage over PLCB1, PLCB2 or PLCB3 alone with
regard to HCC diagnosis. In addition, PLCB1 has prognostic
value of OS and RFS for HCC. Combining PLCB1 and AFP had an
advantage over PLCB1 alone for OS and RFS. GSEA indicated that
PLCB1 and PLCB2 were involved in ‘G protein coupled receptor
activity’, ‘sodium channel activity’, ‘cell division’, ‘cell cycle
checkpoint’, ‘DNA repair’, ‘PPAR signaling pathway’, ‘metabolism of
xenobiotics by cytochrome P450’ and ‘adipocytokine signaling
pathway’, among others. Nomograms and gene expression models were
constructed for HCC prognosis prediction. The validation of the
prognostic values of PLCB genes revealed that PLCB1 and
PLCB2 were associated with OS, and PLCB1 and
PLCB4 were associated with RFS.
PLC proteins are key enzymes that metabolize
inositol lipids and have a pivotal role in multiple transmembrane
signaling transduction pathways that modulate a series of cellular
processes, including cell proliferation and mobility (16). In mammalian cells, there are four
PLCB isoforms: PLCB1, PLCB2, PLCB3 and PLCB4. PLCB2 and PLCB3 are
activated by Gβγ dimers, which are released upon the activation of
Gα protein coupled receptor families (43). PLCB2 can also be activated by Rho
family members of monomeric G proteins, with the strongest
activation by Rac1; these participate in the cytoskeletal
rearrangements that accompany cell mobility (44).
The PLCB1 enzyme is encoded by the PLCB1
gene, which is located at chromosome of 20p12 (1). It was originally identified as a G
protein coupled receptor-associated PLCB isoform that is able
produce inositol 1,4,5-trisphosphate and diacylglycerol from
phosphatidylinositol 4,5-bisphophate (45). The deregulation of signaling
transduction pathways always leads to advantages for tumor patients
(1). PLCB1 is activated by
Gα and induces a variety of events, which may increase the total
intracellular calcium levels (46);
one possible result of this process is aberrant proliferation in
the cell (1). PLCB1 has been
reported to have a role in promoting cell cycle progression by
targeting cyclin-cyclin kinase complexes (47).
In addition, PLCB1 has been documented to
have a pivotal role in myoblast differentiation, regulating the
delayed differentiation of skeletal muscle in myotonic dystrophy
myoblasts (48). PLCB1 may
also reduce cell damage under oxidative conditions and prevent
α-synuclein aggregation (49). The
amplification of PLCB1 increased K562 cell viability and
enables cells to evade apoptosis (50,51);
the overexpression of PLCB1 keeps Swiss 3T3 cells in the S
phase of the cell cycle (52). Li
et al (1) reported that
upregulated PLCB1 expression is associated with tumor cell
proliferation and infers a poor prognosis for HCC. The present
study revealed that high expression has is undesirable for HCC
prognosis (OS and RFS), which is consistent with the results of Li
et al (1). Furthermore,
PLCB1 had diagnostic value for HCC.
PLCB2 mediates mitogenic, proliferative and
migratory events by interacting with heterotrimeric and monomeric G
proteins, and can interact with γ-synuclein to regulate G protein
activation (43). Bertagnolo et
al (53) reported that
PLCB2 induces cell cycle transition from G0/G1 to the S/G2/M
phases, which is critical for tumor progression, without affecting
cell cycle-associated enzymes. They also indicate that
PLCB2, by modifying the phospholipase pool, may be
responsible for the inositol lipid-associated modifications of the
cytoskeleton architecture that occur in the course of division,
motility and invasion of tumor cells (53). The current findings with regard to
the role of PLCB2 in the cell cycle and cell division are
consistent with the results of Bertagnolo et al (53).
PLCB2 has been reported to promote mitosis
and the migration of human breast cancer-derived cells (54), is highly expressed in breast cancer
and associated with poor prognosis (55); however, little is known about HCC
PLCB2 expression, and the role in HCC diagnosis and
prognosis. In the current study, PLCB2 expression as not
associated with HCC prognosis, but may be a diagnostic signature
for HCC.
PLCB3 is located on chromosome 11q13 in the
vicinity of the multiple endocrine neoplasia type 1 gene; its loss
leads to the development of neuroendocrine tumors (56). The transfection of PLCB3 to a
human endocrine pancreatic tumor cell line can induce the
activation of the human mismatch repair protein 3 gene (56). PLCB3 interacts with
Na(+)/H(+) exchange regulatory cofactor NHERF-1, providing a
structural basis for CXCR2 signaling in pancreatic cancer (57). Hoeppner et al (58) identified a novel role for
PLCB3, functioning as a negative regulator of vascular
endothelial growth factor-mediated vascular permeability by
regulating intracellular Ca2+ release. PLCB3 may
have a tumor suppressor role via SHP-1-mediated dephosphorylation
of Stat5 (59). Ju et al
(60) reported that PLCB and
Gqα may have important roles in scar remodeling, cardiac
hypertrophy and fibrosis following myocardial infarction rat
hearts. In the present study, PLCB3 expression exhibited
potential diagnostic value for HCC and without association with HCC
prognosis. PLCB3 may have a weak role in HCC if at all,
which requires further investigation.
Compared with other PLCB genes, PLCB4 is
less well characterized, and associations between PLCB4 and
cancer are unclear. The expression of PLCB4 and PLCB3
was previously explored in Purkinje cell subsets of the mouse
cerebellum (61). PLCB4 and
PLCB3 are differentially expressed in microarray databases
of non-small cell lung cancer, but neither are associated with the
prognosis and development of lung cancer (62). Orchel et al (63) reported that PLCB4 is
differentially expressed in 50 endometrium samples from women with
endometrial cancer, but is not associated with the treatment of
endometrial cancer. Furthermore, the present study did not find any
association between PLCB4 and HCC. Therefore, further
studies are required to explore the relationship between
PLCB4 expression and malignancy.
The findings of the present study indicate that
PLCB1 expression was associated with OS, whereas
PLCB1 and PLCB3 expression was associated with RFS in
univariate analysis. In multivariate analysis, PLCB1
expression was associated with OS and RFS. Multivariate cox
analysis contains several significant clinicopathological
characteristics, which produces new adjusted results and
conclusions. In addition, PLCB1 expression was associated
with OS, whereas PLCB1 and PLCB3 expression was
associated with RFS in univariate analysis. However, PLCB1
expression was associated with OS and RFS in multivariate analysis.
Different results may be due to varied clinicopathological
characteristics in the GSE14520 and TCGA dataset. Of course, HBV is
a pivotal factor associated with HCC.
There are some limitations to the present study
that should be recognized. Firstly, larger sample cohorts are
required to validate these findings. Additionally, the results are
based on a HBV-associated HCC population; therefore, further
explorations are needed in a study including HBV-infected and
non-infected patients. Finally, functional trials are required to
further explore the roles of PLCB genes in HCC initiation,
development, metastasis, proliferation and angiogenesis. BCLC stage
is an important factor associated with HCC and treatments
concerning BCLC stage should mentioned in the material section.
The present study demonstrated that the
PLCB1 and PLCB2 genes are differentially expressed
between tumor and normal tissues and have diagnostic values for
HCC. PLCB3 has a potential diagnostic value for HCC. The
combinations of these genes have an advantage over PLCB1,
PLCB2 or PLCB3 used alone for HCC diagnosis. In
addition, PLCB1 has OS and RFS prognostic value for HCC.
Combining PLCB1 and AFP was advantageous over PLCB1
alone for predicting OS and RFS. Nomogram and gene expression
models were used to construct and predict HCC prognosis. GO terms
and metabolic pathways associated with PLCB1 and
PLCB2 are include ‘G protein coupled receptor activity’,
‘cell division’, ‘cell cycle checkpoint’, ‘DNA repair’, ‘PPAR
signaling pathway’ and ‘metabolism of xenobiotics by cytochrome
P450’. Validation of the prognostic value of the PLCB genes
revealed that PLCB1, PLCB2 and PLCB4 are associated
with HCC prognosis.
Supplementary Material
Supporting Data
Acknowledgements
The authors would like to acknowledge researchers
for their contribution to open access data available via GTEx
portal, GEPIA, Kaplan-Meier Plotter, STRING and The Human Protein
Atlas websites. In addition, the authors would like to acknowledge
invaluable help from peer reviewers.
Funding
This work was supported in part by the National
Nature Science Foundation of China (grant no. 81560535, 81072321,
30760243, 30460143, 30560133 and 81802874), Natural Science
Foundation of Guangxi Province of China (grant no. 2017JJB140189y),
Key Laboratory of High-Incidence-Tumor Prevention and Treatment
(Guangxi Medical University), Ministry of Education (GKE2018-01),
2009 Program for New Century Excellent Talents in University
(NCET), Guangxi Nature Sciences Foundation (grant no. GuiKeGong
1104003A-7), and Guangxi Health Ministry Medicine Grant
(Key-Scientific Research-Grant; grant no. Z201018). The present
study is also partly supported by Scientific Research Fund of the
Health and Family Planning Commission of Guangxi Zhuang Autonomous
Region (grant no. Z2016318), The Basic Ability Improvement Project
for Middle-aged and Young Teachers in Colleges and Universities in
Guangxi (grant no. 2018KY0110). As well as, the present study is
also partly supported by Research Institute of Innovative
Think-tank in Guangxi Medical University (The gene-environment
interaction in hepatocarcinogenesis in Guangxi HCCs and its
translational applications in the HCC prevention). We also
acknowledge the supported by the National Key Clinical Specialty
Programs (General Surgery & Oncology) and the Key Laboratory of
Early Prevention & Treatment for Regional High-Incidence-Tumor
(Guangxi Medical University), Ministry of Education, China.
Availability of data and materials
The datasets analyzed during the current study are
available from the corresponding author on reasonable request.
Authors' contributions
XW and TP designed this study and the manuscript.
KH, XZ, ZL, XL, CY, TY, CH, GZ, WQ and TP conducted the study and
analyzed the data. XW wrote the manuscript and TP guided the
writing. All authors read and approved the final manuscript.
Ethics approval and consent to
participate
Not applicable.
Patient consent for publication
Not applicable.
Competing interests
The authors declare that they have no competing
interests.
Glossary
Abbreviations
Abbreviations:
|
HCC
|
hepatocellular carcinoma
|
|
PLCB
|
phospholipase C β
|
|
HBV
|
hepatitis B virus
|
|
GEO
|
gene expression omnibus
|
|
GEPIA
|
gene expression profiling interactive
analysis
|
|
GSEA
|
gene set enrichment analysis
|
|
BP
|
biological process
|
|
CC
|
cellular component
|
|
MF
|
molecular function
|
|
GO
|
gene ontology
|
|
OS
|
overall survival
|
|
RFS
|
recurrence-free survival
|
|
MST
|
median survival time
|
|
CI
|
confidence interval
|
|
HR
|
hazard ratio
|
|
ROC
|
receiver operating characteristic
|
|
PPI
|
protein-protein interaction
|
References
|
1
|
Li J, Zhao X, Wang D, He W, Zhang S, Cao
W, Huang Y, Wang L, Zhou S and Luo K: Up-regulated expression of
phospholipase C, β1 is associated with tumor cell proliferation and
poor prognosis in hepatocellular carcinoma. Onco Targets Ther.
9:1697–1706. 2016.PubMed/NCBI
|
|
2
|
Bray F, Ferlay J, Soerjomataram I, Siegel
RL, Torre LA and Jemal A: Global cancer statistics 2018: GLOBOCAN
estimates of incidence and mortality worldwide for 36 cancers in
185 countries. CA Cancer J Clin. 68:394–424. 2018. View Article : Google Scholar : PubMed/NCBI
|
|
3
|
Poon D, Anderson BO, Chen LT, Tanaka K,
Lau WY, Van Cutsem E, Singh H, Chow WC, Ooi LL, Chow P, et al:
Management of hepatocellular carcinoma in Asia: Consensus statement
from the Asian Oncology Summit 2009. Lancet Oncol. 10:1119–1127.
2009. View Article : Google Scholar : PubMed/NCBI
|
|
4
|
Tagliamonte M, Petrizzo A, Napolitano M,
Luciano A, Arra C, Maiolino P, Izzo F, Tornesello ML, Aurisicchio
L, Ciliberto G, et al: Novel metronomic chemotherapy and cancer
vaccine combinatorial strategy for hepatocellular carcinoma in a
mouse model. Cancer Immunol Immunother. 64:1305–1314. 2015.
View Article : Google Scholar : PubMed/NCBI
|
|
5
|
Lencioni R and Crocetti L: Local-regional
treatment of hepatocellular carcinoma. Radiology. 262:43–58. 2012.
View Article : Google Scholar : PubMed/NCBI
|
|
6
|
Kanwal F, El-Serag HB and Ross D:
Surveillance for hepatocellular carcinoma: Can we focus on the
mission? Clin Gastroenterol Hepatol. 13:805–807. 2015. View Article : Google Scholar : PubMed/NCBI
|
|
7
|
Gao Q, Wang XY, Zhou J and Fan J:
Heterogeneity of intermediate-stage HCC necessitates personalized
management including surgery. Nat Rev Clin Oncol. 12:102015.
View Article : Google Scholar : PubMed/NCBI
|
|
8
|
Songer JG: Bacterial phospholipases and
their role in virulence. Trends Microbiol. 5:156–161. 1997.
View Article : Google Scholar : PubMed/NCBI
|
|
9
|
Talarico S, Durmaz R and Yang Z:
Insertion- and deletion-associated genetic diversity of
Mycobacterium tuberculosis phospholipase C-encoding genes among 106
clinical isolates from Turkey. J Clin Microbiol. 43:533–538. 2005.
View Article : Google Scholar : PubMed/NCBI
|
|
10
|
Smith GA, Marquis H, Jones S, Johnston NC,
Portnoy DA and Goldfine H: The two distinct phospholipases C of
Listeria monocytogenes have overlapping roles in escape from
a vacuole and cell-to-cell spread. Infect Immun. 63:4231–4237.
1995.PubMed/NCBI
|
|
11
|
Cole ST, Brosch R, Parkhill J, Garnier T,
Churcher C, Harris D, Gordon SV, Eiglmeier K, Gas S, Barry CE III,
et al: Deciphering the biology of Mycobacterium tuberculosis from
thecomplete genome sequence. Nature. 393:537–544. 1998. View Article : Google Scholar : PubMed/NCBI
|
|
12
|
Fleischmann RD, Alland D, Eisen JA,
Carpenter L, White O, Peterson J, DeBoy R, Dodson R, Gwinn M, Haft
D, et al: Whole-genome comparison of Mycobacterium tuberculosis
clinical and laboratory strains. J Bacteriol. 184:5479–5490. 2002.
View Article : Google Scholar : PubMed/NCBI
|
|
13
|
Kocks C, Gouin E, Tabouret M, Berche P,
Ohayon H and Cossart P: L. monocytogenes-induced actin
assembly requires the actA gene product, a surface protein. Cell.
68:521–531. 1992. View Article : Google Scholar : PubMed/NCBI
|
|
14
|
Vazquezboland JA, Kocks C, Dramsi S,
Ohayon H, Geoffroy C, Mengaud J and Cossart P: Nucleotide sequence
of the lecithinase operon of Listeria monocytogenes and
possible role of lecithinase in cell-to-cell spread. Infect Immun.
60:219–230. 1992.PubMed/NCBI
|
|
15
|
Cossart P: Illuminating the landscape of
host-pathogen interactions with the bacterium Listeria
monocytogenes. Proc Natl Acad Sci USA. 108:19484–19491. 2011.
View Article : Google Scholar : PubMed/NCBI
|
|
16
|
Rhee SG: Regulation of
phosphoinositide-specific phospholipase C. Annu Rev Biochem.
70:281–312. 2001. View Article : Google Scholar : PubMed/NCBI
|
|
17
|
Nakahara M, Shimozawa M, Nakamura Y, Irino
Y, Morita M, Kudo Y and Fukami K: A novel phospholipase C,
PLC(eta)2, is a neuron-specific isozyme. J Biol Chem.
280:29128–29134. 2005. View Article : Google Scholar : PubMed/NCBI
|
|
18
|
Lo Vasco VR, Cardinale G and Polonia P:
Deletion of PLCB1 gene in schizophrenia-affected patients. J Cell
Mol Med. 16:844–851. 2012. View Article : Google Scholar : PubMed/NCBI
|
|
19
|
Yang M, Li H, Li Y, Ruan Y and Quan C:
Identification of genes and pathways associated with MDR in
MCF-7/MDR breast cancer cells by RNA-seq analysis. Mol Med Rep.
17:6211–6226. 2018.PubMed/NCBI
|
|
20
|
Zhong M, Murtazina DA, Phillips J, Ku CY
and Sanborn BM: Multiple signals regulate phospholipase CBeta3 in
human myometrial cells. Biol Reprod. 78:1007–1017. 2008. View Article : Google Scholar : PubMed/NCBI
|
|
21
|
Wu IC, Liu WC and Chang TT: Applications
of next-generation sequencing analysis for the detection of
hepatocellular carcinoma-associated hepatitis B virus mutations. J
Biomed Sci. 25:512018. View Article : Google Scholar : PubMed/NCBI
|
|
22
|
Kramvis A, Arakawa K, Yu MC, Nogueira R,
Stram DO and Kew MC: Relationship of serological subtype, basic
core promoter and precore mutations to genotypes/subgenotypes of
hepatitis B virus. J Med Virol. 80:27–46. 2008. View Article : Google Scholar : PubMed/NCBI
|
|
23
|
Chu CJ, Keeffe EB, Han SH, Perrillo RP,
Min AD, Soldevila-Pico C, Carey W, Brown RS Jr, Luketic VA,
Terrault N and Lok AS: Hepatitis B virus genotypes in the United
States: Results of a nationwide study. Gastroenterology.
125:444–451. 2003. View Article : Google Scholar : PubMed/NCBI
|
|
24
|
Lin CL and Kao JH: The clinical
implications of hepatitis B virus genotype: Recent advances. J
Gastroenterol Hepatol. 26 (Suppl 1):S123–S130. 2011. View Article : Google Scholar
|
|
25
|
Chan HL, Hui AY, Wong ML, Tse AM, Hung LC,
Wong VW and Sung JJ: Genotype C hepatitis B virus infection is
associated with an increased risk of hepatocellular carcinoma. Gut.
53:1494–1498. 2004. View Article : Google Scholar : PubMed/NCBI
|
|
26
|
Chu CJ, Hussain M and Lok AS: Hepatitis B
virus genotype B is associated with earlier HBeAg seroconversion
compared with hepatitis B virus genotype C. Gastroenterology.
122:1756–1762. 2002. View Article : Google Scholar : PubMed/NCBI
|
|
27
|
Sumi H, Yokosuka O, Seki N, Arai M,
Imazeki F, Kurihara T, Kanda T, Fukai K, Kato M and Saisho H:
Influence of hepatitis B virus genotypes on the progression of
chronic type B liver disease. Hepatology. 37:19–26. 2003.
View Article : Google Scholar : PubMed/NCBI
|
|
28
|
Roessler S, Jia HL, Budhu A, Forgues M, Ye
QH, Lee JS, Thorgeirsson SS, Sun Z, Tang ZY, Qin LX and Wang XW: A
unique metastasis gene signature enables prediction of tumor
relapse in early-stage hepatocellular carcinoma patients. Cancer
Res. 70:10202–10212. 2010. View Article : Google Scholar : PubMed/NCBI
|
|
29
|
Roessler S, Long EL, Budhu A, Chen Y, Zhao
X, Ji J, Walker R, Jia HL, Ye QH, Qin LX, et al: Integrative
genomic identification of genes on 8p associated with
hepatocellular carcinoma progression and patient survival.
Gastroenterology. 142:957–966.e912. 2012. View Article : Google Scholar : PubMed/NCBI
|
|
30
|
Tang Z, Li C, Kang B, Gao G, Li C and
Zhang Z: GEPIA: A web server for cancer and normal gene expression
profiling and interactive analyses. Nucleic Acids Res. 45:W98–W102.
2017. View Article : Google Scholar : PubMed/NCBI
|
|
31
|
Carithers LJ, Ardlie K, Barcus M, Branton
PA, Britton A, Buia SA, Compton CC, DeLuca DS, Peter-Demchok J,
Gelfand ET, et al: A novel approach to high-quality postmortem
tissue procurement: The GTEx project. Biopreserv Biobank.
13:311–319. 2015. View Article : Google Scholar : PubMed/NCBI
|
|
32
|
Uhlén M, Fagerberg L, Hallström BM,
Lindskog C, Oksvold P, Mardinoglu A, Sivertsson Å, Kampf C,
Sjöstedt E, Asplund A, et al: Proteomics. Tissue-based map of the
human proteome. Science. 347:12604192015. View Article : Google Scholar : PubMed/NCBI
|
|
33
|
Subramanian A, Tamayo P, Mootha VK,
Mukherjee S, Ebert BL, Gillette MA, Paulovich A, Pomeroy SL, Golub
TR, Lander ES and Mesirov JP: Gene set enrichment analysis: A
knowledge-based approach for interpreting genome-wide expression
profiles. Proc Natl Acad Sci USA. 102:15545–15550. 2005. View Article : Google Scholar : PubMed/NCBI
|
|
34
|
Mootha VK, Lindgren CM, Eriksson KF,
Subramanian A, Sihag S, Lehar J, Puigserver P, Carlsson E,
Ridderstråle M, Laurila E, et al: PGC-1alpha-responsive genes
involved in oxidative phosphorylation are coordinately
downregulated in human diabetes. Nat Genet. 34:267–273. 2003.
View Article : Google Scholar : PubMed/NCBI
|
|
35
|
Shannon P, Markiel A, Ozier O, Baliga NS,
Wang JT, Ramage D, Amin N, Schwikowski B and Ideker T: Cytoscape: A
software environment for integrated models of biomolecular
interaction networks. Genome Res. 13:2498–2504. 2003. View Article : Google Scholar : PubMed/NCBI
|
|
36
|
Montojo J, Zuberi K, Rodriguez H, Kazi F,
Wright G, Donaldson SL, Morris Q and Bader GD: GeneMANIA Cytoscape
plugin: Fast gene function predictions on the desktop.
Bioinformatics. 26:2927–2928. 2010. View Article : Google Scholar : PubMed/NCBI
|
|
37
|
Szklarczyk D, Morris JH, Cook H, Kuhn M,
Wyder S, Simonovic M, Santos A, Doncheva NT, Roth A, Bork P, et al:
The STRING database in 2017: Quality-controlled protein-protein
association networks, made broadly accessible. Nucleic Acids Res.
45:D362–D368. 2017. View Article : Google Scholar : PubMed/NCBI
|
|
38
|
Maere S, Heymans K and Kuiper M: BiNGO: A
Cytoscape plugin to assess overrepresentation of gene ontology
categories in biological networks. Bioinformatics. 21:3448–3449.
2005. View Article : Google Scholar : PubMed/NCBI
|
|
39
|
Lossos IS, Czerwinski DK, Alizadeh AA,
Wechser MA, Tibshirani R, Botstein D and Levy R: Prediction of
survival in diffuse large-B-cell lymphoma based on the expression
of six genes. N Engl J Med. 350:1828–1837. 2004. View Article : Google Scholar : PubMed/NCBI
|
|
40
|
Alizadeh AA, Gentles AJ, Alencar AJ, Liu
CL, Kohrt HE, Houot R, Goldstein MJ, Zhao S, Natkunam Y, Advani RH,
et al: Prediction of survival in diffuse large B-cell lymphoma
based on the expression of 2 genes reflecting tumor and
microenvironment. Blood. 118:1350–1358. 2011. View Article : Google Scholar : PubMed/NCBI
|
|
41
|
Liao X, Han C, Wang X, Huang K, Yu T, Yang
C, Huang R, Liu Z, Han Q and Peng T: Prognostic value of
minichromosome maintenance mRNA expression in early-stage
pancreatic ductal adenocarcinoma patients after
pancreaticoduodenectomy. Cancer Manag Res. 10:3255–3271. 2018.
View Article : Google Scholar : PubMed/NCBI
|
|
42
|
Liao X, Liu X, Yang C, Wang X, Yu T, Han
C, Huang K, Zhu G, Su H, Qin W, et al: Distinct diagnostic and
prognostic values of minichromosome maintenance gene expression in
patients with hepatocellular carcinoma. J Cancer. 9:2357–2373.
2018. View Article : Google Scholar : PubMed/NCBI
|
|
43
|
Golebiewska U, Guo Y, Khalikaprasad N,
Zurawsky C, Yerramilli VS and Scarlata S: γ-Synuclein interacts
with phospholipase Cβ2 to modulate G protein activation. PLoS One.
7:e410672012. View Article : Google Scholar : PubMed/NCBI
|
|
44
|
Harden TK and Sondek J: Regulation of
phospholipase C isozymes by ras superfamily GTPases. Annu Rev
Pharmacol Toxicol. 46:355–379. 2006. View Article : Google Scholar : PubMed/NCBI
|
|
45
|
Martelli AM, Fiume R, Faenza I, Tabellini
G, Evangelista C, Bortul R, Follo MY, Falà F and Cocco L: Nuclear
phosphoinositide specific phospholipase C (PI-PLC)-beta 1: A
central intermediary in nuclear lipid-dependent signal
transduction. Histol Histopathol. 20:1251–1260. 2005.PubMed/NCBI
|
|
46
|
Ngoh A, Mctague A, Wentzensen IM, Meyer E,
Applegate C, Kossoff EH, Batista DA, Wang T and Kurian MA: Severe
infantile epileptic encephalopathy due to mutations in PLCB1:
Expansion of the genotypic and phenotypic disease spectrum. Dev Med
Child Neurol. 56:1124–1128. 2014. View Article : Google Scholar : PubMed/NCBI
|
|
47
|
Faenza I, Matteucci A, Manzoli L, Billi
AM, Aluigi M, Peruzzi D, Vitale M, Castorina S, Suh PG and Cocco L:
A role for nuclear phospholipase Cbeta 1 in cell cycle control. J
Biol Chem. 275:30520–30524. 2000. View Article : Google Scholar : PubMed/NCBI
|
|
48
|
Cocco L, Finelli C, Mongiorgi S, Clissa C,
Russo D, Bosi C, Quaranta M, Malagola M, Parisi S, Stanzani M, et
al: An increased expression of PI-PLCβ1 is associated with myeloid
differentiation and a longer response to azacitidine in
myelodysplastic syndromes. J Leukoc Biol. 98:769–780. 2015.
View Article : Google Scholar : PubMed/NCBI
|
|
49
|
Guo Y and Scarlata S: A loss in cellular
protein partners promotes α-synuclein aggregation in cells
resulting from oxidative stress. Biochemistry. 52:3913–3920. 2013.
View Article : Google Scholar : PubMed/NCBI
|
|
50
|
Poli A, Faenza I, Chiarini F, Matteucci A,
Mccubrey JA and Cocco L: K562 cell proliferation is modulated by
PLCβ1 through a PKCα-mediated pathway. Cell Cycle. 12:1713–1721.
2013. View Article : Google Scholar : PubMed/NCBI
|
|
51
|
Bavelloni A, Poli A, Fiume R, Blalock W,
Matteucci A, Ramazzotti G, McCubrey JA, Cocco L and Faenza I:
PLC-beta 1 regulates the expression of miR-210 during
mithramycin-mediated erythroid differentiation in K562 cells.
Oncotarget. 5:4222–4231. 2014. View Article : Google Scholar : PubMed/NCBI
|
|
52
|
Ho KK and Mann DJ: Nuclear signalling
through phospholipase C and phosphatidylinositol 4,5-bisphosphate.
Signal Transduction. 6:92–100. 2006. View Article : Google Scholar
|
|
53
|
Bertagnolo V, Benedusi M, Brugnoli F,
Lanuti P, Marchisio M, Querzoli P and Capitani S: Phospholipase
C-β2 promotes mitosis and migration of human breast cancer-derived
cells. Carcinogenesis. 28:1638–1645. 2007. View Article : Google Scholar : PubMed/NCBI
|
|
54
|
Bertagnolo V, Benedusi M, Brugnoli F,
Lanuti P, Marchisio M, Querzoli P and Capitani S: Phospholipase
C-beta 2 promotes mitosis and migration of human breast
cancer-derived cells. Carcinogenesis. 28:1638–1645. 2007.
View Article : Google Scholar : PubMed/NCBI
|
|
55
|
Bertagnolo V, Benedusi M, Querzoli P,
Pedriali M, Magri E, Brugnoli F and Capitani S: PLC-beta2 is highly
expressed in breast cancer and is associated with a poor outcome: A
study on tissue microarrays. Int J Oncol. 28:863–872.
2006.PubMed/NCBI
|
|
56
|
Stålberg P, Lopez-Egido JR, Wang S, Gobl
A, Oberg K and Skogseid B: Differentially expressed cDNAs in
PLCbeta3-induced tumor suppression in a human endocrine pancreatic
tumor cell line: Activation of the human mismatch repair protein 3
gene. Biochem Biophys Res Commun. 281:227–231. 2001. View Article : Google Scholar : PubMed/NCBI
|
|
57
|
Jiang Y, Wang S, Holcomb J, Trescott L,
Guan X, Hou Y, Brunzelle J, Sirinupong N, Li C and Yang Z:
Crystallographic analysis of NHERF1-PLCβ3 interaction provides
structural basis for CXCR2 signaling in pancreatic cancer. Biochem
Biophys Res Commun. 446:638–643. 2014. View Article : Google Scholar : PubMed/NCBI
|
|
58
|
Hoeppner LH, Phoenix KN, Clark KJ,
Bhattacharya R, Gong X, Sciuto TE, Vohra P, Suresh S, Bhattacharya
S, Dvorak AM, et al: Revealing the role of phospholipase Cβ3 in the
regulation of VEGF-induced vascular permeability. Blood.
120:2167–2173. 2012. View Article : Google Scholar : PubMed/NCBI
|
|
59
|
Xiao W, Hong H, Kawakami Y, Kato Y, Wu D,
Yasudo H, Kimura A, Kubagawa H, Bertoli LF, Davis RS, et al: Tumor
suppression by phospholipase C-beta3 via SHP-1-mediated
dephosphorylation of Stat5. Cancer Cell. 16:161–171. 2009.
View Article : Google Scholar : PubMed/NCBI
|
|
60
|
Ju H, Zhao S, Tappia PS, Panagia V and
Dixon IM: Expression of Gq alpha and PLC-beta in scar and border
tissue in heart failure due to myocardial infarction. Circulation.
97:892–899. 1998. View Article : Google Scholar : PubMed/NCBI
|
|
61
|
Sarna JR, Marzban H, Watanabe M and Hawkes
R: Complementary stripes of phospholipase Cbeta3 and Cbeta4
expression by Purkinje cell subsets in the mouse cerebellum. J Comp
Neurol. 496:303–313. 2006. View Article : Google Scholar : PubMed/NCBI
|
|
62
|
Tan X and Chen M: MYLK and MYL9 expression
in non-small cell lung cancer identified by bioinformatics analysis
of public expression data. Tumour Biol. 35:12189–12200. 2014.
View Article : Google Scholar : PubMed/NCBI
|
|
63
|
Orchel J, Witek L, Kimsa M,
Strzalka-Mrozik B, Kimsa M, Olejek A and Mazurek U: Expression
patterns of kinin-dependent genes in endometrial cancer. Int J
Gynecol Cancer. 22:937–944. 2012. View Article : Google Scholar : PubMed/NCBI
|