Introduction
Ovarian cancer (OC) is the most lethal gynecologic
malignancy with a 5-year overall survival (OS) of ~47%, which has
almost never changed over the past 20 years (1). In 2015, 1.2 million women suffered
from OC, and the disease led to 161,100 deaths worldwide (2). The symptoms of OC are inconspicuous
and non-specific thus most cases are diagnosed at a later stage
(3). Therefore, early diagnosis and
treatment of OC are critical for improving the outcomes of the
disease, and prognosis mainly depends on the disease degree, tumor
subtypes and medical conditions (2,4).
Understanding the underlying mechanisms of OC could facilitate the
development of advanced treatment approaches.
MicroRNAs (miRNAs) play important roles in OC
pathogenesis and progression. By comparison of the transcriptome
data from different tissues with genome-scale biomolecular
networks, miR-124-3p was identified as a potential biomarker for OC
(5). miR-27a is considered as an
oncogene which inhibits forkhead box O1 (FOXO1) in OC (6), while miR-34a serves as a suppressor by
downregulating histone deacetylase 1 (HDAC1) (7). miR-409-3p was found to enhance the
cisplatin-sensitivity of OC cells by inhibiting autophagy
controlled by Fip200 (8).
In addition, a growing number of studies have shown
that the dysregulation of miRNAs is associated with the prognosis
of OC. The miR-200 family members have been identified as
prognostic indicators for the disease stage, tumor histology and
survival of OC (9). For example,
miR-200b-429 may be a promising marker for OC survival, and the low
expression of miR-200 indicates a poor prognosis and plays a
regulatory role in the tumor (10).
An upregulated serum miR-221 expression level is correlated with
tumor stage and grade of epithelial ovarian cancer (EOC), which
serves as an independent factor for a poor prognostic in EOC
(11). The serum level of miR-141
and miR-200c can distinguish OC patients from healthy controls, and
they may be utilized as markers for predicting the prognosis of OC
(12). A high expression level of
miR-203 has been reported as a candidate marker that predicts the
progression and adverse outcome of patients with EOC (13,14).
Serum miR-21 expression was found to be increased in EOC patients,
and it may function as a novel marker for the diagnosis and
prognosis of EOC (15). The
expression of miR-150 is higher in primary serous OC than in
omental metastases, and its lower expression is associated with
shorter progression free-survival in metastatic tissues (16). Nevertheless, the miRNAs related to
the recurrence of OC have not been fully revealed.
Thus, exploring the correlation between miRNAs and
the development and recurrence of OC is critical for improving the
curative effects and prognosis of OC patients. Based on the miRNA
expression profile of OC in the public database, the miRNAs
correlated with the recurrence of OC were screened, and then a
classifier was constructed to recognize the recurrence of OC.
Combined with the prognostic information of the samples, a risk
score system was constructed based on the expression levels of
significant miRNAs. The present study may provide a theoretical
basis for the prognostic prediction and targeted therapy of OC,
particularlyrecurrent OC.
Materials and methods
Data source and prescreening of
clinical factors
The miRNA expression profile of OC (the training
set) was downloaded from The Cancer Genome Atlas (TCGA, http://portal.gdc.cancer.gov/) database
(September 10, 2018), based on the Illumina HiSeq 2000 RNA
Sequencing platform. The data in the
‘0a07b199-d93d-4202-a63a-b38e39dc5ca4.mirbase21.mirnas.quantification.txt’
file that is level 3 was downloaded and used. Then we used the
encoding information to obtain the sample information. There were
415 OC samples with available clinical information in the training
set, of which 390 had information regarding recurrence: 170 were
non-recurrent OC samples and 220 were recurrent. The human
reference genome hg38/GRCh38 was used to annotate the expression
information.
Meanwhile, other relevant datasets were searched
from the Gene Expression Omnibus (GEO, http://www.ncbi.nlm.nih.gov/geo/) database with the
keywords ‘ovarian cancer’ and ‘Homo sapiens’. The inclusive
criteria were: i) the samples in the dataset had recurrent
information; ii) the samples had prognostic information; iii) the
total number of samples was no <50; and iv) the dataset was an
miRNA expression profile. Based on these criteria, only two
datasets, GSE25204 (17) and
GSE27290 (18), were selected and
used as validation datasets. The GSE25204 dataset was based on the
Illumina Human v2 MicroRNA expression beadchip platform and
included 85 OC samples with recurrent information (validation set
1). The GSE27290 dataset was based on the Agilent-015508 Human
miRNA Microarray platform (pre-commercial version 6.0) and
contained 58 OC samples with recurrent information (the validation
set 2).
The clinical information of all the samples in the
training set was statistically analyzed. In order to determine the
basis for grouping, the univariate and multivariate Cox regression
analysis in the R survival package (19) (version 2.41-1, http://bioconductor.org/packages/survivalr/) was used
to screen the clinical factors significantly associated with
prognosis. P<0.05 was set as the significance threshold.
Data standardization and differential
expression analysis
The miRNA expression profile matrixes of the three
datasets were stacked, and the matrix for each dataset was scaled
according to the expression level. The unit specification was
scaled as follows to provide a sample vector:
v=(v1,…,vn),vnormed=v·1‖v‖22
where ‖v‖22 is
the 2-norm of the vector (l2 norm).
Using the sqrt [sum(data^2)] function in R (20), the square root of the eigenvalue of
matrix B = A*AT was obtained. The purpose of this
normalization was to obtain the sample values scaled to 1. Using
median scaling, the expression level of each miRNA was centralized
and normalized according to the median and median absolute
deviation (MAD). Specifically, an eigenvector × = (×1,…, xn):
mad(x)=median({|xi-median(x)|,xi∈x})
was assigned. The median scale normalization was
defined as
xscaled=(x-median(x)).1mad(x).
For the training set, the samples were grouped
according to the recurrence condition of the samples. Using the R
package limma (21) (version
3.34.7, http://bioconductor.org/packages/release/bioc/html/limma.html),
the differentially expressed miRNAs (DE-miRNAs) between the
recurrent and non-recurrent OC samples were selected. The false
discovery rate (FDR) <0.05 and |log2fold change (FC)|
>0.263 were set as the thresholds for the significant
differences. According to the expression levels of the DE-miRNAs in
the training datasets, the bidirectional hierarchical clustering
for expression levels of these DE-miRNAs was performed based on the
centered Pearson correlation algorithm, using the pheatmap package
(22) (version 1.0.8, http://cran.r-project.org/web/packages/pheatmap/index.html)
in R.
Construction of Support Vector Machine
(SVM) classifier
In the training set, the Cox regression analysis in
the R survival package (19) was
used to select the DE-miRNAs significantly related to prognosis,
with the threshold of log-rank P<0.05. The DE-miRNAs
significantly related to recurrent prognosis were further selected
to perform the follow-up analyses.
Recursive feature elimination (RFE) is an integrated
machine learning method, which considers the selection of subset as
an optimization problem (23).
Using the RFE algorithm in the R package Caret (24) (version 6.0–76, http://cran.r-project.org/web/packages/caret), the
optimal miRNA set was filtered from the training dataset. In the
100-fold cross validation, the miRNA with the highest accuracy was
selected as the signature miRNA.
SVM is a supervised classification algorithm of
machine learning, which discriminates sample types by estimating
the probability that a sample belongs to a certain category
(25). For the training set, the
SVM classifier was constructed based on the optimal miRNA set using
the SVM method (Core: Sigmoid Kernel; Cross: 100-fold cross
validation) in the R package e1071 (26) (version 1.6–8, http://cran.r-project.org/web/packages/e1071).
The performance of the SVM classifier was separately
evaluated in the training set and the validation sets using 4
valuation indicators [Concordance index, C-index; Brier score;
Log-rank P-value of Cox-proportional hazard (PH) regression; and
area under the receiver operating characteristic (ROC) curve, AUC].
The C-index and Brier score were calculated using the R package
survcomp (27) (version 1.30.0,
http://www.bioconductor.org/packages/release/bioc/html/survcomp.html).
Using the R package survival (19),
the Kaplan-Meier (KM) curves for the two groups classified by the
SVM classifier were generated, and the log-rank P-value of the
difference between the two groups was calculated. Furthermore, the
indicators of ROC curves (sensitivity, Sen; specificity, Spe;
positive prediction value, PPV; negative prediction value, NPV)
were calculated using the R package pROC (28) (version 1.12.1, http://cran.r-project.org/web/packages/pROC/index.html).
Construction of the risk score
system
Based on the multivariate Cox regression analysis in
the R survival package (19), the
prognosis-associated miRNAs were further analyzed to identify the
DE-miRNAs independently related to prognosis. The log-rank
P<0.05 was set as the threshold.
Based on the regression coefficients of the
independent prognostic miRNAs, the risk score system was
constructed, and the risk score of each sample was obtained
according to the following formula:
Risk score=∑CoefDE - miRNAsxExpDE -
miRNAs
where Coef DE-miRNA represents the
regression coefficient, and Exp DE-miRNA indicates the
expression level of the corresponding miRNA.
For the training set, the samples were divided into
high- and low-risk groups with the median of risk scores as the
cut-off point. Using the KM curve analysis in the R survival
package (19), the correlation
between the risk score system and prognosis was evaluated.
Meanwhile, the risk score system was confirmed in the validation
sets.
Stratified analysis of clinical
factors
Using the univariate and multivariate Cox regression
analysis in the R survival package (19), the clinical factors independently
correlated with prognosis in the training set were screened out.
Combined with the high- and low-risk samples determined by the risk
score system, stratified analysis was further carried out.
miRNA-target regulatory network
analysis and enrichment analysis
The risk scores of the mRNA-sequencing samples
matched with the miRNA-sequencing samples were calculated using the
risk score system. Based on the risk scores, the samples in the
training set were divided into high- and low-risk groups. Using the
R package limma (21), the
differentially expressed genes (DEGs) between the two groups were
selected, with the thresholds of FDR <0.05 and
|log2FC| >0.263. Based on the starBase database
(29) (version 3.0, http://starbase.sysu.edu.cn/), the miRNA-mRNA
regulatory interactions in at least one of the five databases,
targetScan, picTar, RNA22, PITA, and miRanda, were selected. Then,
the correlation of the expression levels of the miRNAs and target
DEGs in the matched samples were calculated, and the interactions
with significant negative correlations were selected. Subsequently,
the miRNA-target regulatory network was visualized using the
Cytoscape software (30) (version
3.6.1, http://www.cytoscape.org/). Using the
Database for Annotation, Visualization and Integrated Discovery
(DAVID) tool (31) (version 6.8,
http://david.ncifcrf.gov/), the
functional and pathway enrichment analyses were carried out, with
P<0.05 as the screening criterion.
Results
Prescreening of clinical factors and
differential expression analysis
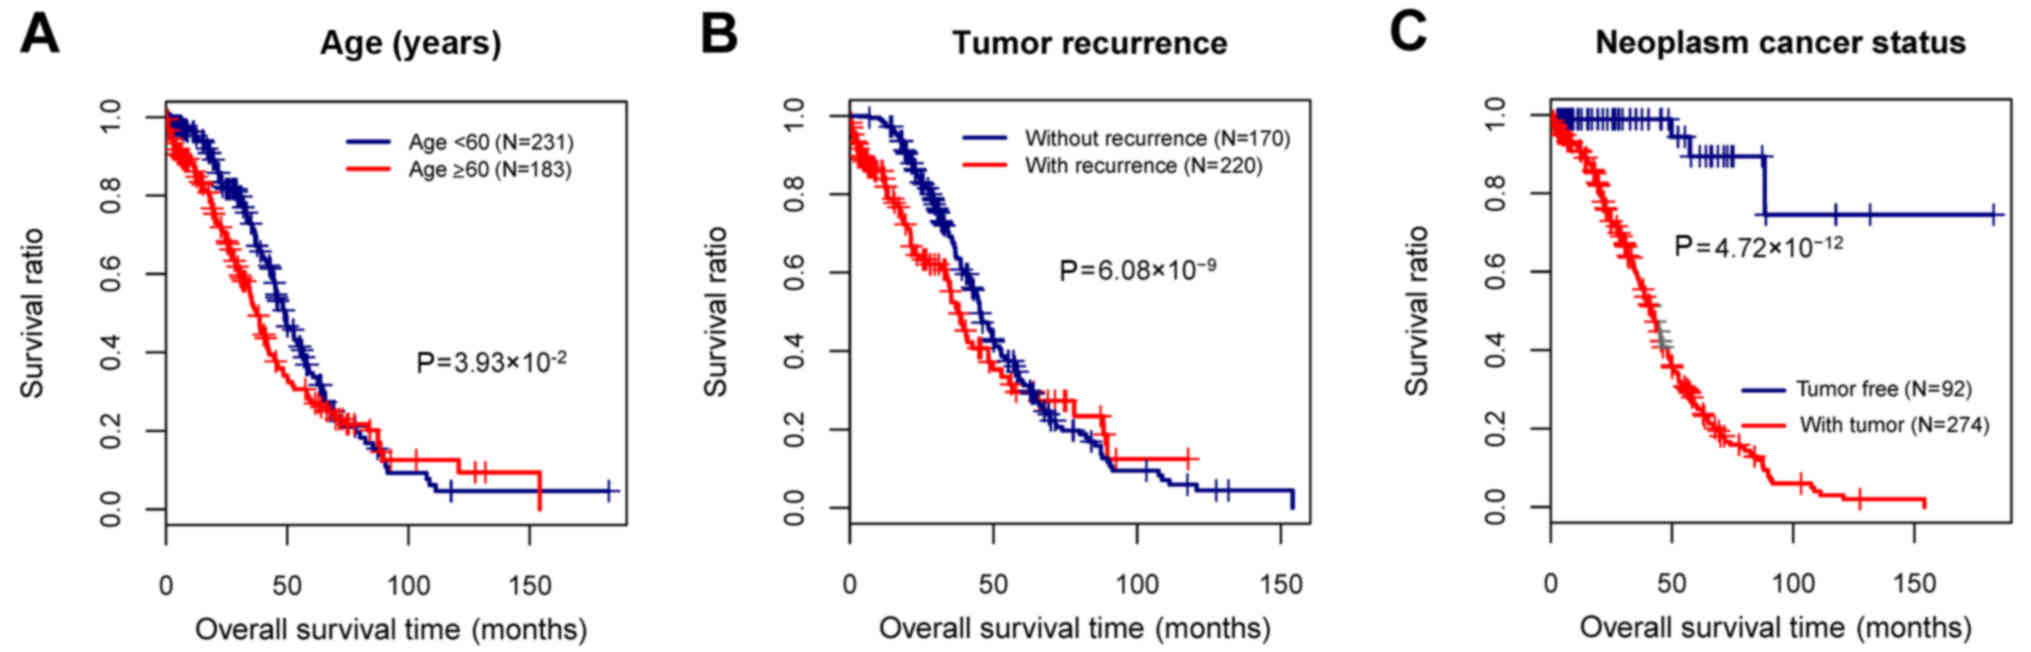
The clinical information of the 415 OC samples in
the training set was performed with statistical analysis, and then
the clinical factors significantly associated with prognosis were
screened. The age, tumor recurrence, and neoplasm cancer status
were found to be the clinical factors significantly related to
prognosis (Table I and Fig. 1). To identify the recurrence
prognosis-associated miRNAs, the samples in this study were grouped
based on the recurrence information.
 | Table I.Clinical information of all the tumor
samples in the training set and the prescreening of the clinical
factors significantly associated with prognosis. |
Table I.
Clinical information of all the tumor
samples in the training set and the prescreening of the clinical
factors significantly associated with prognosis.
|
|
| Univariables
Cox | Multivariables
Cox |
|---|
|
|
|
|
|
|---|
| Clinical
characteristics | TCGA (n=415) | HR | 95% CI | P-value | HR | 95% CI | P-value |
|---|
| Age (years, mean ±
SD) | 59.42±11.41 | 1.018 | 1.006–1.030 |
3.78×١٠−3a | 1.016 | 1.003–1.0301 |
1.73×10⁻²a |
| Neoplasm histologic
grade (G1/G2/G3/G4/-) | 1/52/353/1/8 | 1.385 | 0.959–2.019 |
8.09×10⁻² | – | – | – |
| Pathological stage
(II/III/IV/-) | 23/327/62/3 | 1.375 | 1.037–1.823 |
2.74×10⁻²a | 1.001 | 0.730–1.3730 |
9.93×10⁻¹ |
| Tumor recurrence
(yes/no/-) | 220/171/24 | 1.316 | 1.057–2.012 |
6.08×10⁻⁹a | 1.385 | 1.272–1.544 |
6.76×10⁻⁸a |
| Neoplasm cancer
status (tumor-free/with tumor/-) | 92/274/49 | 0.070 | 0.026–0.189 |
4.72×10⁻¹²a | 0.0481 | 0.017–0.133 |
5.61×10⁻⁹a |
| Lymphatic invasion
(yes/no/-) | 103/55/257 | 1.144 | 0.704–1.859 |
5.87×10⁻¹ | – | – | – |
| Venous invasion
(yes/no/-) | 63/47/305 | 0.788 | 0.437–1.419 |
4.26×10⁻¹ | – | – | – |
| Decreased
(deceased/alive) | 121/139 | – | – | – |
|
|
|
| Overall survival
time (months, mean ± SD) | 34.16±27.67 | – | – | – |
|
|
|
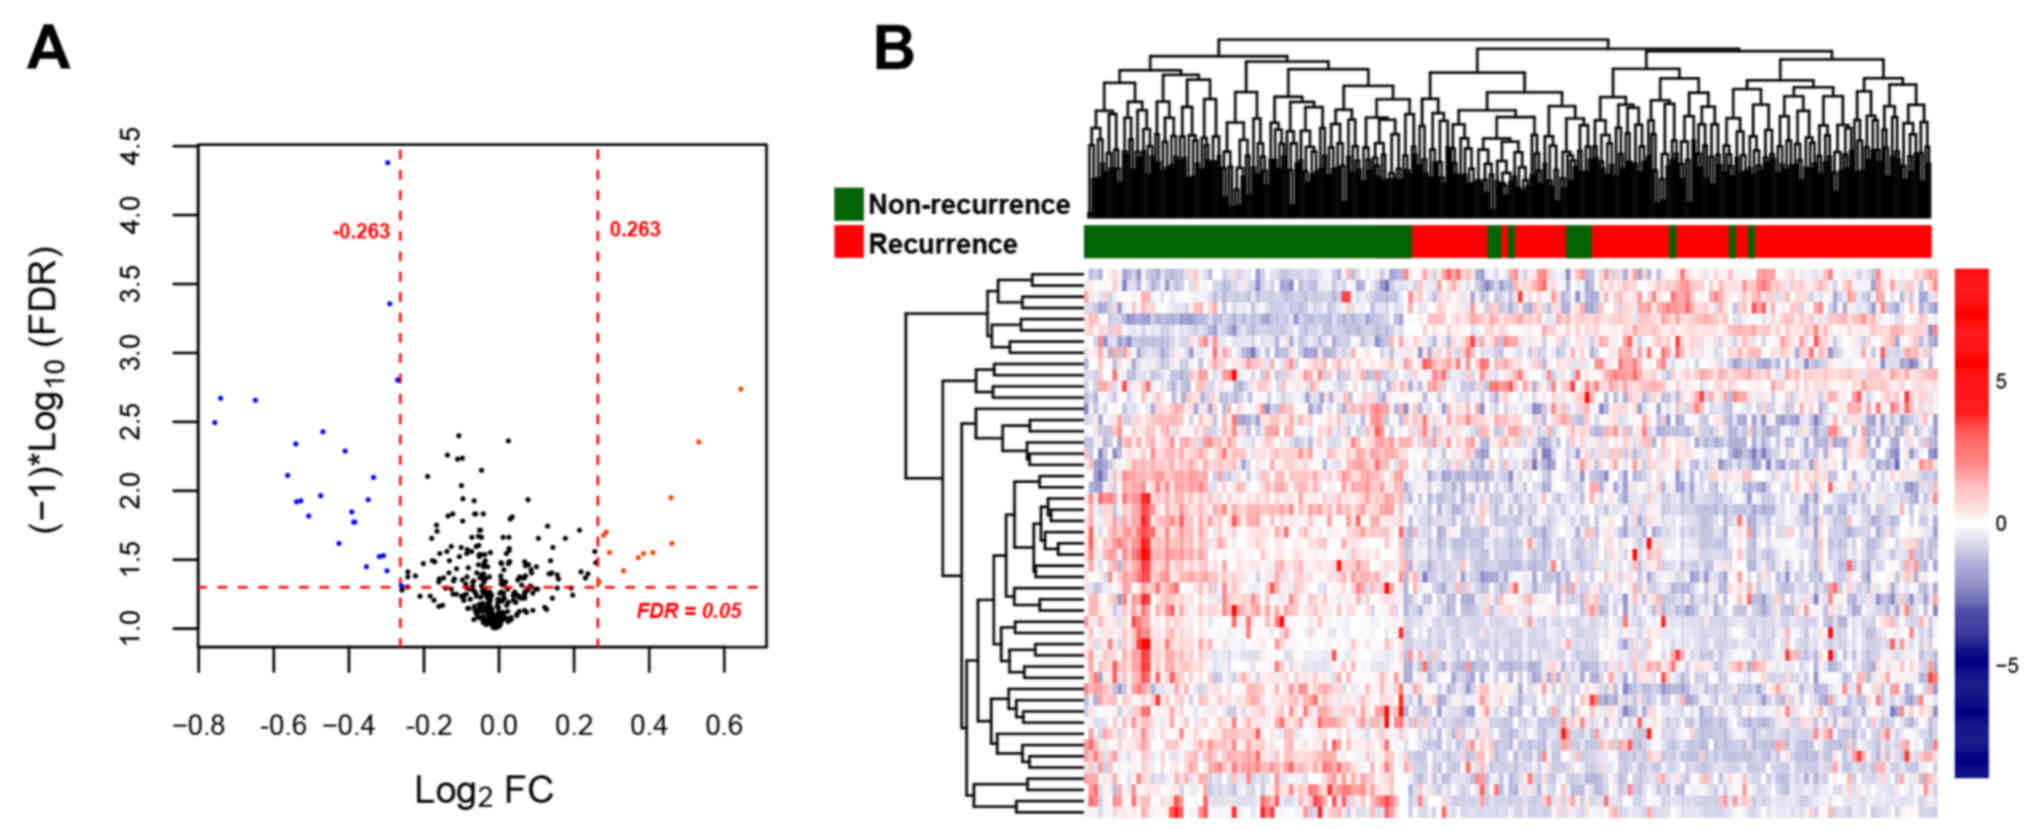
For the training set, a total of 46 DE-miRNAs (18
upregulated and 28 downregulated) were identified between the
recurrent and non-recurrent OC samples (Fig. 2A). The clustering heatmap was drawn
based on the expression levels of the DE-miRNAs, which indicated
that the samples were clearly divided into two types (Fig. 2B).
Construction of the SVM
classifier
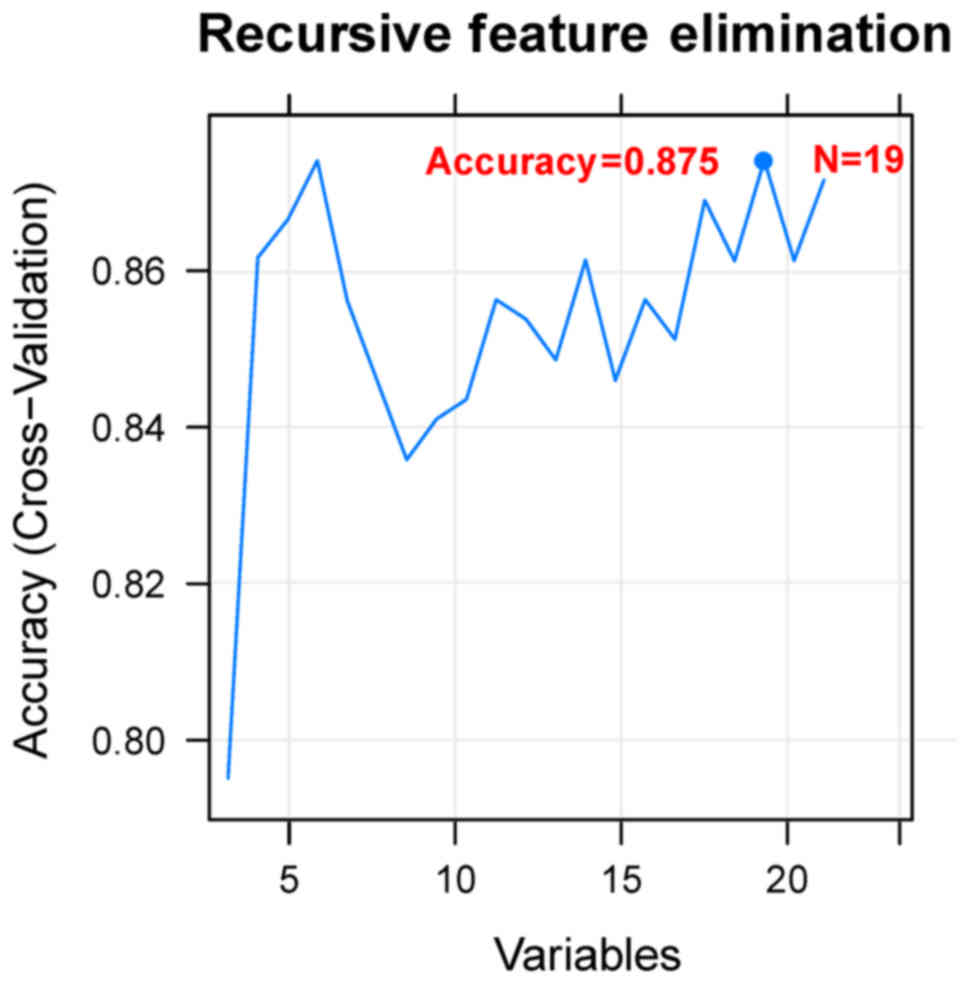
Using the Cox regression analysis, 24
prognosis-associated miRNAs were selected in the training set.
Using RFE algorithm, the optimal miRNA set involving 19 miRNAs
(including miR-135b, miR-139, miR-151, miR-187, miR-193b, miR-210,
miR-211, miR-218, miR-219, miR-30b, miR-30d, miR-365, miR-505,
miR-506, miR-508, miR-509, miR-513c, miR-514 and miR-760) was
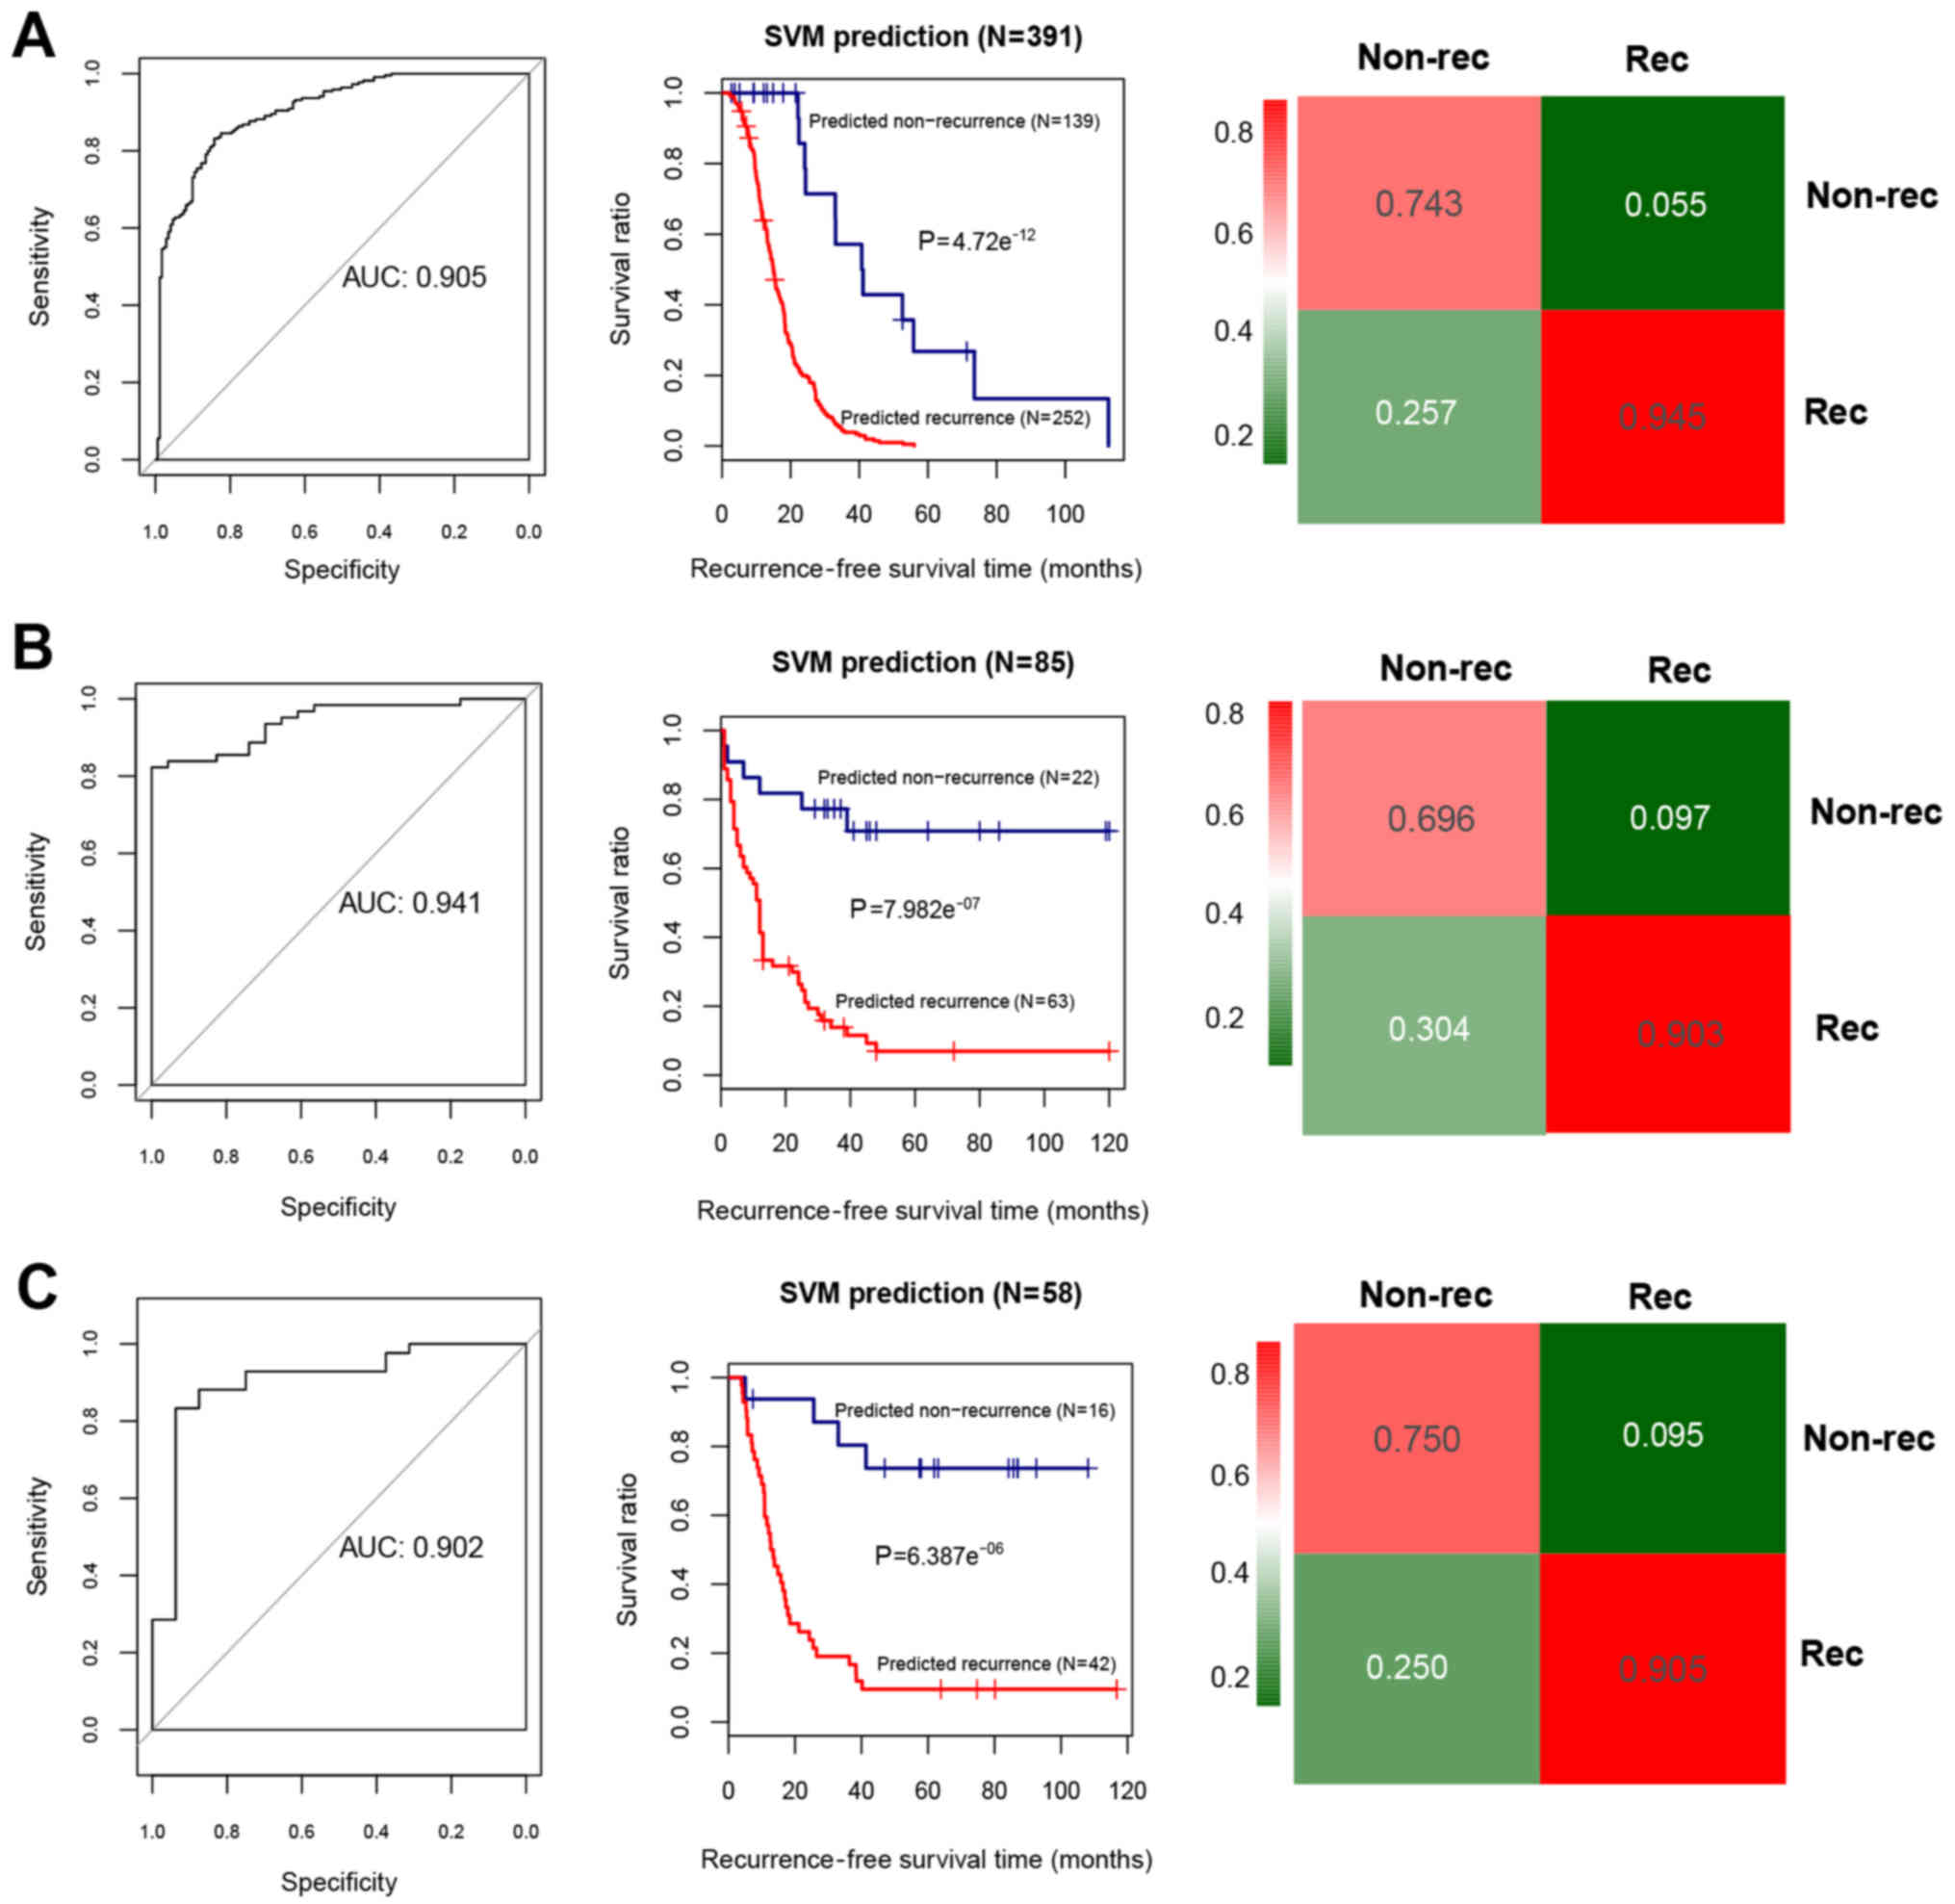
selected (Fig. 3). Based on the
optimal 19-miRNA set, the SVM classifier was constructed. Then, the
performance of the SVM classifier in the training set and the
validation sets was assessed using the 4 valuation indicators
aforementioned. The results showed that the C-index values were
>0.80, and Brier score values <0.1 in both the training and
validation sets (Table II). As
shown in the confusion table diagrams that indicated the sample
classification based on the SVM classifier, the 19-miRNA set could
distinguish well the recurrent samples from the non-recurrent
(Fig. 4). The AUC curves showed
that the AUC values of the training set and the validation sets
were >0.9 (Fig. 4 and Table II). The KM curves suggested that
the predictive results of the SVM classifier were significantly
related to prognosis (P<0.05; Fig.
4). These results indicated that the 19-miRNA-based classifier
could accurately determine the recurrence type of the OC
samples.
| Table II.Evaluation indicators for the Support
Vector Machine (SVM) classifier in the training set and the
validation sets. |
Table II.
Evaluation indicators for the Support
Vector Machine (SVM) classifier in the training set and the
validation sets.
|
|
|
|
| ROC |
|---|
|
|
|
|
|
|
|---|
| Datasets | C-index | Brier score | Log rank
P-value | AUC | Sensitivity | Specificity | PPV | NPV |
|---|
| Training set (TCGA,
n=390) | 0.942 | 0.021 |
4.72×10⁻¹²a | 0.905 | 0.847 | 0.946 | 0.914 | 0.829 |
| Validation set 1
(GSE25204, n=85) | 0.899 | 0.066 |
7.98×10⁻⁷a | 0.941 | 0.783 | 0.903 | 0.75 | 0.918 |
| Validation set 2
(GSE27290, n=58) | 0.842 | 0.063 |
6.39×10⁻⁶a | 0.902 | 0.875 | 0.905 | 0.778 | 0.95 |
Construction of risk score system
Combining the optimal 19-miRNA set with the
recurrence prognosis information of the samples, 6 independent
prognosis-related DE-miRNAs (miR-193b, miR-211, miR-218, miR-505,
miR-508 and miR-514) were identified (Table III).
| Table III.The 6 differentially expressed miRNAs
independently related to prognosis. |
Table III.
The 6 differentially expressed miRNAs
independently related to prognosis.
| ID | Coef | P-value | Hazard ratio (95%
CI) |
|---|
| hsa-mir-193b | 0.2618 | 0.0431a | 1.2993
(1.008–1.674) |
| hsa-mir-211 | 0.1507 | 0.0331a | 1.1627
(1.012–1.336) |
| hsa-mir-218 | 0.1588 | 0.0179a | 1.1721
(1.028–1.337) |
| hsa-mir-505 | −0.1959 | 0.0052a | 0.8221
(0.675–0.902) |
| hsa-mir-508 | −0.1704 | 0.0181a | 0.8433
(0.657–0.983) |
| hsa-mir-514 | 0.2526 | 0.0211a | 1.2874
(1.066–1.913) |
Combined with the regression coefficients of the 6
independent prognostic miRNAs, the risk score system for OC was
constructed. The formula for calculating the risk score of each
sample was:
Risk score = (0.2618) × Exphsa-mir-193b +
(0.1507) × Exp hsa-mir-211 + (0.1588) × Exp
hsa-mir-218 + (−0.1959) × Exp hsa-mir-505 +
(−0.1704) × Exp hsa-mir-508 + (0.2526) × Exp
hsa-mir-514
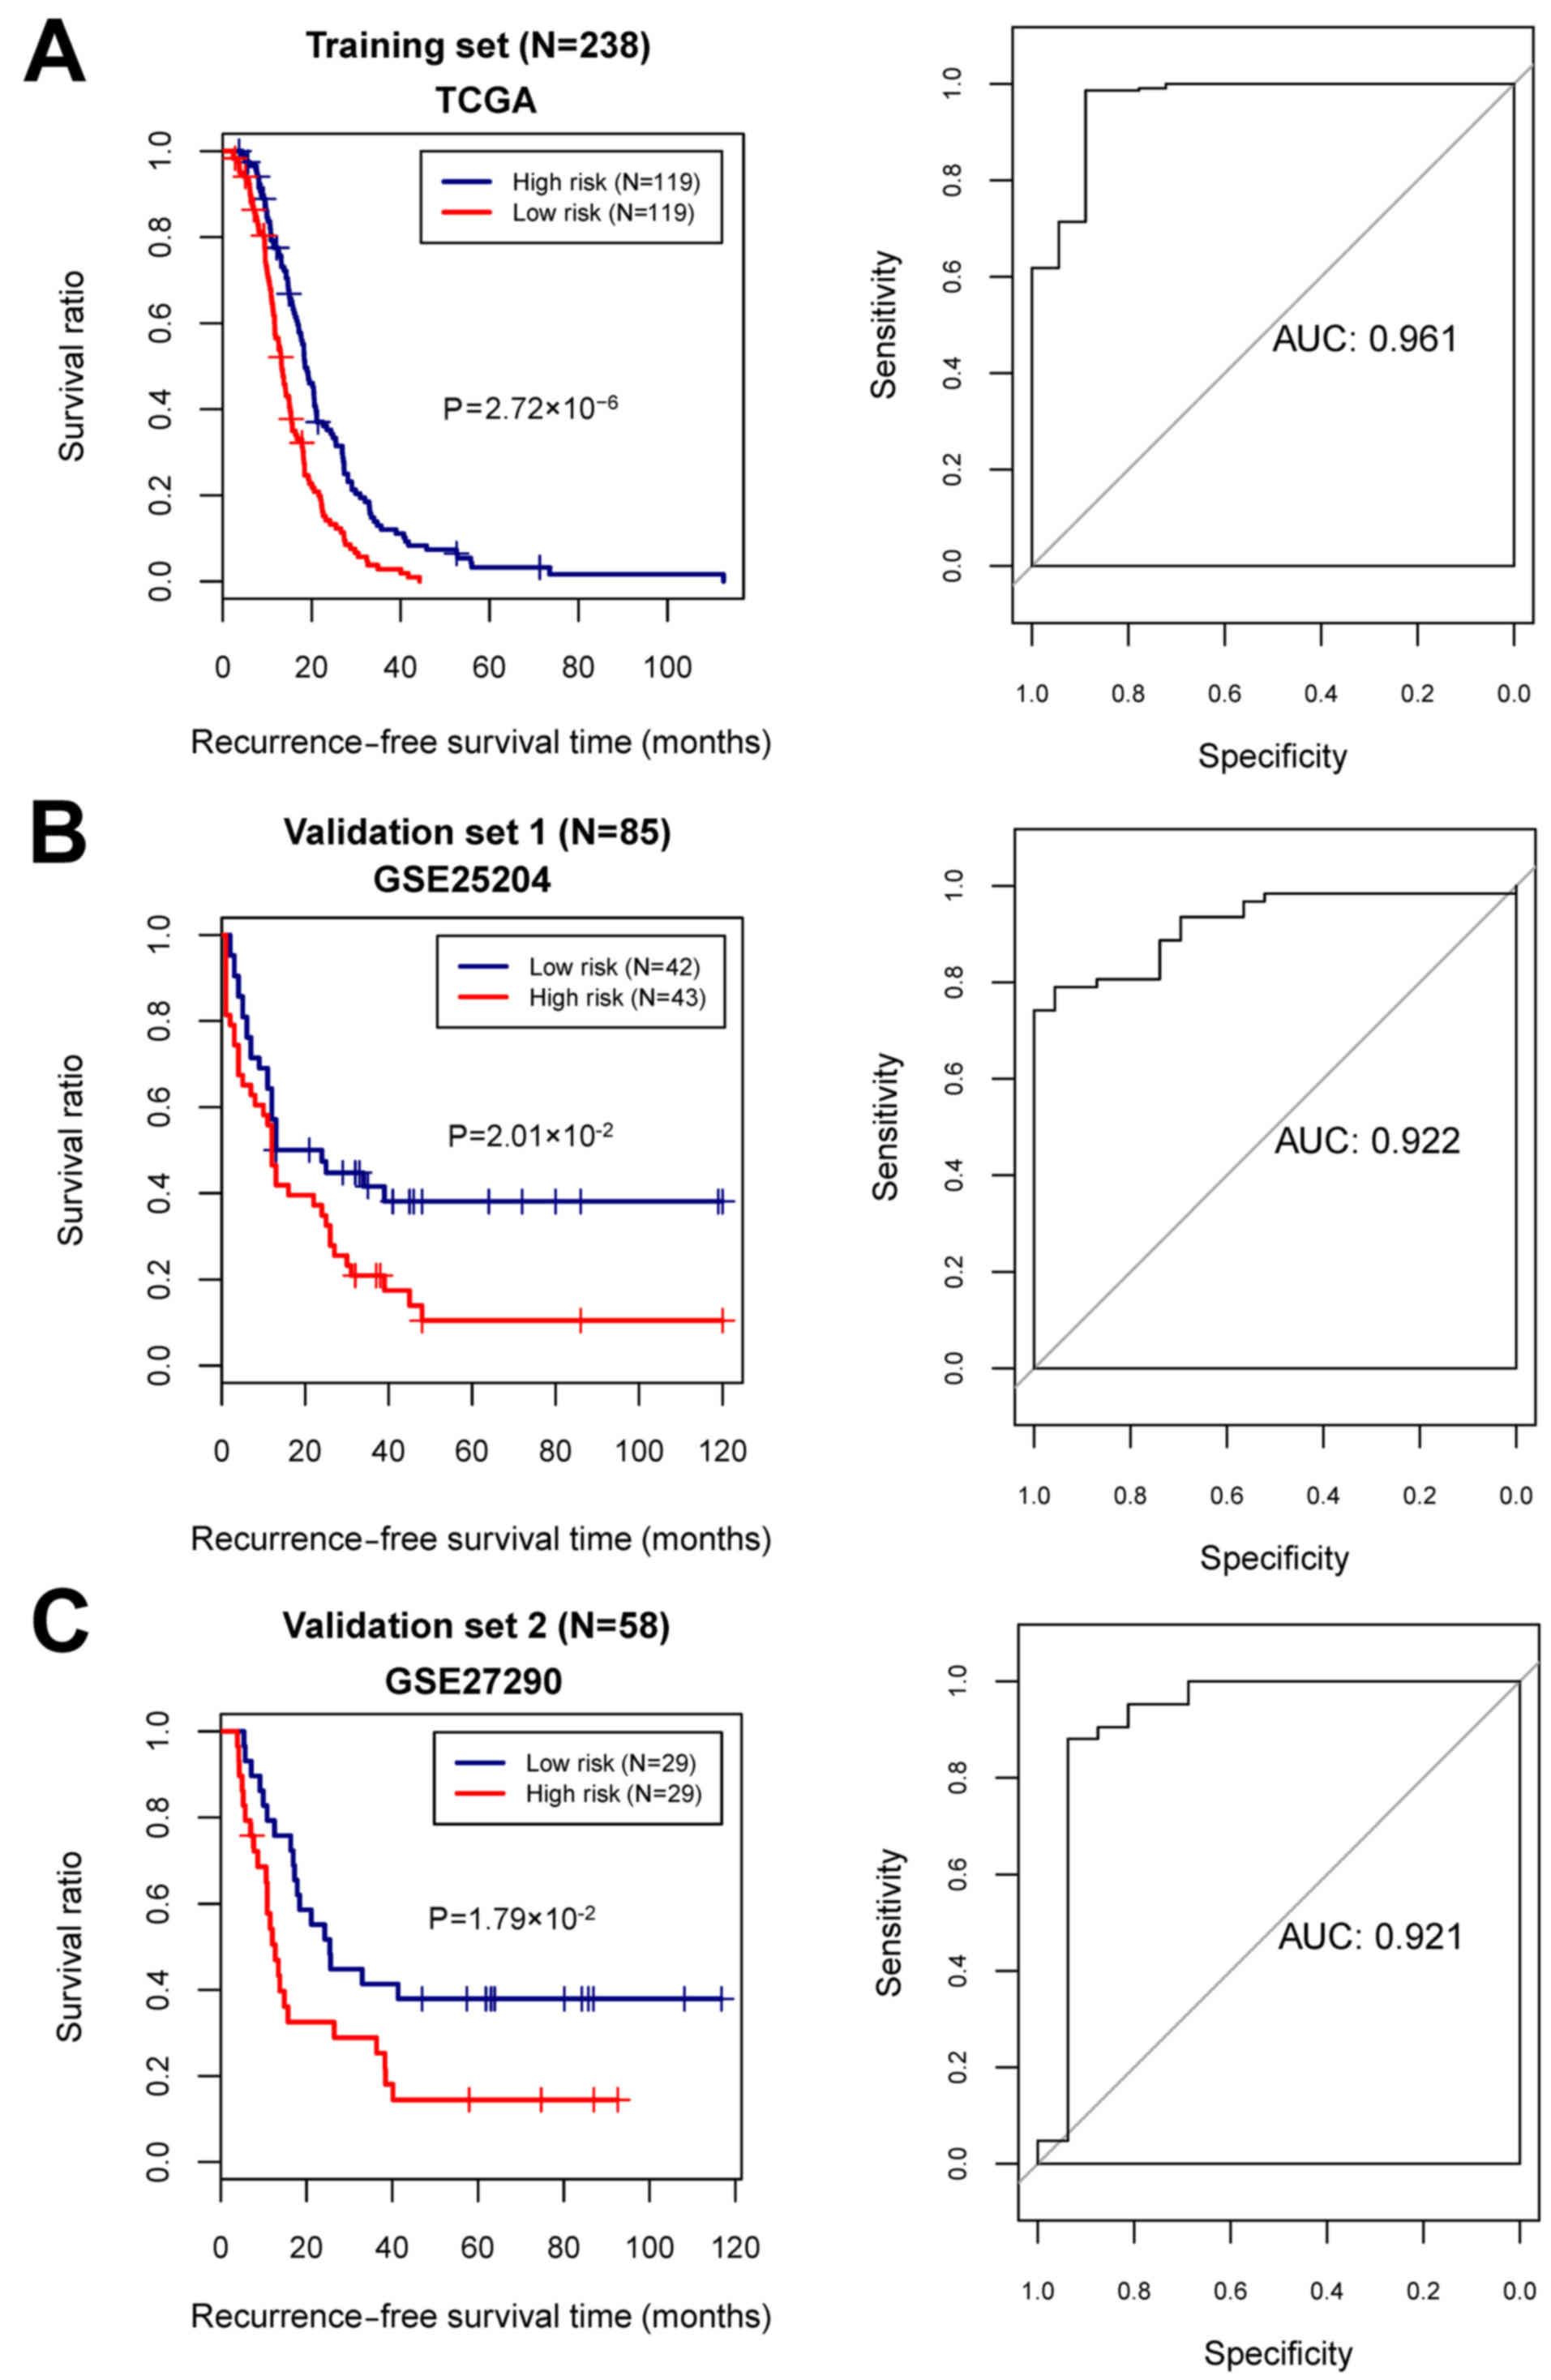
With the median of risk scores as the cut-off point,
the samples were classified into high- and low-risk groups. For the
training and the validation sets, the KM curves showed that the
high- and low-risk groups determined by the risk score system were
significantly associated with the actual recurrence prognosis
information (Fig. 5).
Stratified analysis of the clinical
factors
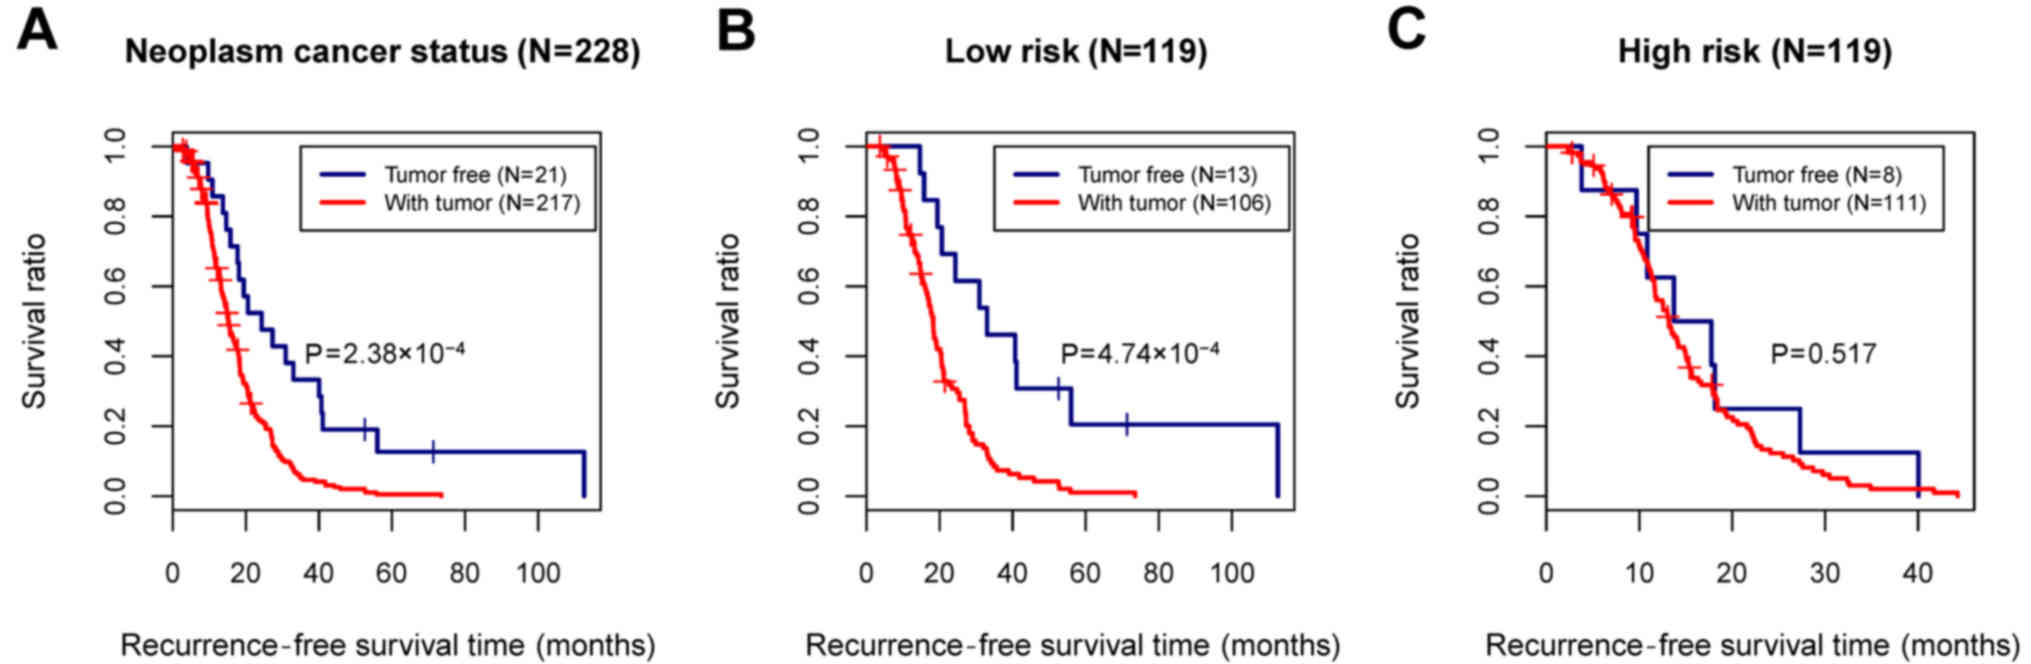
In the training set, although the age, tumor
recurrence, and neoplasm cancer status were all identified as
prognosis-associated clinical factors, only the neoplasm cancer
status was considered as an independent prognostic factor relating
to the recurrence, based on the multivariate Cox regression
analysis (Table IV and Fig. 6A). To analyze the correlation
between the neoplasm cancer status and recurrence prognosis
separately in the high- and low-risk groups, stratified analysis
was further performed for the neoplasm cancer status (Fig. 6B and C).
| Table IV.Cox regression analysis for screening
the clinical factor independently correlated with prognosis in the
training set. |
Table IV.
Cox regression analysis for screening
the clinical factor independently correlated with prognosis in the
training set.
|
| Uni-variables
cox |
|---|
|
|
|
|---|
| Clinical
characteristics | HR | 95% CI | P-value |
|---|
| Age (years) | 1.012 | 0.999–1.024 |
6.38×10⁻² |
| Neoplasm histologic
grade (G1/G2/G3/G4/-) | 1.338 | 0.927–1.932 |
1.19×10⁻¹ |
| Pathological stage
(II/III/IV/-) | 1.005 | 0.753–1.342 |
9.73×10⁻¹ |
| Neoplasm cancer
status (tumor free/with tumor/-) | 0.279 | 0.129–0.601 |
5.30×10⁻⁴a |
| Lymphatic invasion
(yes/no/-) | 1.078 | 0.678–1.714 |
7.52×10⁻¹ |
| Venous invasion
(yes/no/-) | 0.619 | 0.365–1.049 |
7.21×10⁻² |
miRNA-target regulatory network
analysis and enrichment analysis
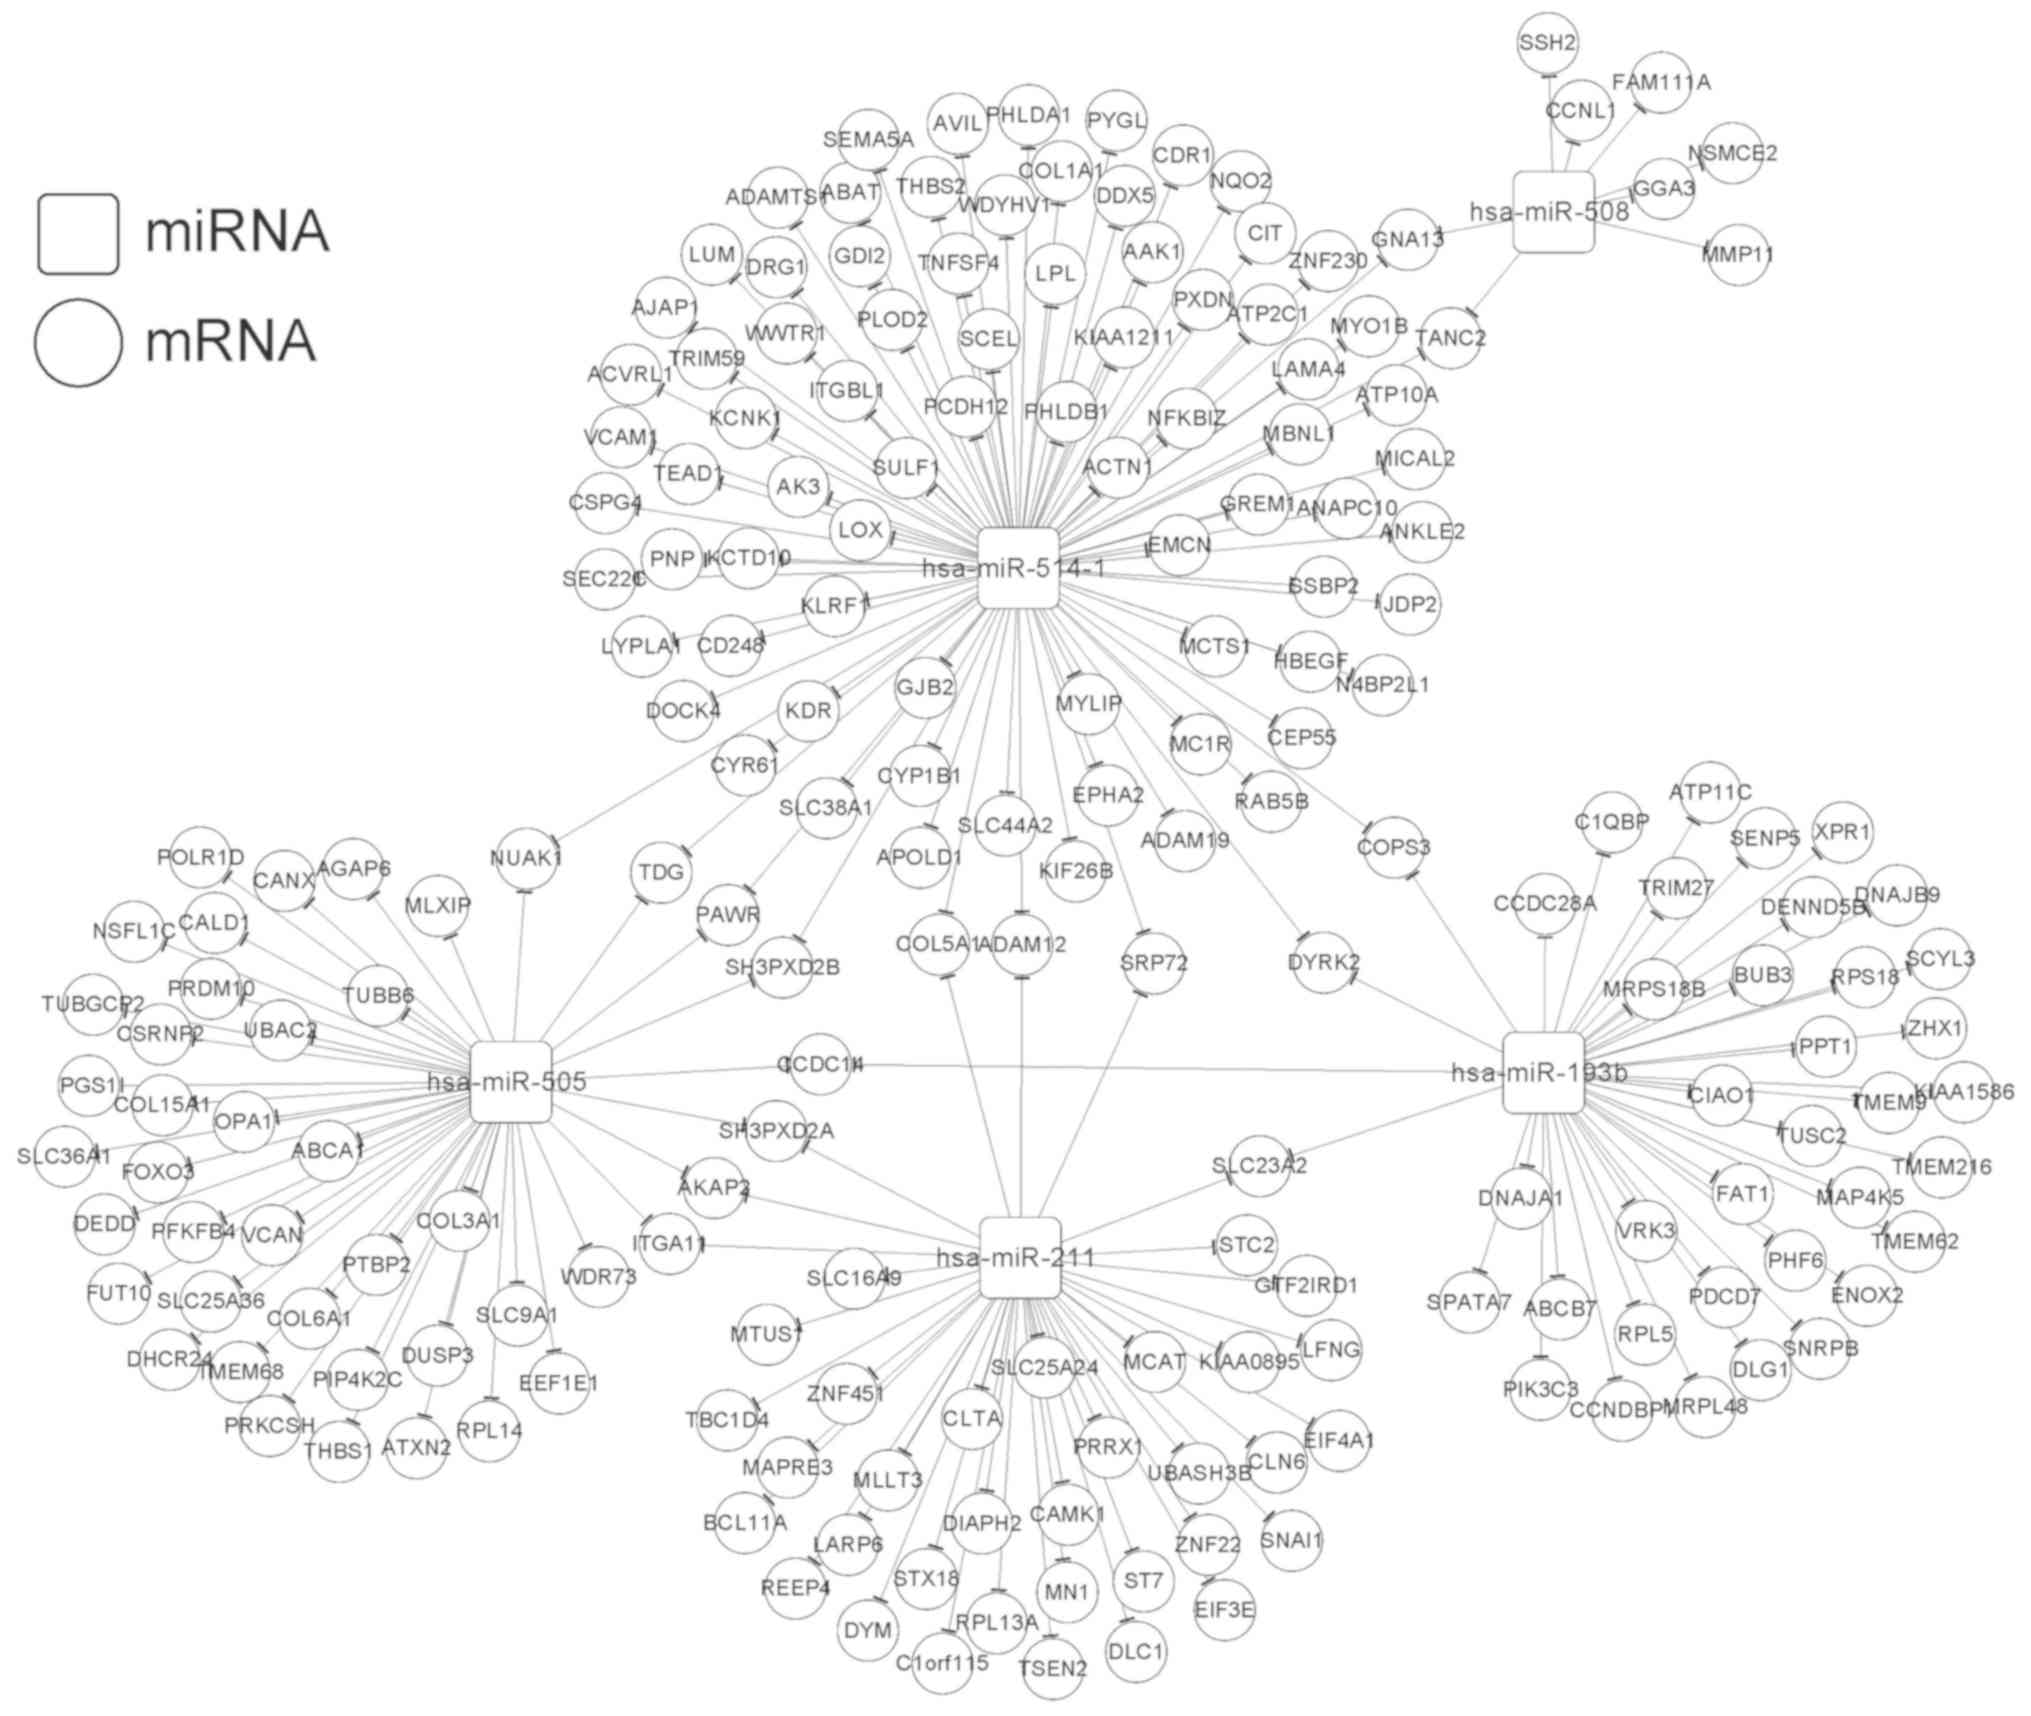
In total, we identified 615 DEGs (400 upregulated
and 215 downregulated) between the high- and low-risk groups. Based
on the StarBase database, the target genes were predicted for the 6
independent prognostic miRNAs. The overlapping genes between the
target genes and the DEGs were obtained after comparison, and 601
miRNA-mRNA regulatory interactions were selected. Then, 218
interactions with significant negative correlations were retained
for constructing the miRNA-target regulatory network (involving
miR-193b, miR-211, miR-505, miR-508, and miR-514) (Fig. 7). In addition, the target genes in
the regulatory network were enriched in 25 functional terms (such
as blood vessel development and vasculature development) and 6
pathways (such as regulation of actin cytoskeleton and TGF-β
signaling pathway) (Table V).
| Table V.Gene Ontology (GO) functional terms
and pathways enriched in the target genes involved in the
regulatory network. |
Table V.
Gene Ontology (GO) functional terms
and pathways enriched in the target genes involved in the
regulatory network.
| Category | Term | Count | P-value |
|---|
| GO biology
process | GO:0001568~blood
vessel development | 16 |
4.26×10⁻⁷a |
|
|
GO:0001944~vasculature development | 16 |
5.81×10⁻⁷a |
|
|
GO:0001525~angiogenesis | 10 |
9.95×10⁻⁵a |
|
| GO:0007155~cell
adhesion | 22 |
1.72×10⁻⁴a |
|
|
GO:0022610~biological adhesion | 22 |
1.75×10⁻⁴a |
|
| GO:0048514~blood
vessel morphogenesis | 11 |
3.19×10⁻⁴a |
|
| GO:0006928~cell
motion | 14 |
6.66×10⁻³a |
|
|
GO:0051674~localization of cell | 10 |
1.51×10⁻²a |
|
| GO:0048870~cell
motility | 10 |
1.51×10⁻²a |
|
| GO:0008219~cell
death | 16 |
3.56×10⁻²a |
|
|
GO:0016265~death | 16 |
3.75×10⁻²a |
|
|
GO:0006915~apoptosis | 14 |
3.87×10⁻²a |
|
|
GO:0012501~programmed cell death | 14 |
4.27×10⁻²a |
| GO cellular
component |
GO:0031012~extracellular matrix | 14 |
3.11×10⁻⁴a |
|
|
GO:0005578~proteinaceous extracellular
matrix | 12 |
1.89×10⁻³a |
|
| GO:0009986~cell
surface | 11 |
1.03×10⁻²a |
|
|
GO:0044421~extracellular region part | 20 |
2.47×10⁻²a |
|
| GO:0005794~golgi
apparatus | 18 |
3.72×10⁻²a |
| GO molecular
function |
GO:0030246~carbohydrate binding | 13 |
1.10×10⁻³a |
|
|
GO:0005198~structural molecule
activity | 17 |
3.75×10⁻³a |
|
| GO:0032555~purine
ribonucleotide binding | 32 |
2.72×10⁻²a |
|
|
GO:0032553~ribonucleotide binding | 32 |
2.72×10⁻²a |
|
| GO:0017076~purine
nucleotide binding | 33 |
2.89×10⁻²a |
|
|
GO:0001882~nucleoside binding | 28 |
4.24×10⁻²a |
|
| GO:0005524~ATP
binding | 26 |
4.52×10⁻²a |
| Pathway |
hsa04512:ECM-receptor interaction | 8 |
6.16×10⁻⁶a |
|
| hsa04510:Focal
adhesion | 10 |
6.47×10⁻⁵a |
|
| hsa04810:regulation
of actin cytoskeleton | 7 |
4.57×10⁻³a |
|
|
hsa03010:ribosome | 4 |
8.91×10⁻³a |
|
| hsa04350:TGF-beta
signaling pathway | 3 |
2.87×10⁻²a |
|
|
hsa04142:lysosome | 3 |
4.20×10⁻²a |
Discussion
In the present study, we identified 46 DE-miRNAs
between the recurrent and non-recurrent ovarian cancer (OC)
samples. Nineteen prognosis-associated miRNAs were used to
construct an SVM classifier, among which 6 were deregulated and
independently related to prognosis. A risk score system based on
the 6 miRNAs had a high accuracy for risk prediction in both the
training and validation sets. The neoplasm cancer status was a
clinical factor independently correlated with recurrence.
miR-193b serves as a tumor suppressor in many cancer
types. Its role in OC has recently been investigated. The
epigenetic silencing of miR-193a-3p could promote OC progression by
targeting the growth factor receptor-bound protein-7 (GRB7)
(32). miR-193b-3p has an antitumor
effect in OC cells by inhibiting the p21-activated kinase 3
(33). Downregulation of miR-193b
could induce OC metastasis (34).
These results indicate that miR-193b may be a tumor suppressor in
OC. Moreover, low expression of miR-193b is associated with a poor
prognosis of OC patients (35). In
the present study, miR-193b was one of the 6 miRNA signatures that
could predict recurrence of OC, suggesting that its expression also
might be linked to recurrence.
Currently, only a few studies have reported the
correlations between miR-218 and OC. It was reported that miR-218
prevents the proliferation and invasion in OC by downregulating its
target gene, runt-related transcription factor 2 (RUNX2)
(36). In colon adenocarcinoma, the
long noncoding RNA MNX1-AS1 could promote progression. It acts as a
competing endogenous RNA (ceRNA) of miR-218-5p and upregulates
SEC61A1, the downstream target gene of miR-218-5p (37). MNX1-AS1 was also found to facilitate
the progression of OC (37).
However, it is unclear whether MNX1-AS1 also has this competing
relationship with miR-218-5p. In the present study, miR-218 was
another important miRNA identified to be related to the recurrence
of OC, indicating it may be a novel predictive factor for OC
recurrence.
It has been found that downregulation of the tumor
suppressor miR-211 induces the overexpression of cyclin-dependent
kinase 6 (CDK6) and cyclin D1 (CCND1), which
contributes to the proliferation of epithelial ovarian cancer (EOC)
cells (38). The high expression of
PHF19 (PHD finger protein 19) was found to be related to the
poor prognosis of OC patients, and it is a target of miR-211. By
competing with the lncRNA MALAT1, miR-211 suppresses the expression
of PHF19, and thus functions as a suppressor in OC
development (39). This suggests
that miR-211 is linked to OC prognosis by regulating the downstream
targets. However, there are no studies reporting the role of
miR-211 in the recurrence of OC. Based on the present study, it was
one of the 6 miRNA signatures for OC recurrence. Therefore, miR-211
may be a potential biomarker indicative of the recurrence of
OC.
miR-30a, miR-30e and miR-505 exhibit significantly
lower expression in ovarian clear cell carcinoma (OCC) compared
with those in elderly advanced ovarian papillary serous carcinoma
(OPSC) patients, and the activating transcription factor 3
(ATF3) is the primary gene co-targeted by them (40). Overexpression of the tumor
suppressors miR-130b-3p, miR-509-3p, miR-509-5p, miR-508-3p and
miR-508-5p has been association with the improved survival of OC
patients, and these miRNAs may alter the physical properties of OC
cells via regulating the actin cytoskeleton (41). Moreover, by downregulating gene
expression levels in the MAPK1/ERK signaling pathway, miR-508 acts
as an inhibitor for cell proliferation, migration and invasion in
OC cells (42). Reduced miR-514 is
correlated with adverse prognosis of OC patients, and miR-514 can
inhibit cell proliferation and lower cisplatin chemosensitivity in
OC by regulating the ATP binding cassette subfamily (43). These findings indicate that the
three miRNAs, miR-505, miR-508 and miR-514 may function as
suppressors in OC development and their low expression could be
associated with poor prognosis. Our results demonstrated that
miR-505, miR-508 and miR-514 were three miRNA signatures in
recurrent OC, suggesting that they may be the predictive indicators
for OC recurrence.
For the target genes in the miRNA-target regulatory
network (involving miR-193b, miR-211, miR-505, miR-508 and
miR-514), they were significantly enriched in the regulation of the
actin cytoskeleton and the TGF-β signaling pathway. The TGF-β
signaling pathway functions in various cellular processes
correlated with tumorigenesis, and the genetic variants in the
pathway are related to OC risk and may help to identify high-risk
individuals (44). TGF-β signaling
can be suppressed by the accumulation of epigenetic modifications,
which contributes to the oncogenesis of OC (45). The dynamic remodeling of the actin
cytoskeleton is important for multiple cellular activities, and
dysfunction of cytoskeletal proteins can lead to many diseases in
humans (46). Therefore, miR-193b,
miR-211, miR-505, miR-508 and miR-514 may influence the prognosis
of OC via the regulation of the actin cytoskeleton and the TGF-β
signaling pathway.
Although we performed comprehensive bioinformatic
analyses using the miRNA expression profile of OC and confirmed the
classification accuracy by the validation datasets, several
limitations remain. First, the sample size with available
recurrence information was small. Second, this study lacks
validation experiments to validate the expression of these
predictive miRNAs and interplayed target genes.. Third, the
accuracy of the SVM classifier and clinical value of the 6-miRNA
risk score system should be further tested in OC patients.
Therefore, further experiments should be prepared and conducted to
support our findings.
In conclusion, the SVM classifier may be accurate in
determining the recurrence status of OC patients. Moreover, the
6-miRNA risk score system may be effective in predicting the
outcome of OC patients. Furthermore, miR-193b, miR-211, miR-505,
miR-508 and miR-514 may affect the prognosis of OC via regulation
of the actin cytoskeleton and the TGF-β signaling pathway.
Acknowledgements
Not applicable.
Funding
No funding was received.
Availability of data and materials
The datasets analyzed in the present study are
available from the corresponding author on reasonable request.
Authors' contributions
JD performed the data analyses and wrote the
manuscript. MX conceived and designed the study. JD and MX read and
approved the final manuscript. All authors read and approved the
manuscript and agree to be accountable for all aspects of the
research in ensuring that the accuracy or integrity of any part of
the work are appropriately investigated and resolved.
Ethics approval and consent to
participate
In the original studies that generated the datasets,
the trials were approved by the local institutional review boards
of all participating centers, and informed consent was obtained
from all patients.
Patient consent for publication
Not applicable.
Competing interests
The authors declare that they have no competing
interests.
References
|
1
|
Moufarrij S, Dandapani M, Arthofer E,
Gomez S, Srivastava A, Lopez-Acevedo M, Villagra A and Chiappinelli
KB: Epigenetic therapy for ovarian cancer: Promise and progress.
Clin Epigenetics. 11:72019. View Article : Google Scholar : PubMed/NCBI
|
|
2
|
Mcguire S: World Cancer Report 2014.
Geneva, Switzerland: World Health Organization, International
Agency for research on cancer, WHO Press, 2015. Adv Nutr.
7:4182016. View Article : Google Scholar : PubMed/NCBI
|
|
3
|
Hanley GE, Mcalpine JN, Kwon JS and
Mitchell G: Opportunistic salpingectomy for ovarian cancer
prevention. Gynecol Oncol Res Pract. 2:52015. View Article : Google Scholar : PubMed/NCBI
|
|
4
|
Gibson SJ, Fleming GF, Temkin SM and Chase
DM: The application and outcome of standard of care treatment in
elderly women with ovarian cancer: A literature review over the
last 10 years. Front Oncol. 6:632016. View Article : Google Scholar : PubMed/NCBI
|
|
5
|
Gov E, Kori M and Arga KY: Multiomics
analysis of tumor microenvironment reveals Gata2 and miRNA-124-3p
as potential novel biomarkers in ovarian cancer. OMICS. 21:603–615.
2017. View Article : Google Scholar : PubMed/NCBI
|
|
6
|
Wang Z, Ji G, Wu Q, Feng S, Zhao Y, Cao Z
and Tao C: Integrated microarray meta-analysis identifies miRNA-27a
as an oncogene in ovarian cancer by inhibiting FOXO1. Life Sci.
201:263–270. 2018. View Article : Google Scholar
|
|
7
|
Lv T, Song K, Zhang L, Li W, Chen Y, Diao
Y, Yao Q and Liu P: MiRNA-34a decreases ovarian cancer cell
proliferation and chemoresistance by targeting HDAC1. Biochem Cell
Biol. 96:663–671. 2018. View Article : Google Scholar : PubMed/NCBI
|
|
8
|
Cheng Y, Ban R, Liu W, Wang H, Li S, Yue
Z, Zhu G, Zhuan Y and Wang C: MiRNA-409-3p enhances
cisplatin-sensitivity of ovarian cancer cells by blocking the
autophagy mediated by Fip200. Oncol Res. Jan 2–2018.(Epub ahead of
print). doi: 10.3727/096504017X15138991620238. View Article : Google Scholar
|
|
9
|
Koutsaki M, Libra M, Spandidos DA and
Zaravinos A: The miR-200 family in ovarian cancer. Oncotarget.
8:66629–66640. 2017. View Article : Google Scholar : PubMed/NCBI
|
|
10
|
Hu X, Macdonald DM, Huettner PC, Feng Z,
El Naqa IM, Schwarz JK, Mutch DG, Grigsby PW, Powell SN and Wang X:
A miR-200 microRNA cluster as prognostic marker in advanced ovarian
cancer. Gynecol Oncol. 114:457–464. 2009. View Article : Google Scholar : PubMed/NCBI
|
|
11
|
Hong F, Li Y, Xu Y and Zhu L: Prognostic
significance of serum microRNA-221 expression in human epithelial
ovarian cancer. J Int Med Res. 41:64–71. 2013. View Article : Google Scholar : PubMed/NCBI
|
|
12
|
Gao YC and Wu J: MicroRNA-200c and
microRNA-141 as potential diagnostic and prognostic biomarkers for
ovarian cancer. Tumor Biol. 36:4843–4850. 2015. View Article : Google Scholar
|
|
13
|
Wang S, Zhao X, Wang J, Wen Y, Zhang L,
Wang D, Chen H, Chen Q and Xiang W: Upregulation of microRNA-203 is
associated with advanced tumor progression and poor prognosis in
epithelial ovarian cancer. Med Oncol. 30:6812013. View Article : Google Scholar : PubMed/NCBI
|
|
14
|
Xiaohong Z, Lichun F, Na X, Kejian Z,
Xiaolan X and Shaosheng W: MiR-203 promotes the growth and
migration of ovarian cancer cells by enhancing glycolytic pathway.
Tumor Biol. 37:14989–14997. 2016. View Article : Google Scholar
|
|
15
|
Xu YZ, Xi QH, Ge WL and Zhang XQ:
Identification of serum microRNA-21 as a biomarker for early
detection and prognosis in human epithelial ovarian cancer. Asian
Pac J Cancer Prev. 14:1057–1060. 2013. View Article : Google Scholar : PubMed/NCBI
|
|
16
|
Wilczyński M, Żytko E, Danielska J,
Szymańska B, Dzieniecka M, Nowak M, Malinowski J, Owczarek D and
Wilczyński JR: Clinical significance of miRNA-21, −103, −129, −150
in serous ovarian cancer. Arch Gynecol Obstet. 297:741–748. 2018.
View Article : Google Scholar : PubMed/NCBI
|
|
17
|
Bagnoli M, De Cecco L, Granata A,
Nicoletti R, Marchesi E, Alberti P, Valeri B, Libra M, Barbareschi
M, Raspagliesi F, et al: Identification of a chrXq27.3 microRNA
cluster associated with early relapse in advanced stage ovarian
cancer patients. Oncotarget. 6:96432015. View Article : Google Scholar : PubMed/NCBI
|
|
18
|
Shih KK, Qin LX, Tanner EJ, Zhou Q,
Bisogna M, Dao F, Olvera N, Viale A, Barakat RR and Levine DA: A
microRNA survival signature (MiSS) for advanced ovarian cancer.
Gynecol Oncol. 121:444–450. 2011. View Article : Google Scholar : PubMed/NCBI
|
|
19
|
Therneau TM: Survival analysis [R package
survival version 2.41–3]. Technometrics. 46:111–112. 2015.
|
|
20
|
Stadler L, Welc A, Humer C and Jordan M:
Optimizing R language execution via aggressive speculation.
Symposium on Dynamic Languages. 84–95. 2016.
|
|
21
|
Ritchie ME, Phipson B, Wu D, Hu Y, Law CW,
Shi W and Smyth GK: limma powers differential expression analyses
for RNA-sequencing and microarray studies. Nucleic Acids Res.
43:e472015. View Article : Google Scholar : PubMed/NCBI
|
|
22
|
Wang L, Cao C, Ma Q, Zeng Q, Wang H, Cheng
Z, Zhu G, Qi J, Ma H, Nian H, et al: RNA-seq analyses of multiple
meristems of soybean: Novel and alternative transcripts,
evolutionary and functional implications. BMC Plant Biol.
14:1692014. View Article : Google Scholar : PubMed/NCBI
|
|
23
|
Huang X, Zhang L, Wang B, Li F and Zhang
Z: Feature clustering based support vector machine recursive
feature elimination for gene selection. Appl Intelligence.
48:594–607. 2018. View Article : Google Scholar
|
|
24
|
Kumar A: Pre-processing and modelling
using caret package in R. Int J Comput Appl. 181:39–42. 2018.
|
|
25
|
Daliri MR: Feature selection using binary
particle swarm optimization and support vector machines for medical
diagnosis. Biomed Tech. 57:395–402. 2012. View Article : Google Scholar
|
|
26
|
Meyer D: Support vector machines the
interface to libsvm in package e1071. R News. 1:1–3. 2013.
|
|
27
|
Schröder MS, Culhane AC, Quackenbush J and
Haibe-Kains B: survcomp: An R/BioconductoR package for performance
assessment and comparison of survival models. Bioinformatics.
27:3206–3208. 2011. View Article : Google Scholar : PubMed/NCBI
|
|
28
|
Robin X, Turck N, Hainard A, Tiberti N,
Lisacek F, Sanchez JC and Müller M: pROC: An open-source package
for R and S+ to analyze and compare ROC curves. BMC Bioinformatics.
12:772011. View Article : Google Scholar : PubMed/NCBI
|
|
29
|
Li JH, Liu S, Zhou H, Qu LH and Yang JH:
starBase v2.0: Decoding miRNA-ceRNA, miRNA-ncRNA and protein-RNA
interaction networks from large-scale CLIP-Seq data. Nucleic Acids
Res. 42:D92–D97. 2014. View Article : Google Scholar : PubMed/NCBI
|
|
30
|
Kohl M, Wiese S and Warscheid B:
Cytoscape: Software for visualization and analysis of biological
networks. Methods Mol Biol. 696:291–303. 2011. View Article : Google Scholar : PubMed/NCBI
|
|
31
|
Huang DW, Sherman BT, Tan Q, Kir J, Liu D,
Bryant D, Guo Y, Stephens R, Baseler MW, Lane HC, et al: DAVID
Bioinformatics Resources: Expanded annotation database and novel
algorithms to better extract biology from large gene lists. Nucleic
Acids Res. 35:W169–W175. 2007. View Article : Google Scholar : PubMed/NCBI
|
|
32
|
Chen K, Liu MX, Mak SL, Yung MM, Leung TH,
Xu D, Ngu SF, Chan KK, Yang H, Ngan HY, et al:
Methylation-associated silencing of miR-193a-3p promotes ovarian
cancer aggressiveness by targeting GRB7 and MAPK/ERK pathways.
Theranostics. 8:423–436. 2018. View Article : Google Scholar : PubMed/NCBI
|
|
33
|
Zhang J, Qin J and Su Y: miR-193b-3p
possesses anti-tumor activity in ovarian carcinoma cells by
targeting p21-activated kinase 3. Biomed Pharmacother.
96:1275–1282. 2017. View Article : Google Scholar : PubMed/NCBI
|
|
34
|
Mitra AK, Chiang CY, Tiwari P, Tomar S,
Watters KM, Peter ME and Lengyel E: Microenvironment-induced
downregulation of miR-193b drives ovarian cancer metastasis.
Oncogene. 34:5923–5932. 2015. View Article : Google Scholar : PubMed/NCBI
|
|
35
|
Li H, Xu Y, Qiu W, Zhao D and Zhang Y:
Tissue miR-193b as a novel biomarker for patients with ovarian
cancer. Med Sci Monit. 21:3929–3934. 2015. View Article : Google Scholar : PubMed/NCBI
|
|
36
|
Li N, Wang L, Tan G, Guo Z, Liu L, Yang M
and He J: MicroRNA-218 inhibits proliferation and invasion in
ovarian cancer by targeting Runx2. Oncotarget. 8:91530–91541.
2017.PubMed/NCBI
|
|
37
|
Ye Y, Gu B, Wang Y, Shen S and Huang W:
E2F1-mediated MNX1-AS1-miR-218-5p-SEC61A1 feedback loop contributes
to the progression of colon adenocarcinoma. J Cell Biochem.
120:6145–6153. 2019. View Article : Google Scholar : PubMed/NCBI
|
|
38
|
Xia B, Yang S, Liu T and Lou G: miR-211
suppresses epithelial ovarian cancer proliferation and cell-cycle
progression by targeting Cyclin D1 and CDK6. Mol Cancer. 14:572015.
View Article : Google Scholar : PubMed/NCBI
|
|
39
|
Tao F, Tian X, Ruan S, Shen M and Zhang Z:
miR-211 sponges lncRNA MALAT1 to suppress tumor growth and
progression through inhibiting PHF19 in ovarian carcinoma. FASEB J.
fj201800495RR2018.PubMed/NCBI
|
|
40
|
Zhao H, Ding Y, Tie B, Sun ZF, Jiang JY,
Zhao J, Lin X and Cui S: miRNA expression pattern associated with
prognosis in elderly patients with advanced OPSC and OCC. Int J
Oncol. 43:839–849. 2013. View Article : Google Scholar : PubMed/NCBI
|
|
41
|
Chan CK, Pan Y, Nyberg K, Marra MA, Lim
EL, Jones SJ, Maar D, Gibb EA, Gunaratne PH, Robertson AG, et al:
Tumour-suppressor microRNAs regulate ovarian cancer cell physical
properties and invasive behaviour. Open Biol. 6:1602752016.
View Article : Google Scholar : PubMed/NCBI
|
|
42
|
Hong L, Wang Y, Chen W and Yang S:
MicroRNA-508 suppresses epithelial-mesenchymal transition,
migration, and invasion of ovarian cancer cells through the
MAPK1/ERK signaling pathway. J Cell Biochem. 119:7431–7440. 2011.
View Article : Google Scholar
|
|
43
|
Xiao S, Zhang M, Liu C and Wang D: MiR-514
attenuates proliferation and increases chemoresistance by targeting
ATP binding cassette subfamily in ovarian cancer. Mol Genet
Genomics. May 11–2018.(Epub ahead of print). doi:
10.1007/s00438-018-1447-0. View Article : Google Scholar
|
|
44
|
Yin J, Lu K, Lin J, Wu L, Hildebrandt MA,
Chang DW, Meyer L, Wu X and Liang D: Genetic variants in TGF-β
pathway are associated with ovarian cancer Risk. PLoS One.
6:e255592011. View Article : Google Scholar : PubMed/NCBI
|
|
45
|
Matsumura N, Huang Z, Mori S, Baba T,
Fujii S, Konishi I, Iversen ES, Berchuck A and Murphy SK:
Epigenetic suppression of the TGF-beta pathway revealed by
transcriptome profiling in ovarian cancer. Genome Res. 21:74–82.
2011. View Article : Google Scholar : PubMed/NCBI
|
|
46
|
Lee SH and Dominguez R: Regulation of
actin cytoskeleton dynamics in cells. Mol Cells. 29:311–325. 2010.
View Article : Google Scholar : PubMed/NCBI
|