Introduction
Acute lymphoblastic leukemia (ALL) is a
hematological malignancy that originates from the abnormal
proliferation of B-type or T-lymphocytes in the bone marrow
(1). The disease manifests most
commonly between 2–5 years of age (2,3) and
accounts for 1/3 of all malignancies in children. Every year,
3–4/100,000 individuals are diagnosed with leukemia, and ALL
accounts for 75% of all childhood leukemia cases (4). The long-term survival rate is 85–90%.
ALL is the most common cancer that seriously jeopardizes the health
and lives of children. More than 75% of children with ALL have
genetic aberrations, including ETV6-RUNX1 and
BCR-ABL1 gene translocation, MLL gene rearrangement
(5–7), ERG, IKZF1 and CDKN2A/B
deletion, CRLF2 overexpression, and JAK1-3, PTEN,
NOTCH1 and other gene mutations (8,9). In
addition, it was found that epigenetics is an important aspect of
transcriptional regulation of gene expression (10). At present, the occurrence of acute
leukemia is the result of a combination of cytogenetics and
epigenetics (11). In the
development of leukemia, DNA methylation is an important epigenetic
regulatory mechanism (12). The
hypermethylation of CpG islands in the promoter region can
downregulate genes or effect gene silencing (13). Genome-wide changes in DNA
methylation and changes in specific targets cause the onset of
leukemia and the appearance of specific phenotypes (11,14).
The genetic and epigenetic analysis of children with ALL confirmed
that changes in the methylation of DNA play a crucial role in the
pathogenesis of leukemia and the mechanism of disease recurrence.
DNA methylation serves as a molecular marker for predicting ALL
recurrence (15–18). Although the response rate of
childhood ALL treatment can reach >90%, the prognosis of ALL
after relapse is very poor. Therefore, identification of new
molecular markers for predicting the relapse of ALL will greatly
improve the efficacy of treatment in childhood ALL. DNA methylation
is a potential therapeutic target and a potential molecular
marker.
Folate metabolism is an important pathway linking
epigenetics and DNA synthesis and is closely related to the
occurrence of ALL (19,20). Several studies have shown that folic
acid levels are significantly lower in ALL patients than in normal
subjects, while homocysteine levels are significantly higher than
normal (21,22). Mothers taking folic acid during
pregnancy can effectively reduce the risk of ALL in children
(23). ALL patients have disorders
of folate metabolism. MTRR
(5-methyltetrahydrofolate-homocysteine methyltransferase reductase)
and MTHFR (methylenetetrahydrofolate reductase) are two of
the most important genes in the folate metabolism pathway. ALL is
characterized by overall hypomethylation and hypermethylation of
some genes. Studies have found that low VB12 and MTRR activity are
important factors for DNA hypomethylation (24). At present, studies on mRNA
expression of the key enzymes MTRR and MTHFR in the folic acid
metabolic pathway in children with ALL and the methylation of the
gene promoter region have not been reported, nor has whether or not
key enzymatic activity is reduced due to abnormal promoter
methylation. The mechanism of folate metabolism is, therefore,
worthy of intense study.
Patients and methods
Subjects
Children with ALL and healthy
controls
In the present study, 20 subjects with ALL
hospitalized at the Department of Hematology, Second Hospital of
Lanzhou University (Lanzhou, China) from June 2016 to June 2017 and
20 healthy controls were recruited. The children with ALL were
younger than 14 years of age, with an average age of 6.2 years, and
the ratio of male to female patients was 1.4:1. We obtained
complete clinical data, including bone marrow morphology, leukemia
immunophenotyping, leukemia micro-residue detection, karyotype
analysis and identification of leukemia-related genes. Clinical
diagnosis, categorization and prognosis of ALL were based on the
criteria from the 2014 (Fourth Revision) edition of the Chinese
Journal of Pediatrics (Children with Acute Lymphoblastic Leukemia)
(25). Of the 20 patients, there
were 4 cases of T-cell acute lymphoblastic leukemia (T-ALL) and 16
cases of B-cell acute lymphoblastic leukemia (B-ALL). Among them,
16 samples were newly diagnosed and 4 samples were previously
diagnosed as ALL recurrence. EDTA anticoagulated bone marrow
specimens were acquired from the 20 patients.
The control group consisted of 20 samples of
peripheral blood and normal EDTA anticoagulated bone marrow samples
taken between June 2016 and June 2017 from healthy subjects. The
average age among the control group was 5.8 years and the male to
female ratio was 1.3:1. The karyotype analysis of the control group
subjects was normal, and all members of the control group were less
than 14 years of age. All patient and control samples were obtained
after obtaining signed informed consent forms. This project was
approved by the Εthics Committee of Lanzhou University Basic
Medical College (201400105).
Extraction of genomic DNA from bone
marrow smear samples
A total of 116 samples were collected from the
patient and the control groups. Unstained bone marrow smear samples
(n=83) were collected at room temperature from the newly
diagnosed/relapsed children with ALL. Among these 83 samples, there
were 14 cases of T-ALL and 69 cases of B-ALL. The control group
consisted of 33 samples of peripheral blood and normal bone
marrow.
MALDI-TOF MS detection of promoter
methylation of the MTRR gene in bone marrow from ALL patients and
control
A total of 88 samples meeting the criteria of DNA
quality were tested by MALDI-TOF MS.
A total of 55 patients with ALL were recruited for
the methylation analysis in the present study. More than 80%
leukemia cells were present in the newly diagnosed and relapsed
bone ALL marrow cases, including 37 newly diagnosed cases and 18
relapsed patients. The relapsed patients were not the same patients
as the newly diagnosed patients. At the time of initial diagnosis,
the bone marrow smear had been kept for a long time and the
extracted DNA was severely degraded, so no subsequent methylation
testing was performed. Among the 55 samples, 11 were T-ALL samples
and 44 were B-ALL samples. Baseline characteristics of the study
population are shown in Table
I.
 | Table I.Baseline characteristics of the study
population (ALL patients, N=55). |
Table I.
Baseline characteristics of the study
population (ALL patients, N=55).
| Parameters | Data n (%) |
|---|
| Sex |
|
Male | 32 (58.2) |
|
Female | 23 (41.8) |
| Therapeutic
response |
|
Relapse | 18 (32.7) |
|
Persistant remission | 37 (67.3) |
| Risk
classification |
|
High-risk | 26 (47.3) |
|
Medium-risk | 16 (29.1) |
|
Low-risk | 13 (23.6) |
| Peripheral white
blood cells counts |
|
≥50×109/l | 12 (21.8) |
|
<50×109/l | 43 (78.2) |
| Immune
classification |
|
T-ALL | 11 (20.0) |
|
B-ALL | 44 (80.0) |
Methods
Cryopreservation of bone marrow
samples
Approximately 1–2 ml of EDTA anticoagulated fresh
bone marrow sample was collected and placed in a 15-ml sterilized
V-bottom centrifuge tube. A total of 5 ml saline was added to the
tube; 5 ml of lymphocyte separation solution was placed into
another 15-ml centrifuge tube, and the diluted bone marrow sample
was added carefully along the tube wall to the top of the
lymphocyte separation layer. The specimen was centrifuged at 1,000
× g for 20 min. After centrifugation, the middle white membrane
layer was carefully transferred to another clean centrifuge tube.
Saline (10 ml) was added and the sample was centrifuged again at
1,000 × g for 8 min. The pellet was suspended in 10 ml saline,
washed and centrifuged at 1,000 × g for 8 min. The cells (pellet)
were washed a final time with 10 ml saline. The cells were
resuspended in 500 µl of TRIzol (Invitrogen; Thermo Fisher
Scientific, Inc., Waltham, MA, USA) and mixed with a pipette tip
and stored at −80°C.
mRNA extraction
The frozen bone marrow samples were removed from the
−80°C refrigerator. Briefly, 500 µl of TRIzol suspended cells were
thawed and 400 µl of chloroform was added to the tube. The mixture
was shaken for 30 sec, and centrifuged at 12,000 × g at 4°C for 15
min. After centrifugation, 400–500 µl of the upper aqueous layer
was transferred into a 1.5-ml RNase-free EP tube. An equal volume
of isopropanol was added, mixed gently and allowed to stand for 10
min at room temperature. The sample was centrifuged again at 12,000
× g at 4°C for 10 min. The supernatant was removed and 75 µl of 75%
ethanol (mixed with DEPC water) was added to the pellet, shaken
vigorously to dislodge the pellet, and allowed to stand for 5 min.
The sample was centrifuged again at 7,500 × g at 4°C for 5 min. The
liquid was discarded, using care not to disturb the pellet, and the
tube was allowed to air-dry at RT for 20–30 min. The RNA
concentration and purity were determined on a NanoDrop 2000 Protein
Nucleic Acid analyzer (NanoDrop Technologies; Thermo Fisher
Scientific, Inc.). RNA quality requirements were an
OD260/OD280 in the range of 1.8–2.1.
RT-qPCR
Total RNA was extracted from tissues and cells using
TRIzol® (Invitrogen; Thermo Fisher Scientific, Inc.),
according to the manufacturer's protocol. RNA was reverse
transcribed into cDNA using a Reverse Transcription reagent kit
(Takara Biotechnology Co., Ltd., Dalian, China). qPCR was performed
using the SYBR-Green PCR kit (Takara Biotechnology Co., Ltd.). The
PCR reaction conditions were as follows: Preliminary denaturation
at 95°C for 30 sec, followed by 40 cycles of 95°C for 5 sec and
60°C for 20 sec. The relative quantification (2−ΔΔCq)
method was used for calculating fold change (26). The primer sequences are shown in
Table II.
| Table II.Primer sequences of MTRR,
MTHFR and β-actin. |
Table II.
Primer sequences of MTRR,
MTHFR and β-actin.
| Gene name | Forward
primers | Reverse
primers |
|---|
| MTRR |
GTGCCTGCTTGTTGGATCTC |
AGCCAGCCTGTACATACTCC |
| MTHFR |
CCATCAACTCACAGCCCAAC |
AGTTCAGGGGCATTGGTGAT |
| β-actin |
CTCCATCCTGGCCTCGCTGT |
GCTGTCACCTTCACCGTTCC |
Detection of methylation of the MTRR gene
by MALDI-TOF MS
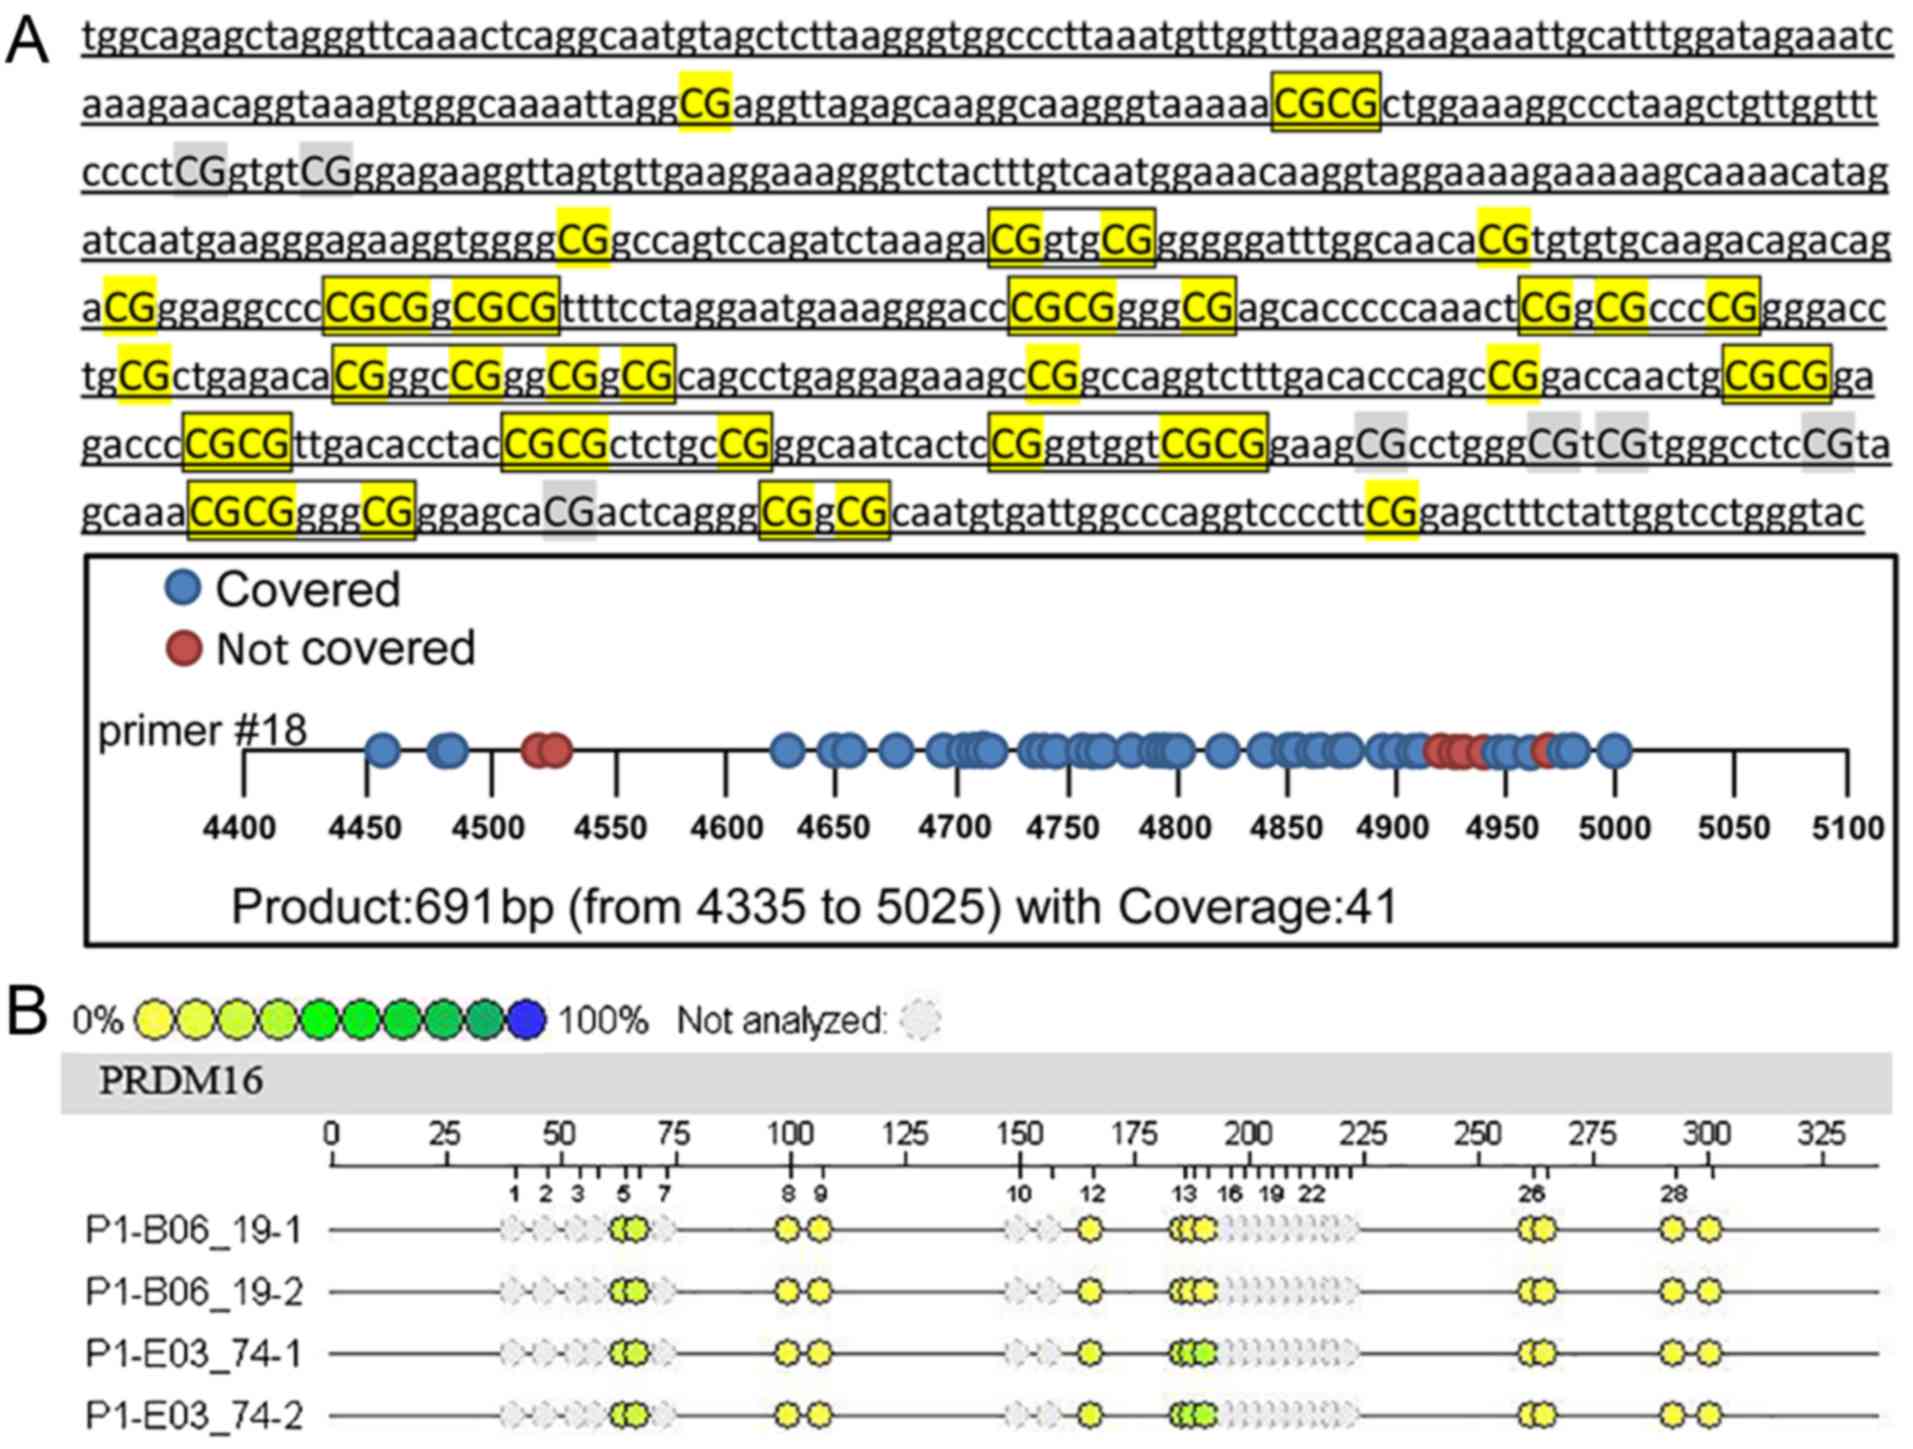
Potential CpG island forecast
Using the NCBI database (https://www.ncbi.nlm.nih.gov/), the sequence of the
transcription initiation site of the MTRR gene was
identified from the upstream 5,000 bp to the downstream 1,000 bp.
The CpG island online prediction website (http://www.ebi.ac.uk/Tools/seqstats/emboss_cpgplot/)
was used to predict the sequence of the potential CpG island
(Fig. 1A). After prediction, a
total of 691 bp of CpG sites were found in 4335–5025, but 7 sites
could not be detected due to sequencing problems. Forty-one CpG
sites could be detected, and the actual coverage rate was 85.4%.
The 5′ primer sequence was aggaagagagTGGTAGAGTTAGGGTTTAAATTTAGGT,
and 3′ primer sequence was
cagtaatacgactcactatagggagaaggctATACCCAAAACCAATAAAAAACTCC.
Extraction of genomic DNA from bone
marrow smear (phenol-chloroform method)
Extraction of gDNA from the bone marrow smears was
performed using the method previously described by Smobook and
Russell (27). Briefly, the bone
marrow smears were selected from samples whose length of the blood
film was not <1 cm. The blood film was carefully scraped into a
1.5-ml centrifuge tube with a sterile, clean disposable blade.
Sterilized ultrapure water (1 ml) was added and mixed by inversion.
The sample was centrifuged at 12,000 × g for 10 min and the
supernatant was discarded. Residual water was removed by blotting
with absorbent paper. A total of 300 µl of leukocyte lysate, 50 µl
SDS and 10 µl proteinase K were added to the sample and the tube
was placed in a 37°C water bath for 14–16 h.
After the digestion was completed, the same volume
of phenol was added, fully mixed and centrifuged at 12,000 × g for
10 min and absorbed. The supernatant was placed into the new
centrifuge tube. The step was repeated once, and then the same
volume of chloroform-isoamyl alcohol mixture (24:1) was added,
gently reversed 5 min, centrifuged at 12,000 × g for 10 min, and
the upper supernatant was added to the new centrifuge tube. One
milliliter of anhydrous ethanol on ice that was precooled in
advance was added, and then 1/10 volume of sodium acetate was
added, reversed and mixed, and kept for 5 min at −20°C, centrifuged
at 12,000 × g for 10 min, and the supernatant was discarded. The
DNA precipitate was washed with 70% ethanol, and the DNA was
collected by centrifugation at 12,000 × g for 5 min. The
supernatant was discareded, then the open tubes were maintained on
the bench until any remaining ethanol had evaporated. The DNA was
dissolved in 50 µl of TE (pH 8.0), by rocking it gently overnight
at 4°C. The DNA concentration and purity were determined on a
NanoDrop 2000 Protein Nucleic Acid analyser (NanoDrop Technologies;
Thermo Fisher Scientific, Inc.).
Purification and bisulfite
modification
CT conversion reagents were prepared by adding 750
µl of water and 210 µl of M-Dilution buffer to the CT conversion
reagent and shaking the mixture vigorously at room temperature for
10 min. The preparation was performed in the dark. The M-WASH
concentrated solution (6 ml) was diluted with 24 ml of 100% ethanol
and mixed well. The procedure of DNA sulfite treatment and Agena
MassArray System Methylation Detection Amplification PCR reaction
(Agena Bioscience, San Diego, CA, USA) were carried out as Popp
et al described (28).
Briefly, the PCR amplification reaction procedure was performed
with the following parameters: Temperature time cycle: 94°C for 4
min, followed by 45 cycles of 94°C for 20 sec, 60°C for 30 sec and
72°C for 1 min and a final 72°C for 3 min. The PCR products were
stored at 4°C. SAP enzyme digestion reaction, T-cut/RNase A
digestion reaction and resin purification were performed following
the Veriti 384-Well thermal cycler (Life Technologies; Thermo
Fisher Scientific, Inc.).
Quantitative MassARRAY analysis of
gene methylation status
A Nanodispenser was used to distribute 22 µl of the
cleaved transcripts onto a SpectroCHIP (Agena Bioscience GmbH),
which was loaded with the reaction substrate. Gene mass
spectrograms were acquired by MassARRAY using MALDI-TOF MS and
analyzed using EpiTYER® software (v1.05) (Agena
Bioscience). The methylation test results of the MALDI-TOF-MS mass
spectrometer provided the methylation intensity of each CpG site of
the gene, as shown in Fig. 1B. Each
sample in the Figure contained a certain number of CpG sites, and
each CpG site with a difference in methylation intensity is shown
as a difference in color. The yellow to blue change corresponds to
a sample methylation intensity gradually increasing from 0 to 100%,
and each small circle of a different color corresponds to a
methylation rate. In fact, not all fragments could be analyzed, nor
the methylation status displayed. Some fragments could not be
displayed due to excessive or too small molecular weights
(>7,000 Da or <1,500 Da), and some methylation mass spectral
peaks overlapped and could not be separated and analyzed. In these
cases, the CpG sites were excluded (gray).
CpG methylation and total methylation rate were
added as the total methylation value. The specific evaluation
method was performed according to Table III.
| Table III.Evaluation criteria of the gene
methylation. |
Table III.
Evaluation criteria of the gene
methylation.
| CpG methylation
number (%) | Score | Methylation rate
(%) | Score | Total score |
|---|
| <50 | 1 | ≤4 | 1 | 2 |
| <50 | 1 | 4–10 | 2 | 3 |
| <50 | 1 | ≥10 | 3 | 4 |
| ≥50 | 2 | ≤4 | 1 | 3 |
| ≥50 | 2 | 4–10 | 2 | 4 |
| ≥50 | 2 | ≥10 | 3 | 5 |
Statistical analysis
The ΔCq value of each gene was calculated, and the
Cq value of each gene was subtracted from the Cq value of the
internal reference β-actin. The data of the case group were
analyzed using the 2−ΔΔCq method. Statistical analysis
was performed using the SPSS v22.0 software (IBM Corp., Armonk, NY,
USA). For methylation data analysis, an independent sample t-test
or Mann-Whitney U test was used for comparison between the two
groups. One-way analysis of variance (ANOVA) was used for
comparison between the three groups. When compared between the two
groups in these three groups, the variance homogeneity test was
performed first. The Student-Newman-Keuls (SNK) method was used to
test the difference between the two groups if the variables passed
the variance homogeneity test. The Dunnett's T2 method was used to
test the difference between the two groups for the variables did
not pass the variance homogeneity test. P<0.05 was considered to
indicate a statistically significant result.
Results
Expression of MTRR/MTHFR mRNA in bone
marrow from ALL patients and healthy children
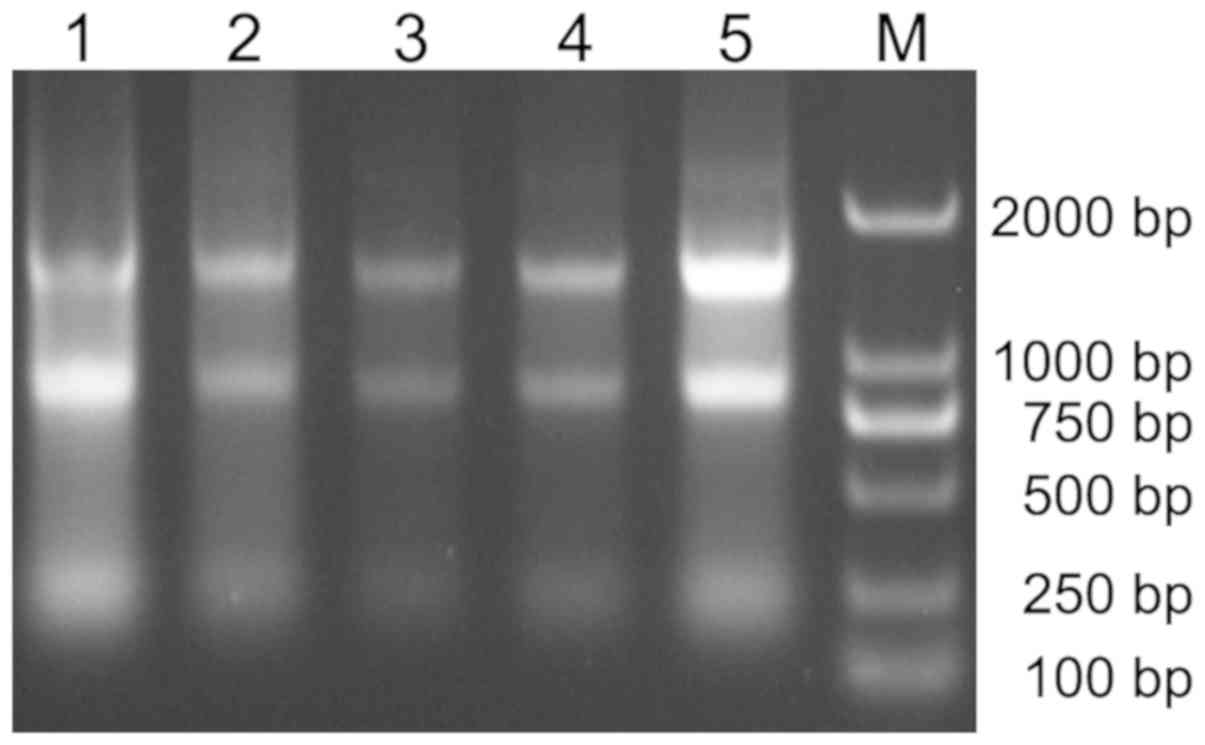
RT-qPCR was used to detect the expression of
MTRR gene mRNA in bone marrow samples from 20 children with
ALL and healthy controls. Fig. 2
shows the extracted RNA electrophoresis. After agarose gel
electrophoresis, three bands of 28S, 18S and 5S were detected. The
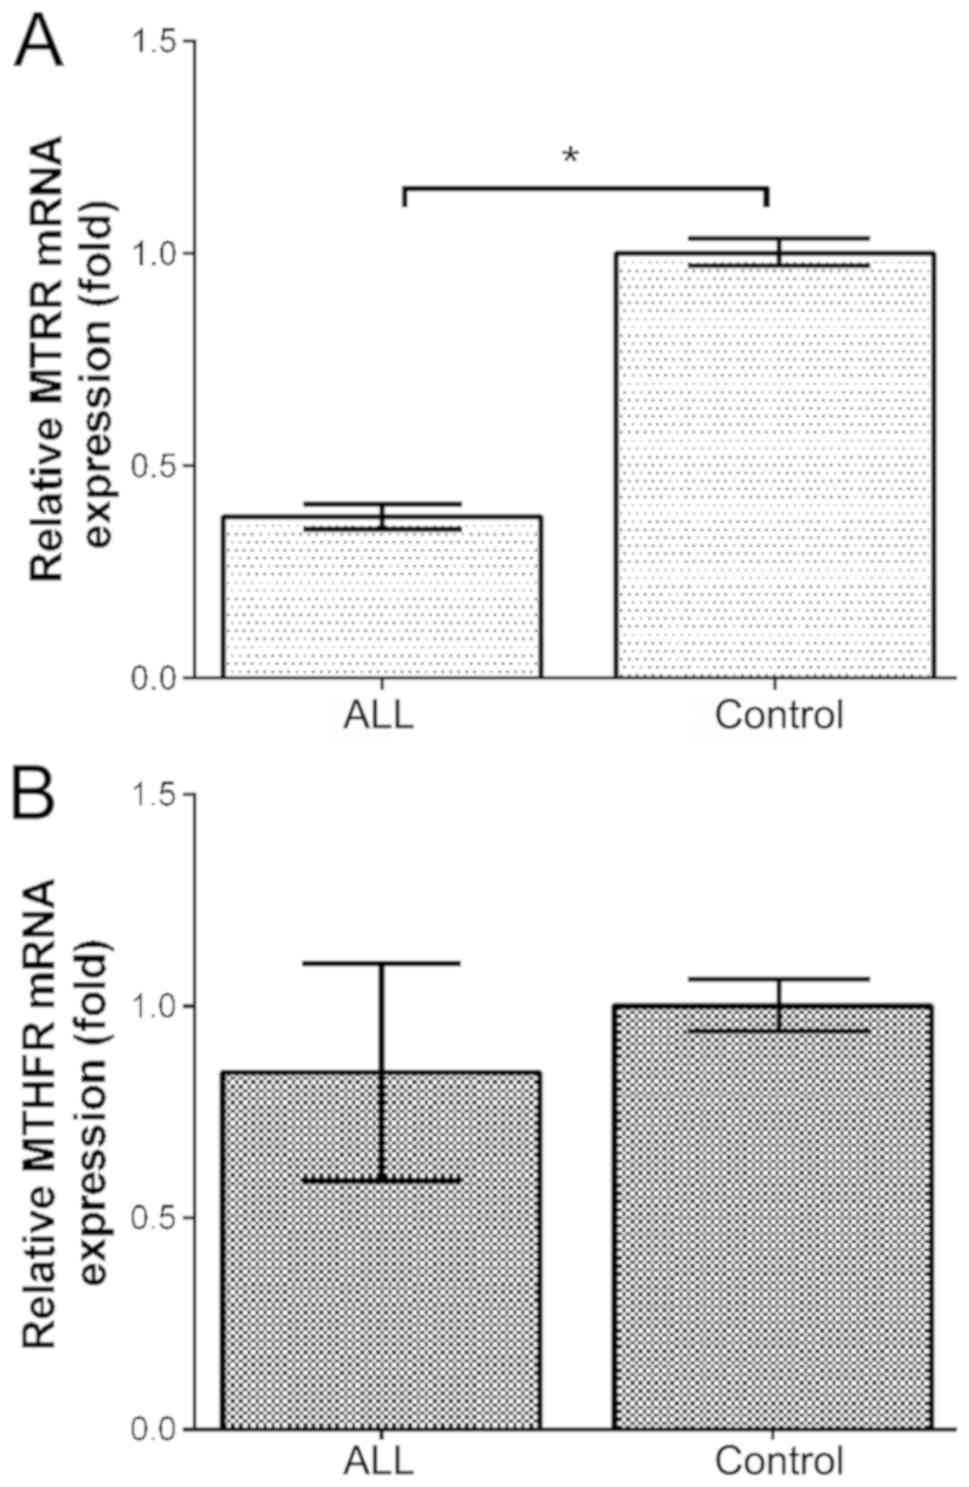
mRNA expression level of MTRR in the bone marrow from
children with ALL was much lower than that in the healthy controls
(P<0.05; Fig. 3A). However, no
significant difference in the MTHFR mRNA level in the bone
marrow was detected between children with ALL and the healthy
controls (P>0.05; Fig. 3B).
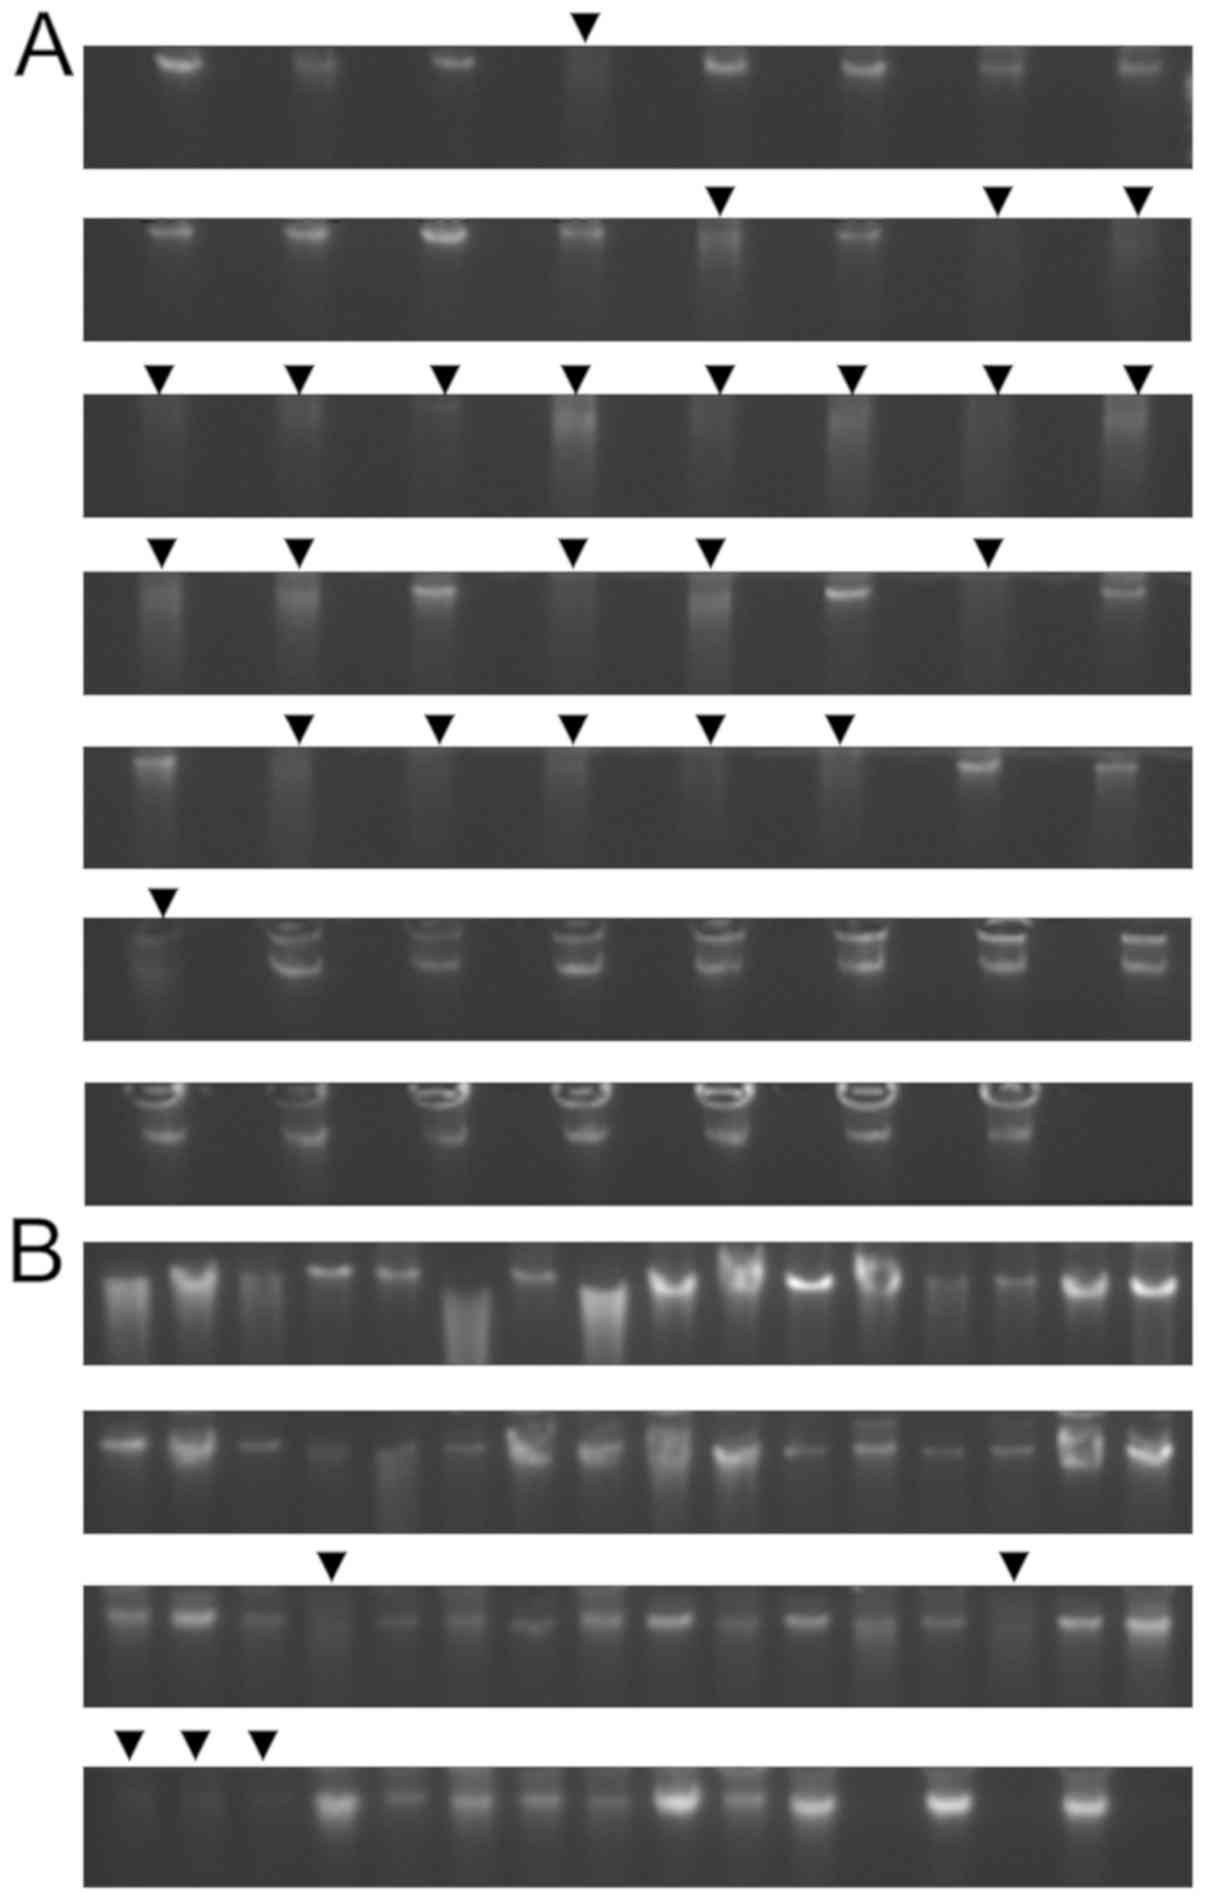
Identification of genomic DNA
extracted from bone marrow smears
Total genomic DNA from the bone marrow smears was
extracted using the phenol-chloroform method. The results are shown
in Fig. 4. There was a total of 55
samples in the first batch (Fig.
4A) and 61 samples in the second batch (Fig. 4B), showing good extraction results.
The concentration of extracted DNA, A260/A280 ratio and A260/A230
bone marrow smear-sample preservation times were measured and
analyzed (data not shown). Eighty-eight of the total 116 samples
were qualified for further experiments, and 28 failed because of
degradation and the lack of major bands. We found that the bone
marrow smear-sample preservation time was critical. When the sample
preservation time was <2 years, 98.86% (87/88) of the samples
met the criteria of 260/230 ratio >0.6, the 260/280 ratio from
1.5 to 2.0, sample concentration >20 ng/µl, and total DNA >1
µg. However, when the samples were preserved >2 years, only
3.57% (1/28) of the samples met the criteria (Fig. 4).
Methylation of MTRR promoter by MALDI-TOF
MS
Methylation of MTRR promoter region in
bone marrow from children with ALL and control samples
The sulfite treatment of 88 samples of genomic DNA
extracted from bone marrow smears was used to perform PCR
amplification and followed by gel electrophoresis to analyze the
PCR products. The 88 amplified samples were qualified to perform
further MALDI-TOF MS analysis. The comparison of methylation in the
MTRR gene promoter region was performed on bone marrow from
55 children with ALL and 33 health controls. Most of the CpG units
had a low level of methylation. None of them conformed to the
normal distribution, and, thus, the Mann-Whitney U test was used.
The results (Table IV) showed that
there were no significant differences in the methylation rates, 41
total methylation sites, score, average methylation rates, or
overall methylation levels of the 41 CpG sites in the promoter
region of the MTRR gene between ALL patients and healthy
controls (P>0.05).
| Table IV.Methylation differences in CpG loci
of the MTRR promoter region in bone marrow from children
with ALL and healthy controls. |
Table IV.
Methylation differences in CpG loci
of the MTRR promoter region in bone marrow from children
with ALL and healthy controls.
|
| Methylation
rate |
|
|---|
|
|
|
|
|---|
| MTRR CpG loci | ALL (n=55) | Controls
(n=33) | P-value |
|---|
| CpG_1 | 7.47±9.579 | 5.59±6.962 | 0.391 |
| CpG_2.3 | 1.59±1.645 | 2.76±3.113 | 0.065 |
| CpG_6 | 3.67±2.358 | 3.76±2.747 | 0.896 |
| CpG_7.8 | 8.67±7.096 | 10.45±9.128 | 0.522 |
| CpG_9 | 1.47±2.433 | 1.48±1.920 | 0.775 |
| CpG_10 | 7.47±9.579 | 5.59±6.962 | 0.391 |
|
CpG_11.12.13.14 | 2.84±2.641 | 3.14±2.532 | 0.541 |
| CpG_15.16.17 | 2.45±2.467 | 2.59±1.783 | 0.378 |
| CpG_18.19.20 | 6.73±4.086 | 5.59±3.708 | 0.305 |
| CpG_21 | 3.55±6.776 | 2.66±4.654 | 0.937 |
|
CpG_22.23.24.25 | 1.45±1.276 | 2.07±1.412 | 0.052 |
| CpG_26 | 0.20±0.499 | 0.86±2.722 | 0.696 |
| CpG_27 | 9.63±14.915 | 8.03±14.647 | 0.436 |
| CpG_28.29 | 1.59±1.645 | 2.76±3.113 | 0.065 |
| CpG_30.31 | 2.86±1.443 | 2.76±1.976 | 0.366 |
| CpG_32.33.34 | 9.33±3.526 | 9.59±3.841 | 0.815 |
| CpG_35.36.37 | 2.49±2.575 | 2.69±2.892 | 0.878 |
| CpG_42.43.44 | 1.10±1.141 | 1.83±2.221 | 0.354 |
| CpG_46.47 | 0.86±1.339 | 0.72±0.996 | 0.930 |
| CpG_48 | 3.04±2.189 | 3.24±2.340 | 0.590 |
| Methylation
sites | 11.57±1.720 | 12.21±2.932 | 0.188 |
| Average methylation
rate | 3.92±1.303 | 3.91±1.638 | 0.788 |
| Total methylation
level | 3.08±0.449 | 3.00±0.655 | 0.547 |
| Score | 1.90±0.306 | 1.83±0.384 | 0.372 |
Methylation rates of 41 CpG sites in the promoter
regions of MTRR genes were found in male and female children with
ALL, as well as in normal boy and girl controls. There was no
statistically significant difference in the rate of totalization
and methylation (P>0.05) (data not shown).
Methylation of the MTRR promoter
region in bone marrow from children with T-ALL, B-ALL and healthy
control groups
Methylation analysis of the 41 CpG loci in the
MTRR gene was performed to compare 44 cases of children with
B-ALL, 11 children with T-ALL and 33 health controls. The results
showed that there were no significant differences in the
methylation rates, overall methylation sites, score, average
methylation rates or overall methylation levels of CpG loci in the
MTRR gene (P>0.05) (data not shown).
Methylation of the MTRR gene promoter
region in bone marrow from children with high, medium and low risk
of ALL
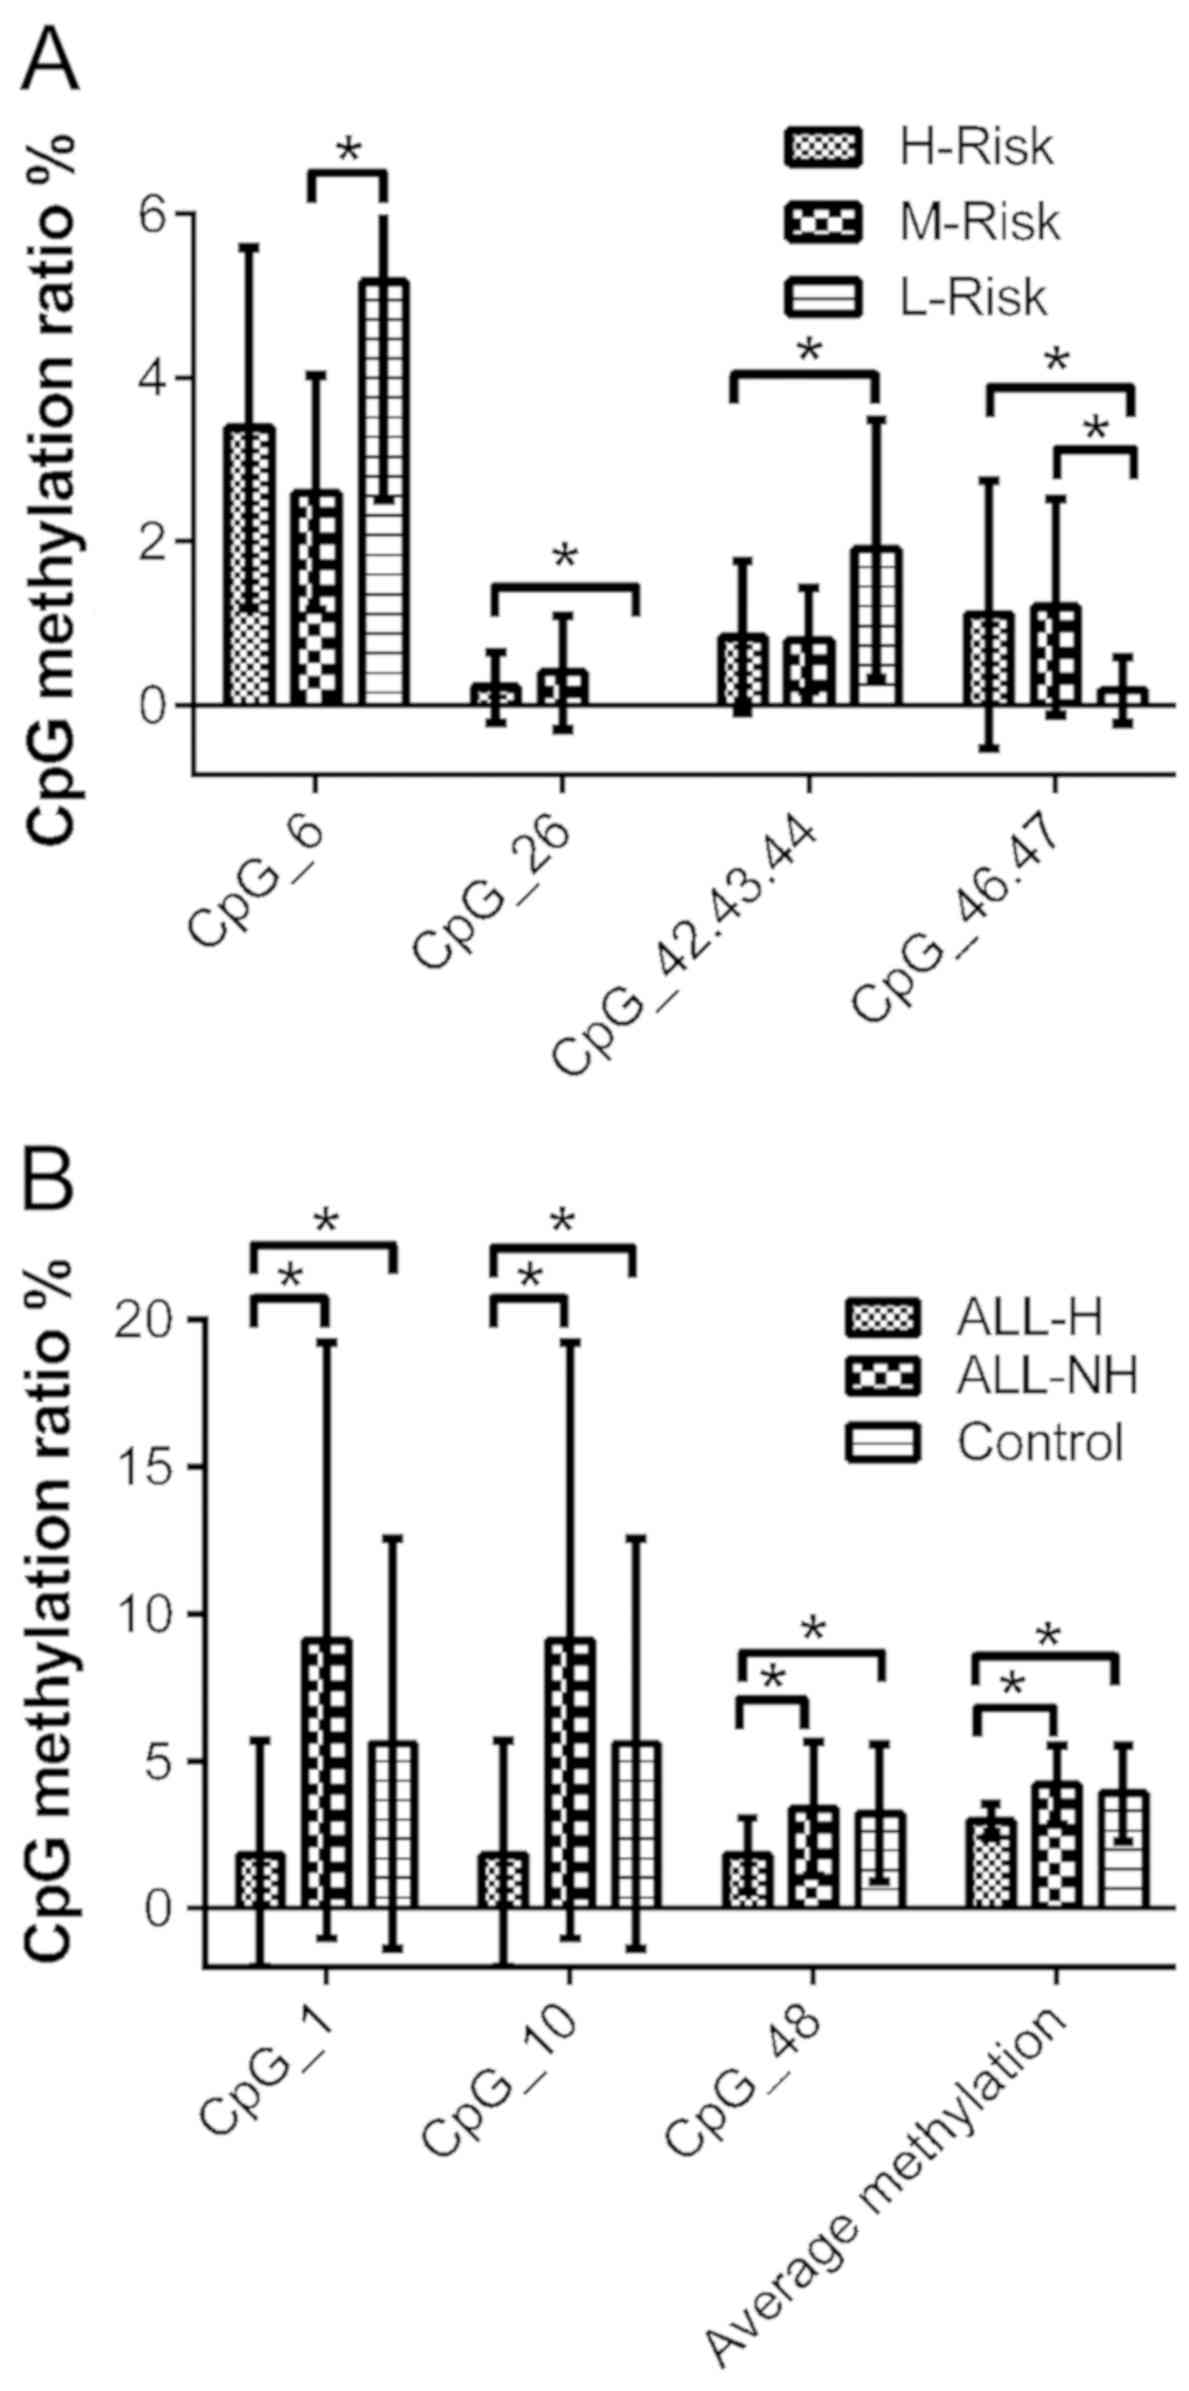
After grading the risk of 55 ALL patients, there
were 26 children in the high-risk, 16 in the medium-risk and 13 in
the low-risk groups. In the comparison of each two-group pairing,
the CpG_6 methylation rate was higher in the low-risk group than in
the medium-risk group, while the methylation rate of CpG_46.47 was
lower in the low-risk group than in the medium-risk group
(P<0.05). The CpG_26 and CpG_46.47 methylation rates were higher
in the high-risk group than in the low-risk group, while the
CpG_42.23.44 methylation rate was lower in the high-risk group than
in the low-risk group (P<0.05). There was no significant
difference in CpG locus or methylation between the high-risk group
and the medium-risk group (P>0.05) (Table V and Fig. 5A).
| Table V.Analysis of methylation differences
of CpG loci in the MTRR gene promoter region in bone marrow
from high-, medium- and low-risk ALL patients. |
Table V.
Analysis of methylation differences
of CpG loci in the MTRR gene promoter region in bone marrow
from high-, medium- and low-risk ALL patients.
|
| P-value |
|---|
|
|
|
|---|
| MTRR CpG
site | H-risk
(n=26)/M-risk (n=16) | H-risk
(n=26)/L-risk (n=13) | M-risk
(n=16)/L-risk (n=13) |
|---|
| CpG_1 | 0.491 | 0.797 | 0.737 |
| CpG_2.3 | 0.450 | 0.822 | 0.360 |
| CpG_6 | 0.319 | 0.060 | 0.014a |
| CpG_7.8 | 0.933 | 0.905 | 0.978 |
| CpG_9 | 0.710 | 0.716 | 0.999 |
| CpG_10 | 0.491 | 0.797 | 0.737 |
|
CpG_11.12.13.14 | 0.174 | 0.343 | 0.776 |
| CpG_15.16.17 | 0.630 | 0.470 | 0.872 |
| CpG_18.19.20 | 0.120 | 0.861 | 0.097 |
| CpG_21 | 0.761 | 0.982 | 0.822 |
|
CpG_22.23.24.25 | 0.573 | 0.554 | 0.941 |
| CpG_26 | 0.477 | 0.042a | 0.093 |
| CpG_27 | 0.800 | 0.636 | 0.546 |
| CpG_28.29 | 0.450 | 0.822 | 0.360 |
| CpG_30.31 | 0.192 | 0.608 | 0.132 |
| CpG_32.33.34 | 0.179 | 0.080 | 0.876 |
| CpG_35.36.37 | 0.488 | 0.243 | 0.661 |
| CpG_42.43.44 | 0.897 | 0.049a | 0.096 |
| CpG_46.47 | 0.561 | 0.038a | 0.012a |
| CpG_48 | 0.471 | 0.176 | 0.503 |
| Methylation
sites | 0.674 | 0.705 | 0.944 |
| Average methylation
rate | 0.628 | 0.340 | 0.213 |
| Total methylation
level | 0.845 | 0.264 | 0.082 |
| Score | 0.931 | 0.868 | 0.947 |
Methylation of the MTRR promoter
region in bone relapse and non-relapse groups in children with
ALL
Methylation analysis was performed on the 41 CpG
sites in the promoter region of MTRR in 18 patients
presenting with relapse and 37 patients without relapse. After
normal distribution analysis of the methylation rate data of each
point, CPG32/33/34 showed a normal distribution (P>0.05), and
the Student's t-test was applied. The other groups did not
demonstrate a normal distribution (P<0.05) and the Mann-Whitney
U test was used. There were no significant differences in the 41
total methylation sites, score, average methylation rates, or
overall methylation levels of the 41 CpG sites in the promoter
region of the MTRR gene in recurrent and non-recurrent
children (P>0.05) (data not shown).
Methylation of the MTRR promoter
region in bone marrow from ALL children with peripheral white blood
cells ≥50×109/l and peripheral blood leukocytes
<50×109/l
Based on studies included in the Interpretation of
the Recommendations for the Diagnosis and Treatment of Children
with Acute Lymphocytic Leukemia (Four Revisions) (25) and Genetic Basis of Acute
Lymphoblastic Leukemia (29),
peripheral white cell count is an important predictor of prognostic
stratification. Peripheral white blood cells ≥50×109/l
suggest a poor prognosis. Therefore, patients having peripheral
white blood cells ≥50×109/l were defined as the ALL-H
(ALL-High) group, and those with peripheral white blood cells
<50×109/l were defined as ALL-NH (ALL-Not High)
group.
Methylation analysis was performed on the 41 CpG
sites in the promoter region of MTRR in bone marrow from 12
ALL-H children, 43 ALL-NH children and 33 healthy controls. We
found that the average methylation rates and mean methylation rates
of the CpG_1, CpG_10, CpG_48 sites and score in the ALL-H patients
were lower than in the ALL-NH patients and healthy controls
(P<0.05). However, there were no significant differences in CpG
locus, score, or methylation between the ALL-NH patients and the
healthy controls (Fig. 5B and
Table VI).
| Table VI.Analysis of methylation status of CpG
loci in the MTRR gene promoter region in bone marrow from ALL-H,
ALL-NH and healthy controls. |
Table VI.
Analysis of methylation status of CpG
loci in the MTRR gene promoter region in bone marrow from ALL-H,
ALL-NH and healthy controls.
|
| P-value |
|---|
|
|
|
|---|
| MTRR CpG
loci | ALL-H (n=12)/ALL-NH
(n=43) | ALL-H
(n=12)/Controls (n=33) | ALL-NH
(n=43)/Controls (n=33) |
|---|
| CpG_1 |
0.001a |
0.038a | 0.114 |
| CpG_2.3 | 0.917 | 0.241 | 0.075 |
| CpG_6 | 0.071 | 0.186 | 0.703 |
| CpG_7.8 | 0.463 | 0.292 | 0.501 |
| CpG_9 | 0.661 | 0.642 | 0.905 |
| CpG_10 | 0.001a |
0.038a | 0.114 |
|
CpG_11.12.13.14 | 0.878 | 0.635 | 0.686 |
| CpG_15.16.17 | 0.488 | 0.647 | 0.607 |
| CpG_18.19.20 | 0.746 | 0.281 | 0.283 |
| CpG_21 | 0.801 | 0.813 | 0.495 |
|
CpG_22.23.24.25 | 0.987 | 0.223 | 0.063 |
| CpG_26 | 0.610 | 0.485 | 0.195 |
| CpG_27 | 0.364 | 0.674 | 0.490 |
| CpG_28.29 | 0.917 | 0.241 | 0.075 |
| CpG_30.31 | 0.403 | 0.541 | 0.991 |
| CpG_32.33.34 | 0.506 | 0.456 | 0.993 |
| CpG_35.36.37 | 0.545 | 0.812 | 0.650 |
| CpG_42.43.44 | 0.354 | 0.159 | 0.164 |
| CpG_46.47 | 0.366 | 0.323 | 0.885 |
| CpG_48 |
0.034a |
0.019a | 0.788 |
| Methylation
sites | 0.801 | 0.296 | 0.335 |
| Average methylation
rate |
0.000a |
0.012a | 0.428 |
| Total methylation
level | 0.210 | 1.000 | 0.461 |
| Score | 0.023a | 0.023a | 0.648 |
Discussion
Acute lymphoblastic leukemia (ALL) accounts for 80%
of all cases of childhood leukemia. Therefore, ALL is the most
commonly diagnosed tumor that endangers the health of children
worldwide. Moreover, the proportion of bone marrow leukemia cells
is >80% in ALL. The high proportion of leukemia cells is highly
appropriate for methylation research. Some studies have shown that
low expression levels of folate and elevated levels of homocysteine
are noted in ALL (21,22), but the mRNA levels of MTRR
and MTHFR genes in ALL have not been reported. In the
present study, we found that only the mRNA level of MTRR in
children with ALL was lower than that in the healthy controls, but
no significant difference in the MTHFR gene was detected
between the two groups. The reason for the low level of folate is
probably due to the inactivation of MTRR with the low
transcription level of MTRR. In general, MTR and VB12 jointly
maintain the activity of MTR. After MTR is inactivated, the ability
of THF to be reduced to 5mTHF, which provides one carbon unit to
methionine, and then to SAM for methylation donation, is
insufficient to make up the methylation body. Most tumors show a
decrease in the overall gene methylation levels and an increase in
the methylation levels of specific genes. The decrease of
intracellular methylation donors results in a decrease in the
methylation level of the genome. MTHFR has a strong compensatory
feedback regulation (30). When the
body is deficient in folic acid and HCY is accumulated, it
compensates for the synthesis of 5mTHF to supplement THF and MET
required for DNA synthesis and methyl-donor to alleviate the
accumulation of HCY. The high feedback capacity of MTHFR may
account for why the mRNA level of this gene is not significantly
different between the ALL and control groups. Similar results have
been found in preeclampsia studies (31). The level of MTRR expression in
patients with preeclampsia is significantly lower than that noted
in healthy controls, but MTHFR expression is not significantly
different between patients and controls. After eclampsia, it is
difficult to survive. More than 90% of ALL occurs in infants and
young children. Some studies have confirmed that infant ALL
originates before birth and embryos with prenatal exposure to toxic
compounds may suffer genetic changes during the developmental
process (32). Therefore, the
MTRR gene plays an important role in the development of the
fetus and children. Immunostaining of tissue microarrays showed
that 517 human tumor tissues had different levels of MTRR protein
expression, most of which were expressed at low levels, suggesting
that MTRR also plays an important role in tumorigenesis
(33). The decrease of mRNA levels
of MTRR leads to a deficiency of the MTRR enzyme and a
sufficient amount of MTRR cannot be activated, which may be the
cause of the decrease of folate and the accumulation of HCY in
cases of ALL.
Wong et al (34) confirmed that archived bone marrow
smear samples were suitable for methylation sequencing. Court et
al (35) reported that no
differences in gene mutation analysis and polymorphism screening
were detected from DNA extracted from bone marrow smears with
phenol/chloroform/isoamyl alcohol compared to DNA extracted from
frozen-preserved cells using a commercial extraction kit. We used
MALDI-TOF MS to detect the methylation of 48 CpG sites in the
promoter region of the MTRR gene (4335–5025 position 691 bp)
in bone marrow from children with ALL and from healthy controls.
Among them, 7 CpG sites could not be detected due to sequencing
problems. Forty-one CpG sites were identified, and the number of
methylation sites, average methylation rate, and overall
methylation levels were evaluated. The results showed that there
were no significant differences in the CpG locus or methylation
levels of the MTRR gene in the bone marrow from children
with ALL compared with the controls, suggesting that the
differences in the downregulation of the MTRR gene mRNA
levels were not caused by methylation, but may be due to other mRNA
level regulatory factors, such as miRNA, IncRNA, transcription
factors, RNA binding proteins, post-transcriptional regulation, or
abnormal chromatin remodeling. Notably, there were no significant
differences in the methylation or methylation status of the
MTRR gene promoter between the relapsed and non-relapsed ALL
patients and no significant differences were found in T-ALL and
B-ALL compared to the healthy controls. Therefore, MTRR
cannot be used as a molecular indicator for the diagnosis,
immunophenotyping and assessment of recurrence for children with
ALL.
After risk classification of children with ALL, we
found that risk classification can be performed on high-risk ALL
and low-risk ALL by combined MTRR gene promoter CpG_6,
CpG_26, CpG_42.23.44, and CpG_46.47 methylation markers. The reason
for the high- or low-level of methylation sites in the promoter
region of MTRR gene in high-risk and low-risk ALL groups may
be due to the current risk stratification factors of ALL, including
the heterogeneity of different fusion genes, heterogeneity of
different leukocyte immunophenotypes, or heterogeneity of drug
sensitivity in different populations. Thus, although patients were
classified to the same risk category by the current risk
assessment, they had different individual heterogeneity and should
be subdivided according to detailed grading factors. However, there
was a limited number of clinical samples available in this
experiment and they could be divided only temporarily according to
the current clinical risk classification. In a follow-up study, the
clinical sample size should be expanded, and the correlation
between the MTRR promoter methylation and the various types
of ALL should be explored in more detail.
In the ALL-H group, the promoter region of the
MTRR gene was demethylated mainly through the CpG_1, CpG_10
and CpG_48 sites, which reduced the overall methylation levels of
the gene and activated the MTRR gene. This contrasts with
the RT-qPCR experiment in the present study. The possible reason is
that most of the fresh bone marrow samples collected by the
experiment were related to ALL-NH, and there were only 2 cases of
ALL-H in 20 cases of ALL. It was difficult to carry out statistical
difference analysis, and more samples are necessary to verify the
above hypothesis. The ALL-H group is clinically different from
other types of ALL and is often classified into the medium-high
risk group due to poor prognoses. However, by analyzing the
methylation of the MTRR gene in the medium-high-risk and the
low-risk groups, data (Fig. 5A)
confirmed that the medium-high-risk group had greater methylation
consistency. However, the differential methylation sites CpG_6,
CpG_26, CpG_42.23.44, and CpG_46.47 appear to be inconsistent with
the CpG_1, CpG_10 and CpG_48 sites in the ALL-H group. The reason
is that the differences in the CpG_1, CpG_10 and CpG_48 sites are
only seen in ALL-H, but the addition of other grading criteria
increases the clinical heterogeneity of the disease, resulting in
the absence of differential sites. Whether these differential sites
have the potential to supplement the molecular markers of future
individualized stratification based on high white blood cell counts
requires validation with a larger number of clinical samples.
Additionally, the treatment plan for ALL-H is different from other
ALL types. It is necessary to reduce the high load of white blood
cells and prevent tumor lysis syndrome. This often results in a
very high mortality rate for leukemia patients (36). Decreasing the methylation of the
MTRR gene promoter causes activation of the gene in ALL-H.
This possible mechanism provides a basis for the treatment of high
leukocyte acute lymphoblastic leukemia patients by using
MTRR-targeting inhibitors to reduce tumor burden during
treatment.
In the present study, the phenol-chloroform
extraction was highly efficient for the extraction of genomic DNA
from the bone marrow smears within 2 years of acquisition. When the
preservation time of the bone marrow smears was greater than 2
years, we found that most of the samples showed obvious
degradation, where the main band was unclear and the genomic DNA
bands were diffuse. This result indicated that the routine
preservation of bone marrow smears at room temperature should not
exceed 2 years in order to meet the experimental requirements. The
extraction of gDNA may have been a reason for the poor
concentration of samples. The present study showed, however, that
bone marrow smear samples can be preserved easily for a
considerable time, is convenient for large-scale and
disease-related specimens to be retrospectively studied, and have
great application prospects.
In conclusion, we found that the levels of
MTRR mRNA expression were significantly lower in ALL
patients than in the control samples. After stratification of risk,
we found that the methylation rates of CpG_6, CpG_26, CpG_42.23.44
and CpG_46.47 sites were statistically different between the
high-/medium- and low-risk groups. These sites provide new
molecular markers for risk stratification of childhood ALL. The
methylation rate of CpG_1, CpG_10, CpG_48 and score in the ALL-H
group was lower than in the ALL-NH and control groups, suggesting a
correlation with peripheral blood leukocyte proliferation. The
methylation of the MTRR gene promoter region can be used to
classify the risk of ALL in children.
Acknowledgements
Not applicable.
Funding
The present study was supported by grants from the
National Natural Resources Fund (nos. 31660112 and 81272454) and
the Fundamental Research Funds from Medical Genetic and Biological
Medicine Collaborative Innovation Center of Yunnan Province and
Medical Scientific Research Project.
Availability of data and materials
The datasets used during the present study are
available from the corresponding author upon reasonable
request.
Authors' contributions
XX and LZ conceived and designed the experiments. JB
and LL performed the experiments. JB, YL and QC analyzed the data
and wrote the paper. JB revised the paper. All authors read and
approved the manuscript and agree to be accountable for all aspects
of the research in ensuring that the accuracy or integrity of any
part of the work are appropriately investigated and resolved.
Ethics approval and consent to
participate
The present study was approved by the Εthics
Committee of Lanzhou University Basic Medical College (201400105).
All patient and control samples were obtained after obtaining
signed informed consent forms.
Patient consent for publication
Not applicable.
Competing interests
The authors declare that they have no competing
interests.
References
|
1
|
Nordlund J, Bäcklin CL, Wahlberg P, Busche
S, Berglund EC, Eloranta ML, Flaegstad T, Forestier E, Frost BM,
Harila-Saari A, et al: Genome-wide signatures of differential DNA
methylation in pediatric acute lymphoblastic leukemia. Genome Biol.
14:r1052013. View Article : Google Scholar : PubMed/NCBI
|
|
2
|
Loghavi S, Kutok JL and Jorgensen JL:
B-acute lymphoblastic leukemia/lymphoblastic lymphoma. Am J Clin
Pathol. 144:393–410. 2015. View Article : Google Scholar : PubMed/NCBI
|
|
3
|
Pui CH, Yang JJ, Hunger SP, Pieters R,
Schrappe M, Biondi A, Vora A, Baruchel A, Silverman LB, Schmiegelow
K, et al: Childhood acute lymphoblastic leukemia: Progress through
collaboration. J Clin Oncol. 33:2938–2948. 2015. View Article : Google Scholar : PubMed/NCBI
|
|
4
|
Cooper SL and Brown PA: Treatment of
pediatric acute lymphoblastic leukemia. Haematologica.
93:1124–1128. 2008. View Article : Google Scholar : PubMed/NCBI
|
|
5
|
Pui CH, Carroll WL, Meshinchi S and Arceci
RJ: Biology, risk stratification, and therapy of pediatric acute
leukemias: An update. J Clin Oncol. 29:551–561. 2011. View Article : Google Scholar : PubMed/NCBI
|
|
6
|
Harrison CJ: Cytogenetics of paediatric
and adolescent acute lymphoblastic leukaemia. Br J Haematol.
144:147–156. 2009. View Article : Google Scholar : PubMed/NCBI
|
|
7
|
Arico M, Schrappe M, Hunger SP, Carroll
WL, Conter V, Galimberti S, Manabe A, Saha V, Baruchel A,
Vettenranta K, et al: Clinical outcome of children with newly
diagnosed philadelphia chromosome-positive acute lymphoblastic
leukemia treated between 1995 and 2005. J Clin Oncol. 28:4755–4761.
2010. View Article : Google Scholar : PubMed/NCBI
|
|
8
|
Mullighan CG, Goorha S, Radtke I, Miller
CB, Coustan-Smith E, Dalton JD, Girtman K, Mathew S, Ma J, Pounds
SB, et al: Genome-wide analysis of genetic alterations in acute
lymphoblastic leukaemia. Nature. 446:758–764. 2007. View Article : Google Scholar : PubMed/NCBI
|
|
9
|
Mullighan CG, Su X, Zhang J, Radtke I,
Phillips LA, Miller CB, Ma J, Liu W, Cheng C, Schulman BA, et al:
Deletion of IKZF1 and prognosis in acute lymphoblastic
leukemia. N Engl J Med. 360:470–480. 2009. View Article : Google Scholar : PubMed/NCBI
|
|
10
|
Nebbioso A, Tambaro FP, Dell'Aversana C
and Altucci L: Cancer epigenetics: Moving forward. PLoS Genet.
14:e10073622018. View Article : Google Scholar : PubMed/NCBI
|
|
11
|
Burke MJ and Bhatla T: Epigenetic
modifications in pediatric acute lymphoblastic leukemia. Front
Pediatr. 2:422014. View Article : Google Scholar : PubMed/NCBI
|
|
12
|
Davidsson J, Lilljebjörn H, Andersson A,
Veerla S, Heldrup J, Behrendtz M, Fioretos T and Johansson B: The
DNA methylome of pediatric acute lymphoblastic leukemia. Hum Mol
Genet. 18:4054–4065. 2009. View Article : Google Scholar : PubMed/NCBI
|
|
13
|
Esteller M: Epigenetic gene silencing in
cancer: The DNA hypermethylome. Hum Mol Genet. 1:R50–R59. 2007.
View Article : Google Scholar
|
|
14
|
Hale V, Hale GA, Brown PA and Amankwah EK:
A review of DNA methylation and microRNA expression in recurrent
pediatric acute leukemia. Oncology. 92:61–67. 2017. View Article : Google Scholar : PubMed/NCBI
|
|
15
|
Navarrete-Meneses MDP and Pérez-Vera P:
Epigenetic alterations in acute lymphoblastic leukemia. Bol Med
Hosp Infant Mex. 74:243–264. 2017.(In Spanish). PubMed/NCBI
|
|
16
|
Stumpel DJ, Schneider P, van Roon EH, Boer
JM, de Lorenzo P, Valsecchi MG, de Menezes RX, Pieters R and Stam
RW: Specific promoter methylation identifies different subgroups of
MLL-rearranged infant acute lymphoblastic leukemia, influences
clinical outcome, and provides therapeutic options. Blood.
114:5490–5498. 2009. View Article : Google Scholar : PubMed/NCBI
|
|
17
|
Borssén M, Palmqvist L, Karrman K,
Abrahamsson J, Behrendtz M, Heldrup J, Forestier E, Roos G and
Degerman S: Promoter DNA methylation pattern identifies prognostic
subgroups in childhood T-cell acute lymphoblastic leukemia. PLoS
One. 8:e653732013. View Article : Google Scholar : PubMed/NCBI
|
|
18
|
Borssén M, Haider Z, Landfors M,
Norén-Nyström U, Schmiegelow K, Åsberg AE, Kanerva J, Madsen HO,
Marquart H, Heyman M, et al: DNA methylation adds prognostic value
to minimal residual disease status in pediatric T-cell acute
lymphoblastic leukemia. Pediatr Blood Cancer. 63:1185–1192. 2016.
View Article : Google Scholar : PubMed/NCBI
|
|
19
|
Amigou A, Rudant J, Orsi L, Goujon-Bellec
S, Leverger G, Baruchel A, Bertrand Y, Nelken B, Plat G, Michel G,
et al: Folic acid supplementation, MTHFR and MTRR
polymorphisms, and the risk of childhood leukemia: The ESCALE study
(SFCE). Cancer Causes Control. 23:1265–1277. 2012. View Article : Google Scholar : PubMed/NCBI
|
|
20
|
Duthie SJ, Narayanan S, Blum S, Pirie L
and Brand GM: Folate deficiency in vitro induces uracil
misincorporation and DNA hypomethylation and inhibits DNA excision
repair in immortalized normal human colon epithelial cells. Nutr
Cancer. 37:245–251. 2000. View Article : Google Scholar : PubMed/NCBI
|
|
21
|
Refsum H, Wesenberg F and Ueland PM:
Plasma homocysteine in children with acute lymphoblastic leukemia:
Changes during a chemotherapeutic regimen including methotrexate.
Cancer Res. 51:828–835. 1991.PubMed/NCBI
|
|
22
|
Pinnix CC, Chi L, Jabbour EJ, Milgrom SA,
Smith GL, Daver N, Garg N, Cykowski MD, Fuller G, Cachia D, et al:
Dorsal column myelopathy after intrathecal chemotherapy for
leukemia. Am J Hematol. 92:155–160. 2017. View Article : Google Scholar : PubMed/NCBI
|
|
23
|
Metayer C, Milne E, Dockerty JD, Clavel J,
Pombo-de-Oliveira MS, Wesseling C, Spector LG, Schüz J, Eleni P,
Sameera E, et al: Maternal supplementation with folic acid and
other vitamins and risk of leukemia in the offspring: A childhood
leukemia international consortium study. Epidemiology. 25:811–822.
2014. View Article : Google Scholar : PubMed/NCBI
|
|
24
|
Brunaud L, Alberto JM, Ayav A, Gérard P,
Namour F, Antunes L, Braun M, Bronowicki JP, Bresler L and Guéant
JL: Effects of vitamin B12 and folate deficiencies on DNA
methylation and carcinogenesis in rat liver. Clin Chem Lab Med.
41:1012–1019. 2003. View Article : Google Scholar : PubMed/NCBI
|
|
25
|
Wu M and Li Z: Interpretation of the
recommendations for the diagnosis and treatment of children with
acute lymphocytic leukemia (four revisions). Chin J Pediatr.
52:645–648. 2014.
|
|
26
|
Livak KJ and Schmittgen TD: Analysis of
relative gene expression data using real-time quantitative PCR and
the 2−ΔΔCT method. Methods. 25:402–408. 2001. View Article : Google Scholar : PubMed/NCBI
|
|
27
|
Sambrook J and Russell DW: Preparation and
analysis of eukaryotic genomic DNA (Chapter 6). Molecular Cloning -
A Laboratory Manual. 1. 3rd. Cold Spring Harbor Laboratory Press;
New York, NY: pp. 4–12. 2001
|
|
28
|
Popp C, Dean W, Feng S, Cokus SJ, Andrews
S, Pellegrini M, Jacobsen SE and Reik W: Genome-wide erasure of DNA
methylation in mouse primordial germ cells is affected by AID
deficiency. Nature. 463:1101–1105. 2010. View Article : Google Scholar : PubMed/NCBI
|
|
29
|
Iacobucci I and Mullighan CG: Genetic
basis of acute lymphoblastic leukemia. J Clin Oncol. 35:975–983.
2017. View Article : Google Scholar : PubMed/NCBI
|
|
30
|
Chen Z, Karaplis AC, Ackerman SL, Pogribny
IP, Melnyk S, Lussier-Cacan S, Chen MF, Pai A, John SW, Smith RS,
et al: Mice deficient in methylenetetrahydrofolate reductase
exhibit hyperhomocysteinemia and decreased methylation capacity,
with neuropathology and aortic lipid deposition. Hum Mol Genet.
10:433–444. 2001. View Article : Google Scholar : PubMed/NCBI
|
|
31
|
Seremak-Mrozikiewicz A, Bogacz A,
Bartkowiak-Wieczorek J, Wolski H, Czerny B, Gorska-Paukszta M and
Drews K: The importance of MTHFR, MTR, MTRR and CSE expression
levels in Caucasian women with preeclampsia. Eur J Obstet Gynecol
Reprod Biol. 188:113–117. 2015. View Article : Google Scholar : PubMed/NCBI
|
|
32
|
Guest EM and Stam RW: Updates in the
biology and therapy for infant acute lymphoblastic leukemia. Curr
Opin Pediatr. 29:20–26. 2017. View Article : Google Scholar : PubMed/NCBI
|
|
33
|
Wang J, Guise CP, Dachs GU, Phung Y, Hsu
AH, Lambie NK, Patterson AV and Wilson WR: Identification of
one-electron reductases that activate both the hypoxia prodrug
SN30000 and diagnostic probe EF5. Biochem Pharmacol. 91:436–446.
2014. View Article : Google Scholar : PubMed/NCBI
|
|
34
|
Wong NC, Meredith GD, Marnellos G, Dudas
M, Parkinson- Bates M, Halemba MS, Chatterton Z, Maksimovic J,
Ashley DM, Mechinaud F, et al: Paediatric leukaemia DNA methylation
profiling using MBD enrichment and SOLiD sequencing on archival
bone marrow smears. Gigascience. 4:112015. View Article : Google Scholar : PubMed/NCBI
|
|
35
|
Court EL, Davidson K, Smith MA, Inman L,
Marriott SA, Smith JG and Pallister CJ: C-kit mutation screening in
patients with acute myeloid leukaemia: Adaptation of a
Giemsa-stained bone-marrow smear DNA extraction technique. Br J
Biomed Sci. 58:76–84. 2001.PubMed/NCBI
|
|
36
|
Dubbs SB: Rapid Fire: Tumor lysis
syndrome. Emerg Med Clin North Am. 36:517–525. 2018. View Article : Google Scholar : PubMed/NCBI
|