Introduction
Myelodysplastic syndrome (MDS) refers to a group of
neoplastic bone marrow disorders characterized by abnormal blood
cell morphology and functions due to defects in hematopoietic
precursor differentiation into mature blood cells. Importantly, MDS
can progress to acute myeloid leukemia (AML). Clinically, patients
manifest symptoms related to anemia, neutropenia, and/or
thrombocytopenia, such as chronic fatigue, shortness of breath,
chilled sensations, and increased susceptibility to infection and
bleeding, while other patients may lack symptoms and are diagnosed
following blood analyses (1). To
date, the pathogenesis of MDS is poorly understood, and risk
factors include exposure to pesticides, benzene, or previous
chemotherapy and/or radiotherapy, all of which cause damage to
genomic DNA (1), Studies have aimed
to identify the key genetic (2) and
epigenetic alterations (3) involved
in MDS. Moreover, overexpression of immune-related genes (4) and abnormal activation of innate immune
signals (5,6) have been widely reported in MDS. However,
the definite pathogenetic mechanisms of MDS are still not fully
understood. Thus, research into the molecular mechanisms of MDS
development and progression is urgently needed, and the findings
could provide novel strategies for effective control and prevention
of MDS.
To this end, a previous study revealed that aberrant
gene expression through genomic DNA methylation could be a dominant
mechanism by which MDS progresses to AML (7). Our previous study identified a set of
methylated genes (8). One of these
genes, 4-aminobutyrate aminotransferase (ABAT), was highly
methylated and its expression was reduced in MDS patients compared
with that noted in healthy controls (8,9). The
ABAT gene is localized on chromosome 16p13.2 and encodes a
protein responsible for the catabolism of γ-aminobutyric acid
(GABA, an important neurotransmitter in the central nervous
system) into succinic semialdehyde (10). In humans, gene mutations leading to
ABAT deficiency are extremely rare, while a clinical study
biochemically confirmed that ABAT deficiency contributes to
symptoms related to psychomotor retardation, hypotonia,
hyperreflexia, lethargy, and intractable seizures (11). Moreover, ABAT single-nucleotide
polymorphisms have been associated with depression (12), sleep homeostasis (13), autism (14) and gastroesophageal reflux disease
(15). In regards to human cancer,
reduced ABAT expression has been associated with resistance
to endocrine therapy of breast cancer, and with poor
recurrence-free survival of breast cancer patients (16,17).
Furthermore, long non-coding RNAs (lncRNAs) are
transcripts longer than 200 nucleotides that are not usually
translated into proteins, and their genes are usually located
within intergenic stretches or overlapping antisense transcripts of
protein coding genes (18,19). lncRNAs function to regulate chromatin
remodeling, genomic imprinting, gene transcription, splicing, and
translation in cells, and aberrant lncRNA expression contributes to
human diseases, including the pathogenesis of hematopoietic
malignancies (20). Although lncRNAs
are increasingly recognized as regulators of normal and aberrant
hematopoiesis (21), their role in
MDS has not been investigated thoroughly. In the present study, we
uncovered an ABAT-DEL-DEM co-expression network and assessed
the function of network components in MDS. We first identified
differentially expressed lncRNAs (DELs) and mRNAs (DEMs) in MDS
samples and then performed an integrative analysis to identify the
co-expressed network based on ABAT and lncRNAs, and conducted
lncRNA-mRNA networks. Subsequently, we further annotated this
co-expressed network using Gene Ontology (GO) and Kyoto
Encyclopedia of Genes and Genomes (KEGG) pathway and network terms.
We aimed to provide a novel methodology with which to analyze and
annotate disease-associated lncRNAs for functional validation and
targeted therapies.
Materials and methods
Patients and bone marrow samples
We recruited 23 MDS patients at the Department of
Hematology, Huashan Hospital, Fudan University (Shanghai, China)
from January 1, 2015 to December 30, 2016. The inclusion criteria
consisted of newly diagnosed patients and no previous treatment and
excluded patients with myelodysplastic/myeloproliferative neoplasms
(MDS/MPN) and MDS which had progressed to acute myeloid leukemia.
Bone marrow samples were collected for all patients and patients
were diagnosed with MDS and classified according to the 2008
revision of the World Health Organization (WHO) criteria (22). There were 15 men and 8 women with a
median age of 65 years (range, 29–82 years), in the MDS group. In
addition, bone marrow samples from 7 cases with non-hematological
malignancies with a median age of 38 years (range 23–78 years) were
obtained between January 1, 2015 and December 30, 2015, and were
analyzed as controls. No statistical difference was found with
regards to age and sex distributions among the subjects with MDS
and non-MDS controls. For microarray analysis groups, we obtained
bone marrow samples from anther 4 MDS patients (2 patients with
refractory anemia with excess blasts 1 (RAEB-1) and 2 patients with
RAEB-2] and 4 age-matched patients with hypersplenism from the
Department of Hematology, Huashan Hospital, Fudan University
(Shanghai, China) in 2014. We collected 2 ml of all bone marrow
samples using heparin and stored the samples at room temperature
within 8 h. Total RNA was isolated from bone marrow samples within
8 h and then stored at −80°C. The present study was approved by the
Ethics Committee of Huashan Hospital, School of Medicine, Fudan
University. All participants provided a written informed consent
form before being enrolled into this study.
RNA isolation and reverse
transcription and quantitative reverse transcription polymerase
chain reaction (RT-qPCR)
Total RNA was isolated from bone marrow samples
using TRIzol reagent (Invitrogen; Thermo Fisher Scientific, Inc.).
The purity of RNA was assessed by measuring the optical density
(OD) 260/280 ratio using a NanoDrop spectrophotometer (NanoDrop
Technologies; Thermo Fisher Scientific, Inc.). The RNA samples were
reverse transcribed into cDNA using Takara PrimeScript RT Master
Mix (Takara Bio Inc., Otsu, Shiga, Japan). The 10-µl reaction
mixture comprised 2 µl 5X PrimeScript RT Master Mix, 500 ng RNA and
RNase-Free distilled H2O, which was used to ensure that
the total reached 10 µl. Subsequently, the mixture was amplified at
37°C for 15 min, 85°C for 5 sec and was stored at 4°C for further
use.
For RT-qPCR, cDNA samples were amplified using an
Applied Biosystems™ 7500 Real-Time PCR system (Applied Biosystems;
Thermo Fisher Scientific, Inc.) in a 20-µl mixture containing 10 µl
SYBR® Premix Ex Taq™ (Takara Bio, Inc., Otsu, Japan),
0.4 µl of each primer (10 µmol/l), 0.4 µl ROX Reference Dye II
(Takara Bio, Inc.), 2 µl cDNA, and 6.8 µl ddH2O at 95°C
for 30 sec, followed by 40 cycles at 95°C for 5 sec and 60°C for 34
sec. Gene expression levels were expressed relative to the
expression of GADPH. The primers were designed with the Primer 3.0
online software (http://bioinfo.ut.ee/primer3-0.4.0/) and synthesized
by BioTNT (Shanghai, China). The primer sequences were as follows:
lncENST00000444102, 5′-TATCGACGTAGTTAAAGCCCACT-3′ and
5′-CTTCTGCCCTTCACATCCTCT-3′; ABAT, 5′-CCGACTACAGCATCCTCTCC-3′ and
5′-GGTTCTCTTTCACAAACTCTTCC-3′; GAPDH, 5′-GACCTGACCTGCCGTCTA-3′ and
5′-AGGAGTGGGTGTCGCTGT-3′. The relative levels of gene expression
were calculated using the 2−ΔΔCq method (23).
Microarray analysis
Subsequently, cDNA samples from microarray analysis
groups were used to profile differentially expressed gene
transcripts and lncRNAs using Agilent human genome-wide gene
expression BeadChips (Agilent Technologies, Inc., Santa Clara, CA,
USA) according to the manufacturer's protocol at 65°C. The
expression values were normalized with Robust Multi-array Average
(RMA) of background-adjusted, normalized and
log2-transformed using the statistical software package
R (24).
Construction of the ABAT-DEL-DEM
co-expression network
After profiling each DEL and DEM in the MDS samples,
we specifically identified the altered ABAT expression in MDS
patients for construction of the ABAT-DEL-DEM network. In
brief, the co-expression of ABAT and particular DELs and
lncRNA-mRNA correlation were evaluated using the Pearson
correlation coefficient (PCC). The ABAT-DEL-DEM
co-expression network was further filtered by the overlapping DELs
using software of Cytoscape 3.4.0 (The Cytoscape Consortium, San
Diego, CA, USA. Weblink: http://cytoscape.org/download.html) according to a
previous study (25).
GO and KEGG pathway and network
analyses
Subsequently, we investigated the potential role of
the identified ABAT-DEL-DEM co-expression network using the
GO and KEGG pathway and network analyses using the Database for
Annotation, Visualization and Integrated Discovery (DAVID, v6.8
tool) (26,27). The KEGG pathway enrichment analysis
was performed using the clusterProfiler package in R/bioconductor.
Furthermore, the key KEGG signaling pathway was analyzed using the
R package pathview (28).
Bioinformatic analysis of lncRNAs
For the bioinformatic analysis of lncRNAs, we first
accessed the UCSC database (http://genome.ucsc.edu) to prioritize
ABAT-associated lncRNAs and searched the NCBI human genomes
database to identify the chromosomal localization of each lncRNA.
We also utilized PhyloCSF, a novel comparative genomics method to
analyze multispecies nucleotide sequence alignment to determine
whether DNA sequences where each lncRNA resides are likely to
represent a conserved protein-coding or non-coding region (29). PhyloCSF scores for selected
phylogenies may be viewed in the UCSC Genome Browser by copying the
URL ‘http://www.broadinstitute.org/compbio1/PhyloCSFtracks/trackHub/hub.txt’
into the ‘My Hubs’ tab under ‘track hubs’. PhyloCSF outputs a
score, positive if the alignment is likely to represent a conserved
coding region, and negative otherwise. Moreover, we also used
computational and mathematical methods to predict advanced lncRNA
structure (http://rna.tbi.univie.ac.at/RNAfold/UyEBF8akiV), and
used the TRANSFAC database to predict the transcription factor
binding sites (TFBS) of each lncRNA (http://www.gene-regulation.com) (30).
Cell lines and culture
A human AML cell line (THP-1) was purchased from
Chinese Academy of Sciences (Shanghai, China) and a human AML cell
line transformed from MDS cells (SKM-1) was obtained from the
Japanese Collection of Research Bioresources (LCRB; Tokyo, Japan).
293T cells were used as a control (Chinese Academy of Sciences,
Shanghai, China). All cell lines were cultured in Roswell Park
Memorial Institute-1640 medium (RPMI-1640; Hyclone; GE Healthcare
Life Sciences) supplemented with 10% fetal bovine serum (Gibco-BRL;
Thermo Fisher Scientific, Inc.) in a humidified incubator with 5%
CO2 at 37°C.
Vector construction, lentivirus
preparation, and stable cell infection
To confirm our ABAT-DEL-DEM co-expression network,
we constructed lentiviral vectors and prepared lentivirus to stably
overexpress lncRNA or knock down ABAT expression. All
plasmid vectors were produced using standard cloning techniques
(31). The lncRNA was overexpressed
and cloned into GV470 lentiviral vectors (GeneChen, Shanghai,
China). The shRNA hairpins that targeted the 3′-untranslated region
(3′-UTR) of ABAT were designed and cloned into pGMLV-SC5
lentivirus vectors (Genomeditech, Shanghai, China). The sequences
of oligonucleotides were 5′-GCTGGAGACGTGCATGATTAA-3′. The SKM-1 and
THP-1 cells were respectively cultured in 6-well plates at a
density of 1×10⁶ cells/ml overnight and transduced with
lncRNA overexpression lentivirus and shRNA lentivirus plus a
scramble lentivirus (negative controls), and cells without any
lentivirus transduction were considered as controls. Since the
lentivirus had green fluorescence, we evaluated transduction
efficiency by flow cytometry at 72 h. The percentage of positive
cells was >80% by flow cytometry. The growth medium was then
replaced with 1 or 2 µg/ml puromycin, respectively, to select
stable cells for two weeks. These cells were then subjected to
quantitative reverse transcription polymerase chain reaction
(RT-qPCR) to verify expression levels of lncRNA and ABAT gene.
Cell viability CCK-8 assay
Cell viability was assessed using the Cell
Counting Kit-8 (CCK-8) assay kit from Dojindo Laboratories
(Kumamoto, Japan). In brief, stably transfected and control cells
were seeded into a 96-well culture plate at a density of
1×10³ cells/well and cultured for up to five days, with
media replaced every three days. At the end of each experiment, 5
µl of the CCK-8 reagent was added into each well and the cells were
further cultured for 4 h. Then, the optical density of cells was
measured at 450 nm using a spectrophotometer (Tecan, Männedorf,
Switzerland). The experiments were performed in triplicate and
repeated at least three times.
Flow cytometric Annexin V apoptosis
assay
Cells cultured for 48 h (6-well plate,
1×10⁶ cells/ml) were collected and washed twice with
phosphate-buffered saline (PBS), and then re-suspended in 200 µl of
the binding buffer. Annexin V-APC (5 µl) and 7-AAD (5 µl; Thermo
Fisher Scientific, Inc.) were added and the mixture was incubated
in the dark at room temperature for 15 min. The rate of cellular
apoptosis was then measured using a flow cytometer (BD Accuri C6;
BD Biosciences, San Jose, CA, USA). Data were statistically
analyzed using the software Flowjo 7.6 (Flow Jo, LLC, Ashland, OR,
USA). The experiments were performed in duplicate and repeated at
least once.
Statistical analysis
Student's t-test was used to identify DELs and DEMs
between patients with MDS and hypersplenism by calculation of
P<0.05 and fold change (FC)>2 for each DEM and DEL. The
correlation of ABAT-DEL-DEM co-expression was evaluated
using Pearson correlation coefficient (PCC). Pairs with a PCC
threshold >0.95 and P-value <0.05 were used to construct the
ABAT and DEL co-expression association matrix. Pairs with a
PCC threshold >0.99 and P-value <0.01 were selected as the
meaningful value to construct the DEL and DEM co-expression
network. A P-value <0.05 using Fisher's exact test and a kappa
(κ) coefficient of 0.4 were used as threshold values in GO and KEGG
pathway and network analyses. The in vitro experimental data
were analyzed using Graphpad Prism 6 software (GraphPad Software,
La Jolla, CA, USA). Comparisons between two groups were analyzed by
Student's t-test when data conformed to normal distribution, if
not, a non-parametric Kruskal-Wallis test was performed. Following
a Kruskal-Wallis test, Dunn's Multiple Comparisons test was used as
the post test to compare the difference in the sum of ranks between
two columns with the expected average difference. A P<0.05 was
considered statistically significant.
Results
Profile of differentially expressed
lncRNAs and mRNAs in MDS bone marrow samples
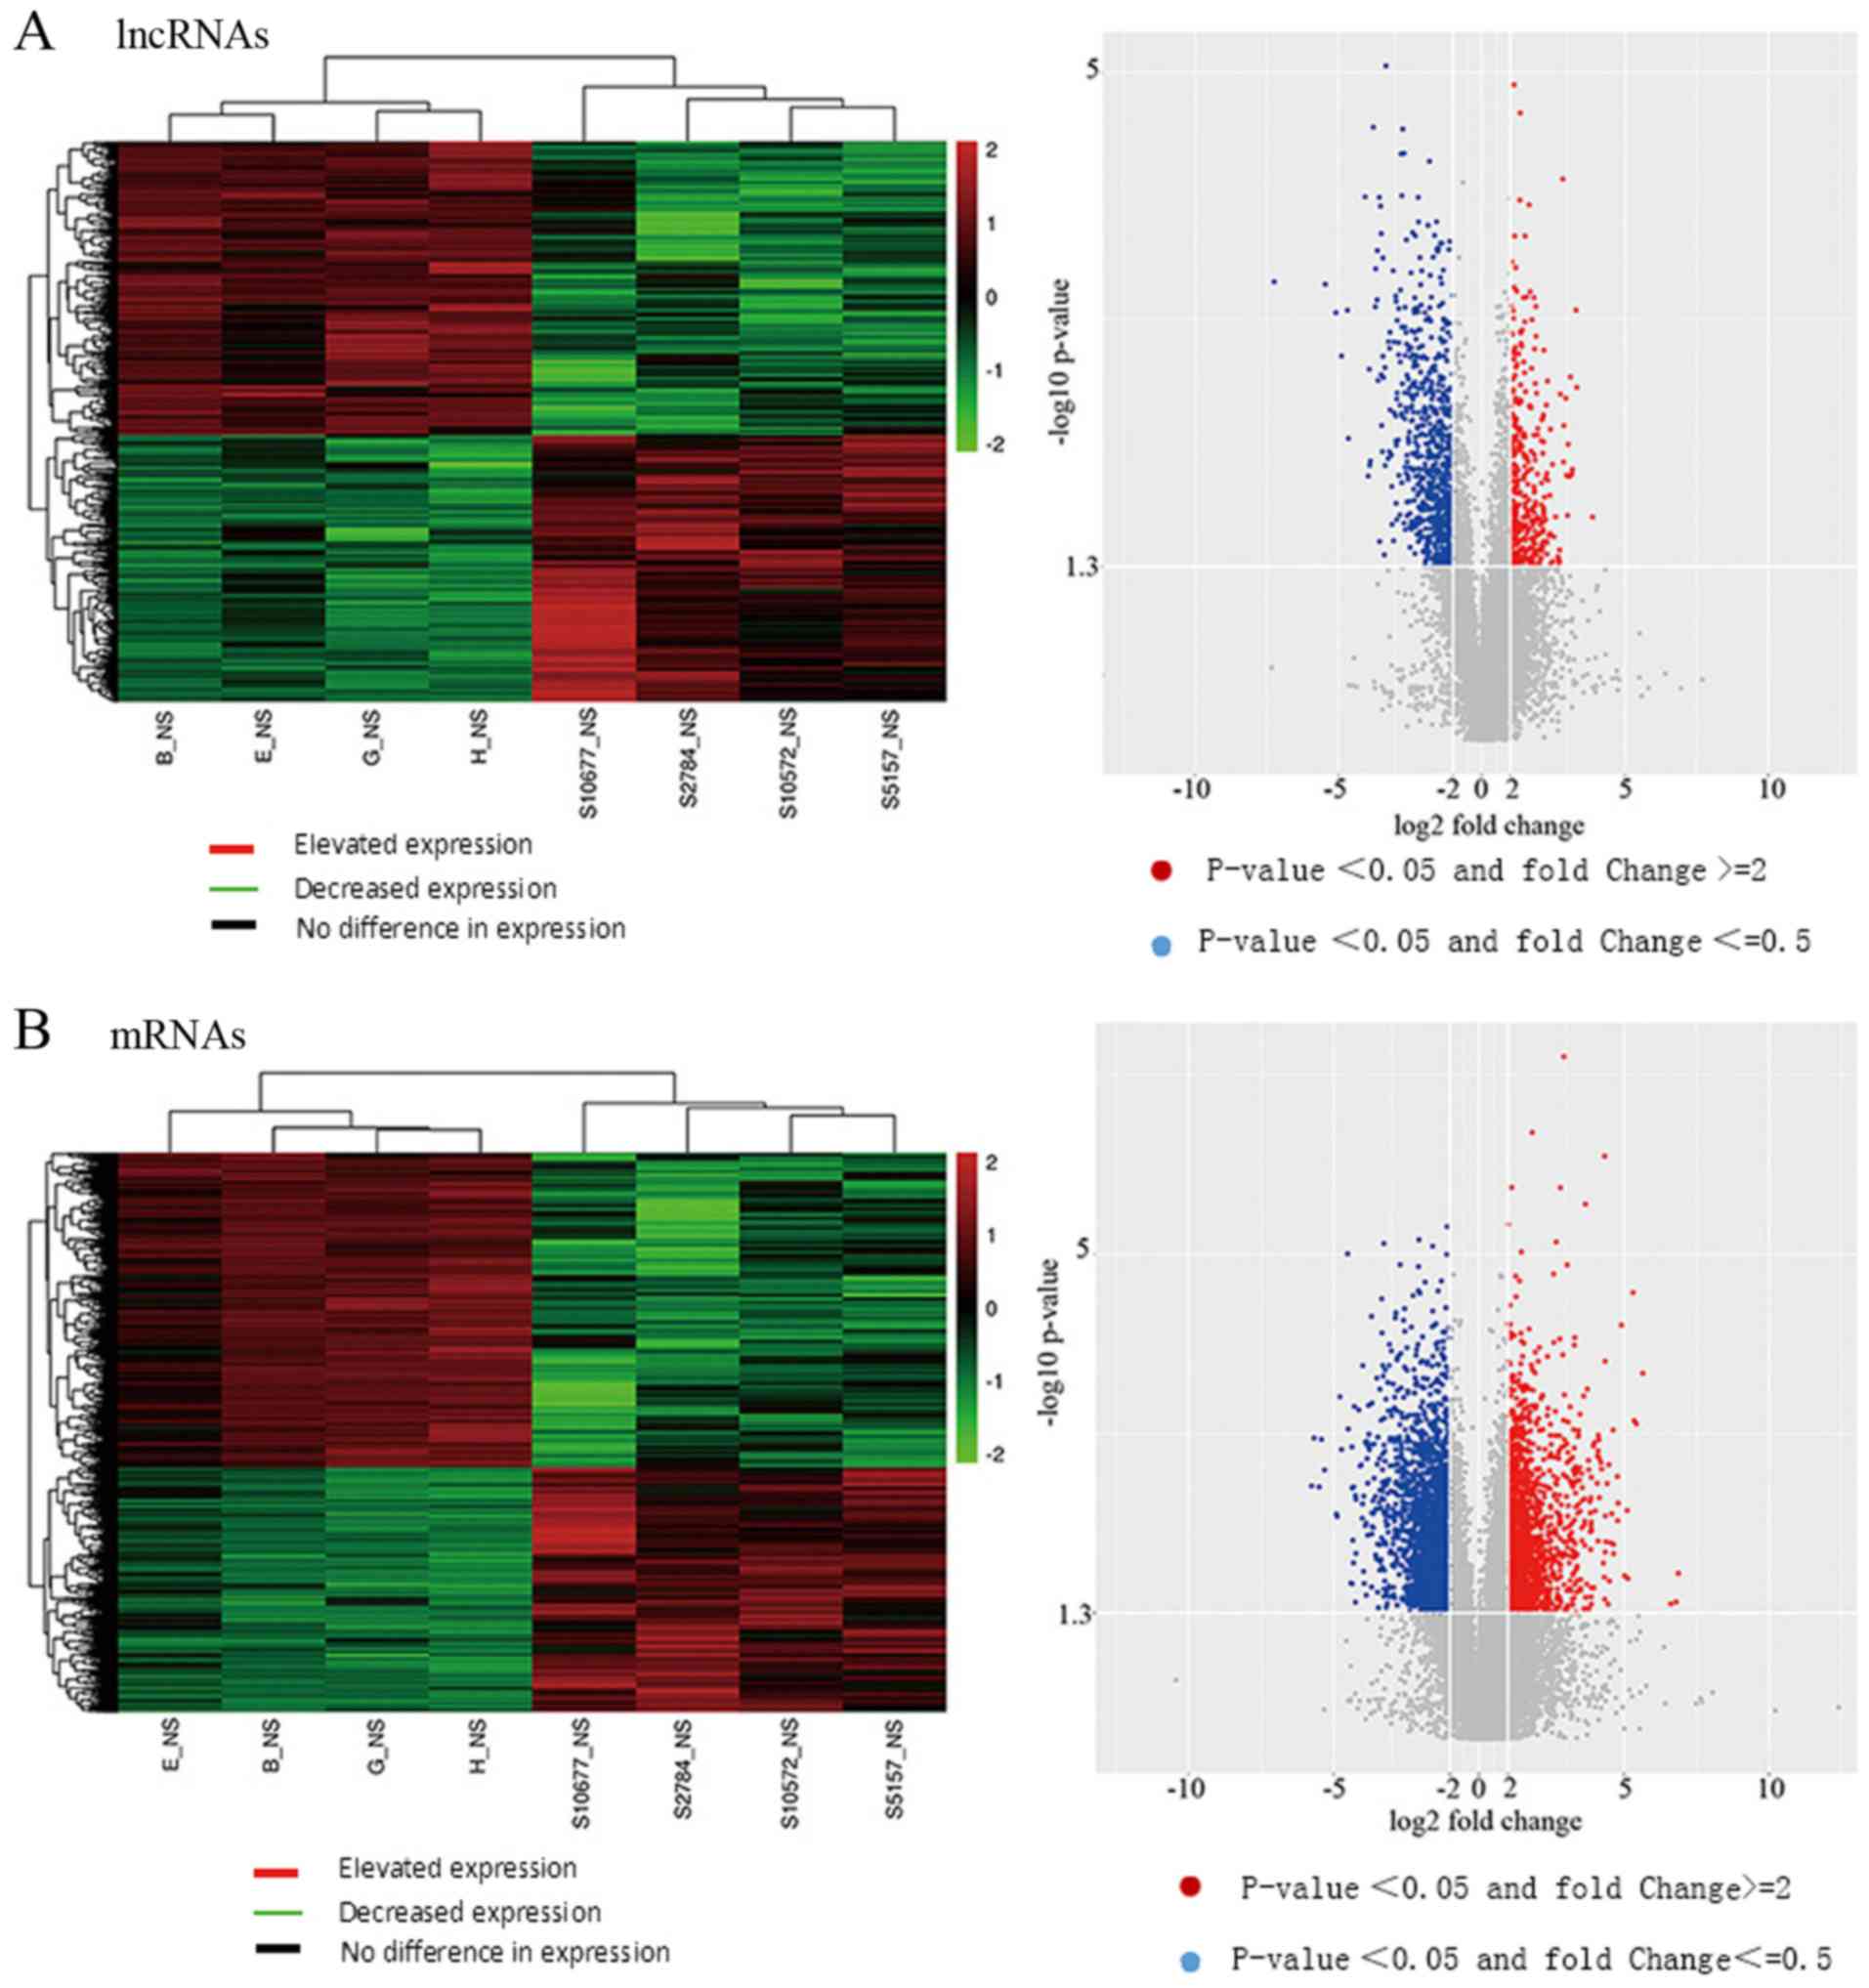
The microarray data were then scanned using SureScan
Scanner (Agilent Technologies) and analyzed as previously reported
(8). Bone marrow cells from 4 MDS
patients were compared with cells from 4 age-matched hypersplenism
controls, and the microarray analysis revealed a total of 543 DELs
and 2,705 DEMs. Among them, 285 (52.5%) DELs were downregulated and
258 (47.5%) DELs were upregulated in MDS patients, whereas 1,521
(56.2%) DEMs were downregulated and 1,184 (43.70%) DEMs were
upregulated in MDS. The volcano plots and heatmaps provide an
overview of the DEL and DEM microarray data, respectively (Fig. 1).
Identification of the ABAT-DEL-DEM
co-expression network
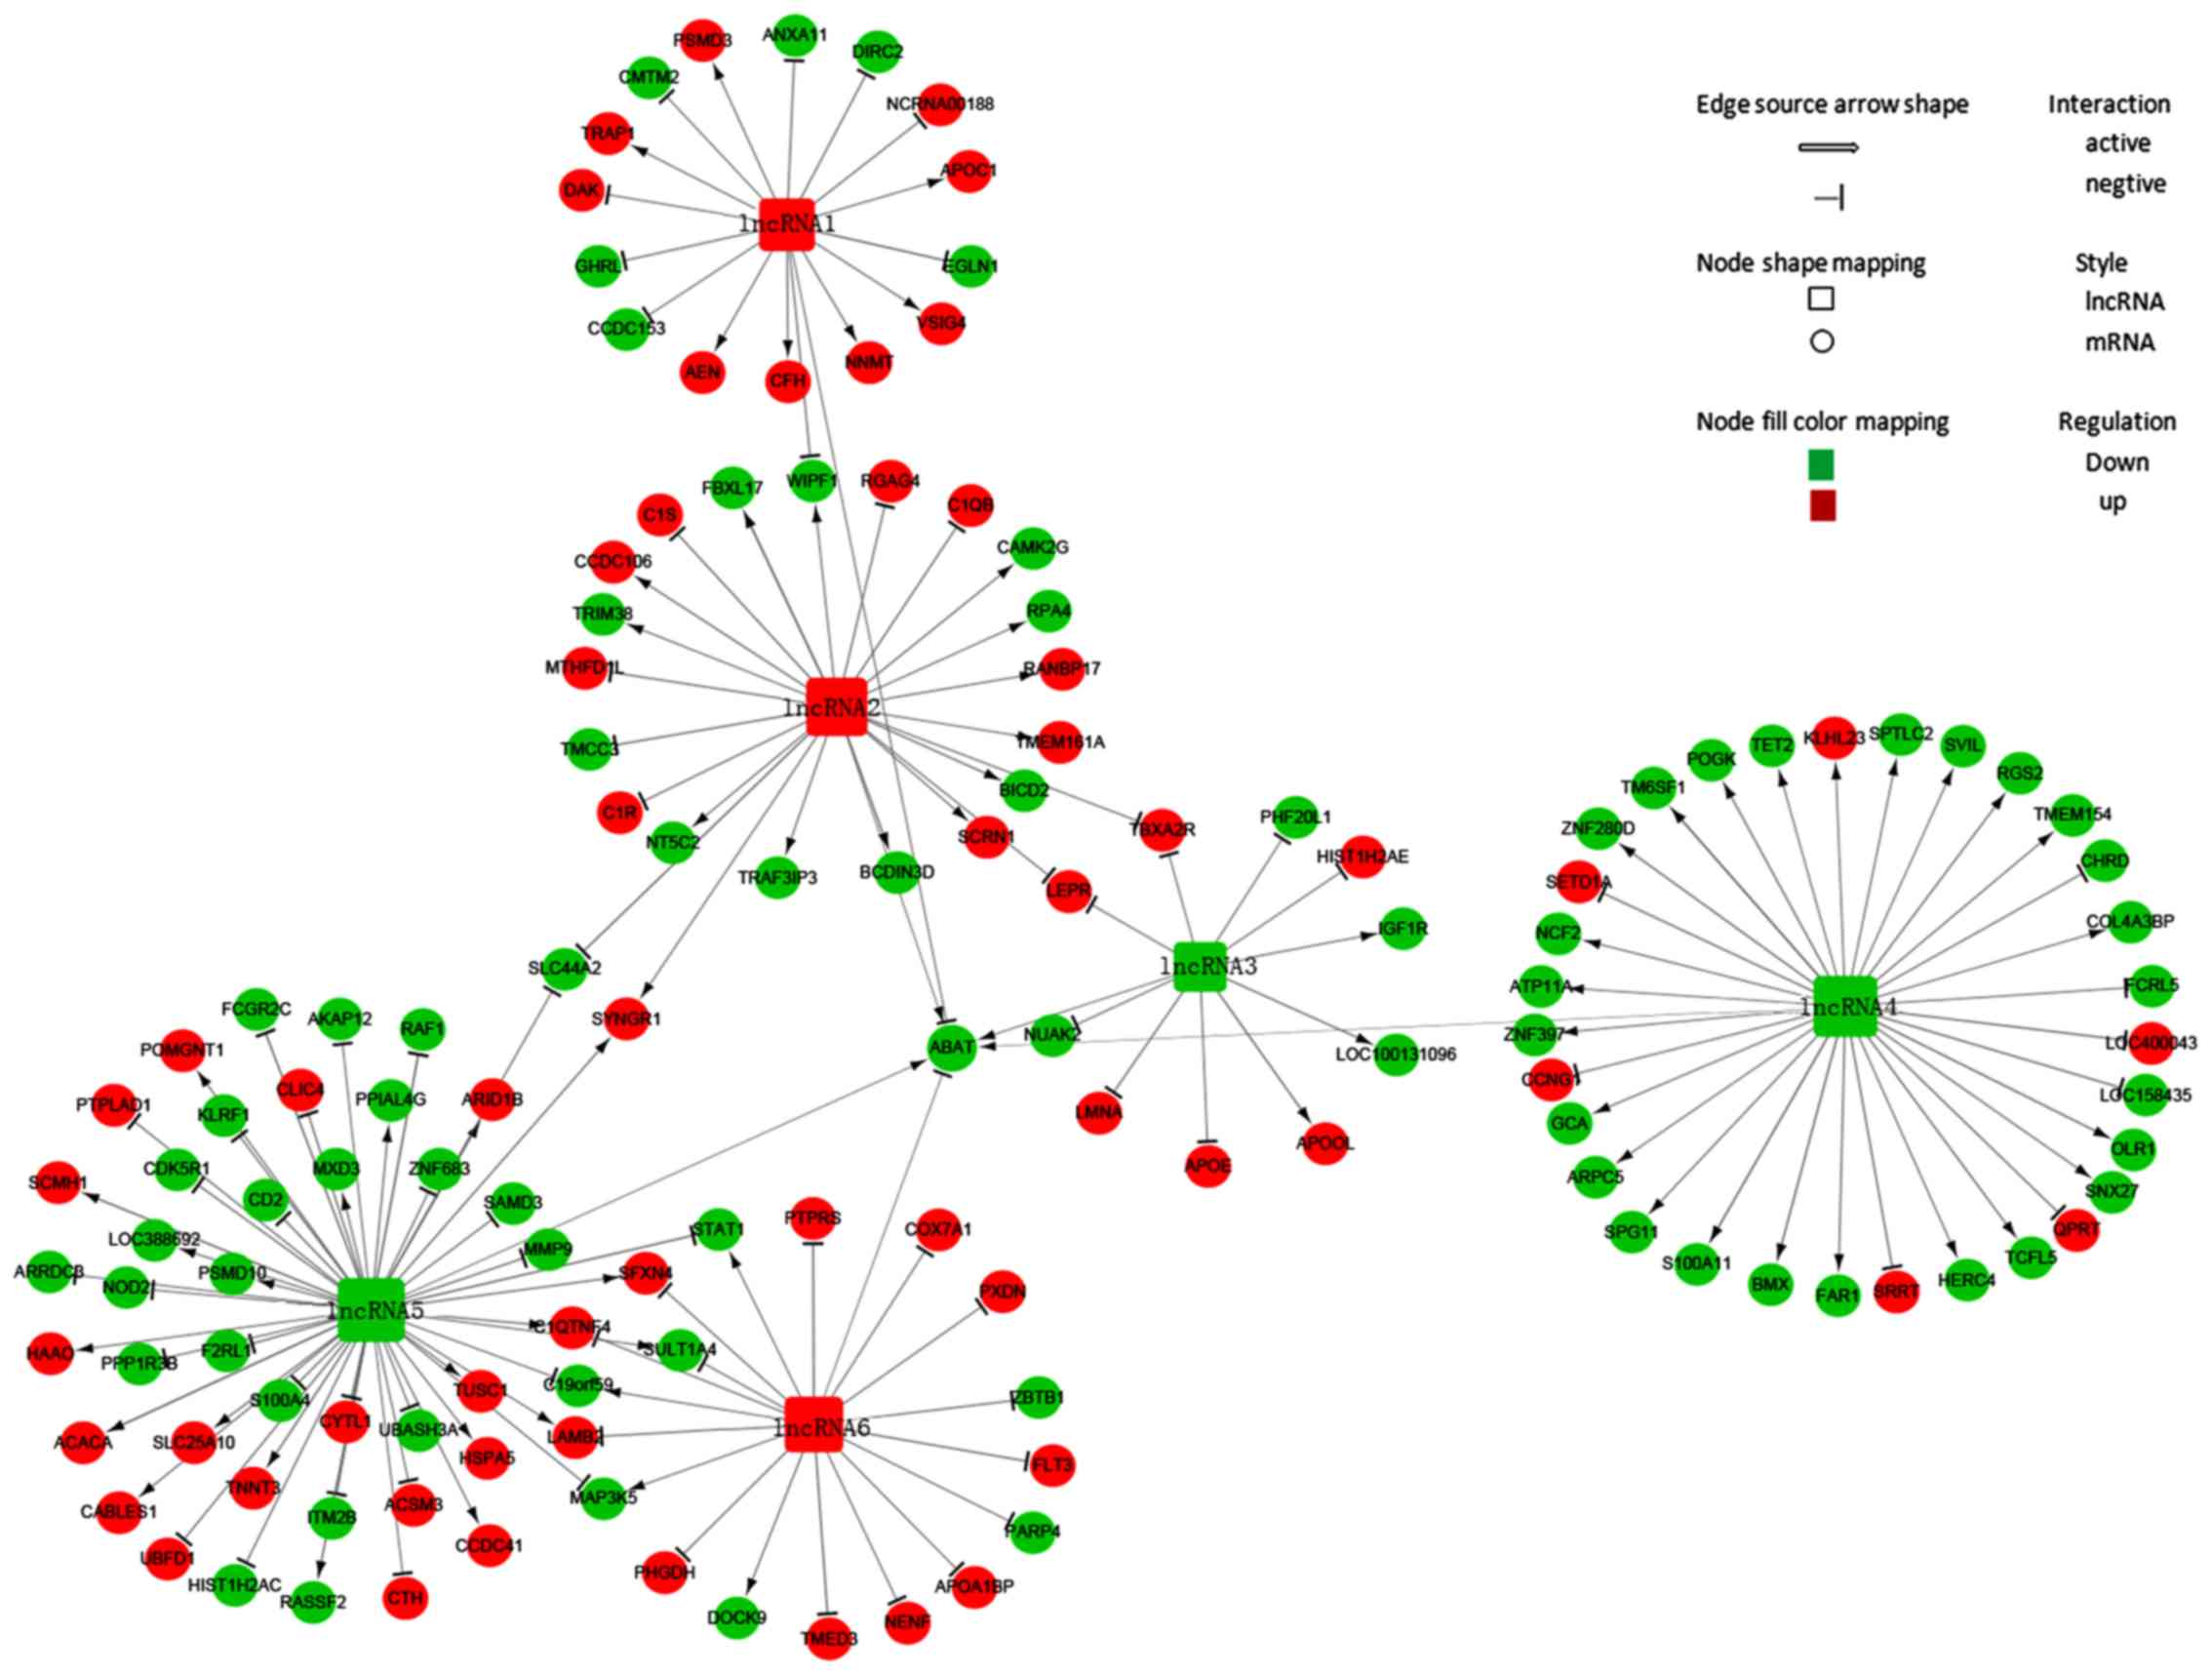
The ABAT-DEL-DEM co-expression network was
constructed using the Cytoscape program. To generate the
ABAT-DEL-DEM co-expression network, we related ABAT
expression in MDS samples to each of the DELs using the PCC test.
We were able to select six DELs (Table
I) that were co-expressed with ABAT with a PCC threshold
>0.95 and P<0.05 and 135 co-expressed mRNAs with a PCC
threshold >0.99 and P<0.01 in MDS to construct the lncRNA and
mRNA co-expression network (Table
SI). Next, their potential interaction was determined using the
Cytoscape program. The data showed that the co-expression network
was composed of six DELs related to ABAT and 135
co-expressed mRNAs (Fig. 2). In this
network, three lncRNAs were up-regulated (lncRNA1, lncRNA2 and
lncRNA6), whereas the other three were downregulated (lncRNA3,
lncRNA4 and lncRNA5). The network showed that a particular mRNA
could correlate with numerous lncRNAs, while a single lncRNA was
also able to correlate to various mRNAs, implying that an
inter-regulation of lncRNAs and mRNAs occurs in MDS.
 | Table I.Six DELs that are co-expressed with
the ABAT gene. |
Table I.
Six DELs that are co-expressed with
the ABAT gene.
| DELs | Name | Location | Strand | Regulation
type | PCC | P-value |
|---|
| lncRNA1 | None |
chr4:13067152-13347902 | Forward | Up | −0.968 | 0.018 |
| lncRNA2 |
Jh591181.2/kb663606.1 |
chr10:46972944-46982894 | Forward | Up | 0.963 | 0.036 |
| lncRNA3 |
Loc100131564/RP4-717I23.3 |
chr1:93796837-93806487 | Reverse | Down | 0.979 | 0.021 |
| lncRNA4 |
lncENST00000444102 |
chr6:167382710-167411729 | Reverse | Down | 0.988 | 0.011 |
| lncRNA5 |
Jh806582.2/g1383563.2 |
chr17:49425-59050 | Reverse | Down | 0.959 | 0.041 |
| lncRNA6 | None |
chr5:61931044-61948469 | Reverse | Up | −0.954 | 0.046 |
Gene enrichment and pathway of the
co-expression network
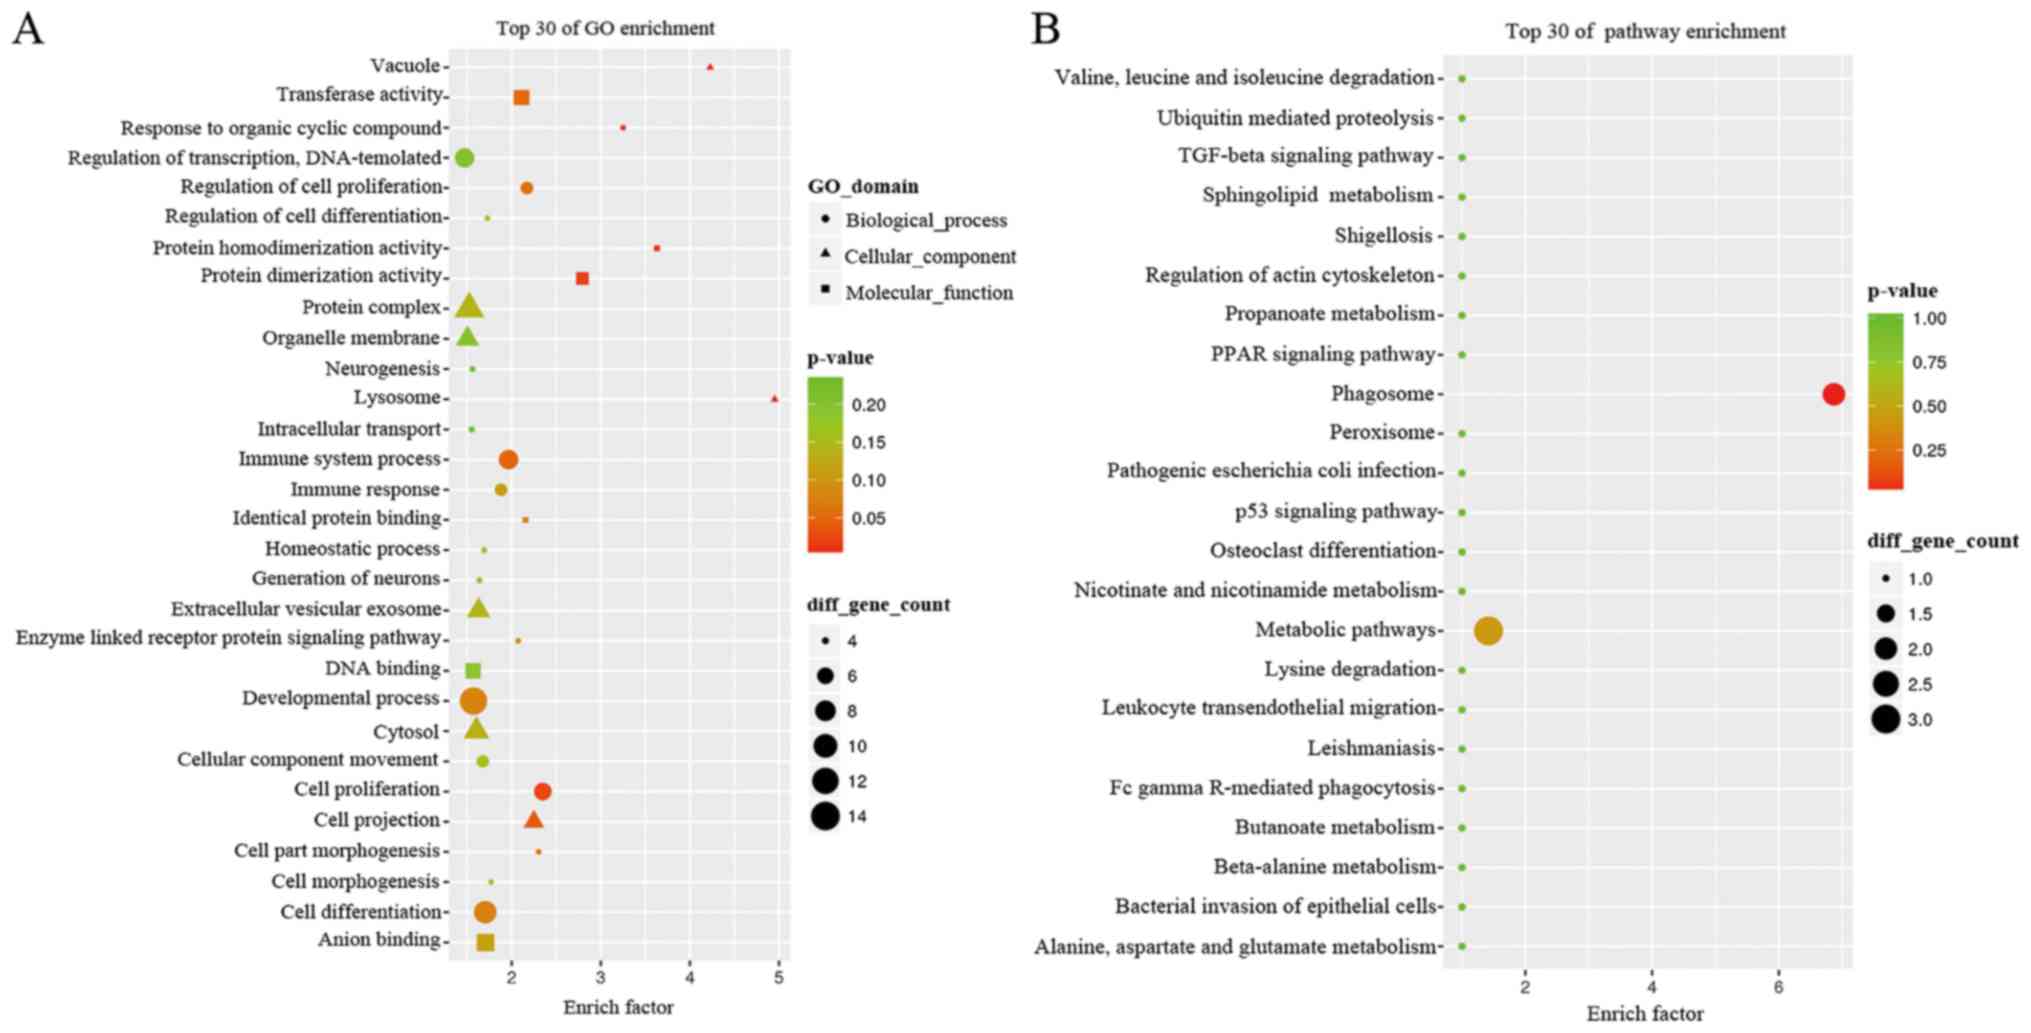
We next performed analyses using GO terms and the
KEGG pathways and networks, and found that the co-expression
network was mostly enriched in several biological processes, such
as cellular components and molecular functions. In particular, the
GO analysis revealed that the co-expression network mainly
participated in response to organic cyclic compounds, cell
proliferation, cell part morphogenesis, regulation of cell
proliferation, and enzyme-linked receptor protein signaling pathway
(Fig. 3A) for molecular functions of
protein homodimerization activity. The GO term analysis also
revealed that the co-expression network is localized in different
areas within cells, such as the lysosome, vacuole, cell projection,
and extracellular vesicular exosome. The KEGG data showed that the
co-expression network was involved in different pathways, such as
the phagosome and metabolic pathways (Fig. 3B). The differentially expressed gene
of neutrophil cytosolic factor 2 (NCF2) plays role in
neutrophil phagosome. In addition, the genes of serine
palmitoyltransferase long chain base subunit 2 (SPTLC2),
4-aminobutyrate aminotransferase (ABAT) and quinolinate
phosphoribosyltransferase (QPRT) were key metabolic enzymes
which play a role in metabolic pathways (https://www.ncbi.nlm.nih.gov/gene) (Table II).
| Table II.Data for the KEGG analysis of the
co-expression network. |
Table II.
Data for the KEGG analysis of the
co-expression network.
| Pathways | Genes | Enrich_factor | P-value |
|---|
| Phagosome | NCF2 | 6.87 | <0.05 |
| Metabolic
pathways |
SPTLC2/ABAT/QPRT | 1.42 | <0.05 |
Bioinformatic analysis of potential
lncENST00000444102 targeting genes
In this study, we revealed six lncRNAs and ranked
lncENST00000444102 as the most important lncRNA with the highest
correlation index related to the ABAT gene (Table I). lncENST00000444102 (lncRNA4) was
co-expressed with the genes, NCF2, SPTLC2, ABAT and
QPRT which all take part in the pathways (Table II and Fig.
2), thus we focused on lncENST00000444102 for further research.
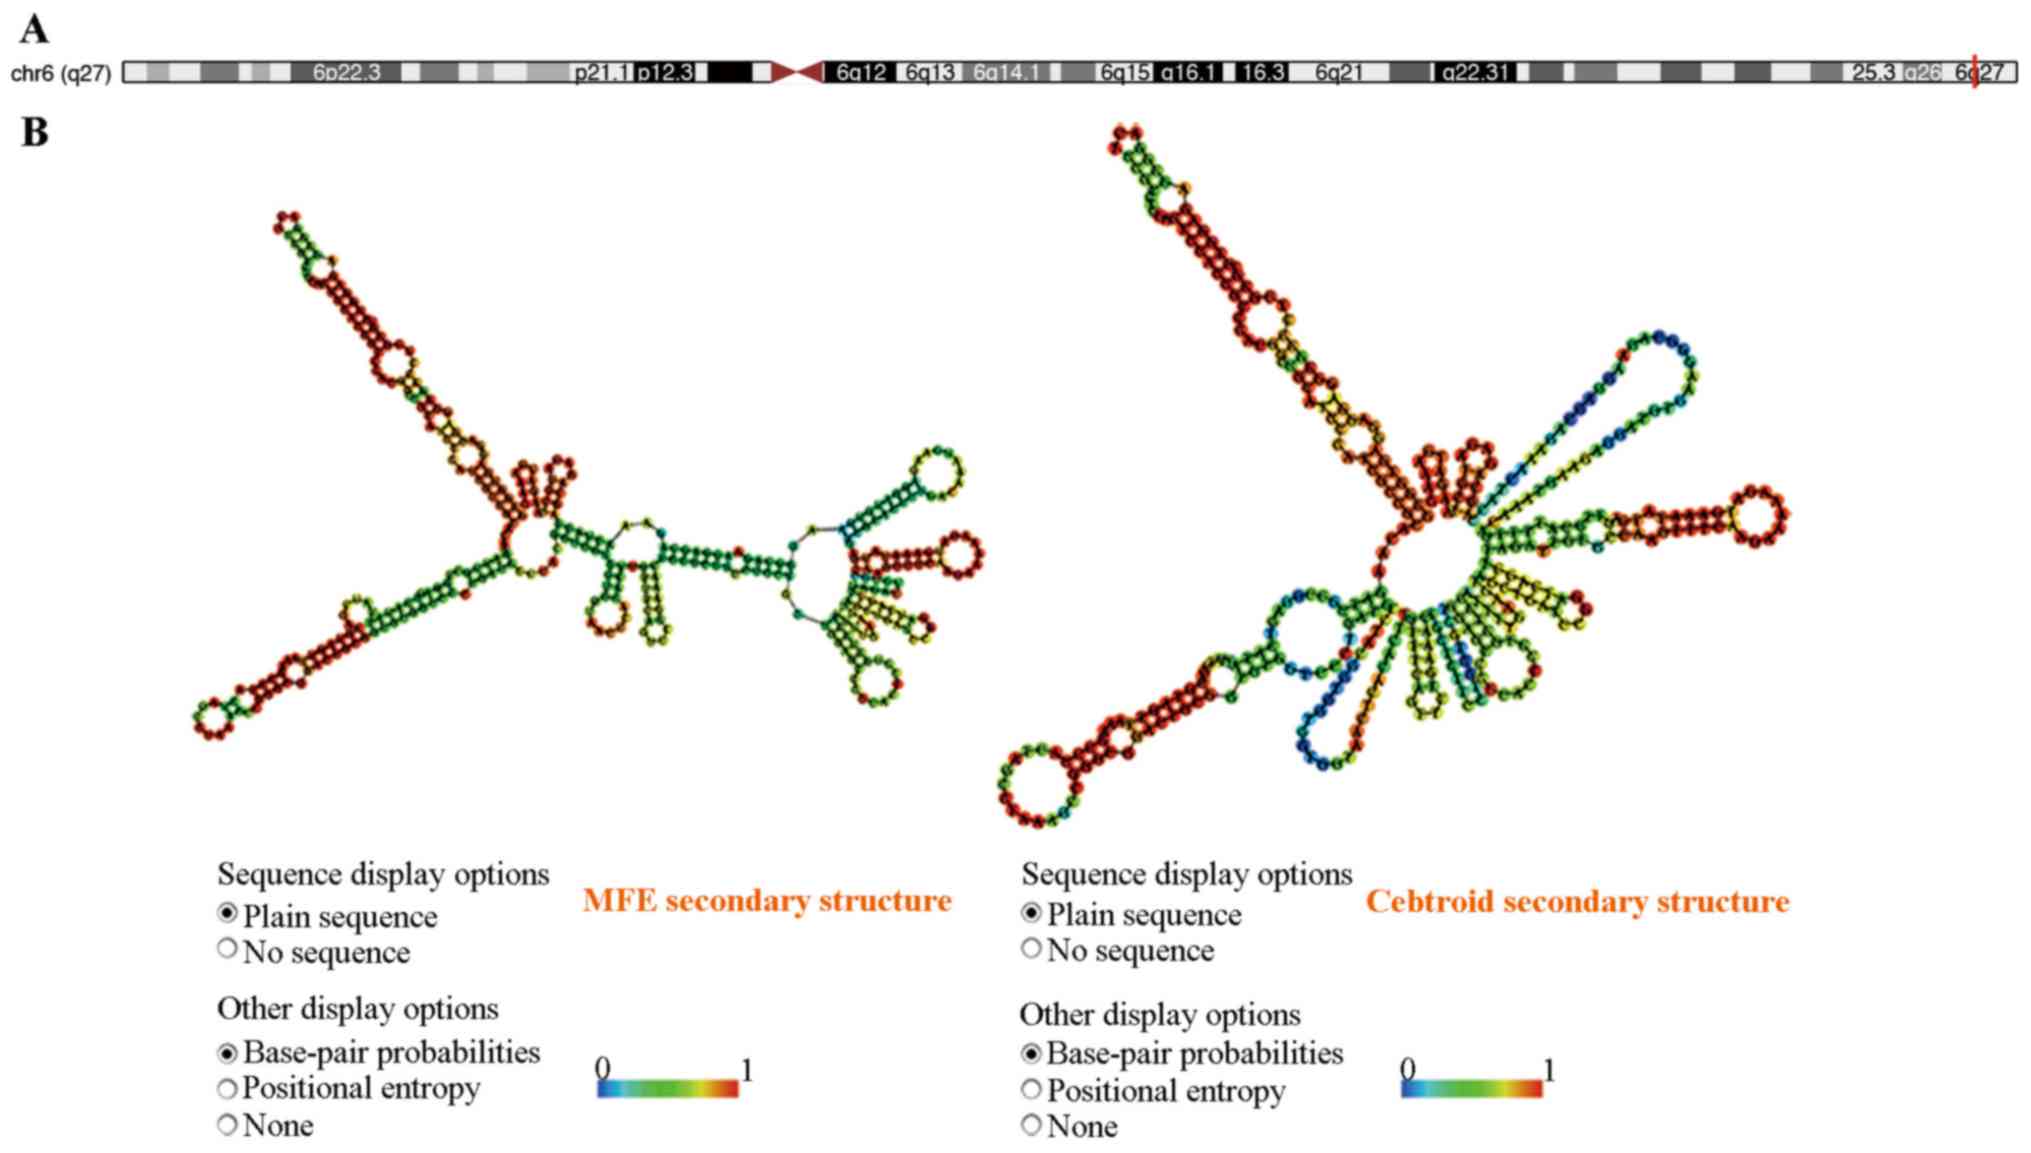
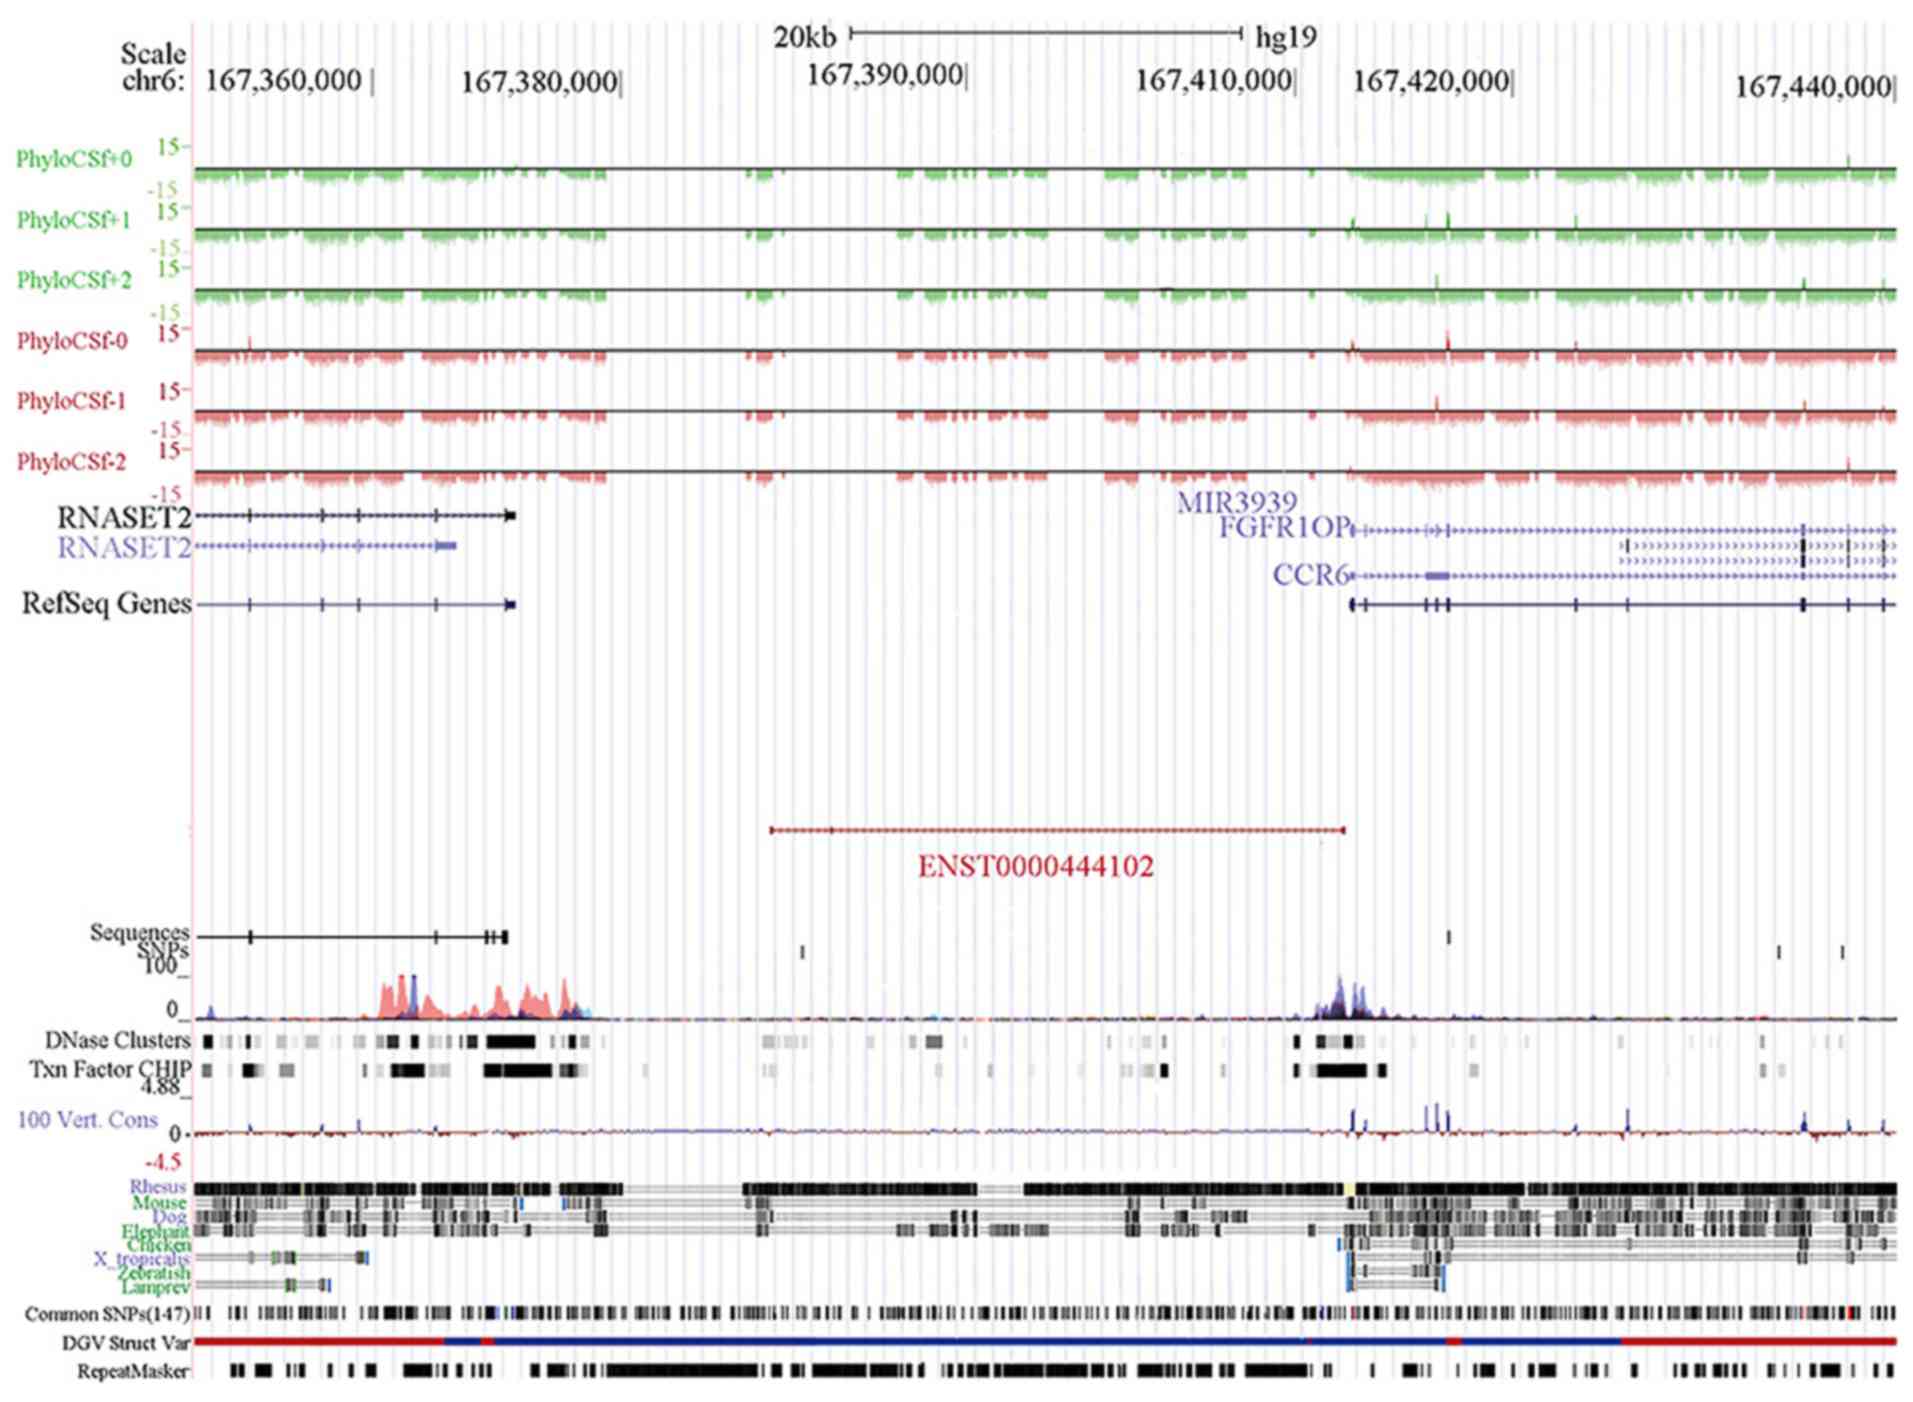
We then used tools in the UCSC database (http://genome.ucsc.edu) to re-annotate them and
focused on chr6: 167382710-167411729, reverse strand (Fig. 4A). This lncRNA (ENST00000444102, named
lncENST00000444102) was one of the most downregulated lncRNAs in
MDS, residing on chromosome 6 in the human genome as an antisense
RNA, consisting of three exons and spanning nearly 29 kilobases
(kb). The advanced structure of lncENST00000444102 was predicted by
RNAfold WebServer. We typed in the RNA sequence and chose the
options of fold algorithms, and the minimum free energy (MFE)
structure and the centroid secondary structure were obtained
(Fig. 4B) (32). PhyloCSF scores for lncENST00000444102
were viewed in the UCSC Genome Browser tracks. We found that the
scores were negative, with which we confirmed that the
lncENST00000444102 was a non-coding RNA (Fig. 5). The gene was located among chemokine
receptor 6 (CCR6), FGFR1 oncogene partner (FGFR1OP), and
ribonuclease T2 (RNASET2) (Fig. 5),
indicating that this particular lncRNA may be able to regulate the
transcription of these three genes in cells. To confirm this
hypothesis, we predicted the transcription factor binding sites
(TFBS) of lncENST00000444102 using tools listed in the TRANSFAC
database and found that lncENST00000444102 was able to target
chicken ovalbumin upstream promoter-transcription factor (COUP-TF),
which plays an important role in the regulation of organogenesis,
neurogenesis, metabolic homeostasis, and cellular differentiation
during embryonic development, and hepatocyte nuclear factor 4
(HNF-4), mainly playing a role in hepatic diseases (Table III).
| Table III.Transcription factor binding sites
(TFBS) of lncRNA-ENST00000444102. |
Table III.
Transcription factor binding sites
(TFBS) of lncRNA-ENST00000444102.
| Model | Factor | Strand | Start (bp) | End (bp) | Score |
|---|
| M00158 | COUP-TF, HNF-4 | − | 614 | 627 | 10.4 |
| M00923 | Adf-1 | + | 1,135 | 1155 | 9.4 |
| M00411 | HNF4α1 | + | 615 | 628 | 7.7 |
| M00034 | p53 | + | 909 | 928 | 7.5 |
| M00638 | HNF4α | − | 616 | 628 | 7.3 |
| M00401 | ABF1 | − | 942 | 968 | 7.2 |
| M00932 | Sp1 | − | 1,249 | 1,259 | 7.1 |
| M00932 | Sp1 | + | 1,388 | 1,398 | 7.1 |
| M00002 | E47 | − | 753 | 767 | 6.9 |
| M00034 | p53 | − | 909 | 928 | 6.9 |
| M00665 | Sp3 | + | 1,337 | 1,350 | 6.6 |
| M00761 | p53 decamer | + | 909 | 928 | 6.6 |
Expression of lncENST00000444102 and
ABAT in MDS patients and cell lines
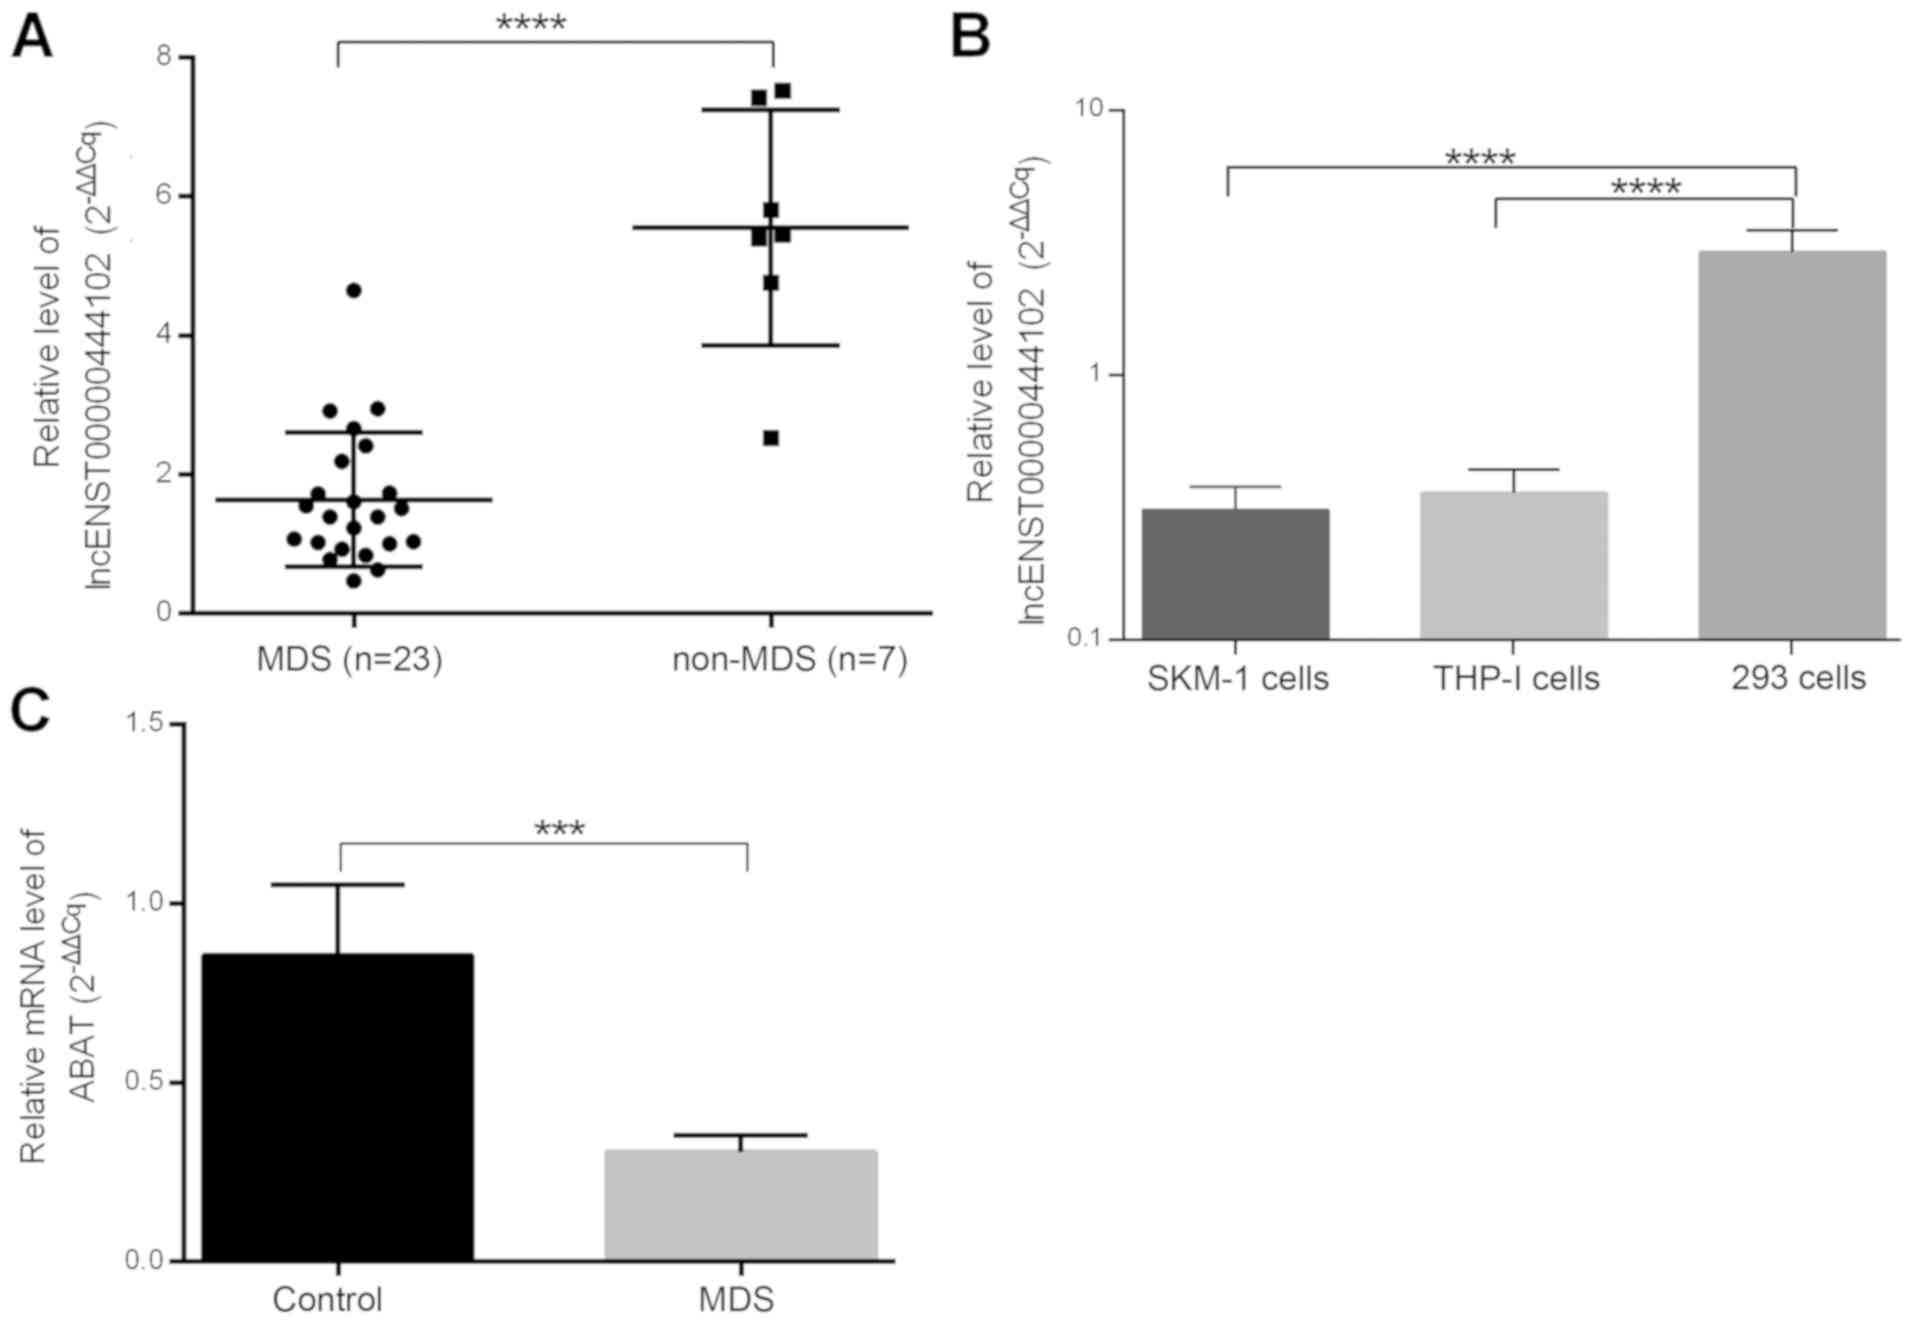
The alterations of these two molecules were next
confirmed in MDS bone marrow samples from 23 MDS patients, 7
non-hematological malignancies, and two cell lines (Fig. 6). lncENST00000444102 expression was
found to be significantly downregulated in MDS patients
(P<0.0001, Fig. 6A) when compared
to non-MDS cases as well as in the SKM-1 and THP-1 cell lines
(P<0.0001, Fig. 6B) when compared
to HEK-293 cells. ABAT expression was also downregulated in
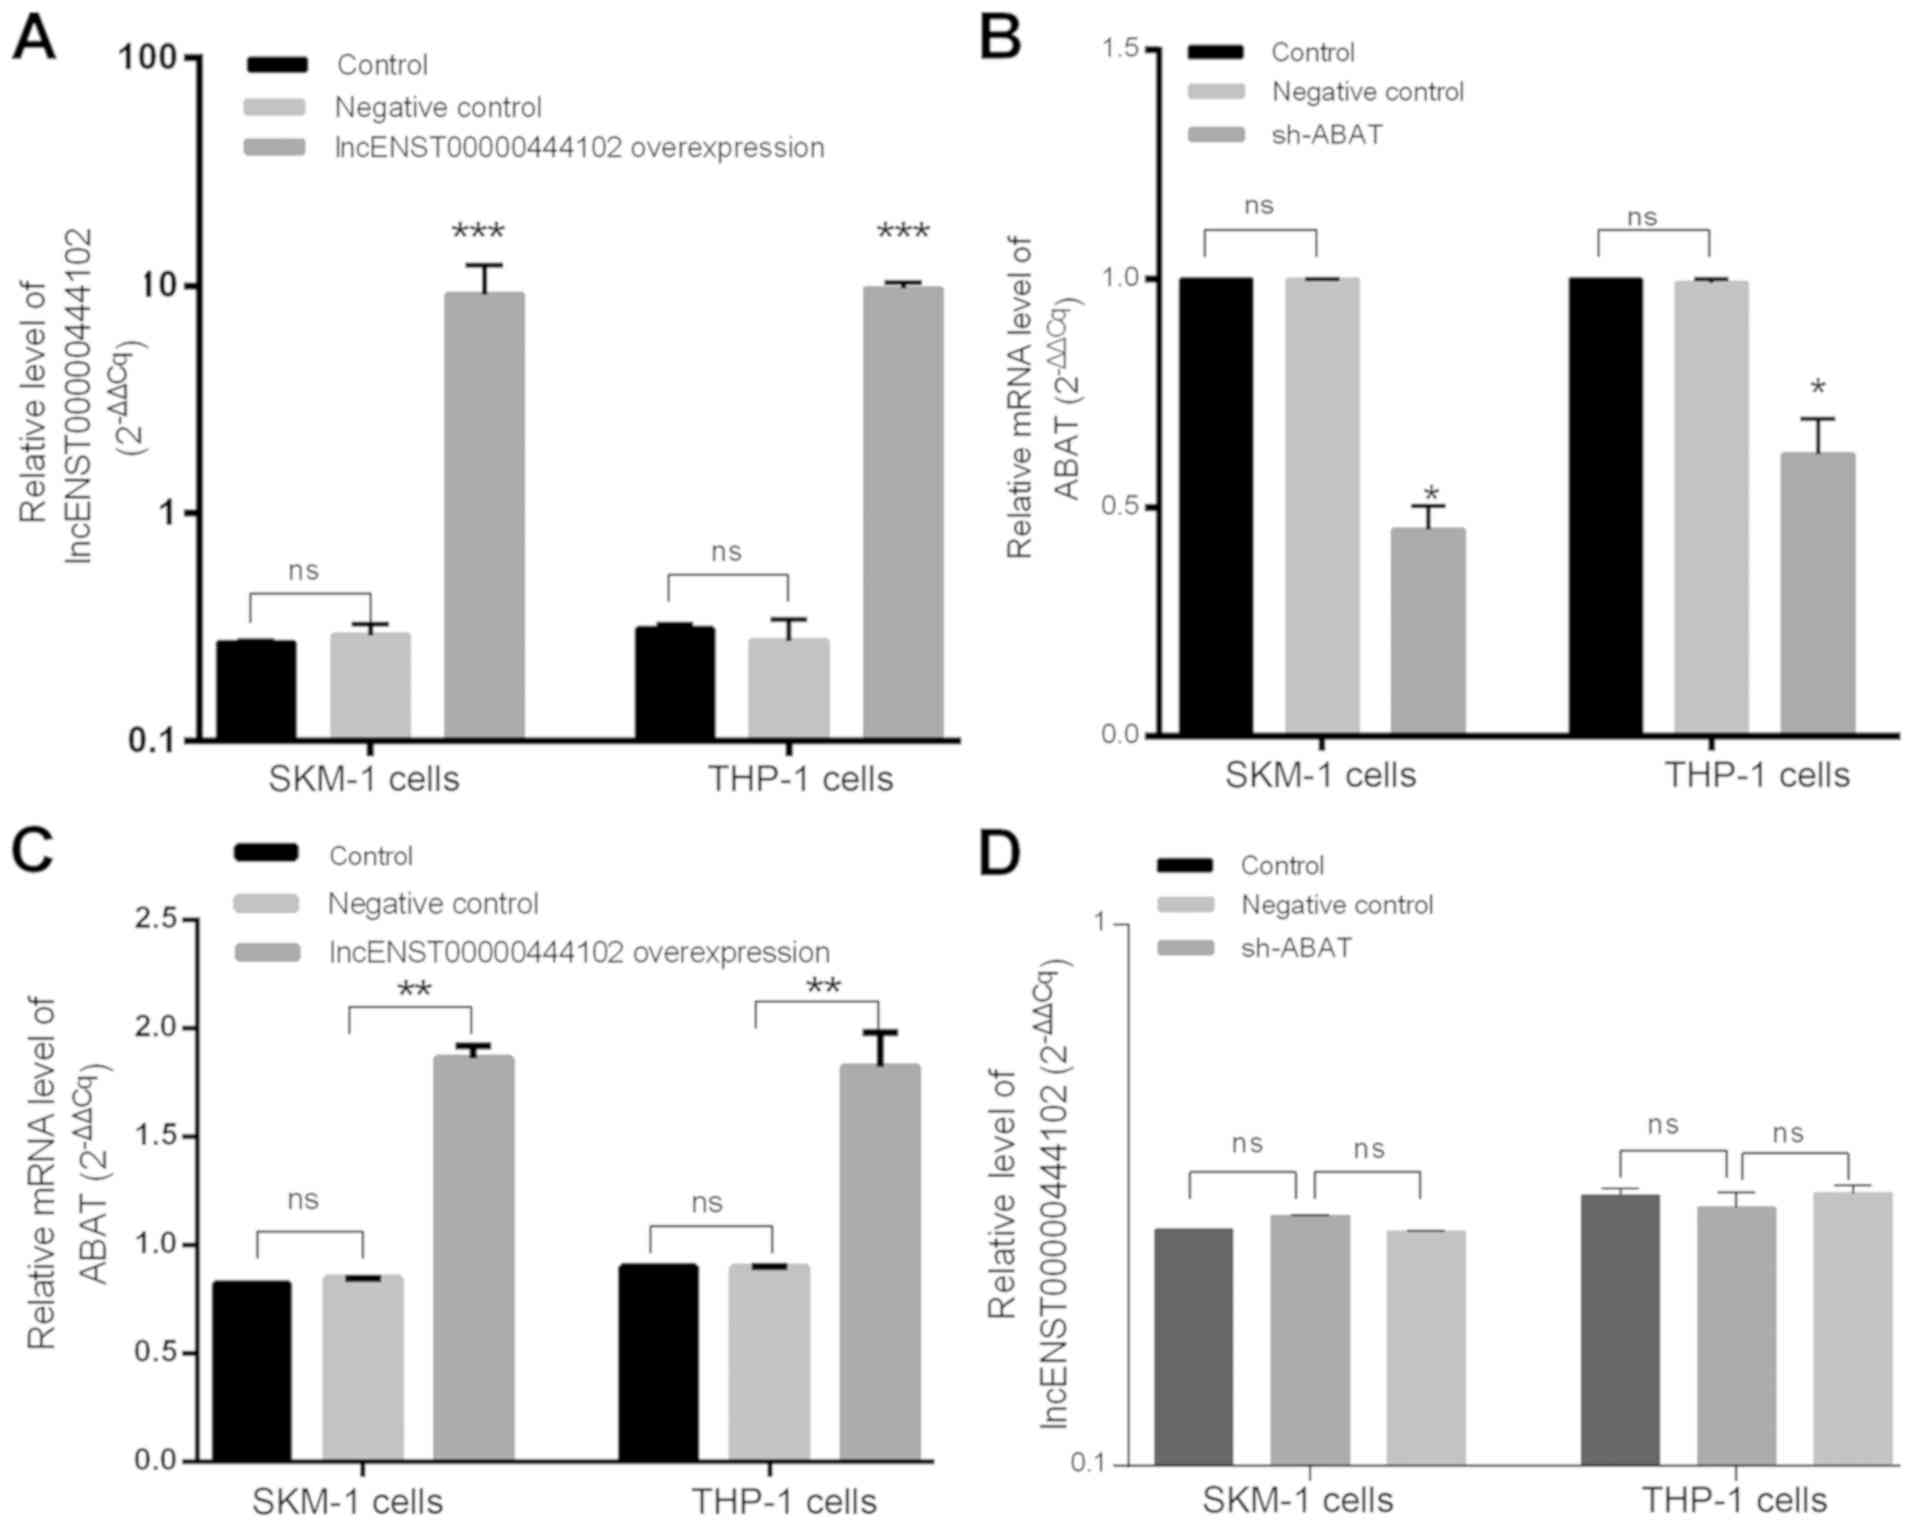
the bone marrow from MDS cases (P<0.001, Fig. 6C). We then overexpressed
lncENST00000444102 and knocked down ABAT expression in SKM-1 and
THP-1 cells (Fig. 7A and B). We found
that stable overexpression of lncENST00000444102 induced
ABAT expression by 2-fold in the SKM-1 and THP-1 cell lines
(P<0.01, Fig. 7C). However, when
ABAT expression was stably knocked down in the SKM-1 and
THP-1 cell lines, the level of lncENST00000444102 was not
significantly (ns) altered (P>0.05, Fig. 7D).
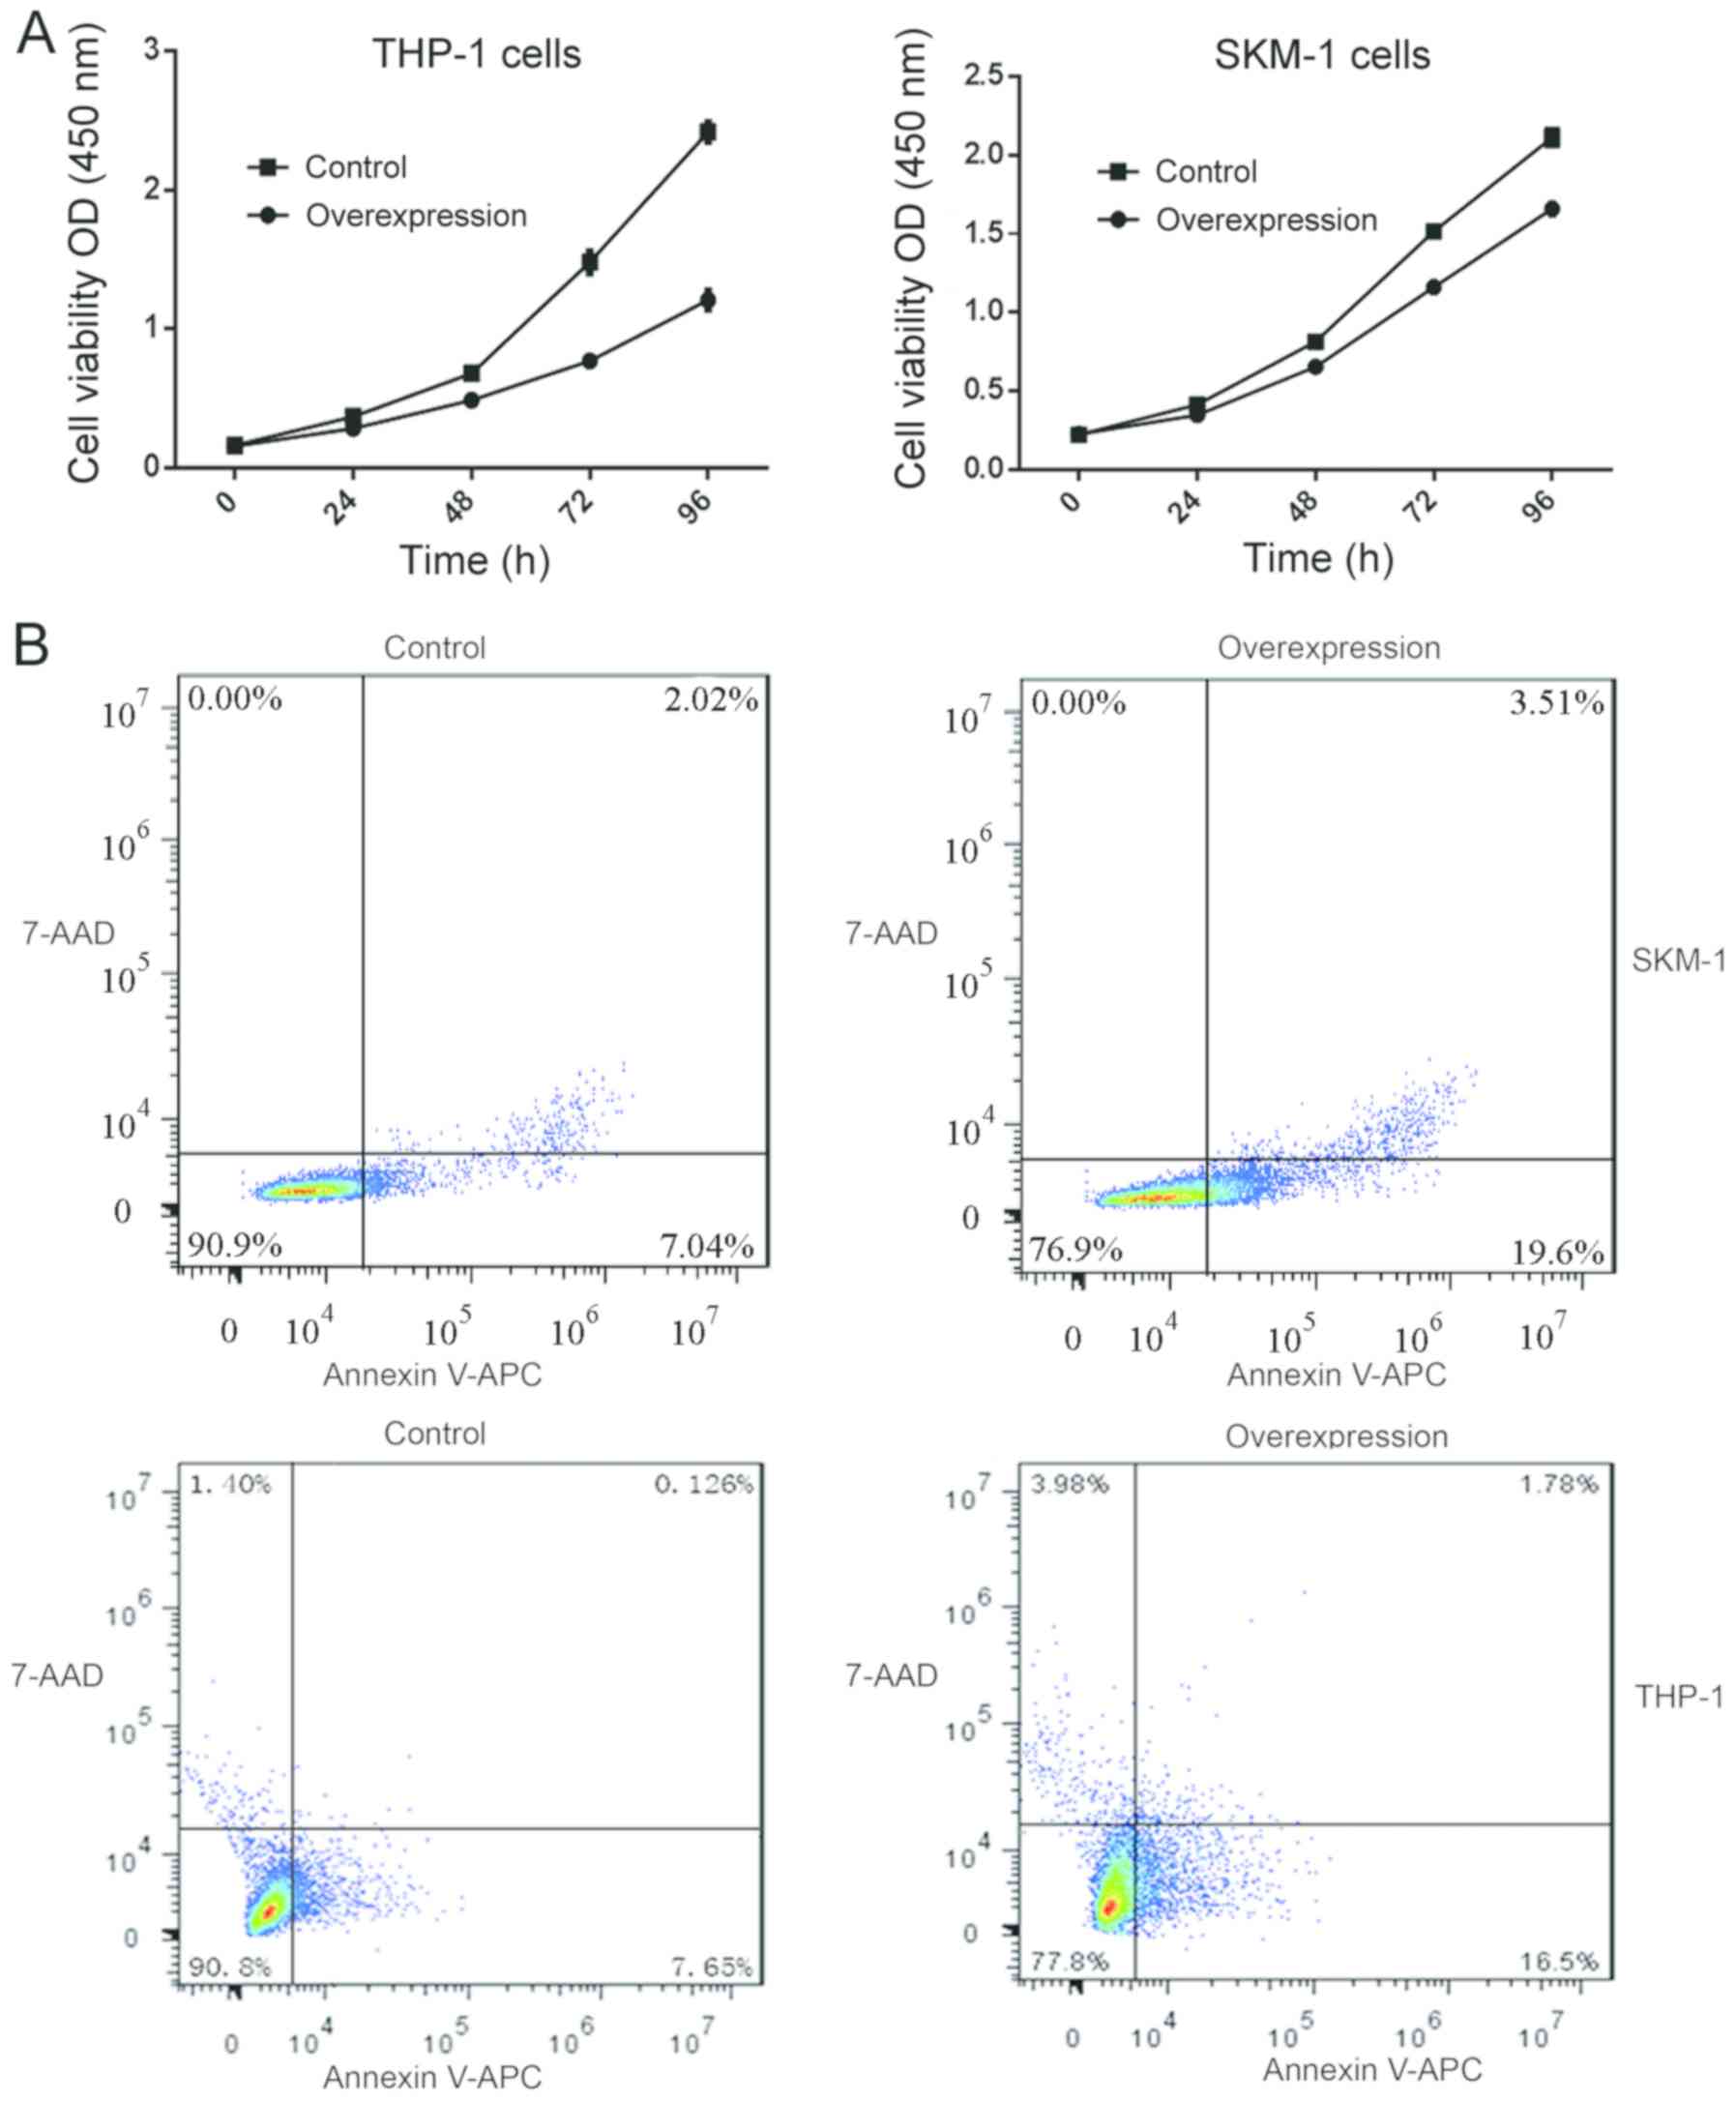
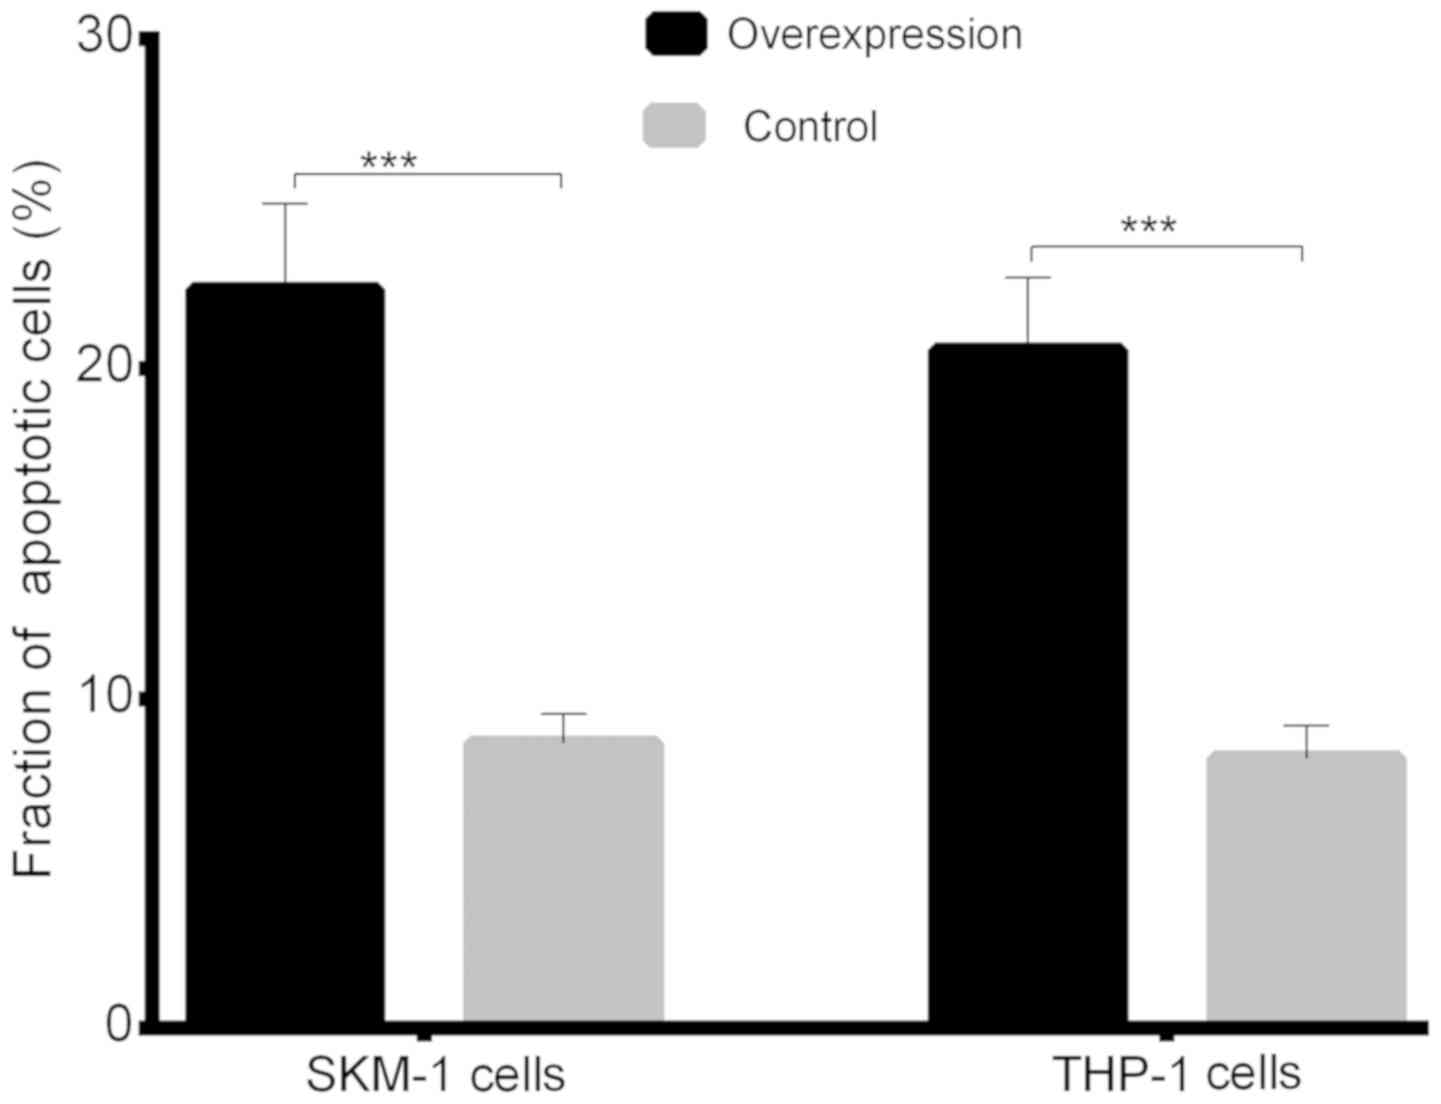
Reduced cell viability and increase in
apoptosis following lncENST00000444102 overexpression in MDS
cells
The cell viability CCK-8 assay showed that after 24
h in culture, the viability of SKM-1 and THP-1 cells with stable
lncENST00000444102 overexpression started to decrease when compared
with that of the control (P<0.05, Fig.
8A). The fraction of apoptotic cells was 22.41±2.596 in the
lncENST00000444102-overexpressing SKM-1 cells, and 8.650±0.889 in
the negative control; the fraction of apoptotic cells was
20.58±2.190 in the lncENST00000444102-overexpressing THP-1 cells
and 8.192±0.997 in the negative control group (P<0.001, Fig. 8B). The flow cytometric apoptosis assay
revealed that lncENST00000444102 overexpression promoted tumor
cells to undergo apoptosis compared to control cells (P<0.001,
Fig. 9). These data revealed that
lncENST00000444102 overexpression reduced MDS cell viability by
induction of MDS cell apoptosis.
Discussion
Myelodysplastic syndromes (MDS) are a group of
neoplastic bone marrow disorders characterized by abnormal blood
cell morphology and can progress to acute myeloid leukemia (AML).
In the present study, DELs and DEMs were profiled in MDS. Since our
previous study demonstrated that expression of ABAT was
reduced in MDS samples (8), we
constructed an ABAT-DEL-DEM co-expression network in order
to assess their role in MDS development. We found numerous DELs and
DEMs in MDS samples compared with the controls. Our
ABAT-DEL-DEM co-expression network identified six DELs that
were co-expressed with ABAT in MDS, and function to regulate
cell proliferation and morphogenesis, cell proliferation, and the
enzyme-linked receptor protein signaling pathway. Furthermore, the
expression of lncENST00000444102 and ABAT was significantly
downregulated in MDS bone marrow samples and cell lines. In
addition, lncENST00000444102 overexpression reduced tumor cell
viability and increased apoptosis in MDS cell lines. This
preliminary study links the ABAT-DEL-DEM co-expression
network in MDS development. Future studies will further investigate
how this network regulates MDS progression.
Indeed, in recent years since completion of the
human genome project, research on the functional genome has become
a popular research topic. Moreover, utilization of microarrays to
profile DELs and DEMs in a disease vs. control is able to identify
the causal relationship of altered gene expression; however, these
data need to be i) validated in an independent cohort of samples;
ii) functionally analyzed in cell lines, or bioinformatically; and
iii) analyzed to identify a network or pathway. In the present
study, we generated the transcriptomic data from MDS and
hyperthyroid samples to construct the network consisting of
ABAT, lncRNAs, and mRNAs to determine their role in MDS
development. We used a multi-step approach to identify
lncRNA-regulated mRNAs and pathways in MDS. We first generated DEL
and DEM data using the Agilent human genome-wide gene expression
60K BeadChips in four cases of MDS patients vs. four cases of
age-matched individuals with hypersplenism. We then identified 2705
DELs and 543 DEMs in MDS bone marrow samples vs. the controls using
PCC analysis and thereafter, we used these data to construct the
lncRNA and mRNA co-expression network (which contained six DELs
related to ABAT and 135 co-expressed mRNAs). The network
speculated that a particular mRNA could regulate a number of the
targeting lncRNAs, while a single lncRNA can also regulate various
mRNAs in MDS development. Furthermore, it is necessary to
understand the potential functions of the lncRNA and mRNA
co-expression network in MDS. Therefore, we performed the GO and
KEGG gene pathway analyses. The gene enrichment analysis suggested
that the co-expression network functions to regulate cell
proliferation and morphogenesis, cell proliferation, and
enzyme-linked receptor protein signaling pathways. The KEGG pathway
analysis revealed that the co-expressed network was mainly involved
in phagosome and metabolic pathways. However, further studies are
needed to confirm these predictions.
As known gene profiling generates an enormous amount
of data and it is impossible to handle all of the data in a single
study. Thus, in the present study, we chose to focus on
lncENST00000444102 and ABAT in MDS by first assessing their
expression levels in MDS samples and cell lines, and then by
overexpressing this particular lncRNA and knocking down ABAT
expression in MDS cell lines. We found that their expression was
both downregulated in MDS samples and cell lines.
lncENST00000444102 overexpression upregulated ABAT expression but
reduced tumor cell viability by inducing apoptosis in vitro.
However, knockdown of ABAT expression had no effect on the
expression of lncENST00000444102 in MDS cell lines, indicating that
lncENST00000444102 should indirectly regulate ABAT expression in
MDS cells, although our present study did not identify how
lncENST00000444102 affects ABAT expression. Our
bioinformatic analysis did reveal various lncRNA targeting genes
and our future studies will investigate these genes that may
potentially regulate ABAT expression.
The present study profiled DELs and DEMs in MDS bone
marrow samples vs. controls and our data analyses were preliminary.
We also did not compare the DELs and DEMs to findings in the
literature to confirm whether they are indeed altered in MDS. The
expression level of lncRNA-targeting genes was not confirmed in MDS
using RT-qPCR or their interactions in cells using a luciferase
reporter assay. Thus, there are many limitations in the present
study, e.g. the small sample size as one of the limitations of the
study. If we had included more cases, particularly lower risk
cases, we would have obtained different results. In this research,
we focused on the differences between MDS and non-MDS, and in
future research we need to explore the differences between low-risk
and hight-risk MDS. We also need to explore the differences between
MDS and AML, CMML (chronic myelomonocytic leukemia) and MDS. A
growing number of in vivo lncRNA studies have reported
discrepancies with phenotypes observed in cultured cell lines.
Thus, we initially validated the function of long non-coding RNAs
in vitro and then we will try to illuminate the
discrepancies in vivo in subsequent research.
lncRNAs are involved in a variety of biological
processes and regulate gene expression in cis or
trans through diverse mechanisms. We found that
lncENST00000444102 plays a role in MDS development, but how it
functions and what changes in gene expression will occur are issues
that must be explored and addressed in subsequent research.
Moreover, further studies are needed to investigate how this
network regulates MDS progression and to assess the molecular
biologic role of lncENST00000444102 in MDS. In conclusion, our
present study provides novel insight to better understand MDS
development and a methodology for future data analysis was hereby
proposed.
Supplementary Material
Supporting Data
Acknowledgements
The authors would like to thank all patients and
physicians who participated in this study.
Funding
The present study was supported in part by grants
from the Science and Technology Commission of Shanghai Municipality
(grant no. 17ZR1403600) and from the Three-Year Action Plan on
Public Health, Phase IV, Shanghai, China (grant no.
15GWZK0801).
Availability of data and materials
The datasets used during the present study are
available from the corresponding author upon reasonable
request.
Authors' contributions
YC and GZ performed the experiments, analyzed the
data and wrote the manuscript. YC and GZ contributed to sample
collection. NL and ZL performed part of the research and collected
the data. XW and JG designed the research study and contributed to
the drafting of manuscript. All authors read and approved the final
manuscript and agree to be accountable for all aspects of the
research in ensuring that the accuracy or integrity of any part of
the work are appropriately investigated and resolved.
Ethics approval and consent to
participate
The present study was approved by the Ethics
Committee of Huashan Hospital, School of Medicine, Fudan
University. All participants provided a written informed consent
form before being enrolled into this study.
Patient consent for publication
Not applicable.
Competing interests
The authors declared that the authors have no
competing interests.
References
|
1
|
Germing U, Kobbe G, Haas R and Gattermann
N: Myelodysplastic syndromes: Diagnosis, prognosis, and treatment.
Dtsch Arztebl Int. 110:783–790. 2013.PubMed/NCBI
|
|
2
|
Lindsley RC and Ebert BL: Molecular
pathophysiology of myelodysplastic syndromes. Annu Rev Pathol.
8:21–47. 2013. View Article : Google Scholar : PubMed/NCBI
|
|
3
|
Issa JP: The myelodysplastic syndrome as a
prototypical epigenetic disease. Blood. 121:3811–3817. 2013.
View Article : Google Scholar : PubMed/NCBI
|
|
4
|
Glenthøj A, Ørskov AD, Hansen JW, Hadrup
SR, O'Connell C and Grønbæk K: Immune mechanisms in myelodysplastic
syndrome. Int J Mol Sci. 17:E9442016. View Article : Google Scholar : PubMed/NCBI
|
|
5
|
Varney ME, Melgar K, Niederkorn M, Smith
M, Barreyro L and Starczynowski DT: Deconstructing innate immune
signaling in myelodysplastic syndromes. Exp Hematol. 43:587–598.
2015. View Article : Google Scholar : PubMed/NCBI
|
|
6
|
Gañán-Gómez I, Wei Y, Starczynowski DT,
Colla S, Yang H, Cabrero-Calvo M, Bohannan ZS, Verma A, Steidl U
and Garcia-Manero G: Deregulation of innate immune and inflammatory
signaling in myelodysplastic syndromes. Leukemia. 29:1458–1469.
2015. View Article : Google Scholar : PubMed/NCBI
|
|
7
|
Jiang Y, Dunbar A, Gondek LP, Mohan S,
Rataul M, O'Keefe C, Sekeres M, Saunthararajah Y and Maciejewski
JP: Aberrant DNA methylation is a dominant mechanism in MDS
progression to AML. Blood. 113:1315–1325. 2009. View Article : Google Scholar : PubMed/NCBI
|
|
8
|
Zhao X, Yang F, Li S, Liu M, Ying S, Jia X
and Wang X: CpG island methylator phenotype of myelodysplastic
syndrome identified through genome-wide profiling of DNA
methylation and gene expression. Br J Haematol. 165:649–658. 2014.
View Article : Google Scholar : PubMed/NCBI
|
|
9
|
Zhao G, Li N, Li S, Wu W, Wang X and Gu J:
The high methylation of 4-aminobutyrate aminotransferase gene
predicts a poor prognosis in patients with myelodysplastic
syndrome. Int J Oncol. 54:491–504. 2019.PubMed/NCBI
|
|
10
|
Medina-Kauwe LK, Tobin AJ, De Meirleir L,
Jaeken J, Jakobs C, Nyhan WL and Gibson KM: 4-Aminobutyrate
aminotransferase (GABA-transaminase) deficiency. J Inherit Metab
Dis. 22:414–427. 1999. View Article : Google Scholar : PubMed/NCBI
|
|
11
|
Jaeken J, Casaer P, de Cock P, Corbeel L,
Eeckels R, Eggermont E, Schechter PJ and Brucher JM:
Gamma-aminobutyric acid-transaminase deficiency: A newly recognized
inborn error of neurotransmitter metabolism. Neuropediatrics.
15:165–169. 1084. View Article : Google Scholar
|
|
12
|
Wegerer M, Adena S, Pfennig A, Czamara D,
Sailer U, Bettecken T, Müller-Myhsok B, Modell S and Ising M:
Variants within the GABA transaminase (ABAT) gene region are
associated with somatosensory evoked EEG potentials in families at
high risk for affective disorders. Psychol Med. 43:1207–1217. 2013.
View Article : Google Scholar : PubMed/NCBI
|
|
13
|
Maguire SE, Rhoades S, Chen WF, Sengupta
A, Yue Z, Lim JC, Mitchell CH, Weljie AM and Sehgal A: Independent
effects of γ-Aminobutyric acid transaminase (GABAT) on metabolic
and sleep homeostasis. J Biol Chem. 290:20407–20416. 2015.
View Article : Google Scholar : PubMed/NCBI
|
|
14
|
Barnby G, Abbott A, Sykes N, Morris A,
Weeks DE, Mott R, Lamb J, Bailey AJ and Monaco AP; International
Molecular Genetics Study of Autism Consortium, : Candidate-gene
screening and association analysis at the autism-susceptibility
locus on chromosome 16p: Evidence of association at GRIN2A and
ABAT. Am J Hum Genet. 76:950–966. 2005. View Article : Google Scholar : PubMed/NCBI
|
|
15
|
Jirholt J, Asling B, Hammond P, Davidson
G, Knutsson M, Walentinsson A, Jensen JM, Lehmann A, Agreus L and
Lagerström-Fermer M: 4-Aminobutyrate aminotransferase (ABAT):
Genetic and pharmacological evidence for an involvement in gastro
esophageal reflux disease. PLos One. 6:E190952011. View Article : Google Scholar : PubMed/NCBI
|
|
16
|
Budczies J, Brockmöller SF, Müller BM,
Barupal DK, Richter-Ehrenstein C, Kleine-Tebbe A, Griffin JL,
Orešič M, Dietel M, Denkert C and Fiehn O: Comparative metabolomics
of estrogen receptor positive and estrogen receptor negative breast
cancer: Alterations in glutamine and beta-alanine metabolism. J
Proteomics. 94:279–288. 2013. View Article : Google Scholar : PubMed/NCBI
|
|
17
|
Jansen MP, Sas L, Sieuwerts AM, Van
Cauwenberghe C, Ramirez-Ardila D, Look M, Ruigrok-Ritstier K,
Finetti P, Bertucci F, Timmermans MM, et al: Decreased expression
of ABAT and STC2 hallmarks ER-positive inflammatory breast cancer
and endocrine therapy resistance in advanced disease. Mol Oncol.
9:1218–1233. 2015. View Article : Google Scholar : PubMed/NCBI
|
|
18
|
Ma L, Bajic VB and Zhang Z: On the
classification of long non-coding RNAs. RNA Biol. 10:925–933. 2013.
View Article : Google Scholar : PubMed/NCBI
|
|
19
|
Kapranov P, Cheng J, Dike S, Nix DA,
Duttagupta R, Willingham AT, Stadler PF, Hertel J, Hackermuller J,
Hofacker IL, et al: RNA maps reveal new RNA classes and a possible
function for pervasive transcription. Science. 316:1484–1488. 2007.
View Article : Google Scholar : PubMed/NCBI
|
|
20
|
Rodríguez-Malavé NI and Rao DS: Long
noncoding RNAs in hematopoietic malignancies. Brief Funct Genomics.
15:227–238. 2016. View Article : Google Scholar : PubMed/NCBI
|
|
21
|
Benetatos L, Hatzimichael E, Dasoula A,
Dranitsaris G, Tsiara S, Syrrou M, Georgiou I and Bourantas KL: CpG
methylation analysis of the MEG3 and SNRPN imprinted genes in acute
myeloid leukemia and myelodysplastic syndromes. Leuk Res.
34:148–153. 2010. View Article : Google Scholar : PubMed/NCBI
|
|
22
|
Vardiman JW, Thiele J, Arber DA, Brunning
RD, Borowitz MJ, Porwit A, Harris NL, Le Beau MM,
Hellstrom-Lindberg E, Tefferi A and Bloomfield CD: The 2008
revision of the World Health Organization (WHO) classification of
myeloid neoplasms and acute leukemia: Rationale and important
changes. Blood. 114:937–951. 2009. View Article : Google Scholar : PubMed/NCBI
|
|
23
|
Livak KJ and Schmittgen TD: Analysis of
relative gene expression data using real-time quantitative PCR and
the 2(-Delta Delta C (T)) method. Methods. 25:402–408. 2001.
View Article : Google Scholar : PubMed/NCBI
|
|
24
|
Irizarry RA, Hobbs B, Collin F,
Beazer-Barclay YD, Antonellis KJ, Scherf U and Speed TP:
Exploration, normalization, and summaries of high density
oligonucleotide array probe level data. Biostatistics. 4:249–264.
2003. View Article : Google Scholar : PubMed/NCBI
|
|
25
|
Liao Q, Liu C, Yuan X, Kang S, Miao R,
Xiao H, Zhao G, Luo H, Bu D, Zhao H, et al: Large-scale prediction
of long non-coding RNA functions in a coding-non-coding gene
co-expression network. Nucleic Acids Res. 39:3864–3878. 2011.
View Article : Google Scholar : PubMed/NCBI
|
|
26
|
Huang Da W, Sherman BT and Lempicki RA:
Systematic and integrative analysis of large gene lists using DAVID
bioinformatics resources. Nat Protoc. 4:44–57. 2008. View Article : Google Scholar
|
|
27
|
Huang Da W, Sherman BT and Lempicki RA:
Bioinformatics enrichment tools: Paths toward the comprehensive
functional analysis of large gene lists. Nucleic Acids Res.
37:1–13. 2009. View Article : Google Scholar : PubMed/NCBI
|
|
28
|
Luo W and Brouwer C: Pathview: An
R/Bioconductor package for pathway-based data integration and
visualization. Bioinformatics. 29:1830–1831. 2013. View Article : Google Scholar : PubMed/NCBI
|
|
29
|
Lin MF, Jungreis I and Kellis M: PhyloCSF:
A comparative genomics method to distinguish protein coding and
non-coding regions. Bioinformatics. 27:i275–i282. 2011. View Article : Google Scholar : PubMed/NCBI
|
|
30
|
Wingender E, Chen X, Hehl R, Karas H,
Liebich I, Matys V, Meinhardt T, Prüss M, Reuter I and Schacherer
F: TRANSFAC: An integrated system for gene expression regulation.
Nucleic Acids Res. 28:316–319. 2000. View Article : Google Scholar : PubMed/NCBI
|
|
31
|
Geiling B, Vandal G, Posner AR, de Bruyns
A, Dutchak KL, Garnett S and Dankort D: A modular lentiviral and
retroviral construction system to rapidly generate vectors for gene
expression and gene knockdown in vitro and in vivo. PLos One.
8:e762792013. View Article : Google Scholar : PubMed/NCBI
|
|
32
|
Will S and Jabbari H: Sparse RNA folding
revisited: Space-efficient minimum free energy structure
prediction. Algorithms Mol Biol. 11:72016. View Article : Google Scholar : PubMed/NCBI
|