Introduction
Gliomas are primary brain tumors with high
prevalence and malignancy in adults (1). Due to the high invasiveness and relapse
rate, selecting a therapeutic strategy to improve the poor
prognosis of malignant gliomas is a worldwide challenge (2,3). For
glioblastoma (GBM), the median survival time is 14.6 months despite
the standard therapeutic strategy (4). The mechanisms of tumorigenesis and
malignant transformation remain unknown. Previous studies have
focused on aberrantly expressed or mutated genes to provide a more
comprehensive understanding of tumor development and potential
therapeutic targets (5–7).
Vesicle amine transport protein 1 (VAT1), a 41-kDa
integral membrane protein, is embedded in synaptic vesicles and
serves to transfer monoamines, including norepinephrine,
epinephrine and dopamine (DA), between the cytosol and synaptic
vesicles (8,9). VAT1 was first described in the electric
organ of the Pacific electric ray Torpedo carlifonica
(10). The position of the VAT1 gene
was directly adjacent to BRCA1, which was associated with inherited
predisposition to breast and ovarian cancer (6,11). It has
been reported that VAT1 expression is not only restricted to
neuronal tissues but is also present in normal epithelial tissues.
The expression of VAT1 can be influenced by the extracellular
calcium concentration (12–14). The association between VAT1 expression
and diseases has been studied previously. VAT1 was regarded as a
pathogenic factor in benign prostatic hyperplasia and was
associated with cell proliferation (15). VAT1 was also regarded as a potential
oncogene in gastric cancer (16). In
addition, Mertsch et al observed that VAT1 was overexpressed
in GBM and was functionally involved in glioma cell migration
(17).
The present study aimed to detect the expression
level of VAT1 in patients with GBM through RNA sequencing (RNAseq)
data from public databases, and to reveal the potential relevance
of VAT1 expression in tumor malignancy. Applying Gene Ontology (GO)
analysis and experimental techniques, the present study further
explored the biological function of VAT1 as a potential marker of
GBM.
Materials and methods
Sample and data collection
RNAseq data of the Chinese Glioma Genome Atlas
(CGGA) and The Cancer Genome Atlas (TCGA) were obtained from public
available websites. From the CGGA dataset (http://www.cgga.org.cn/), 120 transcriptome data of
patients diagnosed with GBM were included in the study, which were
detected by the Illumina HiSeq platform (Illumina, Inc., San Diego,
CA, USA) and had complete long-term follow-up information. From
TCGA dataset (https://tcgadata.nci.nih.gov/tcga/tcgaDownload.jsp),
the public transcriptome data of 131 patients with GBM were also
acquired to serve as the validation group. Normal brain tissues and
glioma tissues were obtained from surgery at Tiantan Hospital
(Beijing, China). We collected 6 paired tissues and our study
included 4 males and 2 females. The present study was approved by
the Ethics Committee of Capital Medical University (Beijing,
China). Written informed consent was obtained from all individual
participants included in the study.
Cell culture
The human GBM cell line LN229 was purchased from
Shanghai Bioleaf Biotech Co., Ltd. (Shanghai, China). The cells
were cultured using Dulbecco's modified Eagle's medium (DMEM)
containing 10% fetal bovine serum (FBS) with 5% CO2 and
saturated humidity at 37°C. The cells were passaged at a proportion
of 1:3 when cell density reached 80%. The 293T cell line was
purchased from the Shanghai Institute of Biochemistry and Cell
Biology, Chinese Academy of Sciences (Shanghai, China).
Reverse transcription-quantitative
polymerase chain reaction (RT-qPCR)
Total RNA was isolated from cells and glioma tissues
using TRIzol reagent (Aidalb Biotechnologies Co., Ltd., Beijing,
China) following the manufacturer's instructions. RNA concentration
was detected by NanoDrop (NanoDrop Technologies; Thermo Fisher
Scientific, Inc., Wilmington, DE, USA). The RNA quality was
estimated by determining the optical density (OD)260/OD280 ratio;
values between 1.8 and 2.1 were considered to meet the experimental
requirements. Total RNA (1 µg) was transcribed into complementary
DNA (cDNA) applying HiScript RT Reagent kit (Vazvme Ltd., Nanjing,
China) according to the manufacturer's instructions. Upon the
synthesis of cDNA, 1 µl reaction volume was utilized for RT-qPCR
detection on an ABI 7900 or Viia7 Fast Real-Time PCR system
(Applied Biosystems; Thermo Fisher Scientific, Inc., Waltham, MA,
USA). The primers used in used in VAT1 and β-actin messenger RNA
detection were designed by Tsingke Biological Technology, Co., Ltd.
(Beijing, China) and were as follows: VAT1 forward,
5′-TGCCGTACAGTGGAGAATGT-3′ and reverse, 5′-TAGGTGACGACTTTGCCCAT-3′;
and β-actin forward, 5′-AGCGAGCATCCCCCAAAGTT-3′ and reverse,
5′-GGGCACGAAGGCTCATCATT-3′. The PCR conditions were as follows:
Pre-denaturation at 95°C for 10 min, followed by 40 cycles of
denaturation at 95°C for 30 sec, annealing at 60°C for 30 sec and
extension at 72°C for 30 sec. Relative gene expression was
normalized to the expression of β-actin and was calculated by
applying the 2−∆∆Cq method (18). The experiments were repeated ≥3
times.
Cell transfection RNA interference
experiments
Three types of VAT1 small interfering RNA (siRNA)
were designed by 100BIOTECH, Ltd. and transfected into LN229 cells.
The following VAT1 siRNA sequences were used in the present study:
siRNA-1, sense GGGAGAAGUUGGGAAGCUACG and antisense,
UAGCUUCCCAACUUCUCCCUU; siRNA-2, sense GGGCUUGACCAGUUCCCAAUC and
antisense, UUGGGAACUGGUCAAGCCCAG; siRNA-3, sense
GCUUUGGAGGCUACGACAAGG and antisense, UUGUCGUAGCCUCCAAAGCCG. The
VAT1 siRNA and negative control (NC) siRNA were synthesized by
100BIOTECH, Ltd. (Hangzhou, China). The sequence of mimics NC was
UUCUCCGAACGUGUCACGUTT-ACGUGACACGUUCGGAGAATT and miR-218 mimics was
UUGUGCUUGAUCUAACCAUGU-AUGGUUAGAUCAAGCACAAUU. Cells were seeded into
6-well plates (Corning Incorporated, Corning, NY, USA) at a density
of 2×10⁵ cells/well and cultured at 37°C with 5%
CO2 for 24 h before transfection. A mixture of
Lipofectamine 2000 Reagent (Invitrogen; Thermo Fisher Scientific,
Inc.) and siRNA was added into 6-well plates. Cells were cultured
at 37°C with 5% CO2 for 6 h, and the medium was then
replaced. After transfection for 48 h, RT-qPCR was applied to
verify successful overexpression or knockdown. Compared with other
groups, siRNA3 exhibited a stronger interference effect and was
therefore applied in the subsequent assays.
For the transfection of microRNA (miR)-218 into
LN229 cells, cells were seeded in 6-well plates (Corning
Incorporated) at a density of 2×10⁵ cells/well. miR-218
mimics and negative control (NC) mimics were synthesized by
Shanghai GenePharma Co., Ltd. (Shanghai, China). Lipofectamine 2000
reagent was used as a transfection agent according to the
manufacturer's instructions. The expression of VAT1 mRNA was
detected by RT-qPCR after the LN229 cells had been transfected for
48 h.
Proliferation assay
Cell proliferation was evaluated with a Cell
Counting Kit-8 (CCK-8) Cell Proliferation and Cytotoxicity Assay
kit (Beyotime Institute of Biotechnology, Haimen, China) using
96-well plates. A total of 100 µl DMEM with 10% FBS and 5,000 cells
were added to each plate in triplicate for each group. After a 48-h
transfection of LN229 cells, 10 µl CCK-8 reaction solution was
added per well during the final 4 h of culture. OD values were
determined at a wavelength of 450 nm on a microplate reader
(Multiskan MK3 microplate reader; Thermo Fisher Scientific,
Inc.).
Transwell assay
Cells transfected for 48 h were digested and
resuspended in serum-free DMEM. The final concentration was
1×10⁵ cells/100 µl DMEM. Transwell chambers were placed
in a 24-well plate containing 800 µl DMEM and 10% FBS. Then, 100 µl
diluted cell suspension was added in the upper chamber with the
basal DMEM and cultured at 37°C with 5% CO2 for 5 h.
Next, the Transwell chamber was removed and the non-migrated cells
on the other side of the upper chamber were gently wiped off with
cotton buds. Cells were fixed in 4% paraformaldehyde solution for
10 min, followed by staining with 5% crystal violet solution for 5
min at room temperature and washing with phosphate-buffered saline
(PBS) 3 times. Cell images were captured under an inverted
microscope (IX51; Leica Microsystems GmbH, Wetzlar, Germany) in 6
randomly selected fields.
Luciferase reporter assay
Two types of recombinant plasmid were designed by
100BIOTECH, Ltd., namely pYr-VAT1-3′UTR and pYr-VAT1-3′UTR-mut.
293T cells were cultured in 12-well plates at a density of
2×10⁵ cells/well at 37°C and 5% CO2 for 24 h.
Transfection was performed using Lipofectamine 2000 reagent (Thermo
Fisher Scientific, Inc.), which was mixed with 200 µl nucleic acid
diluents [containing NC, miR-218 mimics, 3′ untranslated region
(UTR) and mutant 3′UTR]. Transfected cells were cultured for 24 h
and luciferase activity was then determined with the
Dual-Luciferase Reporter Assay System (Beyotime Institute of
Biotechnology) according to the manufacturer's protocol. Firefly
luciferase activity was normalized to Renilla luciferase activity.
Each experiment was repeated thrice.
Drug sensitivity test
LN229 cells successfully transfected with siRNA were
cultured in medium containing different concentrations of
temozolomide (TMZ) (0, 1, 5, 10 and 25 µM) (Sigma-Aldrich; Merck
KGaA, Darmstadt, Germany) for 24 h. Next, drug sensitivity was
evaluated using a CCK-8 Cell Proliferation and Cytotoxicity Assay
kit. CCK-8 reaction solution was added (10 µl/well) and OD values
were determined at a wavelength of 450 nm on a microplate reader
(Multiskan MK3 microplate reader) after 2 h of culture.
Western blot analysis
Normal brain tissues and glioma tissues were cut
into pieces of 3×3 mm and digested in RIPA Lysis Buffer (Beyotime
Institute of Biotechnology). Total protein was extracted and
quantified with the BCA Protein Assay kit (Beyotime Institute of
Biotechnology) according to the manufacturer's protocol. Equal
quantities of total protein (40 µg) from the cell lysates were
subjected to 10% SDS-PAGE to separate the proteins and then
transferred to a polyvinylidene fluoride (PVDF) membrane (EMD
Millipore, Billerica, MA, USA). After blocking in TBS-Tween-20
(TBST) (Amresco, Inc., Framingham, MA, USA) containing 5% non-fat
milk at room temperature for 1 h, the membrane was incubated with a
primary antibody against GAPDH (dilution 1:5,000; cat. no. AB-P-R
001; Hangzhou Goodhere Biotechnology Co., Ltd., Hangzhou, China)
and VAT1 (dilution 1:800; cat. no. 22016-1-AP; ProteinTech Group,
Inc., Wuhan, China) at 4°C overnight and washed with TBST 5–6 times
(5 min each). Then, the membrane was incubated with a goat
anti-rabbit immunoglobulin G secondary antibody conjugated to
horseradish peroxidase (dilution 1:5,000; cat. no. BA1054; Boster
Biological Technology Technology, Pleasanton, CA, USA), followed by
immersion in enhanced chemiluminescence substrate solution (Thermo
Fisher Scientific, Inc.) to detect the signals. GAPDH served as an
internal control.
The LN229 cells transfected with NC or miR-218
mimics were also subjected to western blotting. Cells were washed
with cold PBS and lysed in RIPA Lysis buffer (Beyotime Institute of
Biotechnology). The methods of protein extraction and subsequent
detection were the same as aforementioned.
Statistical analysis
Data were divided into two groups according to the
median expression level of VAT1 and the statistical difference
between each group was assessed by Student's t test using R and
SPSS software. We used one-way analysis of variance (ANOVA)
followed by Holm-Sidak test for comparisons among multiple groups.
Overall survival (OS) was determined from the time of surgery to
death or the last follow-up. Progression-free survival(PFS) was
defined as the time from surgery to tumor recurrence or last
follow-up. Multivariate analysis was performed to evaluate the
influence factor of survival by the Cox regression model.
Kaplan-Meier survival curves were used to estimate the survival
rate. P<0.05 was considered to indicate a statistically
significant difference.
Results
VAT1 is an independent risk factor for
patients with GBM
The clinicopathological characteristics of 120
patients with GBM from the CGGA dataset were included in our study.
Their follow-up data were complete and available. Patients were
divided into two groups according to the RNAseq expression level of
VAT1, and each group contained 60 patients. The results of
Chi-square revealed that only the TCGA subtype had a statistically
significant difference between the two groups (P=0.031; Table I). Patients in the VAT1
high-expression group tended to be of the mesenchymal subtype,
while in the low-expression group, the neural subtype was more
common than other types. The median age of all patients was 49
years (range, 18–81 years), and the median age of the VAT1
high-expression group was older than that of the low-expression
group. However, there was no statistically significant difference
in VAT1 expression levels regarding age or sex. Considering the
importance of pathological factors in diagnosis and prognosis,
several biomarkers that have been widely reported in the field of
glioma were selected. The status of these markers exhibited no
differences between the VAT1 high-expression group and the
low-expression group, including 1p/19q co-deletion, isocitrate
dehydrogenase 1/2 (IDH1/2) mutation, MGMT promoter methylation and
TERT promoter mutation. In the subsequent multivariate analysis,
the age of patients, VAT1 expression levels and the aforementioned
vital markers were taken into consideration, and the influence of
each of these variables on survival was assessed. The results
revealed that VAT1 was an independent risk factor for OS [P=0.021;
hazard ratio (HR)=2.065; 95% confidence interval (CI)=1.116–3.822;
Table II) but not PFS (P=0.129;
HR=1.576; 95% CI=0.875–2.839; Table
III). The strategy of postoperative adjuvant treatment, which
combined radiotherapy with or without TMZ chemotherapy, had no
statistically significant differences between the two VAT1
expression groups.
 | Table I.Clinical and molecular
characteristics of 120 patients. |
Table I.
Clinical and molecular
characteristics of 120 patients.
| Variable (n,
%) | Total (n, %)
120 | VAT1 high
expression 60 | VAT1 low expression
60 | P-value |
|---|
| Age, years |
| Median
(range) | 49 (18–81) | 50.5 (29–71) | 47.5 (18–81) |
|
≥49 | 62 | 33 | 29 | 0.465 |
|
<49 | 58 | 27 | 31 |
|
| Sex |
|
Male | 74 | 41 | 33 | 0.133 |
|
Female | 46 | 19 | 27 |
|
| 1p/19q
co-deletion |
|
Co-deletion | 7 | 4 | 3 | 0.969 |
|
Non_codeletion | 95 | 55 | 40 |
|
| IDH1/2
mutation |
|
Mutation | 28 | 11 | 17 | 0.195 |
|
Wild-type | 92 | 49 | 43 |
|
| MGMT promoter
methylation |
|
Methylation | 51 | 27 | 24 | 0.692 |
|
Unmethylation | 61 | 30 | 31 |
|
| TERT promoter
mutation |
|
Mutation | 38 | 20 | 18 | 0.931 |
|
Wild-type | 58 | 30 | 28 |
|
| TCGA subtype |
|
Proneural | 27 | 13 | 14 | 0.031 |
|
Neural | 12 | 2 | 10 |
|
|
Classical | 37 | 17 | 20 |
|
|
Mesenchymal | 44 | 28 | 16 |
|
| Postoperative
treatment |
| RT plus
TMZ | 53 | 23 | 30 | 0.139 |
| RT
only | 19 | 12 | 7 |
|
| Table II.Multivariate factors of the overall
survival of patients. |
Table II.
Multivariate factors of the overall
survival of patients.
|
|
| 95% Confidence
interval |
|---|
|
|
|
|
|---|
| Variables | P-value | Hazards ratio | Lower | Upper |
|---|
| Age, years | 0.701 | 1.170 | 0.525 | 2.607 |
| Sex | 0.056 | 0.540 | 0.287 | 1.016 |
| TCGA subtype | 0.976 | 1.005 | 0.728 | 1.387 |
| VAT1 | 0.021 | 2.065 | 1.116 | 3.822 |
| IDH1/2 | 0.346 | 0.712 | 0.351 | 1.444 |
| 1p/19q | 0.094 | 0.953 | 0.276 | 3.291 |
| MGMT | 0.905 | 1.036 | 0.584 | 1.837 |
| TERT | 0.151 | 0.631 | 0.336 | 1.184 |
| Radiotherapy | 0.083 | 0.620 | 0.361 | 1.064 |
| Chemotherapy | 0.028 | 0.517 | 0.287 | 0.933 |
| Table III.Multivariate factors of the
progression-free survival of patients. |
Table III.
Multivariate factors of the
progression-free survival of patients.
|
|
| 95% Confidence
interval |
|---|
|
|
|
|
|---|
| Variables | P-value | Hazards ratio | Lower | Upper |
|---|
| Age, years | 0.967 | 1.016 | 0.465 | 2.220 |
| Sex | 0.101 | 0.606 | 0.333 | 1.103 |
| TCGA subtype | 0.596 | 1.089 | 0.794 | 1.493 |
| VAT1 | 0.129 | 1.576 | 0.875 | 2.839 |
| IDH1/2 | 0.436 | 0.763 | 0.387 | 1.506 |
| 1p/19q | 0.727 | 1.242 | 0.368 | 4.193 |
| MGMT | 0.789 | 1.076 | 0.628 | 1.846 |
| TERT | 0.723 | 0.900 | 0.503 | 1.610 |
| Radiotherapy | 0.041 | 0.576 | 0.338 | 0.979 |
| Chemotherapy | 0.237 | 0.703 | 0.392 | 1.261 |
Influence of different VAT1 expression
levels on survival
Based on the results of multivariate analysis, VAT1
was identified as an independent risk factor for survival, which
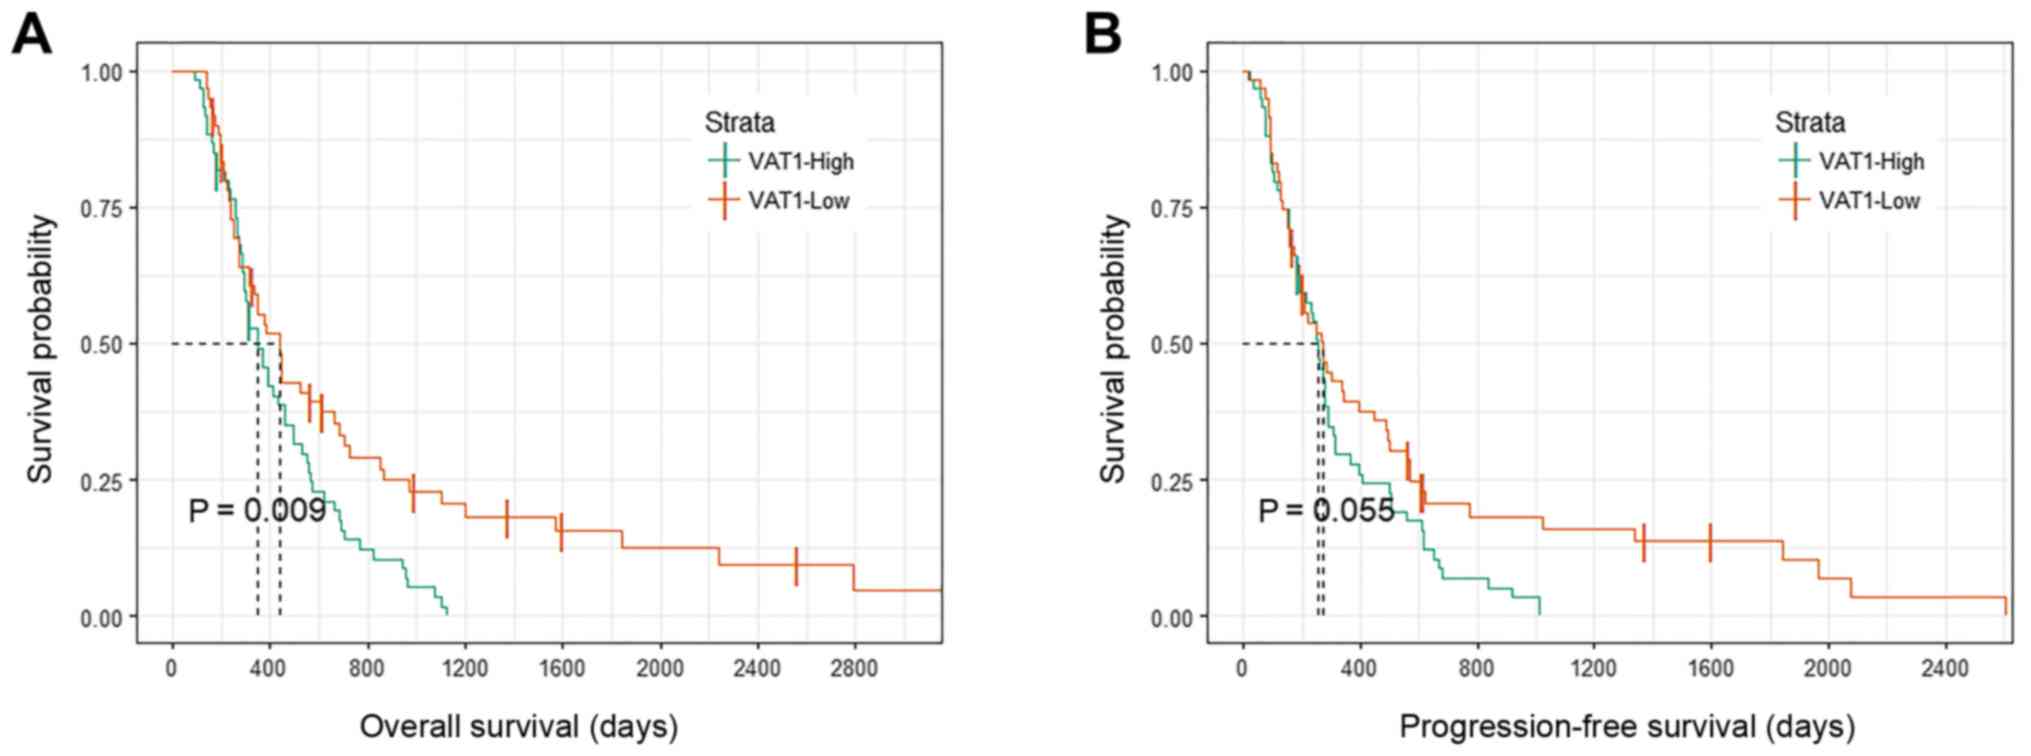
could impact the prognosis of patients. To visualize this trend,
Kaplan-Meier curves were generated to demonstrate the influence of
VAT1 expression on OS and PFS in our data (Fig. 1). Patients with high VAT1 expression
levels had shorter OS and PFS compared with patients in the
low-expression group, although only OS exhibited a statistically
significant difference (P=0.009; Fig.
1A). Combined with the results from the multivariate analysis,
VAT1 may serve an important role in the development of glioma and
may be associated with tumor progression and poor prognosis. Thus,
the present study focused on the association between VAT1
expression and the features of patients with GBM, and further
explored the function of VAT1.
VAT1-associated biological processes
and signaling pathways
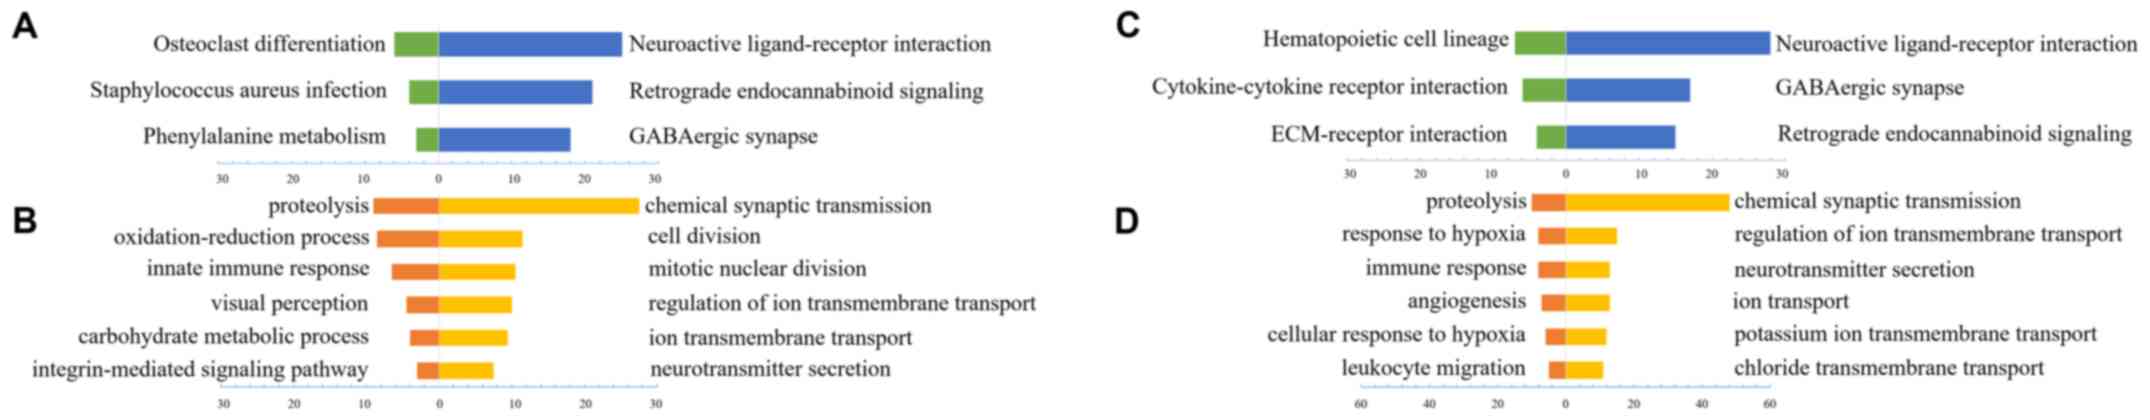
To investigate the biological features of patients
with GBM with different VAT1 expression levels, a paired t-test was
applied to evaluate the differentially expressed genes (P<0.05).
In total, 1,038 and 776 genes in the CGGA and TCGA datasets,
respectively, were available for subsequent analysis. GO analysis
online with DAVID (https://david.ncifcrf.gov/) was applied to reveal the
function of VAT1-associated genes. Finally, various biological
processes and signaling pathways that contained a relatively low
P-value and a high number of genes were selected. In general,
functionally similar results for VAT1 low expression-associated
genes were identified in the CGGA (Fig.
2A and B) and TCGA datasets (Fig. 2C
and D). The majority of VAT1 low-expression-associated genes'
biological processes were involved in chemical synaptic
transmission, ion transport and neurotransmitter secretion, which
may indicate various normal biological functions. The signaling
pathways associated with high VAT1 expression levels in both
datasets could nearly reach uniformity, while the results of
biological processes analysis revealed that the function of these
genes was mainly associated with proteolysis, oxidation-reduction
processes and immune response. Particularly, in TCGA dataset, the
genes associated with high expression levels of VAT1 were
functionally involved in angiogenesis and hypoxia, which are
regarded as the hallmarks of tumor development, and suggests that
VAT1 may be a potential gene influencing tumorigenesis and tumor
progression.
VAT1 expression levels in gliomas
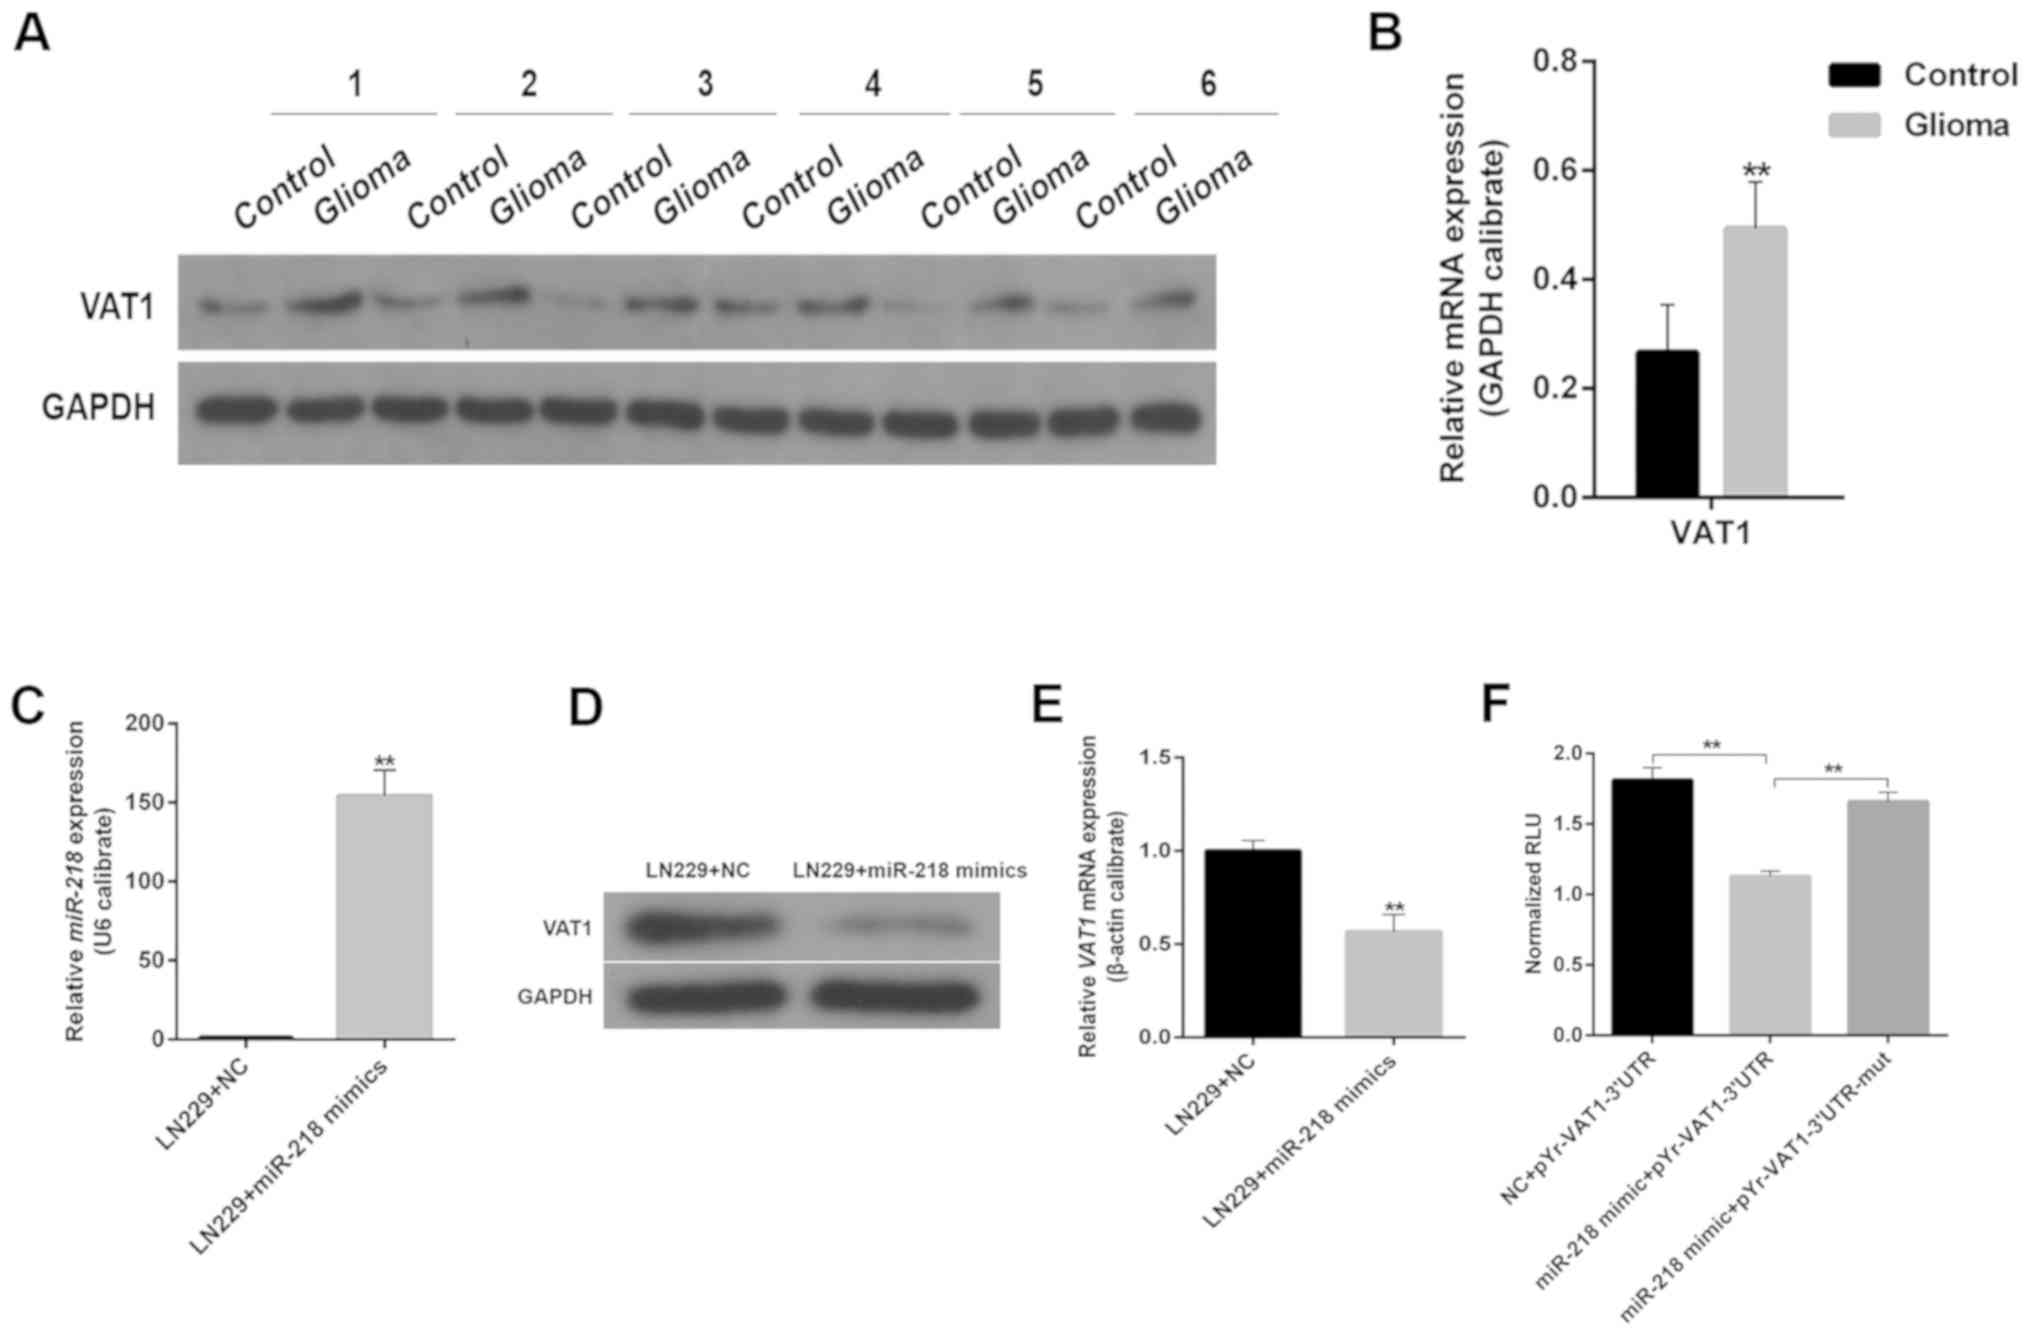
The aforementioned results demonstrated the
potential function of VAT1 in malignant gliomas. To further explore
the role of VAT1, the present study compared the mRNA expression
levels of VAT1 between gliomas and control tissues (i.e. the
peritumoral tissue of glioma, which was generally located 1 cm away
from the tumor). The results revealed that VAT1 mRNA expression was
markedly higher in gliomas than in control tissues (Fig. 3B). The subsequent western blot
analysis confirmed that the protein levels of VAT1 were distinctly
higher in gliomas compared with peritumoral tissues (Fig. 3A). As reported in previous studies,
numerous miRs appear to be associated with tumor initiation and
progression by influencing the expression of specific genes
(18,19). An increasing body of evidence suggests
that miR-218 may act as a tumor suppressor by decreasing cell
proliferation, invasion and migration (20,21).
Therefore, the present study next assessed the influence of miR-218
on VAT1 expression and revealed that miR-218 inhibited the
expression of VAT1 both at the mRNA and protein level. Upon
transfection with miR-218 mimics, the cells exhibited markedly low
expression levels of VAT1 (Fig.
3C-E). According to the results of a dual-luciferase reporter
assay, compared with the NC-pYr-VAT1-3′UTR group, the relative
fluorescence units (RLUs) of cells transfected with miR-218
mimic-pYr-VAT1-3′UTR were remarkably decreased (Fig. 3F), while the RLUs of cells transfected
with miR-218 mimic-pYr-VAT1-3′UTR-mut were significantly increased
compared with the miR-218 mimic-pYr-VAT1-3′UTR group, which
suggested that miR-218 mimics played a targeted inhibitory role on
VAT1.
VAT1 knockdown inhibits cell
proliferation and migration, and enhances TMZ sensitivity
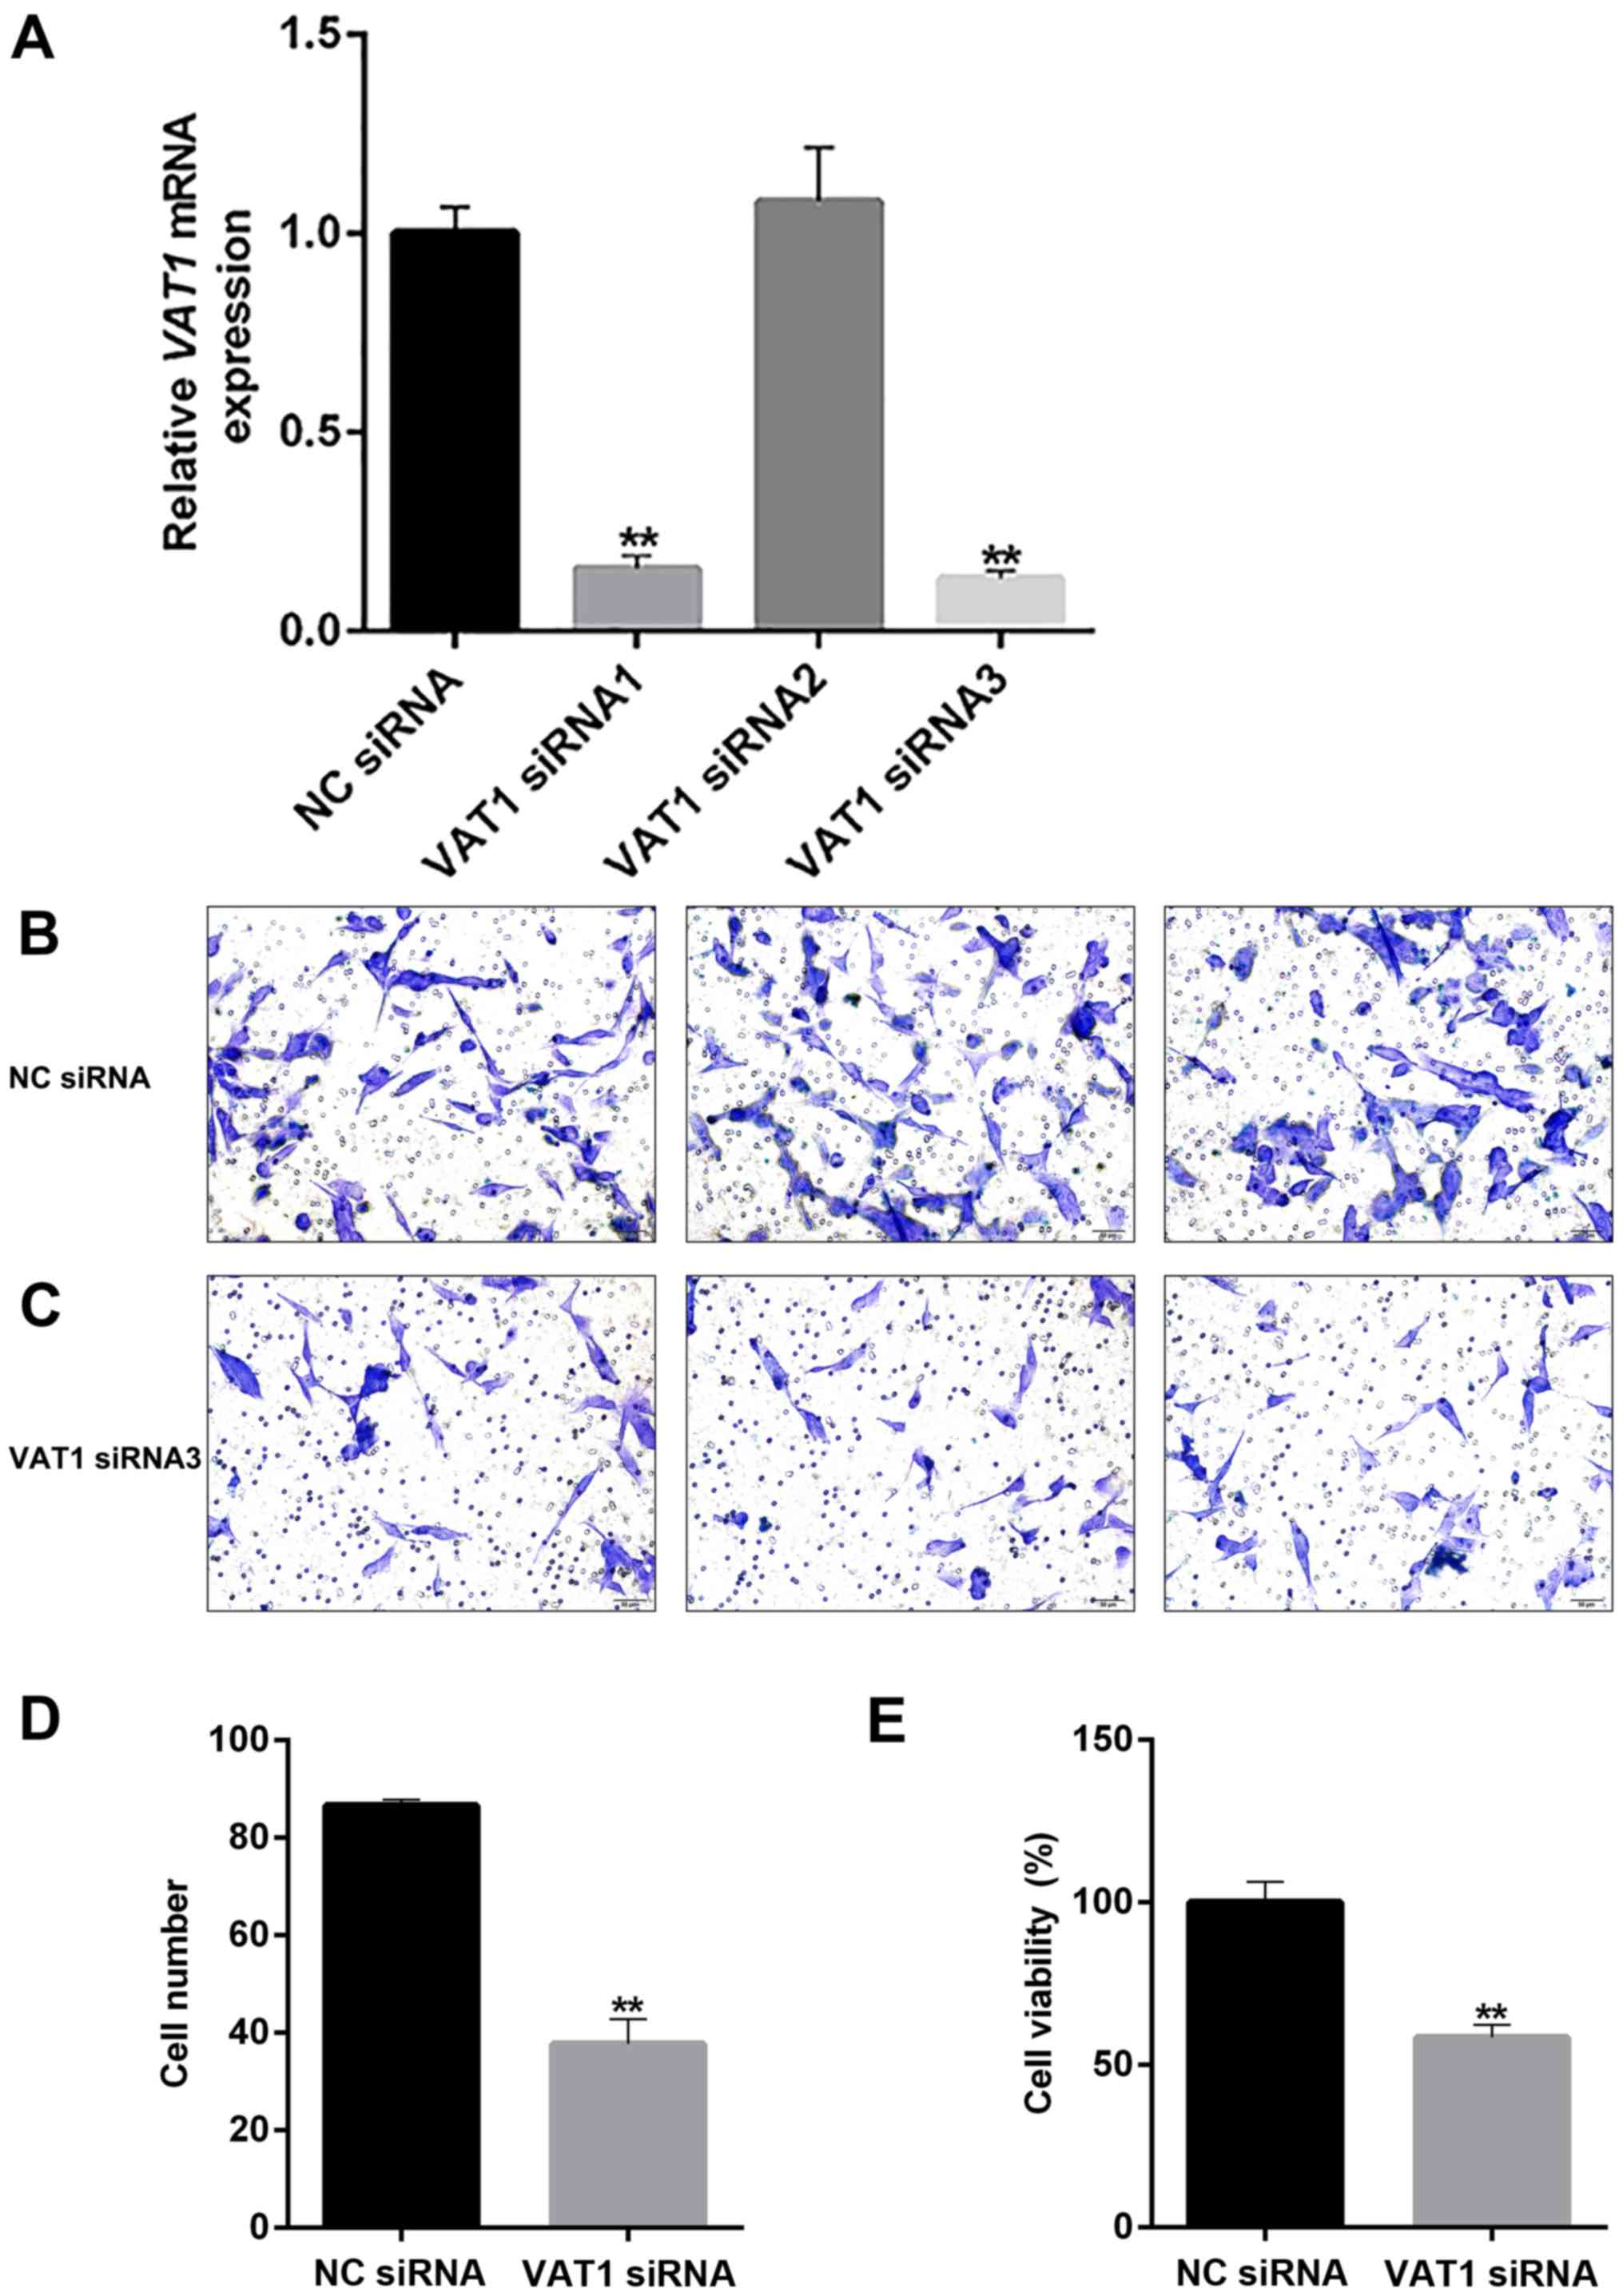
The direct function of VAT1 was evaluated by
knocking down the gene (Fig. 4A). The
results demonstrated that cell viability and the number of migrated
cells were markedly decreased (Fig. 4D
and E), which indicated that VAT1 could promote cell
proliferation and migration. A marked decrease in cell migration
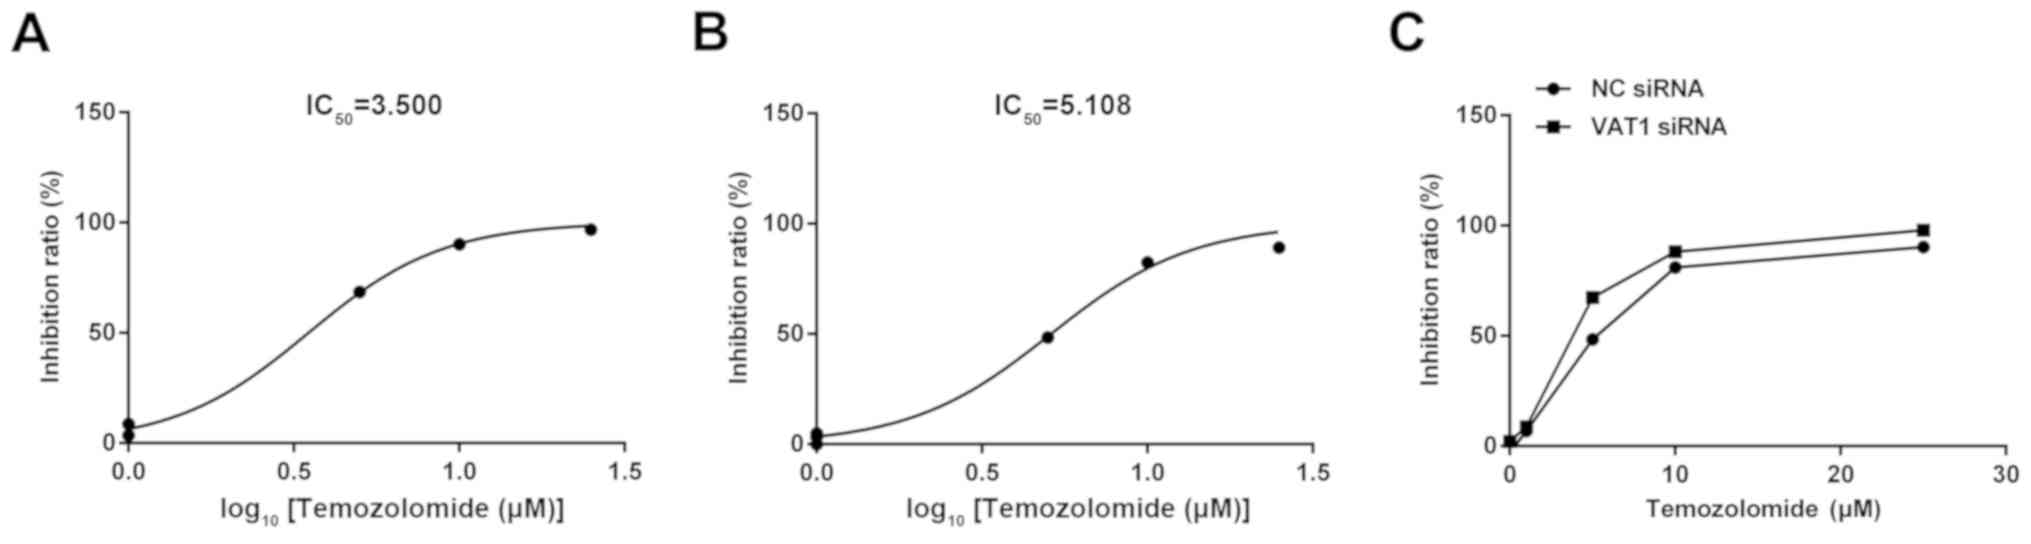
was also observed upon knockdown of VAT1 (Fig. 4B-C). To evaluate the effect of VAT1 on
TMZ, the present study conducted a drug sensitivity test, and the
half maximal inhibitory concentration (IC50) value was
used as a quantitative indicator. The results revealed that the
IC50 was decreased in the VAT1 siRNA group
(C50=3.500; Fig. 5A)
compared with the NC group (C50=5.108; Fig. 5B). Regarding the detection of cell
inhibition rates, silencing VAT1 could improve the inhibition ratio
at the same concentration of TMZ compared with the control
(Fig. 5C). Thus, VAT1 may reduce the
sensitivity of TMZ.
Discussion
With high malignancy and invasion features, gliomas
are regarded as the most common type of brain tumor in adults.
Tumor recurrence is almost inevitable despite advancements in
treatment strategy (1). To further
understand the characteristics of GBM and to identify novel
therapeutic targets, numerous studies have focused on genes
associated with tumorigenesis, invasion and prognosis. In the
present study, high expression levels of VAT1 were detected in
brain tissues of patients with GBM compared with normal brain
tissues. Multivariate analysis revealed that VAT1 was an
independent prognostic factor for OS. Kaplan-Meier curves
demonstrated that high expression levels of VAT1 indicated poor
prognosis. Based on these findings, it was proposed that VAT1 may
serve an important role in the tumorigenesis of gliomas. However,
to the best of our knowledge, only Mertcsh et al have
reported to date the effect of VAT1 on glioma cell migration. Thus,
the role of VAT1 in glioma remains unclear to a great extent
(17). To further explore the
function of VAT1, GO analysis was applied to reveal the relevant
biological processes and pathways of differentially expressed genes
based on the mRNA expression levels of VAT1. As anticipated, the
major biological processes of VAT1 were chemical synaptic
transmission, ion transport and neurotransmitter secretion, which
was in agreement with previous research. The biological processes
of VAT1 were positively associated with genes that were mainly
involved in proteolysis, immune response, response to hypoxia and
oxidation-reduction processes, which suggested that high VAT1
expression may be a positive regulatory factor for tumor
proliferation and growth. VAT1 may act as a biomarker in glioma
progression and exhibits potential as a novel target for the
treatment of GBM.
The present results demonstrated that VAT1
expression levels were markedly high in brain tissues of patients
with GBM compared with normal brain tissues. miRs (also called
miRNAs) are small non-coding RNAs of ~20–23 nucleotides that
regulate gene expression and various biological processes (22,23).
Previous studies indicated that miR-218 was markedly suppressed in
tumors, and that the upregulation of miR-218 could inhibit cell
proliferation and migration by targeting diverse genes (24–26).
Therefore, VAT1 expression levels were detected in GBM cell lines
transfected with miR-218 to assess the influence of miR-218 on
VAT1. The results suggested that VAT1 expression was suppressed by
miR-218. Subsequently, a series of functional experiments were
performed to validate the function of VAT1. siRNA-mediated VAT1
knockdown significantly suppressed the proliferation and migration
of GBM cells. Furthermore, enhancement of TMZ sensitivity was
observed in VAT1-knockdown tumor cells. Thus, downregulation of
VAT1 may be a potential therapeutic target in the treatment of GBM
based on our results. However, further studies are required to
identify the potential mechanisms by which VAT1 regulates glioma
biological functions.
Notably, the function of genes positively associated
with high VAT1 expression was linked with immune response. Similar
results were obtained in TCGA dataset, which suggested a potential
link between VAT1 expression and tumor immunity. Recently, several
studies have focused on tumor-associated immunosuppression. Diverse
mechanisms of escaping tumor-specific T cell-mediated immune
response have been proposed by various studies (27–31).
Supper et al identified a significant interaction between
cluster of differentiation (CD)147 and VAT1, and regarded VAT1 as a
novel interacting partner that dynamically interacts with CD147
upon T-cell activation (32).
Additionally, GO analysis revealed that the neurotransmitter
secretion function in genes was correlated with low VAT1 expression
levels. The function of the integral membrane protein encoded by
VAT1 is to transfer monoamines (e.g. dopamine). Dopamine (DA) as a
vital neurotransmitter, participates in many processes in the
central nervous system (CNS) and its function in the immune system
has also been discussed recently. One effect of DA is the
regulation of leukocyte activation and function during the immune
response (33). The dopaminergic
system (DAS) has a plasma membrane-specific DA transporter called
sodium-dependent DA transporter. The VAT1 protein was reported to
be a transporter of DAS, which was preferentially expressed in
neuroendocrine cells (34,35). In a previous in vitro
experiment, the results revealed that incubation of
CD4+CD25+ regulatory T cells (Treg) with VAT1
inhibitor (e.g., reserpine) led to the downregulation of
intracellular catecholamine concentrations and the increase of the
concentration of the medium (36).
Based on these studies, it was hypothesized that upregulation of
VAT1 expression may inhibit the unleashing of DA. Furthermore, T
cells have the ability to synthesize and metabolize DA, and they
can respond to DA by releasing and recapturing these molecules
(37,38). Our future studies may further focus on
the interaction between VAT1 and various specific immune cells
present in the tumor microenvironment.
In conclusion, GBM displays significantly high VAT1
expression levels, which indicates a more invasive, malignant
status and poor prognosis. Such phenomenon may be attributable to
the influence of VAT1 expression on tumor immunity. VAT1 may act as
a potential therapeutic target, and its association with immune
cells must be explored in future studies.
Acknowledgements
Not applicable.
Funding
The present study was supported by the Beijing
Natural Science Foundation Project (grant no. 7152052) and the
Beijing Tiantan Hospital Miaopu Project (grant no. 2017MP05).
Availability of data and materials
All data generated or analyzed during the present
study are included in this article.
Authors' contributions
XS and KW conceived and designed the experiments and
wrote the manuscript. XS, KW, XT and ZW performed the experiments
and analyzed the data. FW and LX guided the experiments. XT, ZW, FW
and LX helped with interpretation of data. PY and JW performed the
surgery and designed the study. All authors read and approved the
manuscript and agree to be accountable for all aspects of the
research in ensuring that the accuracy or integrity of any part of
the work are appropriately investigated and resolved.
Ethics approval and consent to
participate
The present study was approved by the Ethics
Committee of Capital Medical University (Beijing, China). Written
informed consent was obtained from all individual participants
included in the study.
Patient consent for publication
Not applicable.
Competing interests
All authors declare that they have no conflicts of
interest.
References
|
1
|
Van Meir EG, Hadjipanayis CG, Norden AD,
Shu HK, Wen PY and Olson JJ: Exciting new advances in
neuro-oncology: The avenue to a cure for malignant glioma. CA
Cancer J Clin. 60:166–193. 2010. View Article : Google Scholar : PubMed/NCBI
|
|
2
|
Louis DN, Ohgaki H, Wiestler OD, Cavenee
WK, Burger PC, Jouvet A, Scheithauer BW and Kleihues P: The 2007
WHO classification of tumours of the central nervous system. Acta
Neuropathol. 114:97–109. 2007. View Article : Google Scholar : PubMed/NCBI
|
|
3
|
Claes A, Idema AJ and Wesseling P: Diffuse
glioma growth: A guerilla war. Acta Neuropathol. 114:443–458. 2007.
View Article : Google Scholar : PubMed/NCBI
|
|
4
|
Stupp R, Mason WP, van den Bent MJ, Weller
M, Fisher B, Taphoorn MJ, Belanger K, Brandes AA, Marosi C, Bogdahn
U, et al European Organisation for Research and Treatment of Cancer
Brain Tumor and Radiotherapy Groups, : National Cancer Institute of
Canada Clinical Trials Group: Radiotherapy plus concomitant and
adjuvant temozolomide for glioblastoma. N Engl J Med. 352:987–996.
2005. View Article : Google Scholar : PubMed/NCBI
|
|
5
|
Parsons DW, Jones S, Zhang X, Lin JC,
Leary RJ, Angenendt P, Mankoo P, Carter H, Siu IM, Gallia GL, et
al: An integrated genomic analysis of human glioblastoma
multiforme. Science. 321:1807–1812. 2008. View Article : Google Scholar : PubMed/NCBI
|
|
6
|
Smith TM, Lee MK, Szabo CI, Jerome N,
McEuen M, Taylor M, Hood L and King MC: Complete genomic sequence
and analysis of 117 kb of human DNA containing the gene BRCA1.
Genome Res. 6:1029–1049. 1996. View Article : Google Scholar : PubMed/NCBI
|
|
7
|
Wang Y and Jiang T: Understanding high
grade glioma: Molecular mechanism, therapy and comprehensive
management. Cancer Lett. 331:139–146. 2013. View Article : Google Scholar : PubMed/NCBI
|
|
8
|
Eiden LE, Schäfer MK, Weihe E and Schütz
B: The vesicular amine transporter family (SLC18): Amine/proton
antiporters required for vesicular accumulation and regulated
exocytotic secretion of monoamines and acetylcholine. Pflugers
Arch. 447:636–640. 2004. View Article : Google Scholar : PubMed/NCBI
|
|
9
|
Linial M and Levius O: VAT-1 from
Torpedo is a membranous homologue of zeta crystallin. FEBS
Lett. 315:91–94. 1993. View Article : Google Scholar : PubMed/NCBI
|
|
10
|
Linial M, Miller K and Scheller RH: VAT-1:
An abundant membrane protein from Torpedo cholinergic
synaptic vesicles. Neuron. 2:1265–1273. 1989. View Article : Google Scholar : PubMed/NCBI
|
|
11
|
Miki Y, Swensen J, Shattuck-Eidens D,
Futreal PA, Harshman K, Tavtigian S, Liu Q, Cochran C, Bennett LM,
Ding W, et al: A strong candidate for the breast and ovarian cancer
susceptibility gene BRCA1. Science. 266:66–71. 1994. View Article : Google Scholar : PubMed/NCBI
|
|
12
|
Koch J, Foekens J, Timmermans M, Fink W,
Wirzbach A, Kramer MD and Schaefer BM: Human VAT-1: A
calcium-regulated activation marker of human epithelial cells. Arch
Dermatol Res. 295:203–210. 2003. View Article : Google Scholar : PubMed/NCBI
|
|
13
|
Vicanová J, Boelsma E, Mommaas AM,
Kempenaar JA, Forslind B, Pallon J, Egelrud T, Koerten HK and Ponec
M: Normalization of epidermal calcium distribution profile in
reconstructed human epidermis is related to improvement of terminal
differentiation and stratum corneum barrier formation. J Invest
Dermatol. 111:97–106. 1998. View Article : Google Scholar : PubMed/NCBI
|
|
14
|
Owens DW, Brunton VG, Parkinson EK and
Frame MC: E-cadherin at the cell periphery is a determinant of
keratinocyte differentiation in vitro. Biochem Biophys Res Commun.
269:369–376. 2000. View Article : Google Scholar : PubMed/NCBI
|
|
15
|
Mori F, Tanigawa K, Endo K, Minamiguchi K,
Abe M, Yamada S and Miyoshi K: VAT-1 is a novel pathogenic factor
of progressive benign prostatic hyperplasia. Prostate.
71:1579–1586. 2011.PubMed/NCBI
|
|
16
|
Mottaghi-Dastjerdi N, Soltany-Rezaee-Rad
M, Sepehrizadeh Z, Roshandel G, Ebrahimifard F and Setayesh N: Gene
expression profiling revealed overexpression of vesicle amine
transport protein-1 (VAT-1) as a potential oncogene in gastric
cancer. Indian J Biotechnol. 15:161–165. 2016.
|
|
17
|
Mertsch S, Becker M, Lichota A, Paulus W
and Senner V: Vesicle amine transport protein-1 (VAT-1) is
upregulated in glioblastomas and promotes migration. Neuropathol
Appl Neurobiol. 35:342–352. 2009. View Article : Google Scholar : PubMed/NCBI
|
|
18
|
Novakova J, Slaby O, Vyzula R and Michalek
J: MicroRNA involvement in glioblastoma pathogenesis. Biochem
Biophys Res Commun. 386:1–5. 2009. View Article : Google Scholar : PubMed/NCBI
|
|
19
|
Palumbo S, Miracco C, Pirtoli L and
Comincini S: Emerging roles of microRNA in modulating cell-death
processes in malignant glioma. J Cell Physiol. 229:277–286. 2014.
View Article : Google Scholar : PubMed/NCBI
|
|
20
|
Gao X and Jin W: The emerging role of
tumor-suppressive microRNA-218 in targeting glioblastoma stemness.
Cancer Lett. 353:25–31. 2014. View Article : Google Scholar : PubMed/NCBI
|
|
21
|
Yang Y, Ding L, Hu Q, Xia J, Sun J, Wang
X, Xiong H, Gurbani D, Li L, Liu Y, et al: MicroRNA-218 functions
as a tumor suppressor in lung cancer by targeting IL-6/STAT3 and
negatively correlates with poor prognosis. Mol Cancer. 16:1412017.
View Article : Google Scholar : PubMed/NCBI
|
|
22
|
Winter J, Jung S, Keller S, Gregory RI and
Diederichs S: Many roads to maturity: microRNA biogenesis pathways
and their regulation. Nat Cell Biol. 11:228–234. 2009. View Article : Google Scholar : PubMed/NCBI
|
|
23
|
Hwang HW and Mendell JT: MicroRNAs in cell
proliferation, cell death, and tumorigenesis. Br J Cancer.
94:776–780. 2006. View Article : Google Scholar : PubMed/NCBI
|
|
24
|
Yu J, Wang Y, Dong R, Huang X, Ding S and
Qiu H: Circulating microRNA-218 was reduced in cervical cancer and
correlated with tumor invasion. J Cancer Res Clin Oncol.
138:671–674. 2012. View Article : Google Scholar : PubMed/NCBI
|
|
25
|
Nishikawa R, Goto Y, Sakamoto S, Chiyomaru
T, Enokida H, Kojima S, Kinoshita T, Yamamoto N, Nakagawa M, Naya
Y, et al: Tumor-suppressive microRNA-218 inhibits cancer cell
migration and invasion via targeting of LASP1 in prostate cancer.
Cancer Sci. 105:802–811. 2014. View Article : Google Scholar : PubMed/NCBI
|
|
26
|
Gu J, Xu R, Li Y, Zhang J and Wang S:
MicroRNA-218 modulates activities of glioma cells by targeting
HMGB1. Am J Transl Res. 8:3780–3790. 2016.PubMed/NCBI
|
|
27
|
Pardoll DM: The blockade of immune
checkpoints in cancer immunotherapy. Nat Rev Cancer. 12:252–264.
2012. View
Article : Google Scholar : PubMed/NCBI
|
|
28
|
Fecci PE, Ochiai H, Mitchell DA, Grossi
PM, Sweeney AE, Archer GE, Cummings T, Allison JP, Bigner DD and
Sampson JH: Systemic CTLA-4 blockade ameliorates glioma-induced
changes to the CD4+ T cell compartment without affecting
regulatory T-cell function. Clin Cancer Res. 13:2158–2167. 2007.
View Article : Google Scholar : PubMed/NCBI
|
|
29
|
See AP, Parker JJ and Waziri A: The role
of regulatory T cells and microglia in glioblastoma-associated
immunosuppression. J Neurooncol. 123:405–412. 2015. View Article : Google Scholar : PubMed/NCBI
|
|
30
|
Shukla SA, Rooney MS, Rajasagi M, Tiao G,
Dixon PM, Lawrence MS, Stevens J, Lane WJ, Dellagatta JL, Steelman
S, et al: Comprehensive analysis of cancer-associated somatic
mutations in class I HLA genes. Nat Biotechnol. 33:1152–1158. 2015.
View Article : Google Scholar : PubMed/NCBI
|
|
31
|
Doucette T, Rao G, Rao A, Shen L, Aldape
K, Wei J, Dziurzynski K, Gilbert M and Heimberger AB: Immune
heterogeneity of glioblastoma subtypes: Extrapolation from the
cancer genome atlas. Cancer Immunol Res. 1:112–122. 2013.
View Article : Google Scholar : PubMed/NCBI
|
|
32
|
Supper V, Hartl I, Boulègue C,
Ohradanova-Repic A and Stockinger H: Dynamic interaction- and
phospho-proteomics reveal Lck as a major signaling hub of CD147 in
T cells. J Immunol. 198:2468–2478. 2017. View Article : Google Scholar : PubMed/NCBI
|
|
33
|
Arreola R, Alvarez-Herrera S,
Pérez-Sánchez G, Becerril-Villanueva E, Cruz-Fuentes C,
Flores-Gutierrez EO, Garcés-Alvarez ME, de la Cruz-Aguilera DL,
Medina-Rivero E, Hurtado-Alvarado G, et al: Immunomodulatory
effects mediated by dopamine. J Immunol Res. 2016:31604862016.
View Article : Google Scholar : PubMed/NCBI
|
|
34
|
Essand M, Vikman S, Grawé J, Gedda L,
Hellberg C, Oberg K, Totterman TH and Giandomenico V:
Identification and characterization of a novel splicing variant of
vesicular monoamine transporter 1. J Mol Endocrinol. 35:489–501.
2005. View Article : Google Scholar : PubMed/NCBI
|
|
35
|
Wimalasena K: Vesicular monoamine
transporters: Structure- function, pharmacology, and medicinal
chemistry. Med Res Rev. 31:483–519. 2011. View Article : Google Scholar : PubMed/NCBI
|
|
36
|
Cosentino M, Fietta AM, Ferrari M, Rasini
E, Bombelli R, Carcano E, Saporiti F, Meloni F, Marino F and
Lecchini S: Human CD4+CD25+ regulatory T
cells selectively express tyrosine hydroxylase and contain
endogenous catecholamines subserving an autocrine/paracrine
inhibitory functional loop. Blood. 109:632–642. 2007. View Article : Google Scholar : PubMed/NCBI
|
|
37
|
Amenta F, El-Assouad D, Mignini F, Ricci A
and Tayebati SK: Neurotransmitter receptor expression by peripheral
mononuclear cells: Possible marker of neuronal damage by exposure
to radiations. Cell Mol Biol (Noisy-le-grand). 48:415–421.
2002.PubMed/NCBI
|
|
38
|
Musso NR, Brenci S, Setti M, Indiveri F
and Lotti G: Catecholamine content and in vitro catecholamine
synthesis in peripheral human lymphocytes. J Clin Endocrinol Metab.
81:3553–3557. 1996. View Article : Google Scholar : PubMed/NCBI
|