Introduction
Breast cancer is the second leading cause of
cancer-related deaths in women, and the incidence of breast is
estimated to increase by ~0.5% annually (1,2). Despite
enormous progress on breast cancer therapy, 20% of patients
eventually die of their disease (3,4). Multiple
studies have revealed that breast cancer is a heterogeneous and
complex disease, whose pathophysiology cannot be explained by one
or several mechanisms (5). A number
of reliable biological markers have been found to predict the risk
of recurrence and metastasis of breast cancer. Among these
prognostic factors, estrogen receptor (ER), progesterone receptor
(PR) and erb-b2 receptor tyrosine kinase 2 (HER2) status are
significantly associated with overall clinical outcome (6). In addition, triple-negative breast
cancer (TNBC), which is characterized by absent or minimal
expression of ER, PR and HER2, is more aggressive and has a worse
prognosis compared with the other subtypes of breast cancer
(7). Recently, the expression profile
of TNBC was described in a homogeneous population from northeastern
Mexico and a novel gene signature related to metabolism was
proposed (8). Such expression
profiles are valuable for elucidating the mechanisms involved in
tumorigenesis, diagnosis, prognosis and potential therapies.
Myotubularin related protein 3 (MTMR3) was first
identified as an inositol lipid 3-phosphatase and belongs to the
myotubularin (MTM) family (9). It
confers a unique substrate specificity to
phosphatidylinositol(3)-phosphate (PtdIns3P) and
phosphatidylinositol(3,5)-biphosphate [PtdIns(3,5)P2], and the
hydrolysis products, PtdIns and PtdIns5P, regulate cell activity
and tumor progression (9,10). MTMR3 contains a N-terminal
phosphatidylinositol lipids binding domain, a pleckstrin
homology-GRAM (PHG) domain, and a C-terminal modulatory domain,
that is responsible for endosomal localization and for binding to
Ptdins3P (10). Inositol lipids are
thought to be involved in various cellular functions, including
proliferation, invasion, survival, cell cycle progression,
migration and membrane trafficking (11). Several investigations into MTMR3 have
underlined the key role of this gene in cancer development
(12–14). Oppelt et al (14) reported that MTMR3 is widely expressed
in most cancer cell lines and MTMR3-deficiency leads to reduced
motility in rhabdomyosarcoma Rh30 cells and osteosarcoma U2OS
cells.
Previously, a key role for MTMR3 was revealed in
oral cancer. Kuo et al (15)
demonstrated that miR-99a exerts antimetastatic effects through
decreasing MTMR3 levels, suggesting that MTMR3 may serve as a
potential therapeutic target for oral cancer. In breast cancer,
although MTMR3 has been shown to be associated with cell cycle
regulation and apoptosis in the SK-BR-3 cell line (16), the clinical impacts and functional
role of MTMR3 remain unclear. Autophagy is a critical intracellular
pathway that is associated with the bulk degradation of cytoplasmic
components (17). In addition to
acting as a tumor inhibitor, autophagy can also enhance cell
survival to drive tumor growth and metastasis (18). Notably, depletion of MTMR3 was
demonstrated to trigger autophagosome formation, but overexpression
of MTMR3 resulted in smaller nascent autophagosomes, subsequently
blocking autophagy (19). In breast
cancer, MTMR3 has been reported to be regulated by miR-100, which
could mediate apoptosis of breast cancer (16). However, the functions of MTMR3 in
breast cancer have not been elucidated to date.
The present study explored the prognostic role of
MTMR3 in breast cancer, and the effects of MTMR3 silencing in
MDA-MB-231 cells. The aim of the present study was to investigate
the clinical implication of MTMR3 and its potential biological or
functional mechanisms.
Materials and methods
Tissue specimen collection and
follow-up
A total of 172 patients were enrolled in the present
study. All samples were collected at Xiangya Hospital (Changsha,
China) between January 2013 and December 2013. For 52 of them,
paired primary tumor tissues and adjacent normal tissues (>5 cm
away from tumor area) were obtained. Formalin-fixed
paraffin-embedded (FFPE) tumor tissues from 120 patients that
underwent surgical removal were used to analyze MTMR3 protein
expression levels. These patients were divided into two groups:
Relapse group and non-relapse group. Relapse was defined as
metastases or local recurrence occurring within 5 years; the
terminal date for follow-up was January 2018. The
clinicopathological information was obtained from the patients'
records: age, pathology subtypes, status of ER, PR and HER2
expression levels, and clinical stage. All cases met the following
inclusion criteria: i) Histologically confirmed primary breast
cancer; ii) patients underwent surgery, following which there was
adequate specimen of tumor tissue; iii) no metastasis before
operation; iv) patient underwent full follow-up at the hospital
after treatment; and v) patients did not receive preoperative
chemotherapy, immunotherapy or radiotherapy. All samples were
evaluated and subjected to histological diagnosis by pathologists.
This study was approved by the Ethics Committee of the Xiangya
Hospital of Central South University and all patients provided
written informed consent.
Immunohistochemistry (IHC)
Staining of all the FFPE tissue sections (4-µm
thick) was performed as described previously (20). Briefly, following 4% paraformaldehyde
fixation for 24 h at room temperature, samples were embedded in
paraffin and sectioned at 4 µm. Sections of tumors were dewaxed
with xylenes and dehydrated in gradient ethanol, followed by
antigen retrieval in citrate antigen retrieval solution (cat. no.
P0081; Beyotime Institute of Biotechnology). Endogenous peroxidase
blocking buffer (100 µl; cat. no P0100A; Beyotime Institute of
Biotechnology) was added for 10 min to block the endogenous
peroxidase activity. Then, the sections were treated with 100 µl
blocking solution (cat. no. B10710; Invitrogen; Thermo Fisher
Scientific, Inc.) and covered with parafilm. Subsequently, the
sections were incubated with primary anti-MTMR3 antibody (1:100;
cat. no. 12443; Cell Signaling Technology, Inc.) overnight at 4°C.
After incubation with horseradish peroxidase (HRP)-conjugated
secondary antibody (1:5,000; cat. no. ab205718; Abcam) for 1 h at
room temperature, the slides were stained with diaminobenzidine
(cat. no. D3939; Sigma-Aldrich; Merck KGaA) for 60 min at room
temperature, followed by counterstaining with hematoxylin (cat. no.
C0107; Beyotime Institute of Biotechnology). The staining was
visualized using a light microscope (CKX41; Olympus Corporation) at
×100 and ×400 magnification. Positivity and intensity were assessed
by two independent pathologists in a blinded manner, according to a
previous report (21). The staining
intensity and proportion of immune reactive cells were scored, as
previously described (22).
Online overall survival analysis
Survival analysis for the MTMR3 gene in breast
cancer was performed using the PROGgeneV2 prognostic database
(http://genomics.jefferson.edu/proggene/) (18). This database includes the prognostic
data from The Cancer Genome Atlas (TCGA) and Gene Expression
Omnibus (GEO) databases, while providing an easy operator
interface. The following parameters were selected in the first
interface: ‘MTMR3’ in Single/multiple user input genes; ‘breast
cancer’ in cancer type; ‘death’ in survival measure; and ‘median’
in bifurcate gene expression. Then, in the second interface, all
the filters were selected, and the plot was created. According to
the median expression level of MTMR3 in breast cancer tissues, the
patient samples were classified into two groups, higher and lower
expression levels. The survival patient information, including 3
and 5 year-survival rates, was compared using Kaplan-Meier survival
curves.
Cell lines and culture
Human breast cancer cell lines MCF-7, T47D, BT474,
MDA-MB-231 and ZR-75-30, as well as human embryonic kidney 293T
cells, were purchased from The Cell Bank of Type Culture Collection
of the Chinese Academy of Sciences (Shanghai, China). The MCF-7,
BT474 and ZR-75-30 cell lines were maintained in RPMI-1640 medium
(Gibco; Thermo Fisher Scientific, Inc.) supplemented with 10% fetal
bovine serum (FBS; Thermo Fisher Scientific, Inc.). The T47D,
MDA-MB-231 and 293T cells were grown in DMEM (Sigma-Aldrich; Merck
KGaA) with 10% FBS. All cells were cultured in a humidified
atmosphere with 5% CO2 at 37°C.
Construction of recombinant lentivirus
vector and cell infection
The short hairpin (sh) RNA targeting MTMR3 (shMTMR3,
5′-CCAGTCGAGTATGCAAGTCTTGGTACCAAGACTTGCATACTCGACTGG-3′) and a
scrambled negative control shRNA (shCon,
5′-TTCTCCGAACGTGTCACGTCTCGAGACGTGACACGTTCGGAGAA-3′) were designed
using the sequence for the human MTMR3 mRNA under accession no.
NM_021090.3. The lentiviral vectors (transfer, pFH-L-GFP;
packaging, pVSVG-I and pCMVΔR8.92) were purchased from Shanghai
Holly Biotechnology Co., Ltd. The chemically synthesized
oligonucleotides were cloned into the lentivirus transfer vector,
and then co-transfected into 293T cells with the packing vectors,
using Lipofectamine 2000 (Thermo Fisher Scientific, Inc.),
following the manufacturer's protocol. At 48 h post-transfection,
the culture media were collected, filtered through a 45 µm filter
(EMD Millipore), and ultra-centrifuged at 100,000 × g at 4°C for 30
min. Finally, 200 µl concentrated lentiviral particles were
obtained. MDA-MB-231 cells, as the target cells, were seeded at
5×10⁴ cells/well in 6-well plates prior to transduction
with shMTMR3 or control lentiviral particles. Cells without
transduction served as the control (Con) group. The transfection
efficiency was monitored via green fluorescent protein (GFP)
expression.
RNA isolation, reverse transcription
and quantitative PCR (RT-qPCR)
Total RNA was extracted using TRIzol reagent (Thermo
Fisher Scientific, Inc.) at 4 days post-infection. Total RNA was
then treated with DNase (Ambion; Thermo Fisher Scientific, Inc.),
tested by agarose gel electrophoresis for its integrity, and
converted to cDNA using a RevertAid H Minus First Strand cDNA
Synthesis kit (Thermo Fisher Scientific, Inc.). qPCR was performed
on a Bio-Rad CFX-96 Real-Time PCR platform using SYBR Green
Supermix reagents (Bio-Rad Laboratories, Inc.). The primers were as
follows: MTMR3, 5′-AGCAGAGTGGGCTCAGTGTT-3′ (forward) and
5′-ACTGTCCACGTTTGGTCCTC-3′ (reverse); β-actin,
5′-GTGGACATCCGCAAAGAC-3′ (forward) and 5′-AAAGGGTGTAACGCAACTA-3′
(reverse). The thermocycling conditions were as follows: 95°C for 1
min for denaturation, followed by 40 cycles of 95°C for 5 sec and
60°C for 20 sec. Relative fold changes in mRNA expression were
calculated using the formula 2−ΔΔCq (23). β-actin was used as the internal
reference for normalization.
Western blotting
Protein sample preparation and western blot assay
were performed as previously described (24). The primary antibodies used were:
anti-MTMR3 (1:500; cat. no. 12443; Cell Signaling Technology,
Inc.), anti-Cyclin D1 (1:1,000; cat. no. 60186-1-1g; ProteinTech
Group, Inc.), anti-cyclin-dependent kinase 2 (1:1,000; CDK2; cat.
no. 11026-2-AP; ProteinTech Group, Inc.), anti-p62 (1:1,000; cat.
no. 19117-1-AP; ProteinTech Group, Inc.), anti-p21 (1:1,000; cat.
no. 2947; Cell Signaling Technology, Inc.), anti-Cyclin E (1:1,000;
cat. no. sc-247; Santa Cruz Biotechnology, Inc.), anti-Cyclin A
(1:1,000; cat. no. sc-751; Santa Cruz Biotechnology, Inc.),
anti-cell division cycle 25 A (1:1,000; cdc25A; sc-7157; Santa Cruz
Biotechnology, Inc.), anti-microtubule associated protein 1 light
chain 3 (LC3) A (1:500; cat. no. 4599; Cell Signaling Technology,
Inc.), anti-LC3B (1:500; cat. no. 3868; Cell Signaling Technology,
Inc.) and anti-GAPDH (1:20,000; cat. no. 10494-1-AP; ProteinTech
Group, Inc.). Bound HRP-labeled secondary antibody (1:5,000; cat.
no. SC-2005 or SC-2054; Santa Cruz Biotechnology, Inc.) was assayed
by super ECL detection reagent (Pierce; Thermo Fisher Scientific,
Inc.). Protein density of western blots was analyzed using ImageJ
1.51k software (National Institutes of Health).
MTT assay
MTT assay was performed to detect the effect of
MTMR3 knockdown on MDA-MB-231 cell viability. Briefly, Con, shCon
and shMTMR3 cells were seeded in 96-well plates at a density of
2.5×10³ cells/well and incubated for 5 days. At day 1,
2, 3, 4, and 5, 20 µl MTT solution (5 mg/ml; Sigma-Aldrich; Merck
KGaA) was added in each well and the cells were incubated for 4 h.
Then, 100 µl acidic isopropanol (10% SDS, 5% isopropanol and 0.01 M
HCl) was added to dissolve the purple formazan crystals. Finally,
the absorbance at 595 nm was measured with an ELISA reader (Bio-Rad
Laboratories, Inc.).
Colony formation assay
For colony formation assay, 400 cells per well were
seeded in 6-well plates and allowed to grow for 9 days. Wells
containing colonies were washed with PBS, fixed with
paraformaldehyde (3.7%) for 15 min, rinsed once more with PBS, and
then stained with crystal violet for 10 min. The excess stain was
removed by washing three times with ddH2O, and then the
colonies were photographed with a digital camera. The number of
cell colonies (>50 cells/colony) was manually counted using
ImageJ software.
Cell cycle phase distribution
analysis
For cell cycle distribution assay, transduced cells
were incubated into 6-cm dishes at a density of 1×10⁵
cells/dish. After 20 h of incubation, cells were digested with
trypsin, centrifuged, washed twice with cold PBS, and fixed in
pre-chilled 70% ethanol at −20°C overnight. Then, cells were washed
with PBS once again and stained with propidium iodide. Finally, the
cells were analyzed using a Cell Lab Quanta™ flow cytometer
(Beckman Coulter, Inc.) and the ModFit LT software (version
3.1.0.0; Verity Software House, Inc.).
Statistical analysis
All quantitative data were expressed as the mean ±
standard deviation from three independent experiments. For the IHC
results, P-values were calculated using the χ2 test and
Wilcoxon matched-pairs signed rank test. For the MTT and cell cycle
analysis experiments, two-way ANOVA with Dunnett's multiple
comparisons test was used. For the colony formation experiments,
one-way ANOVA with Dunnett's multiple comparisons test was used.
Statistical analyses were performed in GraphPad Prism (version 7.0,
GraphPad Software) or SPSS 13.0 software (SPSS, Inc.). P<0.05
was considered to indicate a statistically significant
difference.
Results
Correlation between MTMR3 expression
and survival in patients with BC
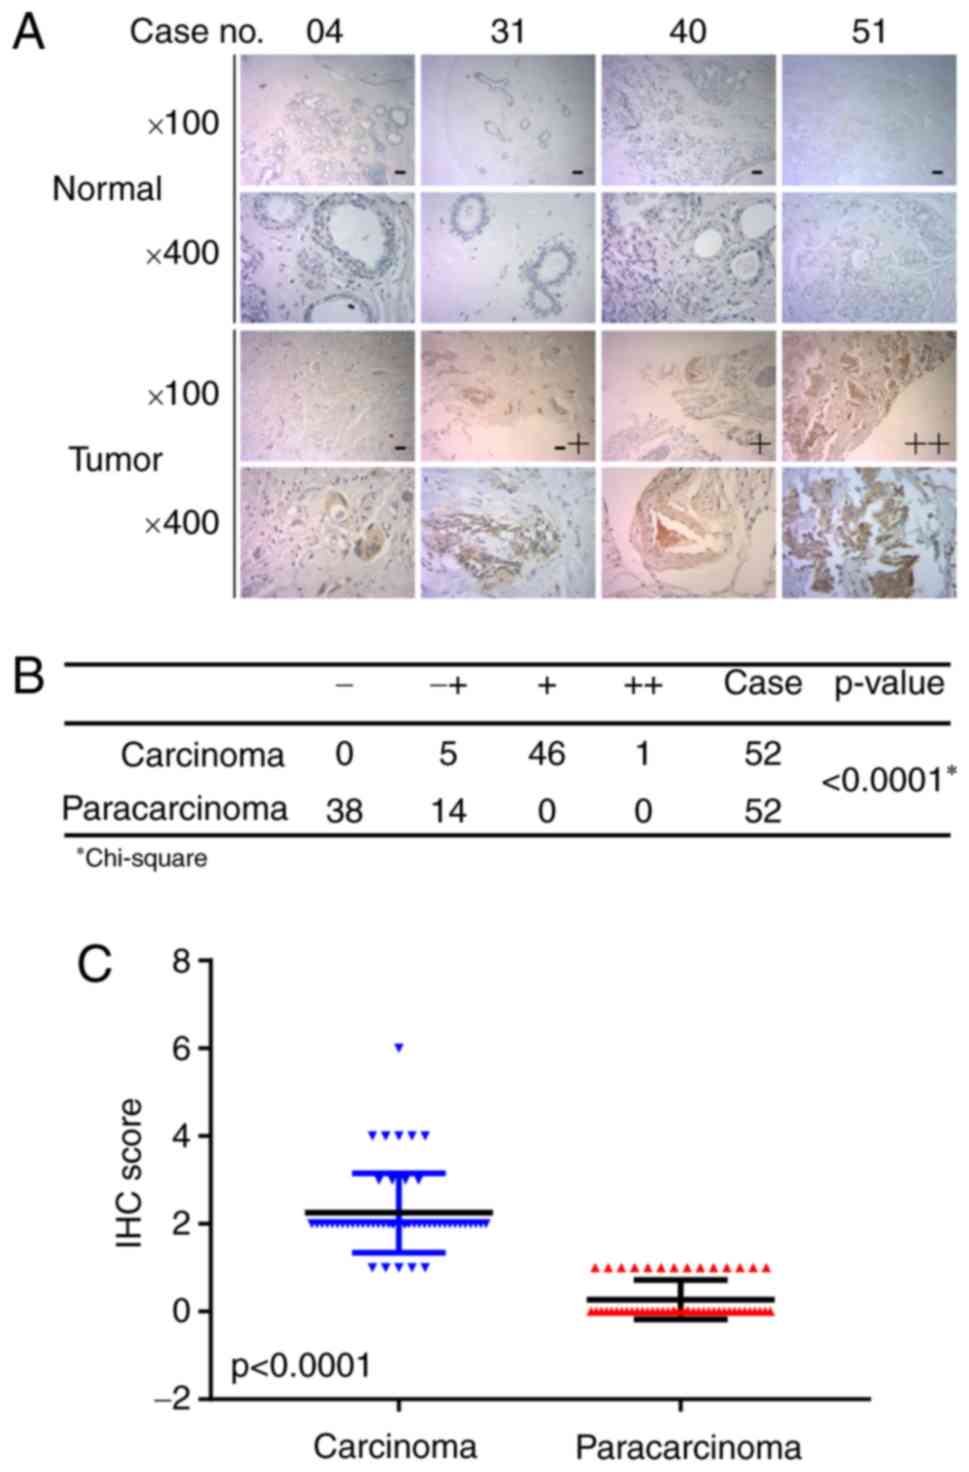
To explore the role of MTMR3 in breast cancer,
first, its expression in breast cancer tissues was assessed using
IHC. Fig. 1A presents representative
photomicrographs of four degrees of MTMR3 expression intensity.
Further analysis demonstrated that MTMR3 expression was
significantly higher in breast cancer tissues compared with
adjacent paracarcinoma tissues (Fig. 1B
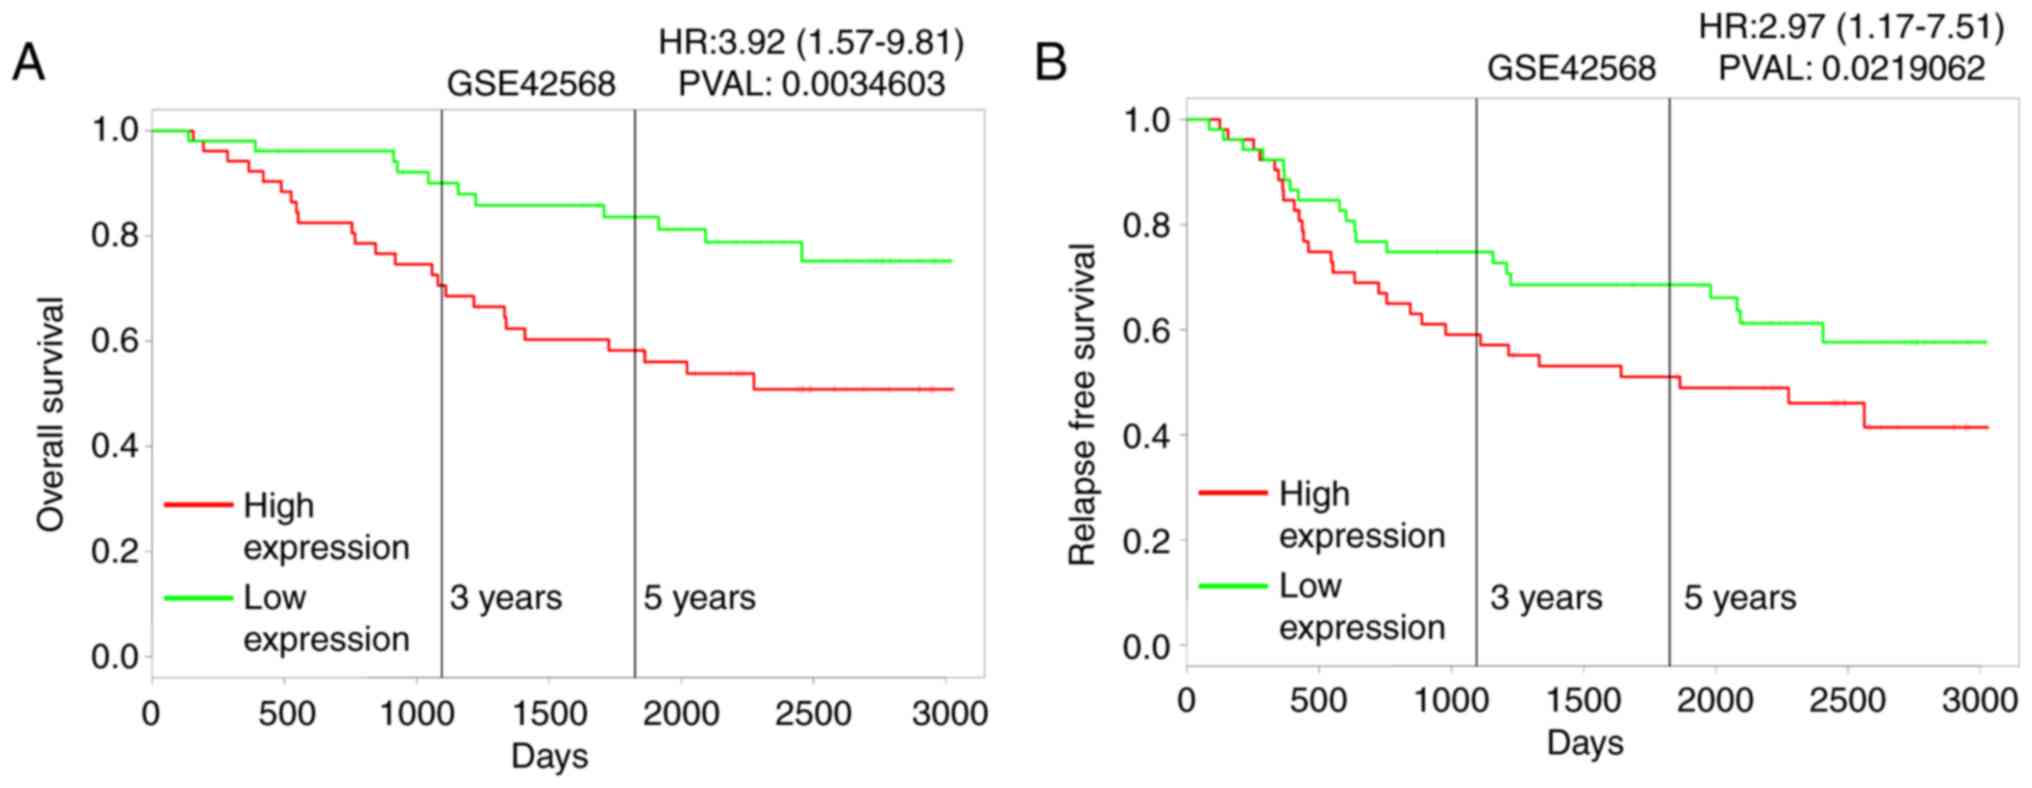
and C; P<0.001). Furthermore, the association between MTMR3
mRNA expression levels and overall survival (OS) in breast cancer
patients was analyzed using the publicly-available PROGgeneV2
prognostic database. The results revealed that high expression of
MTMR3 mRNA in breast cancer may be correlated with poor overall
survival (Fig. 2A; P=0.003), and
associated with poor relapse-free survival (Fig. 2B; P<0.02).
MTMR3 in predicting metastasis and
local recurrence of breast cancer
The clinical characteristics of 120 cases were
reviewed. The median follow-up time was 52 months. The expression
score of 2 (≤2 vs. >2), as optimal cut-off value for MTMR3
evaluation, was determined by receiver operating characteristic
(ROC) curve estimation, giving the score closest to the point of
maximum Youden's index. Based on the outcome of patients, all
samples were divided into two groups. To elucidate whether MTMR3
expression was associated to relapse, χ2 univariate
analysis was applied (Table I). The
results demonstrated that there were no significant differences in
5-years relapse between PR (P=0.102), HER2 (P=0.115) status and age
(P=0.633). By contrast, MTMR3 expression (P=0.038), ER status
(P=0.031), and clinical stage (P=0.004) were strongly associated
with disease recurrence. Thus, these three variables were included
in multivariate logistic regression model. As described in Table II, although there was no significant
association between MTMR3 expression and recurrence of breast
cancer, lower expression conferred a moderate reduction in relapse
during a 5-year period (OR=0.412, 95% CI=0.158–1.075, P=0.070). In
addition, because of the observation that ER expression and
clinical stage were strongly associated with clinical outcome, it
was speculated that MTMR3 may be a predictor for recurrence of
breast cancer due to other prognostic factors. To examine this
possibility, Spearman rank correlation analysis was performed.
Notably, MTMR3 expression was demonstrated to have significant
positive correlation with the TNBC subtype (r=0.209, P=0.022;
Table III). However, there was no
correlation between MTMR3 staining and ER, PR and HER2 expression
or clinical stage (Table III).
 | Table I.Univariate analysis for recurrence
within 5 years in relation to predictive factors. |
Table I.
Univariate analysis for recurrence
within 5 years in relation to predictive factors.
| Variable | Relapse | Non-relapse | χ2 | P-value |
|---|
| Age (years) |
|
|
|
|
|
<50 | 30 | 45 | 0.229 | 0.633 |
|
≥50 | 20 | 25 |
|
|
| Clinical stage |
|
|
|
|
|
I–II | 25 | 53 | 8.477 | 0.004 |
|
III–IV | 25 | 17 |
|
|
| ER status |
|
|
|
|
|
Negative | 30 | 28 | 4.672 | 0.031 |
|
Positive | 20 | 42 |
|
|
| PR status |
|
|
|
|
|
Negative | 29 | 30 | 2.676 | 0.102 |
|
Positive | 21 | 40 |
|
|
| HER2 status |
|
|
|
|
|
Negative | 28 | 29 | 2.483 | 0.115 |
|
Positive | 22 | 41 |
|
|
| MTMR3
expression |
|
|
|
|
|
Low | 8 | 23 | 4.326 | 0.038 |
|
High | 42 | 47 |
|
|
| Table II.Results from multivariate logistic
regression analyses comparing selected variables. |
Table II.
Results from multivariate logistic
regression analyses comparing selected variables.
| Variable | Odds ratio | 95% confidence
interval | P-value |
|---|
| Clinical stage
(I–II vs. III) | 0.295 | 0.129–0.672 | 0.004 |
| ER status (negative
vs. positive) | 2.643 | 1.192–5.864 | 0.017 |
| MTMR3 expression
(low vs. high) | 0.412 | 0.158–1.075 | 0.070 |
| Table III.Spearman rank correlation analysis of
MTMR3 expression and clinical features. |
Table III.
Spearman rank correlation analysis of
MTMR3 expression and clinical features.
| Clinical
features | ER | PR | HER2 | TNBC | Clinical stage |
|---|
| Correlation
coefficient (r) | −0.66 | −0.162 | −0.37 | 0.209 | 0.074 |
| P-value | 0.475 | 0.078 | 0.685 | 0.022 | 0.423 |
MTMR3 knockdown suppresses cell
proliferation and colony formation
As presented in Fig.
3A, all five breast cancer cell lines tested in the present
study expressed the MTMR3 protein. The MDA-MB-231 cell line had the
highest level of MTMR3 expression, and it belongs in the TNBC
subtype, thus, it was selected in the present study for subsequent
loss-of-function experiments. MTMR3 was silenced in MDA-MB-231
cells via lentiviral shRNA transduction. The efficacy of MTMR3
knockdown was determined by RT-qPCR analysis (Fig. 3B); the mRNA expression levels of MTMR3
was significantly decreased in the shMTMR3 group compared with the
shCon group (P<0.001). Western blotting further confirmed the
successful knockdown of MTMR3 in MDA-MB-231 cells (Fig. 3C).
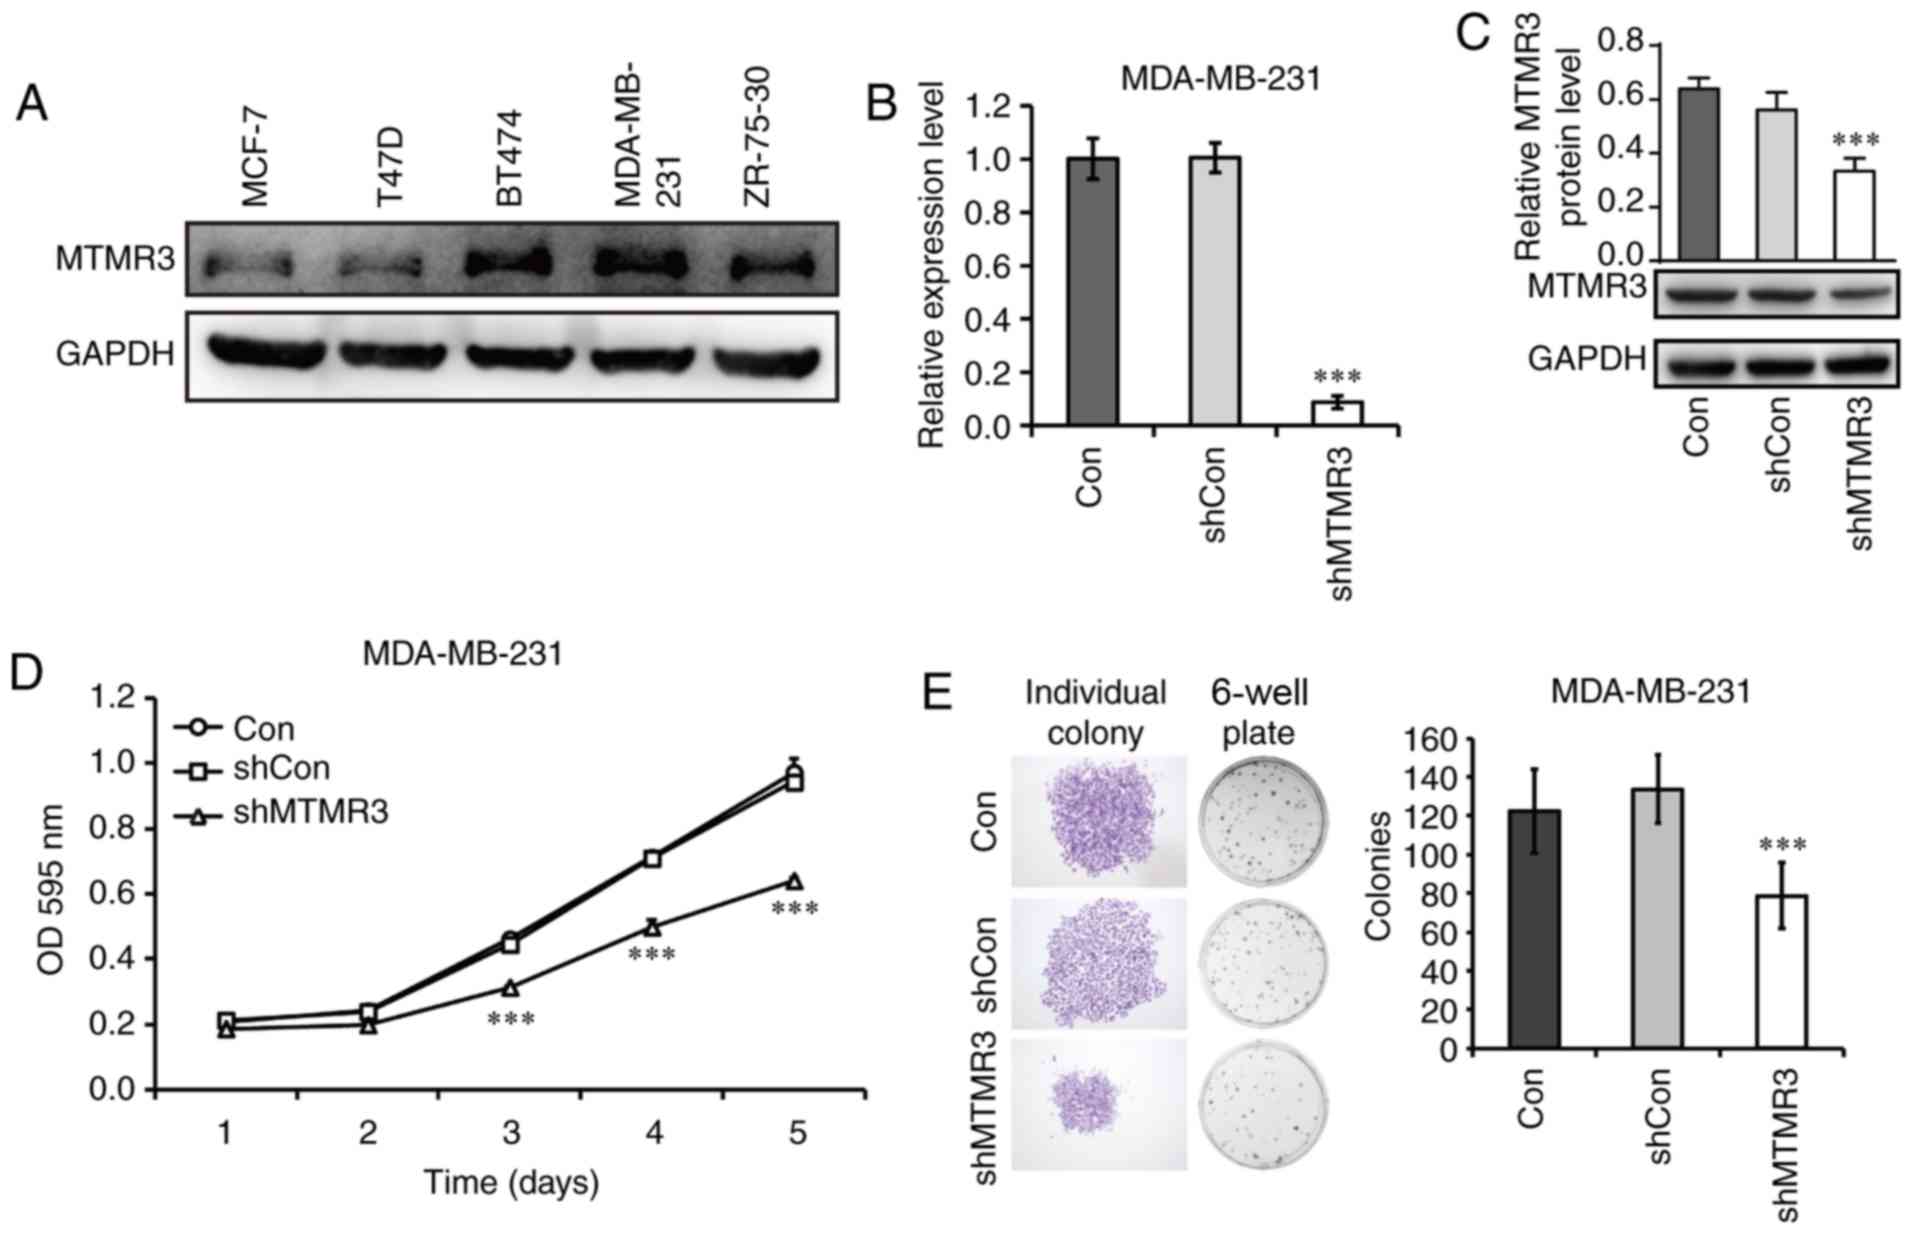 | Figure 3.Knockdown of MTMR3 suppresses the
proliferative and colony formation capacities of MDA-MB-231 cells.
(A) Western blot analysis of MTMR3 protein expression in five
different breast cancer cell lines. (B) MTMR3 mRNA expression
levels detected in shMTMR3, shCon, and Con MDA-MB-231 cells. (C)
Western blot analysis of MTMR3 knockdown efficacy in MDA-MB-231
cells. (D) Comparative growth curves of tumor cells in the Con,
shCon and shMTMR3 groups, as measured by MTT assay. (E)
Representative images of formed colonies and statistical analysis
of colony numbers in the Con, shCon, and shMTMR3 groups.
Representative images of individual colonies in each group were
captured at magnification ×40. Three independent experiments were
performed. ***P<0.001 vs. shCon. MTMR3, myotubularin related
protein 3; sh, short hairpin; Con, control; OD, optical
density. |
Next, the functional role of MTMR3 was explored. The
proliferative capability was determined by MTT assay. MTMR3
knockdown resulted in a significant decrease in cell numbers in a
time-dependent manner (Fig. 3D;
P<0.001). However, no change in cell numbers was observed in
cells infected with a control lentivirus compared with untreated
cells. In addition, the clone-forming capacity of MDA-MB-231 cells
was evaluated in the three experimental groups (shMTMR3, shCon and
Con). This assay represents the ability to sustain cell growth
without contact attenuation (25). As
presented in Fig. 3E, the single
colony size and the numbers of total colonies formed were reduced
in MTMR3-silenced cells compared with control cells (P<0.001).
These results indicated that MTMR3 may have important roles in the
tumorigenesis of breast cancer cells.
MTMR3 regulates cell cycle progression
and autophagy-related protein expression
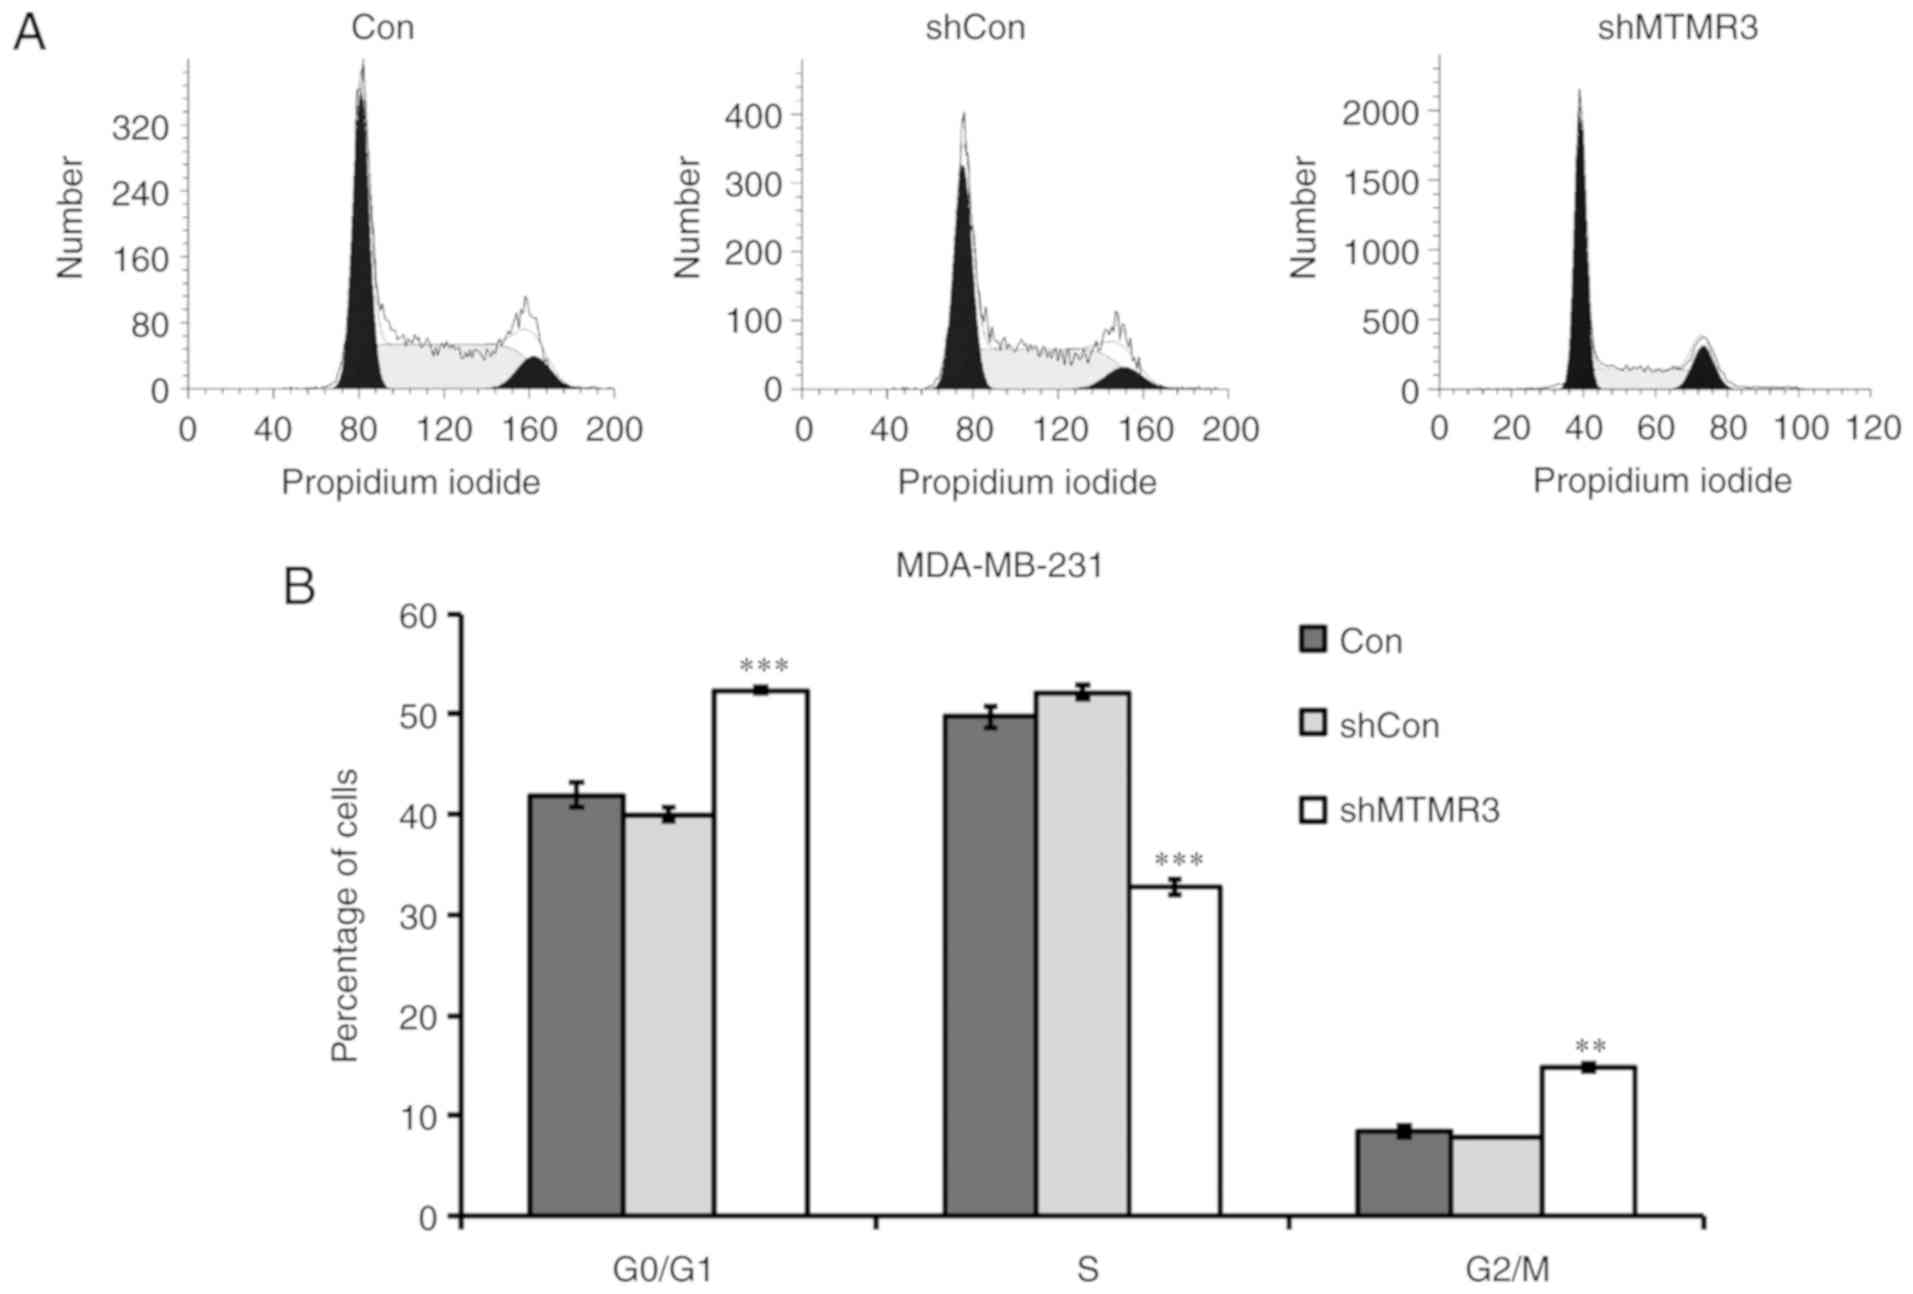
To explore the potential molecular mechanism of cell
growth inhibition induced by MTMR3 knockdown, flow cytometry was
conducted to determine the cell cycle distribution. Compared with
shCon or Con groups, the percentage of shMTMR3-cells in the G0/G1
phase and G2/M phase were significantly increased, while they were
significantly decreased in the S phase (Fig. 4A and B). These results suggested that
MTMR3 knockdown resulted in disturbed cell cycle progression,
thereby contributing to the decline in cell proliferation and
colony formation. Furthermore, the protein expression levels of
several cell cycle regulators were detected in MDA-MB-231 cells
using western blotting. As presented in Fig. 4C, MTMR3 knockdown markedly elevated
the expression of p21 and Cyclin A, but reduced the expression of
cdc25A and Cyclin E. The protein expression levels of CDK2 were
slightly increased in the shMTMR3 group compared with the shCon
group (Fig. 4C).
In addition to cell cycle progression, autophagy is
closely associated with the regulation of cell survival control
(26). Therefore, it was speculated
that MTMR3 knockdown may affect cell autophagy in MDA-MB-231 cells.
As presented in Fig. 4D, MTMR3
knockdown induced a significant increase in the LC3-II/LC3-I ratio
and a reduction in p62, which suggested that MTMR3 knockdown
induced autophagy in MDA-MB-231 cells.
Discussion
Breast cancer is the most common malignancy among
women. Large numbers of research publications have indicated the
essential roles of numerous genes in growth and viability of breast
cancer cells (27,28). The present study indicated that high
expression levels of MTMR3 may have negative effects on overall
survival and relapse-free survival in patients with breast cancer.
Next, the MTMR3 protein expression levels were detected in two
different groups of patients by IHC. The results of univariate
analysis revealed a significant association of MTMR3 protein
expression with cancer relapse within 5 years; however,
multivariate analysis revealed that MTMR3 expression was not a
significant independent prognostic factor. This negative result may
be due to low sample size and follow-up time. Of note, MTMR3
expression was demonstrated to be positively correlated with TNBC,
which is known to be enriched for genes involved in metastasis or
recurrence-associated signaling pathways.
Notably, MTMR3 acts as a dual function regulatory
molecule to attenuate or enhance tumor growth in different types of
cancer. Briefly, lack of MTMR3 significantly repressed the
proliferative, migratory and invasive potential of oral cancer
cells (15), while MTMR3 exogenous
expression inhibited the clonal growth of transfected lung
carcinoma cells (29). In order to
reveal the phenotypes of MTMR3 in TNBC cells, MTMR3 was silenced in
the MDA-MB-231 cell line, which had high expression of MTMR3, via
shRNA. The results revealed that MTMR3 knockdown resulted in
suppressed proliferation and colony formation, suggesting that
MTMR3 may exert protumor activity in TNBC cells.
Dysregulation of cell cycle progression is a key
intrinsic factor in driving tumorigenesis (30). In the present study, MTMR3 knockdown
resulted in an increase of cells in the G0/G1 and G2/M phases and a
decrease of cells in the S phase, suggesting that MTMR3 has a role
in cell cycle. Based on the present findings, a mechanism of
proliferation and colony formation inhibition induced by knockdown
of MTMR3 may be mediated through G0/G1 cell cycle arrest. In
addition, the molecular mechanism of this phenotype was explored
via western blot analysis, and the results revealed increased
expression of p21, Cyclin A and CDK2, and suppressed expression of
cdc25A and Cyclin E, following MTMR3 silencing. The decision for a
cell to exit from G1 and enter into the S phase is closely
controlled by these genes (31,32).
Adenovirus-mediated overexpression of p21 can prevent proliferation
of rat vascular smooth muscle cells (33). Lim et al (34) demonstrated that knockdown of
metallothionein-2A abrogated cell growth via prevention of G1 to S
phase transition though upregulation of ataxia telangiectasia
mutated and downregulation of cdc25A. It was reported that
E2F-induced cell growth can be inhibited by miR-15 and miR-16, due
to their role in downregulating Cyclin E (35). Suppression of CDK2 and CDK4 is
responsible for attenuation of cell proliferation mediated by
C/EBPα (36). By contrast, the
activation of CyclinA/CDK2 complex is considered a key factor for
primary lung cancer cell proliferation (37). The present results suggested that
knockdown of MTMR3 repressed the proliferation and colony formation
of MDA-MB-231 cells via blocking G1-to-S transition through effects
on regulators of S-phase entry, p21, cdc25A, Cyclin E, Cyclin A and
CDK2.
Autophagy is a cellular degradation process that has
an important role in tumor development, progression and therapy
response (38–40). Activation of autophagy may prolong
survival of tumor cells, and paradoxically, a defect in autophagy
may also have a role in carcinogenesis and tumor progression
(41). A previous study has reported
that MTMR3 is an autophagy-related molecule that participates in
initiation of autophagy (42).
Taguchi-Atarashi et al (19)
demonstrated that specific knockdown of MTMR3 enhanced
autophagosome formation, which was modulated by local levels of
Ptdlns3P. Conversely, MTMR3 caused a reduced autophagic activity
and smaller nascent autophagosomes when overexpressed (19). LC3A and LC3B are widely used as
autophagy biomarkers, and the type I (16 kDa) is converted to type
II (14 kDa) (43). A significant
upregulation in the LC3-II/LC3-I ratio was observed in the present
study following MTMR3 knockdown, implying an activation of
autophagy. A previous study has reported that autophagy suppresses
carcinogenesis via elimination of p62, a multidomain protein
(44). In the present study,
downregulation of p62 was observed in the MTMR3-knockdown group.
Based on the present results, MTMR3 knockdown inducing activation
of autophagy may be related to the decreased proliferation and
colony formation in MDA-MB-231 cells. One of the limitations of the
present study is that experiments were performed only in
vitro and only in one cell line; therefore, further studies are
needed with additional cell lines and in vivo models to
confirm these results.
In conclusion, the present study demonstrated that
high levels of MTMR3 were associated with relapse-free survival and
the TNBC subtype, as well as with a protumorigenic function in
human breast cancer cells. Knockdown of MTMR3 suppressed
proliferation and colony formation through cell cycle arrest and
autophagy in MDA-MB-231 cells. These results provided novel
insights into the pathological mechanism of breast cancer and may
facilitate the exploration of novel therapeutic targets.
Acknowledgments
Not applicable.
Funding
This study was supported by grants from the National
Natural Science Foundation of China (grant nos. 81572612, 81372842
and 81803640), the Hunan Provincial Natural Science Foundation
(grant no. 2015JJ2183), the Youth Science Foundation of Xiangya
Hospital, Central South University (grant no. 2017Q02) and the
Research Innovation Program for Graduate Students of Central South
University (grant no. 2018zzts912). This study was also supported
by the National Key Clinical Specialist Construction Programs of
China (grant no. 2014kll).
Availability of data and materials
The datasets used and analyzed during the current
study are available from the corresponding author on reasonable
request.
Authors' contributions
ZW, RS, WBZ and LQS conceived and designed the
experiments. ZW and RS performed the experiments. ZW and YJW
analyzed the data. MZ, JC and JH collected the clinical samples and
clinical data. ZW wrote the manuscript. ZW, JC, LQS and WBZ
reviewed/edited the manuscript. All authors read and approved the
final manuscript.
Ethics approval and consent to
participate
This study was approved by the Ethics Committee of
the Xiangya Hospital of Central South University. All of the
patients provided written informed consent.
Patient consent for publication
Not applicable.
Competing interests
The authors declare that they have no competing
interests.
References
|
1
|
DeSantis C, Ma J, Bryan L and Jemal A:
Breast cancer statistics, 2013. CA Cancer J Clin. 64:52–62. 2014.
View Article : Google Scholar : PubMed/NCBI
|
|
2
|
Alkabban FM and Ferguson T: Cancer,
breastStatPearls. Treasure; Island (FL): 2019
|
|
3
|
Jemal A, Bray F, Center MM, Ferlay J, Ward
E and Forman D: Global cancer statistics. CA Cancer J Clin.
61:69–90. 2011. View Article : Google Scholar : PubMed/NCBI
|
|
4
|
Siegel RL, Miller KD and Jemal A: Cancer
statistics, 2019. CA Cancer J Clin. 69:7–34. 2019. View Article : Google Scholar : PubMed/NCBI
|
|
5
|
Guan X, Liu Z, Zhao Z, Zhang X, Tao S,
Yuan B, Zhang J, Wang D, Liu Q and Ding Y: Emerging roles of
low-density lipoprotein in the development and treatment of breast
cancer. Lipids Health Dis. 18:1372019. View Article : Google Scholar : PubMed/NCBI
|
|
6
|
Parise CA and Caggiano V: Risk of
mortality of node-negative, ER/PR/HER2 breast cancer subtypes in
T1, T2, and T3 tumors. Breast Cancer Res Treat. 165:743–750. 2017.
View Article : Google Scholar : PubMed/NCBI
|
|
7
|
Dent R, Trudeau M, Pritchard KI, Hanna WM,
Kahn HK, Sawka CA, Lickley LA, Rawlinson E, Sun P and Narod SA:
Triple-negative breast cancer: Clinical features and patterns of
recurrence. Clin Cancer Res. 13:4429–4434. 2007. View Article : Google Scholar : PubMed/NCBI
|
|
8
|
Santuario-Facio SK, Cardona-Huerta S,
Perez-Paramo YX, Trevino V, Hernandez-Cabrera F, Rojas-Martinez A,
Uscanga-Perales G, Martinez-Rodriguez JL, Martinez-Jacobo L,
Padilla-Rivas G, et al: A new gene expression signature for triple
negative Breast cancer using frozen fresh tissue before neoadjuvant
chemotherapy. Mol Med. 23:101–111. 2017. View Article : Google Scholar : PubMed/NCBI
|
|
9
|
Clague MJ and Lorenzo O: The myotubularin
family of lipid phosphatases. Traffic. 6:1063–1069. 2005.
View Article : Google Scholar : PubMed/NCBI
|
|
10
|
Lorenzo O, Urbé S and Clague MJ: Analysis
of phosphoinositide binding domain properties within the
myotubularin-related protein MTMR3. J Cell Sci. 118:2005–2012.
2005. View Article : Google Scholar : PubMed/NCBI
|
|
11
|
Clarke JH, Letcher AJ, D'Santos C S,
Halstead JR, Irvine RF and Divecha N: Inositol lipids are regulated
during cell cycle progression in the nuclei of murine
erythroleukaemia cells. Biochem J. 357:905–910. 2001. View Article : Google Scholar : PubMed/NCBI
|
|
12
|
Lin Y, Zhao J, Wang H, Cao J and Nie Y:
miR-181a modulates proliferation, migration and autophagy in AGS
gastric cancer cells and downregulates MTMR3. Mol Med Rep.
15:2451–2456. 2017. View Article : Google Scholar : PubMed/NCBI
|
|
13
|
Zheng B, Yu X and Chai R:
Myotubularin-related phosphatase 3 promotes growth of colorectal
cancer cells. ScientificWorldJournal. 2014:7038042014. View Article : Google Scholar : PubMed/NCBI
|
|
14
|
Oppelt A, Haugsten EM, Zech T, Danielsen
HE, Sveen A, Lobert VH, Skotheim RI and Wesche J: PIKfyve, MTMR3
and their product PtdIns5P regulate cancer cell migration and
invasion through activation of Rac1. Biochem J. 461:383–390. 2014.
View Article : Google Scholar : PubMed/NCBI
|
|
15
|
Kuo YZ, Tai YH, Lo HI, Chen YL, Cheng HC,
Fang WY, Lin SH, Yang CL, Tsai ST and Wu LW: MiR-99a exerts
anti-metastasis through inhibiting myotubularin-related protein 3
expression in oral cancer. Oral Dis. 20:e65–e75. 2014. View Article : Google Scholar : PubMed/NCBI
|
|
16
|
Gong Y, He T, Yang L, Yang G, Chen Y and
Zhang X: The role of miR-100 in regulating apoptosis of breast
cancer cells. Sci Rep. 5:116502015. View Article : Google Scholar : PubMed/NCBI
|
|
17
|
Kuma A, Matsui M and Mizushima N: LC3, an
autophagosome marker, can be incorporated into protein aggregates
independent of autophagy: Caution in the interpretation of LC3
localization. Autophagy. 3:323–328. 2007. View Article : Google Scholar : PubMed/NCBI
|
|
18
|
Yang ZJ, Chee CE, Huang S and Sinicrope
FA: The role of autophagy in cancer: Therapeutic implications. Mol
Cancer Ther. 10:1533–1541. 2011. View Article : Google Scholar : PubMed/NCBI
|
|
19
|
Taguchi-Atarashi N, Hamasaki M, Matsunaga
K, Omori H, Ktistakis NT, Yoshimori T and Noda T: Modulation of
local PtdIns3P levels by the PI phosphatase MTMR3 regulates
constitutive autophagy. Traffic. 11:468–478. 2010. View Article : Google Scholar : PubMed/NCBI
|
|
20
|
Zhou W, Guan X, Wang L, Liao Y and Huang
J: p12(CDK2-AP1) inhibits breast cancer cell proliferation and in
vivo tumor growth. J Cancer Res Clin Oncol. 138:2085–2093. 2012.
View Article : Google Scholar : PubMed/NCBI
|
|
21
|
Yoshikawa D, Ojima H, Iwasaki M, Hiraoka
N, Kosuge T, Kasai S, Hirohashi S and Shibata T:
Clinicopathological and prognostic significance of EGFR, VEGF, and
HER2 expression in cholangiocarcinoma. Br J Cancer. 98:418–425.
2008. View Article : Google Scholar : PubMed/NCBI
|
|
22
|
Wang Z, Chen J, Zhong MZ, Huang J, Hu YP,
Feng DY, Zhou ZJ, Luo X, Liu ZQ, Jiang WZ and Zhou W:
Overexpression of ANLN contributed to poor prognosis of
anthracycline-based chemotherapy in breast cancer patients. Cancer
Chemother Pharmacol. 79:535–543. 2017. View Article : Google Scholar : PubMed/NCBI
|
|
23
|
Livak KJ and Schmittgen TD: Analysis of
relative gene expression data using real-time quantitative PCR and
the 2(-Delta Delta C(T)) method. Methods. 25:402–408. 2001.
View Article : Google Scholar : PubMed/NCBI
|
|
24
|
Zhou W, Wang Z, Shen N, Pi W, Jiang W,
Huang J, Hu Y, Li X and Sun L: Knockdown of ANLN by lentivirus
inhibits cell growth and migration in human breast cancer. Mol Cell
Biochem. 398:11–19. 2015. View Article : Google Scholar : PubMed/NCBI
|
|
25
|
Ma D, Fang Q, Li Y, Wang J, Sun J, Zhang
Y, Hu X, Wang P and Zhou S: Crucial role of heme oxygenase-1 in the
sensitivity of acute myeloid leukemia cell line Kasumi-1 to ursolic
acid. Anticancer Drugs. 25:406–414. 2014. View Article : Google Scholar : PubMed/NCBI
|
|
26
|
Swart C, Du TA and Loos B: Autophagy and
the invisible line between life and death. Eur J Cell Biol.
95:598–610. 2016. View Article : Google Scholar : PubMed/NCBI
|
|
27
|
Odle TG: Precision medicine in breast
cancer. Radiol Technol. 88:M401–M421. 2017.
|
|
28
|
Weaver O and Leung JWT: Biomarkers and
imaging of breast cancer. AJR Am J Roentgenol. 210:271–278. 2018.
View Article : Google Scholar : PubMed/NCBI
|
|
29
|
Yoo YD, Cho SM, Kim JS, Chang YS, Ahn CM
and Kim HJ: The human myotubularin-related protein suppresses the
growth of lung carcinoma cells. Oncol Rep. 12:667–671.
2004.PubMed/NCBI
|
|
30
|
Wang YC, Yang X, Xing LH and Kong WZ:
Effects of SAHA on proliferation and apoptosis of hepatocellular
carcinoma cells and hepatitis B virus replication. World J
Gastroenterol. 19:5159–5164. 2013. View Article : Google Scholar : PubMed/NCBI
|
|
31
|
Gartel AL, Serfas MS and Tyner AL:
p21-negative regulator of the cell cycle. Proc Soc Exp Biol Med.
213:138–149. 1996. View Article : Google Scholar : PubMed/NCBI
|
|
32
|
Tan Y, Sun D, Jiang W, Klotz-Noack K,
Vashisht AA, Wohlschlegel J, Widschwendter M and Spruck C:
PP2A-B55β antagonizes cyclin E1 proteolysis and promotes its
dysregulation in cancer. Cancer Res. 74:2006–2014. 2014. View Article : Google Scholar : PubMed/NCBI
|
|
33
|
Chang MW, Barr E, Lu MM, Barton K and
Leiden JM: Adenovirus-mediated over-expression of the
cyclin/cyclin-dependent kinase inhibitor, p21 inhibits vascular
smooth muscle cell proliferation and neointima formation in the rat
carotid artery model of balloon angioplasty. J Clin Invest.
96:2260–2268. 1995. View Article : Google Scholar : PubMed/NCBI
|
|
34
|
Lim D, Jocelyn KM, Yip GW and Bay BH:
Silencing the Metallothionein-2A gene inhibits cell cycle
progression from G1- to S-phase involving ATM and cdc25A signaling
in breast cancer cells. Cancer Lett. 276:109–117. 2009. View Article : Google Scholar : PubMed/NCBI
|
|
35
|
Ofir M, Hacohen D and Ginsberg D: MiR-15
and miR-16 are direct transcriptional targets of E2F1 that limit
E2F-induced proliferation by targeting cyclin E. Mol Cancer Res.
9:440–447. 2011. View Article : Google Scholar : PubMed/NCBI
|
|
36
|
Wang H, Iakova P, Wilde M, Welm A, Goode
T, Roesler WJ and Timchenko NA: C/EBPalpha arrests cell
proliferation through direct inhibition of Cdk2 and Cdk4. Mol Cell.
8:817–828. 2001. View Article : Google Scholar : PubMed/NCBI
|
|
37
|
Dobashi Y, Shoji M, Jiang SX, Kobayashi M,
Kawakubo Y and Kameya T: Active cyclin A-CDK2 complex, a possible
critical factor for cell proliferation in human primary lung
carcinomas. Am J Pathol. 153:963–972. 1998. View Article : Google Scholar : PubMed/NCBI
|
|
38
|
Grander D and Panaretakis T: Autophagy:
Cancer therapy's friend or foe? Future Med Chem. 2:285–297. 2010.
View Article : Google Scholar : PubMed/NCBI
|
|
39
|
Duan X, Chen B, Cui Y, Zhou L, Wu C, Yang
Z, Wen Y, Miao X, Li Q, Xiong L and He J: Ready player one?
Autophagy shapes resistance to photodynamic therapy in cancers.
Apoptosis. 23:587–606. 2018. View Article : Google Scholar : PubMed/NCBI
|
|
40
|
Xu Z, Yan Y, Zeng S, Qian L, Dai S, Xiao
L, Wang L, Yang X, Xiao Y and Gong Z: Reducing autophagy and
inducing G1 phase arrest by aloperine enhances radio-sensitivity in
lung cancer cells. Oncol Rep. Jun 19–2017.(Epub ahead of print)
doi: 10.3892/or.2017.5732. View Article : Google Scholar
|
|
41
|
Mathew R, Karantza-Wadsworth V and White
E: Role of autophagy in cancer. Nature reviews Cancer. 7:961–967.
2007. View Article : Google Scholar : PubMed/NCBI
|
|
42
|
Roberts R and Ktistakis NT: Omegasomes:
PI3P platforms that manufacture autophagosomes. Essays Biochem.
55:17–27. 2013. View Article : Google Scholar : PubMed/NCBI
|
|
43
|
Fernández-Araujo A, Sánchez JA, Alfonso A,
Vieytes MR and Botana LM: Different toxic effects of YTX in tumor
K-562 and lymphoblastoid cell lines. Front Pharmacol. 6:1242015.
View Article : Google Scholar : PubMed/NCBI
|
|
44
|
Lamark T, Svenning S and Johansen T:
Regulation of selective autophagy: The p62/SQSTM1 paradigm. Essays
Biochem. 61:609–624. 2017. View Article : Google Scholar : PubMed/NCBI
|