Introduction
Gastric cancer is the fourth most common type of
cancer and the second leading cause of cancer-related mortality
worldwide (1). The etiology of
gastric cancer is complex and its clinical symptoms are atypical
(2,3).
Due to the lack of early diagnosis, the majority of patients with
gastric cancer are at advanced stage at the time of treatment and
have missed the opportunity to undergo curative surgery. In
addition, these patients are at high risk for local recurrence and
distant metastases, and have worse prognosis and survival.
Therefore, gastric cancer is associated with significant disease
burden (4–6).
At present, the majority of patients with advanced
and metastatic gastric cancer receive chemotherapy. Oxaliplatin
(OXA) is a third-generation platinum drug that inhibits DNA
replication and transcription. This drug has been widely used to
treat malignant tumors of the gastrointestinal tract (7). However, the use of OXA as a
chemotherapeutic drug is associated with certain disadvantages.
Long-term treatment can reduce the initial therapeutic effect of
OXA by increasing the risk of adverse effects and the occurrence of
multidrug resistance (8). Therefore,
identifying a new combination therapy for gastric cancer has become
a research hotspot.
Anticancer bioactive peptides (ACBP) are novel
antitumor agents isolated from goat liver that have been found to
contain a mixture of peptides with molecular weights of ~8 kDa,
including ubiquitin proteases and fatty acid-binding proteins. ACBP
do not interfere with normal physiological functions and enzymatic
reactions in vivo. Previous studies have demonstrated that
ACBP effectively inhibit tumor cell proliferation in the stomach,
nasopharynx and gallbladder (9–11).
The combination of ACBP with low-dose cisplatin can
achieve the same therapeutic effect as continuous high-dose
cisplatin treatment, which effectively reduces the dosage of
cisplatin and the possibility of drug resistance (12). Moreover, the combination of ACBP with
OXA inhibits proliferation, induces apoptosis, and causes an
irreversible arrest of MKN-45 cells in the G2/M phase of the cell
cycle. In addition, ACBP-OXA significantly improves the survival
rate and inhibits the tumor formation ability in vivo
(13,14). Therefore, ACBP-OXA may be used as a
new strategy for gastric cancer treatment (13). However, the mechanisms underlying the
therapeutic effect of ACBP-OXA in gastric cancer have yet to be
fully elucidated.
In the era of post-genomics, proteins, as
participants in life activities and executants of biological
functions, have been widely investigated. High-throughput
proteomics technologies may lead to more accurate identification of
diagnostic and prognostic biomarkers by comprehensively analyzing
the differential expression levels, interactions and
post-translational modifications of proteins. Isobaric tag for
relative and absolute quantitation (iTRAQ), as the latest
high-throughput proteomics technique, may be useful for screening
and identifying drug-targeting proteins in cancer cells (15–17).
MKN-45 is a tumorigenic human gastric cancer cell
line that is resistant to chemotherapy and radiotherapy and
exhibits stem-cell characteristics due to its self-renewal and
proliferation abilities (18). In the
present study, iTRAQ technology was used to perform a comprehensive
proteomics analysis of MKN-45 cells treated with a combination of
ACBP and OXA. In addition, bioinformatics and functional analyses,
such as Gene Ontology (GO) annotation, Kyoto Encyclopedia of Genes
and Genomes (KEGG) pathway analysis, cluster analysis and
protein-protein interaction (PPI) network analysis, were used to
analyze the proteomics data. Furthermore, the proteomics results
were verified by parallel reaction monitoring (PRM) of selected
target proteins. The results of the present study may provide a
basis for further research on the role of ACBP-OXA in the treatment
of gastric cancer and introduce a basis for the clinical
application of combined ACBP-OXA therapy in gastric cancer.
Materials and methods
Cell culture
The human gastric cancer cell line MKN-45 was
purchased from the Cell Resource Center, Institute of Basic Medical
Sciences, Chinese Academy of Sciences, Peking Union Medical
College. Cell culture was performed at the Clinical Medical
Research Center of the Inner Mongolia Medical University. MKN-45
cells were cultured in RPMI-1640 medium (Invitrogen; Thermo Fisher
Scientific, Inc.) with 10% fetal bovine serum (FBS; HyClone; GE
Healthcare Life Sciences) and 1% penicillin-streptomycin
(Invitrogen; Thermo Fisher Scientific, Inc.) and maintained in a
humidified CO2 incubator at 37°C. MKN-45 is a poorly
differentiated human gastric adenocarcinoma cell line, and 90% of
MKN-45 cells exhibit stem cell characteristics (19).
Extraction and purification of
bioactive peptides
Extraction and purification of bioactive peptides
were performed as previously reported (20). Additionally, the optimal concentration
of 20 µg/ml bioactive peptides was determined and selected for the
treatment of MKN-45 cells (10,11).
Cell treatment
OXA was purchased from Jiangsu Aosaikang
Pharmaceutical Co., Ltd. and dissolved in DMSO as a stock solution.
The yield of cultured MKN-45 cells in the laboratory was
1×10⁶ cells/ml. After being cultured for 24 h, 20 µg/ml
of induced ACBP, 15 µg/ml OXA, and a combination of 10 µg/ml
induced ACBP and 7.5 µg/ml OXA were added to the cell culture
medium. The negative control group was treated with
phosphate-buffered saline (PBS). PBS is a phosphate buffer, which
acts as a dissolving protective agent, does not affect cell growth
and causes no damage to cells (11,21,22). After
36 h of incubation with all three treatments, the cells were
collected for further analysis (13,20,23). All
experiments were performed in triplicate.
Protein extraction
Following addition of an appropriate amount of
SDT-lysis buffer, the cells were ultrasonicated at 80 W for 10
repeated cycles, which included sonication for 10 sec, pausing for
15 sec, and boiling for 15 min. The supernatants of the cell
lysates were collected after centrifugation at 14,000 × g for 40
min. Proteins were quantified by the bicinchoninic acid assay. The
samples were transferred to a dispensing pack and stored at −80°C.
Three biological replicates were performed for each group (24).
SDS-PAGE
Protein samples (20 µg) were mixed with 5X loading
buffer and boiled for 5 min. Subsequently, SDS-PAGE was conducted
on a 12.5% (v/w) polyacrylamide gel. Three biological replicates
were performed for each group.
Filter-aided sample preparation
Protein sample solution (30 µl) was mixed with DTT
to a final concentration of 100 mM and then boiled for 5 min. After
cooling to room temperature, 200 µl of UA buffer was added and the
mixture was transferred to a 10-kDa ultrafiltration centrifuge
tube. Following centrifugation at 14,000 × g for 15 min at 37°C,
the filtrate was discarded. This step was repeated once. The tube
was supplemented with 100 µl IAA buffer (100 mM IAA in UA),
followed by shaking at 4,000 × g for 1 min at 37°C. Subsequently,
the mixture was incubated in the dark for 30 min at room
temperature, and then centrifuged at 14,000 × g for 15 min.
Following addition of 100 µl UA buffer, centrifugation was
performed at 14,000 × g for 15 min. This step was repeated twice.
Next, the tube was loaded with 100 µl of 10-fold diluted
dissolution buffer and centrifuged at 14,000 × g for 15 min. This
step was repeated twice. After loading with 40 µl trypsin buffer (4
µg trypsin in 40 µl dissolution buffer), the tube was shaken at
4,000 × g for 1 min and incubated for 16–18 h at 37°C. Then, the
tube was substituted with a new collecting tube, which was
centrifuged at 14,000 × g for 15 min. Following addition of 40 µl
of 10-fold diluted dissolution buffer, the filtrate was collected
after centrifugation at 14,000 × g for 15 min. The peptides were
desalted with a C18 cartridge and redissolved with 40 µl
dissolution buffer after lyophilization. Finally, the peptide
samples were quantified by measuring absorbance at 280 nm
(OD280) (24).
iTRAQ labeling
Peptides (~100 µg) in each group were labeled with
the iTRAQ Labeling Kit (AB SCIEX Co.) according to the
manufacturer's instructions. Three biological replicates were
performed for each group.
Strong cation-exchange chromatography
fractionation
The labeled peptides of each group were mixed and
fractionated using an AKTA Purifier 100 (GE Healthcare). Buffer A
(pH 3.0) containing 10 mM KH2PO4 and 25% ACN
was used as the mobile phase. Buffer B (pH 3.0) containing 10 mM
KH2PO4, 500 mM KCl and 25% CAN was used as
the eluent. Subsequently, the column was equilibrated with buffer
A. The peptide samples were then separated by the column at a flow
rate of 1 ml/min. The linear gradient of buffer B was from 0 to 8%
in 22 min, 8 to 52% in 25 min and 52 to 100% in 3 min, maintained
at 100% for 8 min, and then reset to 0%. The elution profile was
monitored by UV absorbance at 214 nm. Finally, the fractions were
collected every 1 min and desalted using a C18 cartridge.
High-performance liquid chromatography
(HPLC)
All samples were separated using an HPLC system Easy
nLC at a nanoliter flow rate. Buffer A was a 0.1% formic acid-water
solution, whereas buffer B was a 0.1% formic acid-84%
acetonitrile-water solution. The column was equilibrated with 95%
buffer A. Samples loaded in the autosampler were transferred onto
the loading column (Acclaim PepMap100, 100 µm ×2 cm, nanoViper C18;
Thermo Fisher Scientific, Inc.) and then separated by an analytical
column (EASY-Column, 10 cm, ID 75 µm, 3 µm, C18-A2; Thermo Fisher
Scientific, Inc.) at a flow rate of 300 nl/min. The linear gradient
of buffer B was from 0 to 35% in 50 min, 35 to 100% in 5 min, and
maintained at 100% for 5 min.
Mass spectrometry (MS)
identification
HPLC-fractionated samples were subjected to MS using
a Q-Exactive mass spectrometer (Thermo Fisher Scientific, Inc.).
The parameters used in MS were as follows: Detection mode, positive
ion; analysis time, 60 min; scanning range of parent ion, 300–1,800
m/z; MS1 resolution, 70,000 at 200 m/z; AGC target value,
3.0×10⁻⁶; first-order maximum IT, 10 msec; dynamic
exclusion, 10 msec; The mass-to-charge ratios of peptides and their
fragments were recorded. Ten fragmentographies were acquired from
MS2 scans. MS2 activation type, higher energy collisional
dissociation (HCD); isolation window, 2 m/z; resolution, 17,500 at
200 m/z; microscans, 1; second-order maximum IT, 60 msec;
normalized collision energy, 30 eV; and underfill ratio, 0.1%.
Proteomics data analysis
The raw MS data were extracted from RAW files.
Mascot version 2.2 (Matrix Science) and Proteome Discoverer version
1.4 (Thermo Electron) were used for molecular identification and
quantitative analysis. The MS data were analyzed with the UniProt
protein database. Carbamidomethylation of cysteines, iTRAQ labeling
at the N-term and lysine side-chain amino groups were set as the
fixed modifications, while the oxidation of methionine and
iTRAQ4plex (Y) was set as a variable modification. The false
discovery rate for each peptide was adjusted to 1%, and the minimum
peptide length was specified to 6. In addition, the enzyme
specificity was set to trypsin, and up to two missed cleavages were
allowed. Mass tolerance was set as 20 ppm for precursor ions and
0.1 Da for fragment ions.
Functional GO annotation
GO annotation of the target proteins was conducted
by Blast2GO (25), which consisted of
four steps: i) Sequence alignment (BLAST), ii) GO entry extraction
mapping, iii) GO annotation, and iv) data augmentation. First, the
target proteins were aligned against the specific protein sequence
database using the localized sequence alignment tool NCBI BLAST+
(ncbi-blast-2.2.28+-win32.exe), and the first 10 aligned sequences
with an E-value ≤1e-3 were retained for subsequent analysis. Next,
Blast2GO Command Line was used to extract the GO entries related to
the target protein sets and the aligned proteins or homologous
proteins with high sequence identity (database version:
go_201608.obo, www.geneontology.org). During the annotation process,
Blast2GO Command Line annotated the target proteins with the GO
entries extracted from the mapping process based on the sequence
similarity between the targeted and aligned proteins, the
reliability of GO entry sources, and the structure of the
GO-directed acyclic graph. Following annotation, the conserved
motifs that matched with target proteins were searched against the
EBI database using InterPro Scan to improve the annotation
efficiency. Functional information related to the motifs was
obtained and annotated to the target protein sequences. ANNEX was
used to enhance the annotation information, and a link between
different GO categories was established to improve the accuracy of
GO annotations.
KEGG pathway annotation
KO (KEGG Orthology) in the KEGG database is a
classification system for genes and their products. Orthologous
genes with similar functions are grouped with their products on the
same pathway, and a KO (or K) tag was assigned for their
interaction. KO classification was performed on the target protein
sequences by BLAST against the KEGG GENES database using KEGG
Automatic Annotation Server software. Additionally, the details on
the pathways associated with target protein sequences were obtained
according to the KO classification.
Cluster analysis of protein
sequences
For clustering analysis, the quantitative
information of the target protein set was first normalized to the
[-1, 1] interval. Next, Cluster 3.0 software (http://bonsai.hgc.jp/~mdehoon/software/cluster/software.htm)
was used to classify the two dimensions of the sample and protein
expression (distance algorithm, Euclidean; connection, Average
linkage) simultaneously. Finally, a hierarchical clustering heat
map was constructed using Java TreeView software, version 3.0
(http://jtreeview.sourceforge.net).
Network analysis of protein-protein
interactions (PPI)
Gene symbols obtained from the database of target
protein sequences were used to investigate the direct and indirect
interactions between target proteins and experimental evidence via
the IntAct database (http://www.ebi.ac.uk/intact/main.xhtml). CytoScape
version 3.2.1 (http://www.cytoscape.org/) and String database
(https://string-db.org/) were used to generate the
PPI network and analyze the network topologies.
PRM acquisition
To verify the protein expression levels obtained by
iTRAQ analysis, the expression levels of selected proteins were
quantified by LC-PRM-MS analysis (26). Briefly, peptides were prepared
according to the iTRAQ reagents protocol. An AQUA stable isotope
peptide was spiked in each sample as an internal standard
reference. For desalting purposes, tryptic peptides were loaded
into C18 stage tips on an Easy nLC-1200 system prior to
reversed-phase chromatography. A LC gradient of acetonitrile
ranging from 5 to 35% in 45 min was used. PRM analysis was
performed using a Q-Exactive Plus mass spectrometer. The
optimization of collision energy, charge state and retention times
for the most significantly regulated peptides was conducted by
unique peptides with the highest intensity and confidence. A full
MS scan was carried out in a positive ion mode mass spectrometer
with 70,000 resolution (at 200 m/z), an AGC target value of
3.0×10⁻⁶, and a maximum ion injection time of 250 msec.
Then, 20 PRM scans were performed at 35,000 resolution (at 200
m/z), an AGC target value of 3.0×10⁻⁶ and a maximum
injection time of 200 msec. The targeted peptides were isolated
using a 2 Thomson (Th) window. Peptide fragmentation was induced by
higher-energy collisional dissociation (HCD) at a normalized
collision energy of 27. The raw proteomics data were analyzed with
Skyline software, version 19.1 (MacCoss Lab, University of
Washington) (27), where the signal
intensities for the identified peptide sequences were relatively
quantified and normalized with a reference standard.
PRM screening
To validate the results of MS, 6 differentially
expressed proteins (TPX2, NUSAP1, TOP2A, YAP, MKi-67 and GPC4) were
selected for PRM analysis. The criteria for the validation of
proteomics data were as follows: i) Potential biological functions
and significant differential expression; ii) the number of peptide
fragments detected by LC-MS/MS was >1; and iii) novel
oncoproteins that were decreasingly expressed in MKN-45 cells after
treatment with ACBP-OXA compared with ACBP or OXA treatment
alone.
Statistical analysis
Student's t-test was used to analyze the statistical
software SPSS (version 22, IBM Corp.). Data are expressed as means
± standard deviation of three independent biological replicates. A
P-value of <0.05 was considered to indicate statistically
significant differences (Tables II,
III, SII and SIII).
 | Table II.Optimized differentially expressed
proteins between groups. |
Table II.
Optimized differentially expressed
proteins between groups.
| Protein ID | Protein | Fold change
(ACBP-OXA/C) | P-value |
|---|
| Q8IZZ8 | Antithrombin
(fragment) | 1.33 | 0.0012 |
| B7Z8Q4 | Hemopexin | 2.54 | 0.00126 |
| D6RBJ7 | Vitamin D-binding
protein | 2.81 | 0.0016 |
| Q96RG4 | Insulin receptor
substrate 2 insertion mutant (fragment) | 1.3 | 0.0018 |
| E5RJK7 | LYR
motif-containing protein 2 | 1.23 | 0.0045 |
| A8MW49 | Fatty acid-binding
protein | 4.8 | 0.0053 |
| Q99988 |
Growth/differentiation factor 15 | 1.42 | 0.0054 |
| Q9BWT3 | Poly(A) polymerase
gamma | 1.32 | 0.0055 |
| A0A087WVA8 | Testis-expressed
sequence 2 protein | 1.39 | 0.0056 |
| Q8TB52 | F-box only protein
30 | 1.33 | 0.0066 |
| Q7Z6E9 | E3
ubiquitin-protein ligase RBBP6 | 1.21 | 0.0066 |
| Q9P1Y5 |
Calmodulin-regulated spectrin-associated
protein 3 | 1.24 | 0.008 |
| B3KRB7 | Inhibitor of kappa
light polypeptide gene enhancer in B-cells, kinase beta | 1.45 | 0.008 |
| Q9ULR3 | Protein phosphatase
1H | 1.29 | 0.009 |
| B4DQK1 | Autophagy-related
protein 7 | 1.22 | 0.0179 |
| Q5T985 | Inter-alpha-trypsin
inhibitor heavy chain H2 | 1.74 | 0.02 |
| O60701 | UDP-glucose
6-dehydrogenase | 1.21 | 0.02 |
| Q5T440 | Putative
transferase CAF17 | 1.27 | 0.022 |
| Q53RD8 | Putative
uncharacterized protein LOC84524 (fragment) | 1.37 | 0.023 |
| Q5T123 | SH3 domain-binding
glutamic acid-rich-like protein 3 | 1.26 | 0.023 |
| Q15125 |
3-beta-hydroxysteroid-Delta(8),
Delta(7)-isomerase | 1.42 | 0.024 |
| I3L1D4 | RNA-binding protein
fox-1 homolog 1 (fragment) | 1.23 | 0.025 |
| B4DMX4 |
Alpha-fetoprotein | 2.03 | 0.025 |
| P48506 | Glutamate-cysteine
ligase catalytic subunit | 1.25 | 0.026 |
| P01023 |
Alpha-2-macroglobulin | 2.3 | 0.027 |
| A0A024R172 | Leukotriene B4
12-hydroxydehydrogenas | 1.22 | 0.028 |
| B4DTK6 | RNA polymerase
I-specific transcription initiation factor RRN3 | 1.24 | 0.028 |
| I3L2L5 | Mapk-regulated
corepressor-interacting protein 1 | 1.27 | 0.028 |
| F6KPG5 | Albumin
(fragment) | 2.94 | 0.029 |
| B3KM35 |
Beta-1,4-galactosyltransferase 4 | 1.27 | 0.031 |
| B4E1V0 |
Lactotransferrin | 1.68 | 0.034 |
| B7Z8R6 | AMBP protein | 2.11 | 0.039 |
| B7Z2S5 | Thioredoxin
reductase 1 | 1.22 | 0.038 |
| P07477 | Trypsin-1 | 1.24 | 0.039 |
| Q5HYD9 | Putative
uncharacterized protein DKFZp686M0619 (fragment) | 1.2 | 0.041 |
| Q9BW34 | EEF1D protein
(fragment) | 1.28 | 0.041 |
| O15173 | Membrane-associated
progesterone receptor component 2 | 1.21 | 0.04 |
| H7C5E8 | Serotransferrin
(fragment) | 2.02 | 0.042 |
| P09669 | Cytochrome c
oxidase subunit 6C | 1.22 | 0.044 |
| Q71UM5 | 40S ribosomal
protein S27-like | 1.79 | 0.046 |
| P46013 | Proliferation
marker protein Ki-67 | 0.076 | 0.0008 |
| Q9H3K6 | BolA-like protein
2 | 0.79 | 0.0009 |
| P16402 | Histone H1.3 | 0.809 | 0.0016 |
| B4DMI9 | Discs large homolog
7 | 0.8 | 0.0048 |
| D3YTB1 | 60S ribosomal
protein L32 (fragment) | 0.8 | 0.005 |
| H3BQH3 | Kelch
domain-containing protein 4 (fragment) | 0.744 | 0.0079 |
| B3KMT5 | SGT1 protein | 0.81 | 0.009 |
| P63218 | Guanine
nucleotide-binding protein G(I)/G(S)/G(O) | 0.8 | 0.009 |
| Q9Y3U8 | 60S ribosomal
protein L36 | 0.8 | 0.009 |
| P11388 | DNA topoisomerase
2-alpha | 0.78 | 0.114 |
| P0CJ79 | Zinc finger protein
888 | 0.77 | 0.012 |
| B3KQT6 | Tetraspanin-13 | 0.81 | 0.012 |
| B2RA70 | Tyrosine-protein
kinase | 0.82 | 0.015 |
| Q5T7U1 | General
transcription factor 3C polypeptide 5 | 0.81 | 0.015 |
| A8YQF4 | MHC class I antigen
(fragment) | 0.71 | 0.017 |
| Q15397 | Pumilio homolog
3 | 0.799 | 0.018 |
| P50914 | 60S ribosomal
protein L14 | 0.82 | 0.019 |
| G5E9A6 | Ubiquitin
carboxyl-terminal hydrolase 11 | 0.74 | 0.02 |
| P39023 | 60S ribosomal
protein L3 | 0.83 | 0.002 |
| P31350 |
Ribonucleoside-diphosphate reductase
subunit M2 | 0.8 | 0.02 |
| M0R0F0 | 40S ribosomal
protein S5 (fragment) | 0.82 | 0.025 |
| Q6N075 | Molybdate-anion
transporter | 0.82 | 0.026 |
| Q8TDD1 | ATP-dependent RNA
helicase DDX54 | 0.74 | 0.031 |
| O60287 | Nucleolar
pre-ribosomal-associated protein 1 | 0.81 | 0.031 |
| C9K025 | 60S ribosomal
protein L35a (fragment) | 0.82 | 0.031 |
| Q9ULW0 | Targeting protein
for Xklp2 | 0.79 | 0.032 |
| A0A0A0MRW6 | Nucleolar protein
6 | 0.79 | 0.033 |
| Q92876 | Kallikrein-6 | 0.77 | 0.033 |
| A8K800 | Homo sapiens brix
domain containing 1 | 0.79 | 0.038 |
| P60604 |
Ubiquitin-conjugating enzyme E2 | 0.77 | 0.038 |
| A8K7A2 | Cell division cycle
associated 8 | 0.81 | 0.044 |
| S4R456 | 40S ribosomal
protein S15 (fragment) | 0.78 | 0.04 |
| A8K4B4 | Homo sapiens
nucleolar and spindle associated protein 1 | 0.8 | 0.04 |
| O75487 | Glypican-4 | 0.76 | 0.04 |
| A0A087WXM6 | 60S ribosomal
protein L17 (fragment) | 0.81 | 0.04 |
| Q8TDN6 | Ribosome biogenesis
protein BRX1 homolog | 0.73 | 0.04 |
| Q96HP0 | Dedicator of
cytokinesis protein 6 | 0.73 | 0.04 |
| Table III.Target protein expression quantity
analysis. |
Table III.
Target protein expression quantity
analysis.
| Protein name | C_mean | ACBP_mean | ACBP-OXA_mean | OXA _mean | Ratio_ACBP/C |
Ratio_ACBP-OXA/C | Ratio_OXA/C | TTEST_ACBP/C |
TTEST_ACBP-OXA/C | TTEST_OXA/C |
|---|
| TPX2 | 0.0488 | 0.0992 | 0.0251 | 0.0922 | 2.03 | 0.52 | 1.89 | 0.00679 | 0.09427 | 0.16063 |
| NUSAP1 | 0.0335 | 0.1656 | 0.0205 | 0.0661 | 4.95 | 0.61 | 1.97 | 0.00040 | 0.31784 | 0.20261 |
| TOP2A | 0.1362 | 0.2487 | 0.1210 | 0.1476 | 1.83 | 0.89 | 1.08 | 0.04032 | 0.76786 | 0.84153 |
| YAP | 0.0637 | 0.1024 | 0.0590 | 0.1546 | 1.61 | 0.93 | 2.43 | 0.13889 | 0.87597 | 0.19902 |
| MKi-67 | 0.0356 | 0.0950 | 0.0289 | 0.0456 | 2.66 | 0.81 | 1.28 | 0.00272 | 0.56360 | 0.57830 |
| GPC4 | 0.4369 | 0.6705 | 0.4233 | 0.4868 | 1.53 | 0.97 | 1.11 | 0.15360 | 0.94407 | 0.82274 |
Results
LC-MS/MS
In the present study, the iTRAQ technique was
applied to analyze the proteomics profile of MKN-45 cells treated
with a combination of ACBP and OXA. The entire experimental
procedure is illustrated in Fig. 1. A
total of 6,210 proteins were detected (Table SI). Quality control of protein data
revealed that the molecular mass of proteins fell in the range of
5–100 kDa (Fig. 2A), and the majority
of the peptides were ~7–15 amino acids in length (Fig. 2B), which appeared to be similar to the
known properties of tryptic peptides.
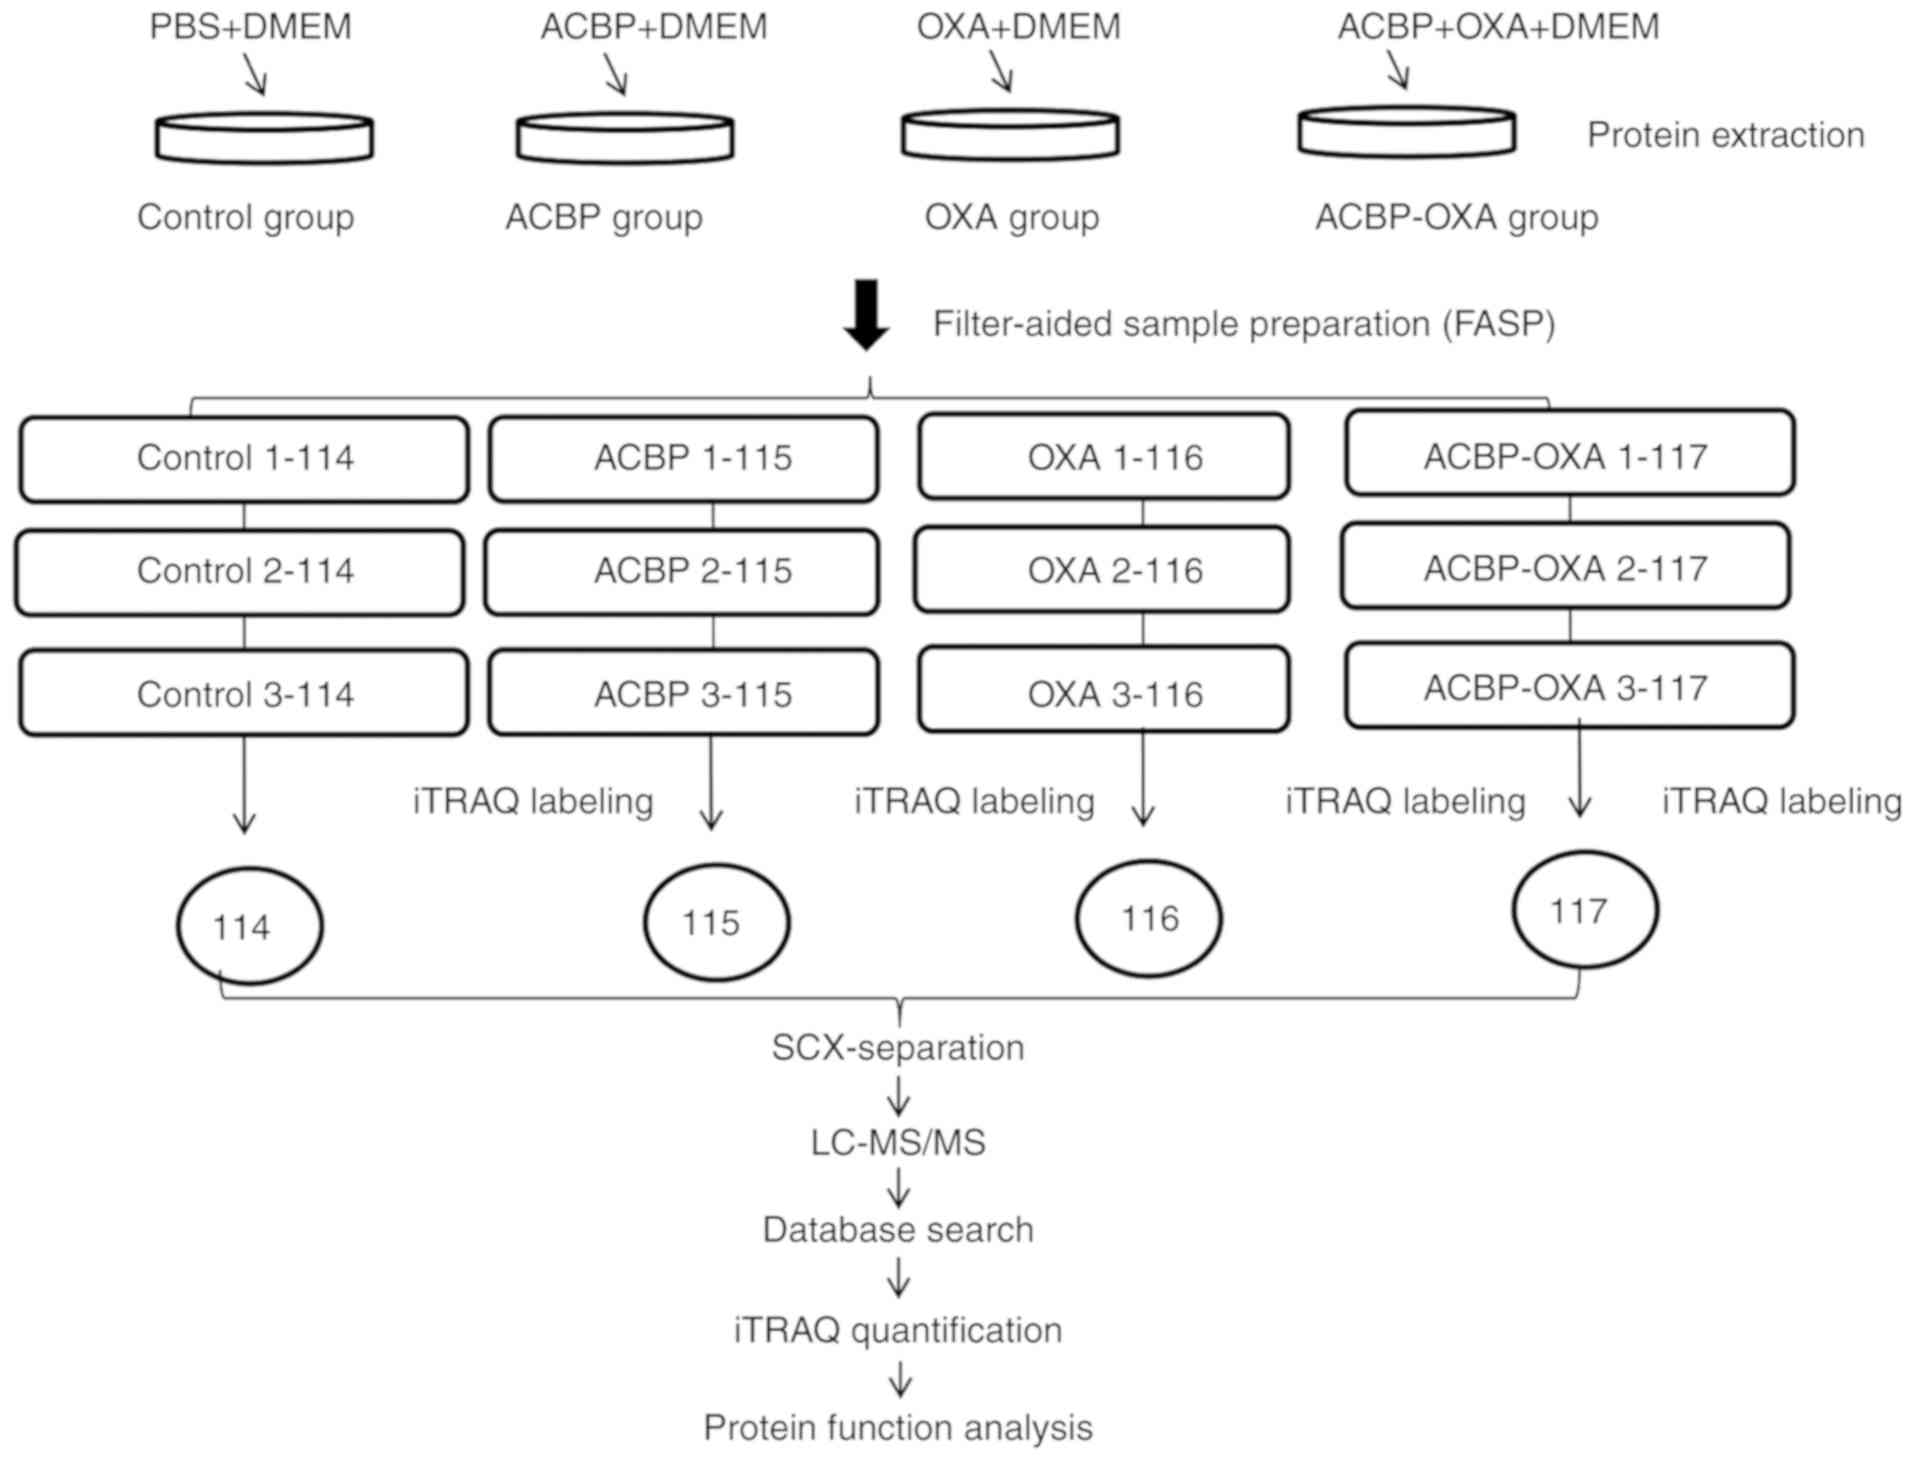 | Figure 1.Experimental process. Experimental
design for the quantitative proteomics analysis, the experiment was
divided into four groups (control, ACBP, OXA, ACBP-OXA), and
proteins were extracted from three independent biological
replicates per treatment. Extracted proteins were prepared via FASP
and labeled with iTRAQ reagents. The labeled peptides were
separated by SCX chromatography, and fractions were analyzed by
reversed-phase LC-MS/MS. All data were analyzed by bioinformatics
tools from different aspects. ACBP, anticancer bioactive peptides;
OXA, oxaliplatin; SCX, strong cation exchange; LC, liquid
chromatography; MS, mass spectrometry; FASP, filter-aided sample
preparation. |
Compared with the control group, MKN-45 cells
treated with ACBP, OXA and ACBP-OXA exhibited 17 (10 up- and 7
downregulated), 111 (27 up- and 84 downregulated) and 128 (53 up-
and 75 downregulated) differentially expressed proteins,
respectively (Tables I and SII). Proteins with a >1.2-fold change in
expression (either up- or downregulation) and P<0.05 were
considered to be differentially expressed. The protein expression
remained unchanged in the ACBP- or OXA-treated cells by the best
screening criteria for the differentially expressed proteins
(>1.2-fold change in expression and P<0.05). However, in
ACBP-OXA-treated cells, the protein expression changed or changed
in the opposite direction compared with the ACBP- or OXA-treated
groups. According to the criteria mentioned above, a total of 77
differentially expressed proteins were subjected to further
screening (Table II). Of these 77
proteins, 40 were significantly upregulated and 37 were
significantly downregulated. Specifically, the top 5 differentially
upregulated proteins were hemopexin, vitamin D-binding protein,
fatty acid-binding protein, α-fetoprotein and α-2-macroglobulin,
whereas the top 5 differentially downregulated proteins were
ribosome biogenesis protein BRX1, dedicator of cytokinesis protein
6, targeting protein for Xklp2, DNA topoisomerase 2-α and
proliferation marker protein Ki-67.
| Table I.Protein quantification in MKN45 cells
treated by ACBP alone, OXA alone, and combined ACBP-OXA. |
Table I.
Protein quantification in MKN45 cells
treated by ACBP alone, OXA alone, and combined ACBP-OXA.
| Comparison between
groups | Upregulation | Downregulation | Protein count |
|---|
| OXA vs. C | 27 | 84 | 111 |
| ACBP vs. C | 10 | 7 | 17 |
| ACBP-OXA vs. C | 53 | 75 | 128 |
PRM analysis of the target
peptides
To improve the accuracy of protein identification,
the PRM mode was first used to specifically monitor the peptide
sequences of 6 target proteins in mixed samples. The mixed samples
were repeatedly tested 3 times using LC-PRM/MS, and the PRM data
were analyzed by Skyline software, version 19.1 (MacCoss Lab,
University of Washington). The results demonstrated that the 6
target proteins had credible peptides. The corresponding peptides
were selected for PRM quantitative analysis. The 3-time repeated
tests of LC-PRM/MS stably detected 10 candidate peptides of the 6
target proteins, with a relative standard deviation of ~12%. These
results support that PRM is an accurate method for the
quantification analysis of peptides (Table SIII). Three daughter ions of the most
abundant and consecutive peptides were selected for different
analyses, such as quantitative analysis at the protein and peptide
levels, data calibration and biostatistical analysis (Table SIV). First, the peak area of the
daughter ion was integrated to obtain the original peak area of
peptides. Second, the peak area of the internal standard peptide
was labeled with heavy isotopes for correction purposes. The
relative expression levels of each peptide in all samples were then
measured. Finally, the mean relative expression level of the target
peptide was calculated and statistically analyzed (Table SV).
Quantitative expression analysis of
the target proteins
Based on the corresponding peptide fragments, the
differences in the relative expression level of target proteins
were further calculated in different samples. In other words, the
mean ratios of multiple peptides were calculated (Table III). The LC-PRM/MS results revealed
that quantitative information of target peptide fragments was
obtained for all samples. Subsequently, the target proteins and
peptide fragments were subjected to relative quantitative analysis
by adding heavy isotope-labeled peptide fragments. The results
demonstrated that differential protein expression was observed
among the 6 target proteins. Notably, the protein expression levels
were significantly decreased in MKN-45 cells treated with ACBP-OXA,
but not cells treated with ACBP or OXA alone.
Bioinformatics analysis
All differentially expressed proteins detected by MS
were further analyzed using bioinformatics methods.
Clustering analysis
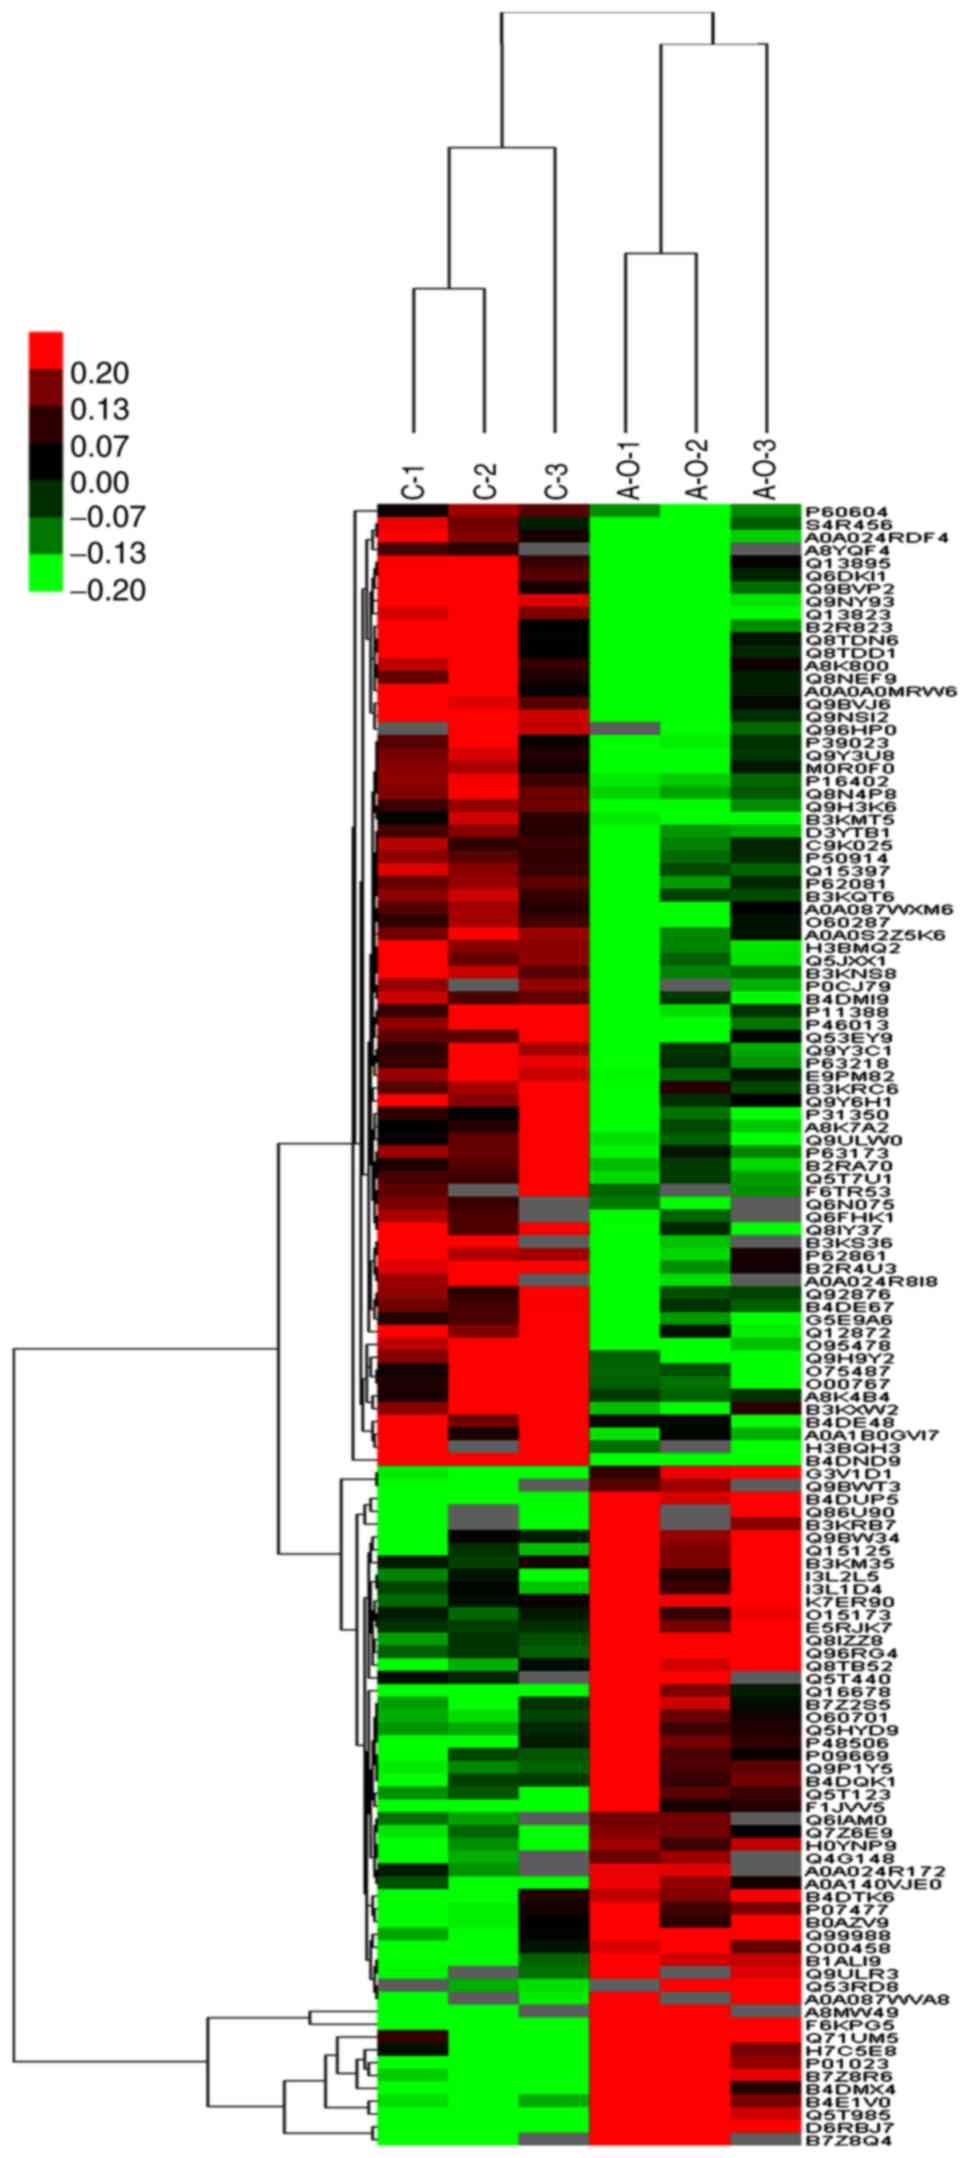
Hierarchical clustering results are presented as
heat maps, where the red color indicates upregulation and the green
color downregulation. All samples were classified into four
categories: C1-C3, ACBP1-ACBP3, OXA1-OXA3 and ACBP-OXA1-ACBP-OXA3.
It was observed that the proteins may be divided into two
categories via vertical comparison. The differential changes in
protein expression between ACBP-OXA-treated MKN-45 cells and the
control group are shown in Fig. 3. In
addition, the differentially expressed proteins were significantly
altered in ACBP-treated and OXA-treated MKN-45 cells (Figs. S1 and S2, respectively) compared with the control
group, suggesting the rationality of differential expression
patterns of selected target proteins. Therefore, clustering
analysis may be used to assess the reasonability of screening
differentially expressed proteins, e.g., whether changes in the
expression levels of these target proteins can indicate the
therapeutic effect of biological agents on cancer cells.
GO function annotation and
analysis
GO is a functional classification system that
provides a set of dynamically updated standardized vocabulary to
describe the properties of genes and gene products based on three
different perspectives: i) The involved biological process, ii)
molecular function and iii) cellular component. Differentially
expressed proteins in ACBP- (n=17), OXA- (n=111) and
ACBP-OXA-treated cells (n=128) exhibited a total of 734, 2,295 and
2,402 functional annotations, respectively (Tables SVI–SVIII). Similarly, the protein functions
predicted from secondary GO enrichment analysis were divided into
three categories: i) Molecular function, ii) cellular component and
iii) the involved biological process. Each protein contained at
least one functional GO annotation. Furthermore, GO functional
annotations of differentially expressed proteins were compared
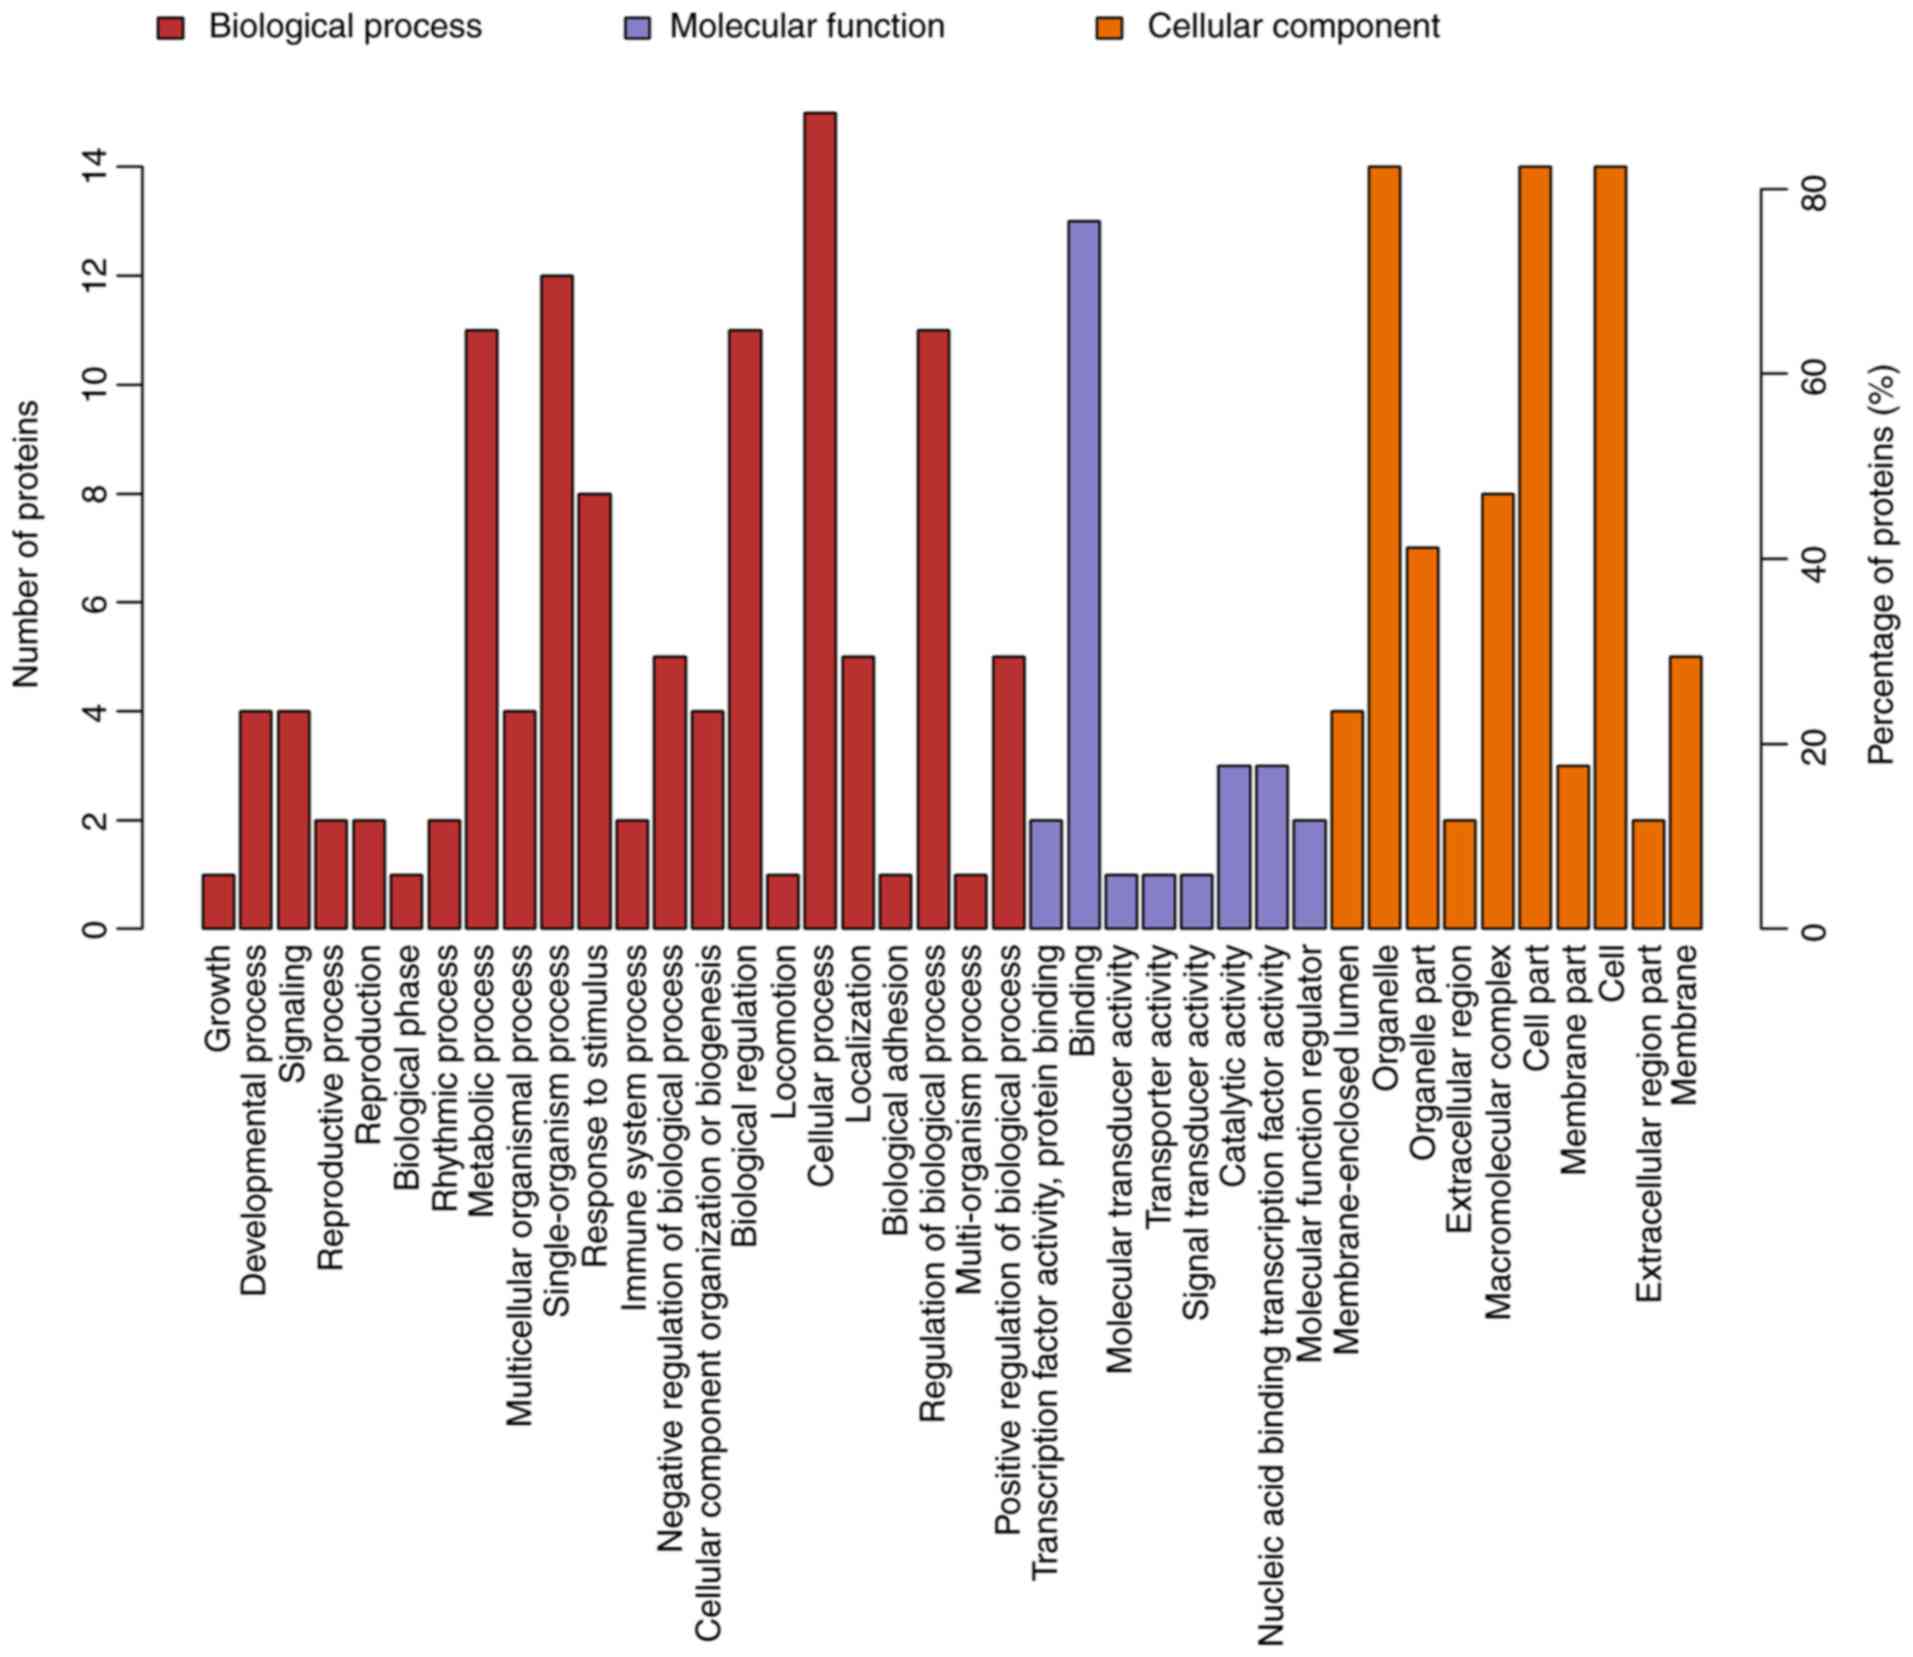
between the four groups. Compared to the control group, 17
differentially expressed proteins in the ACBP group tended to be
located at the macromolecular complex and were closely associated
with catalytic activity, protein-binding and nucleic acid-binding
transcription factor activity. These proteins were involved in
cellular processes, metabolic processes and responses to stimuli
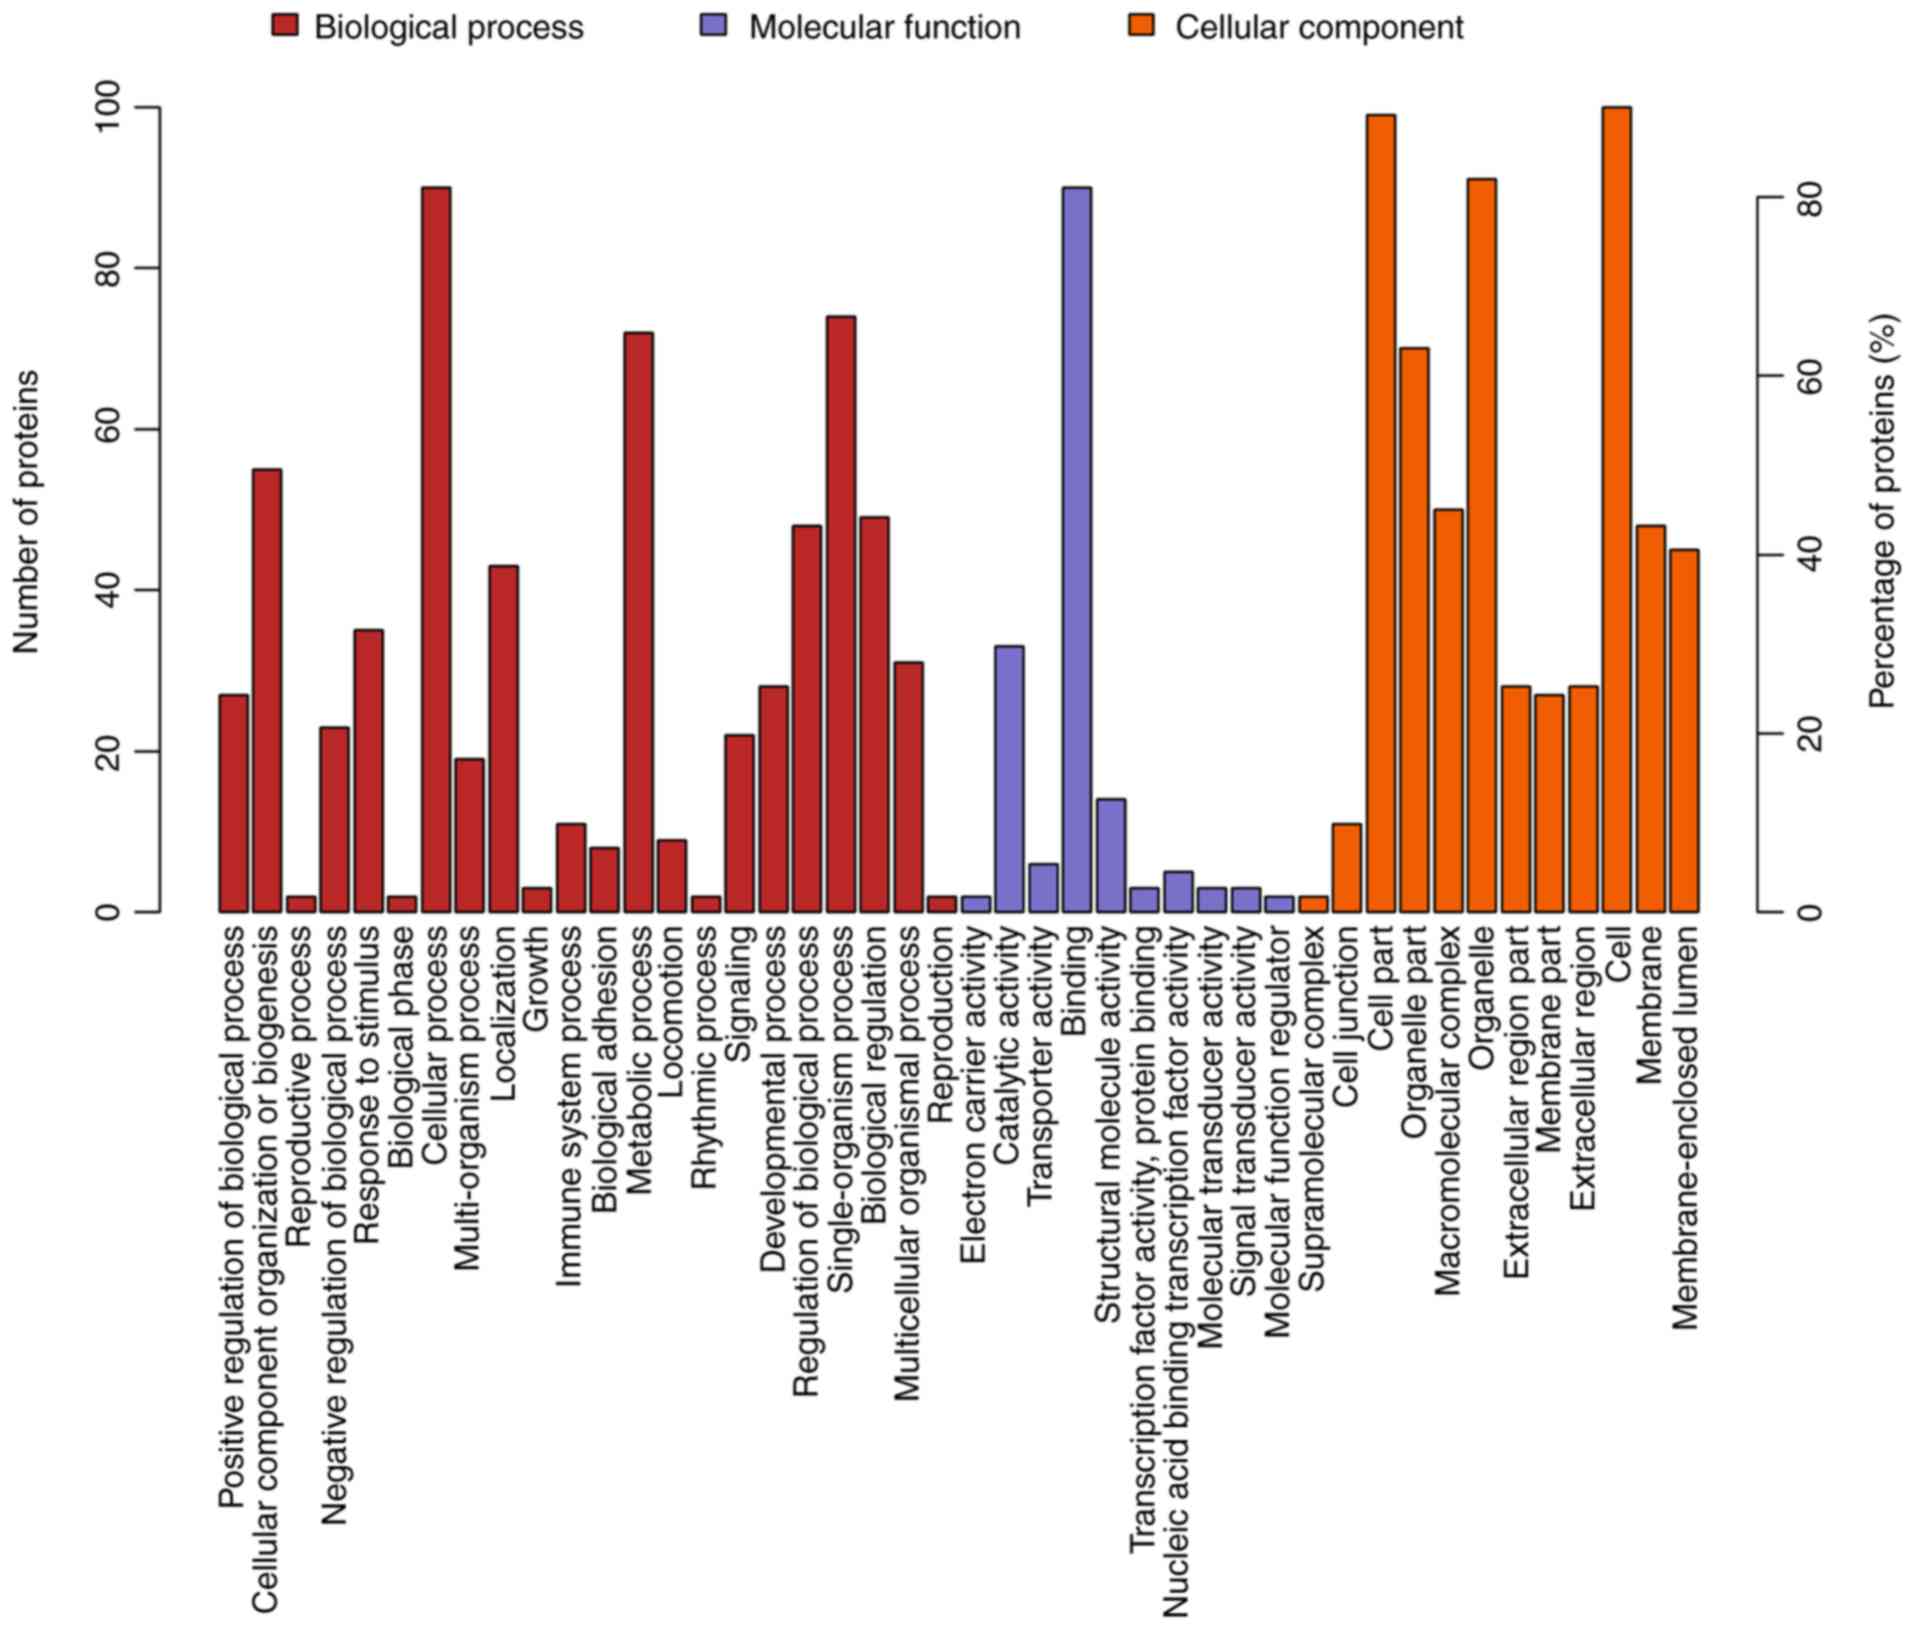
(Fig. 4). The 111 differentially
expressed proteins of the OXA group were found in the nucleus and
cytosolic part and were associated with structural molecule
activity. These proteins participated in diverse biological
processes, such as metabolic processes, cellular component
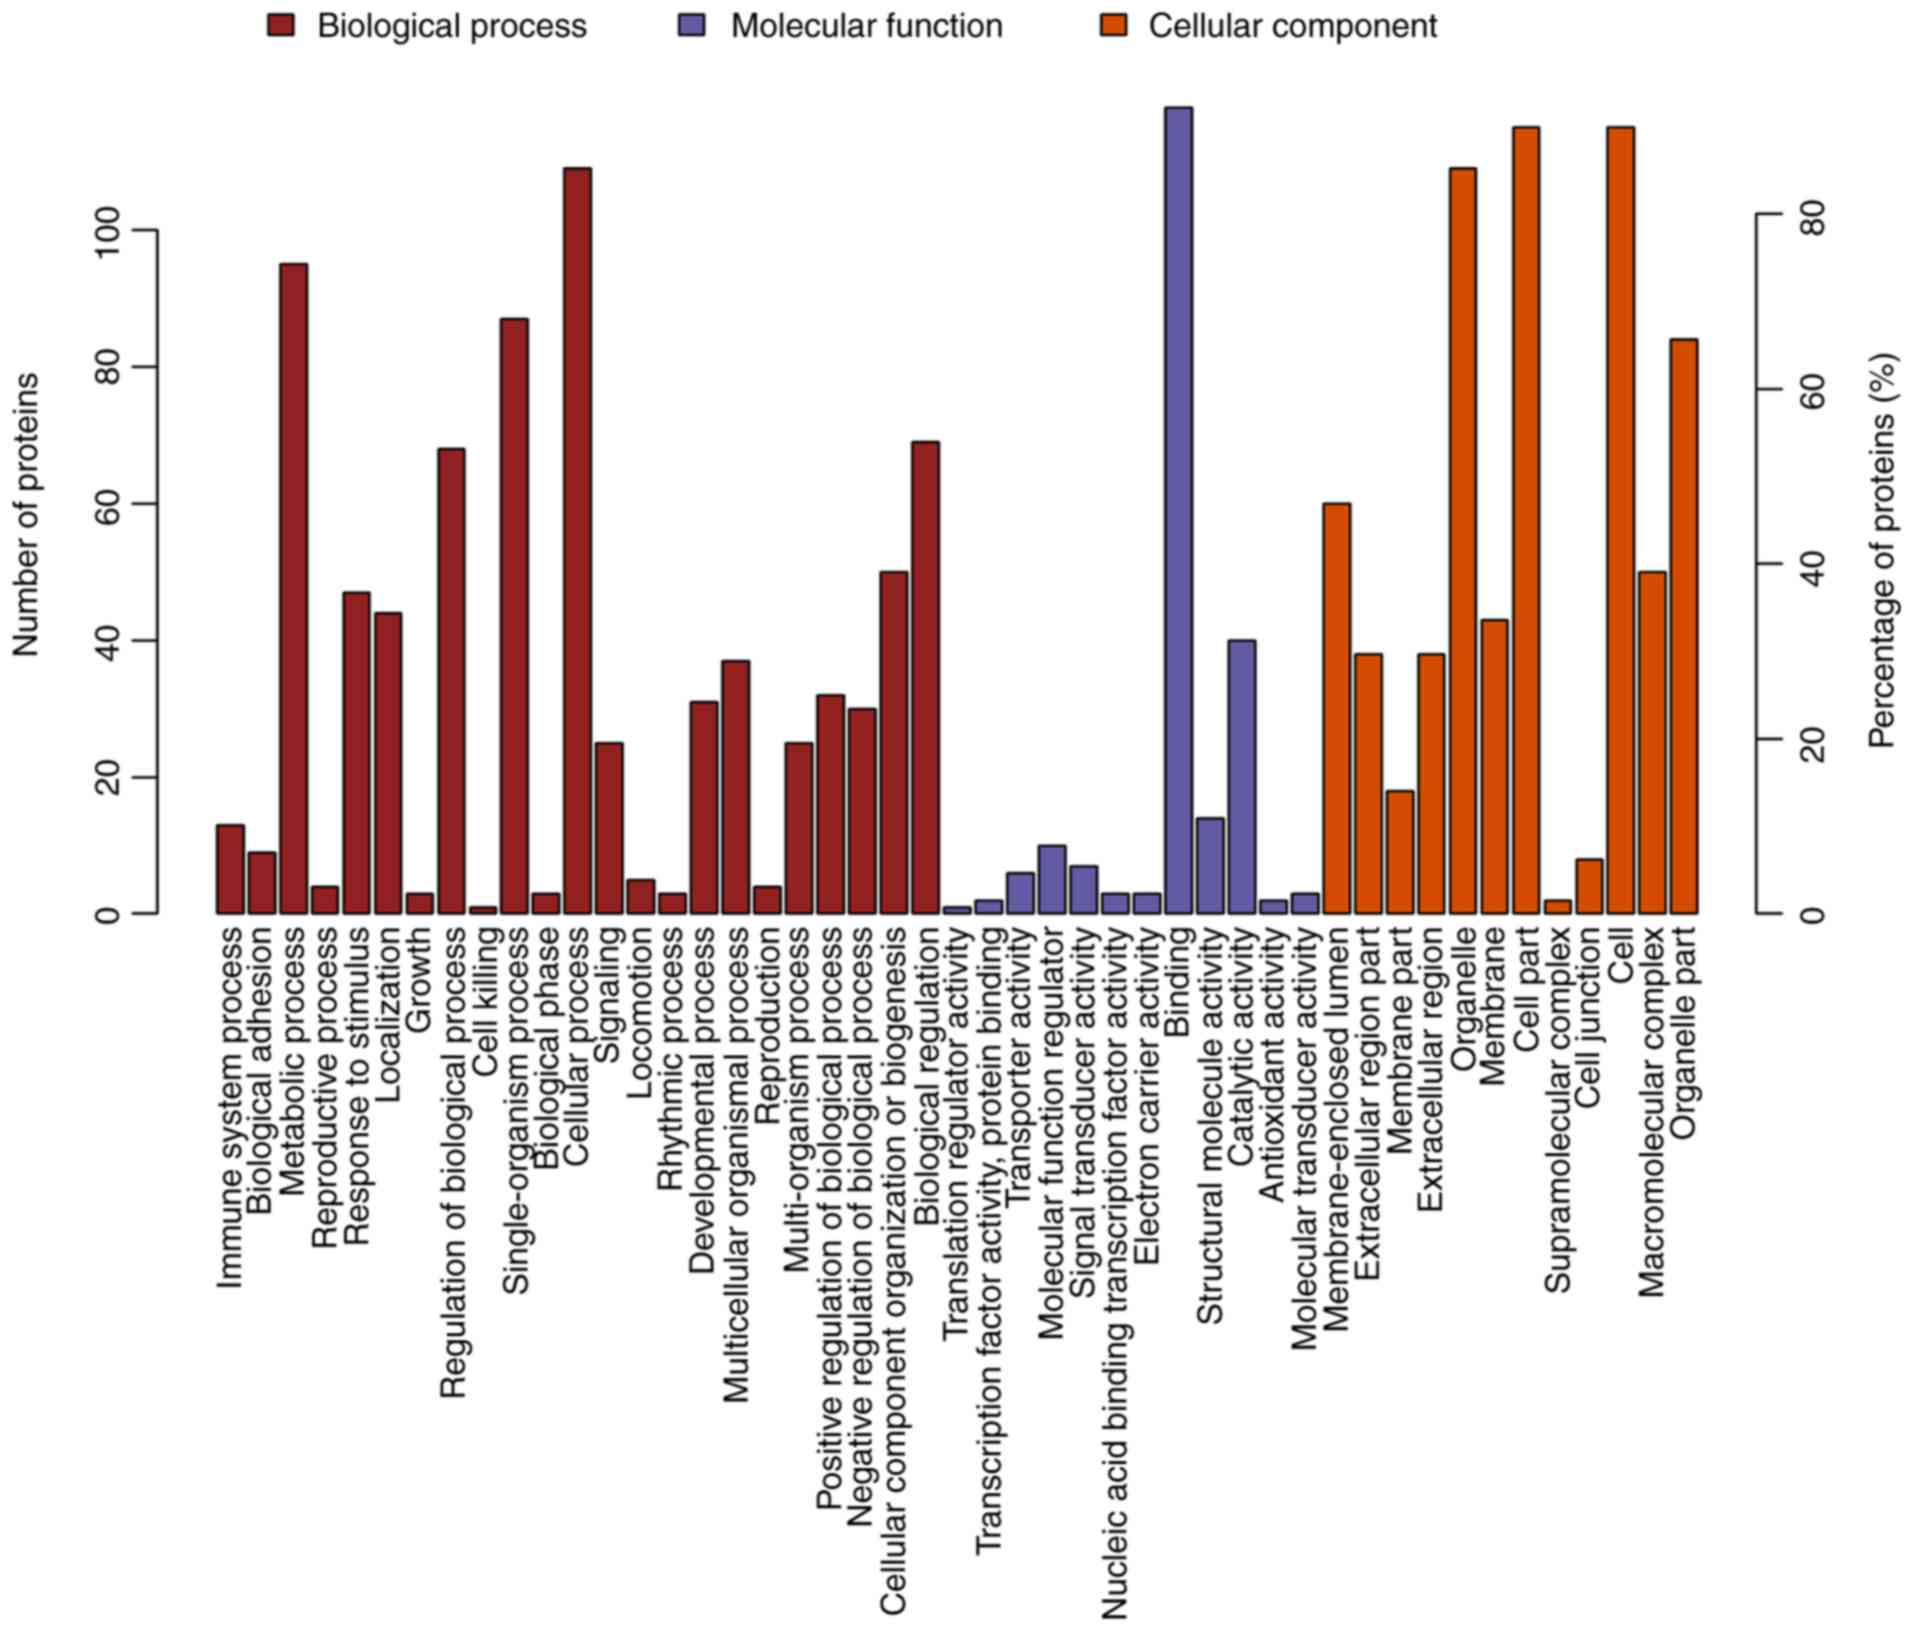
organization or biogenesis and localization (Fig. 5). The 128 differentially expressed
proteins in the ACBP-OXA group were located in the nucleolus,
membrane-enclosed lumen and organelle part and were involved in
catalytic activity and structural molecule activity, which can
affect signaling, cellular component organization or biogenesis and
negative regulation of biological processes, indicating that the
combination of two drugs exerts complementary and synergistic
therapeutic effects on gastric cancer cells (Fig. 6).
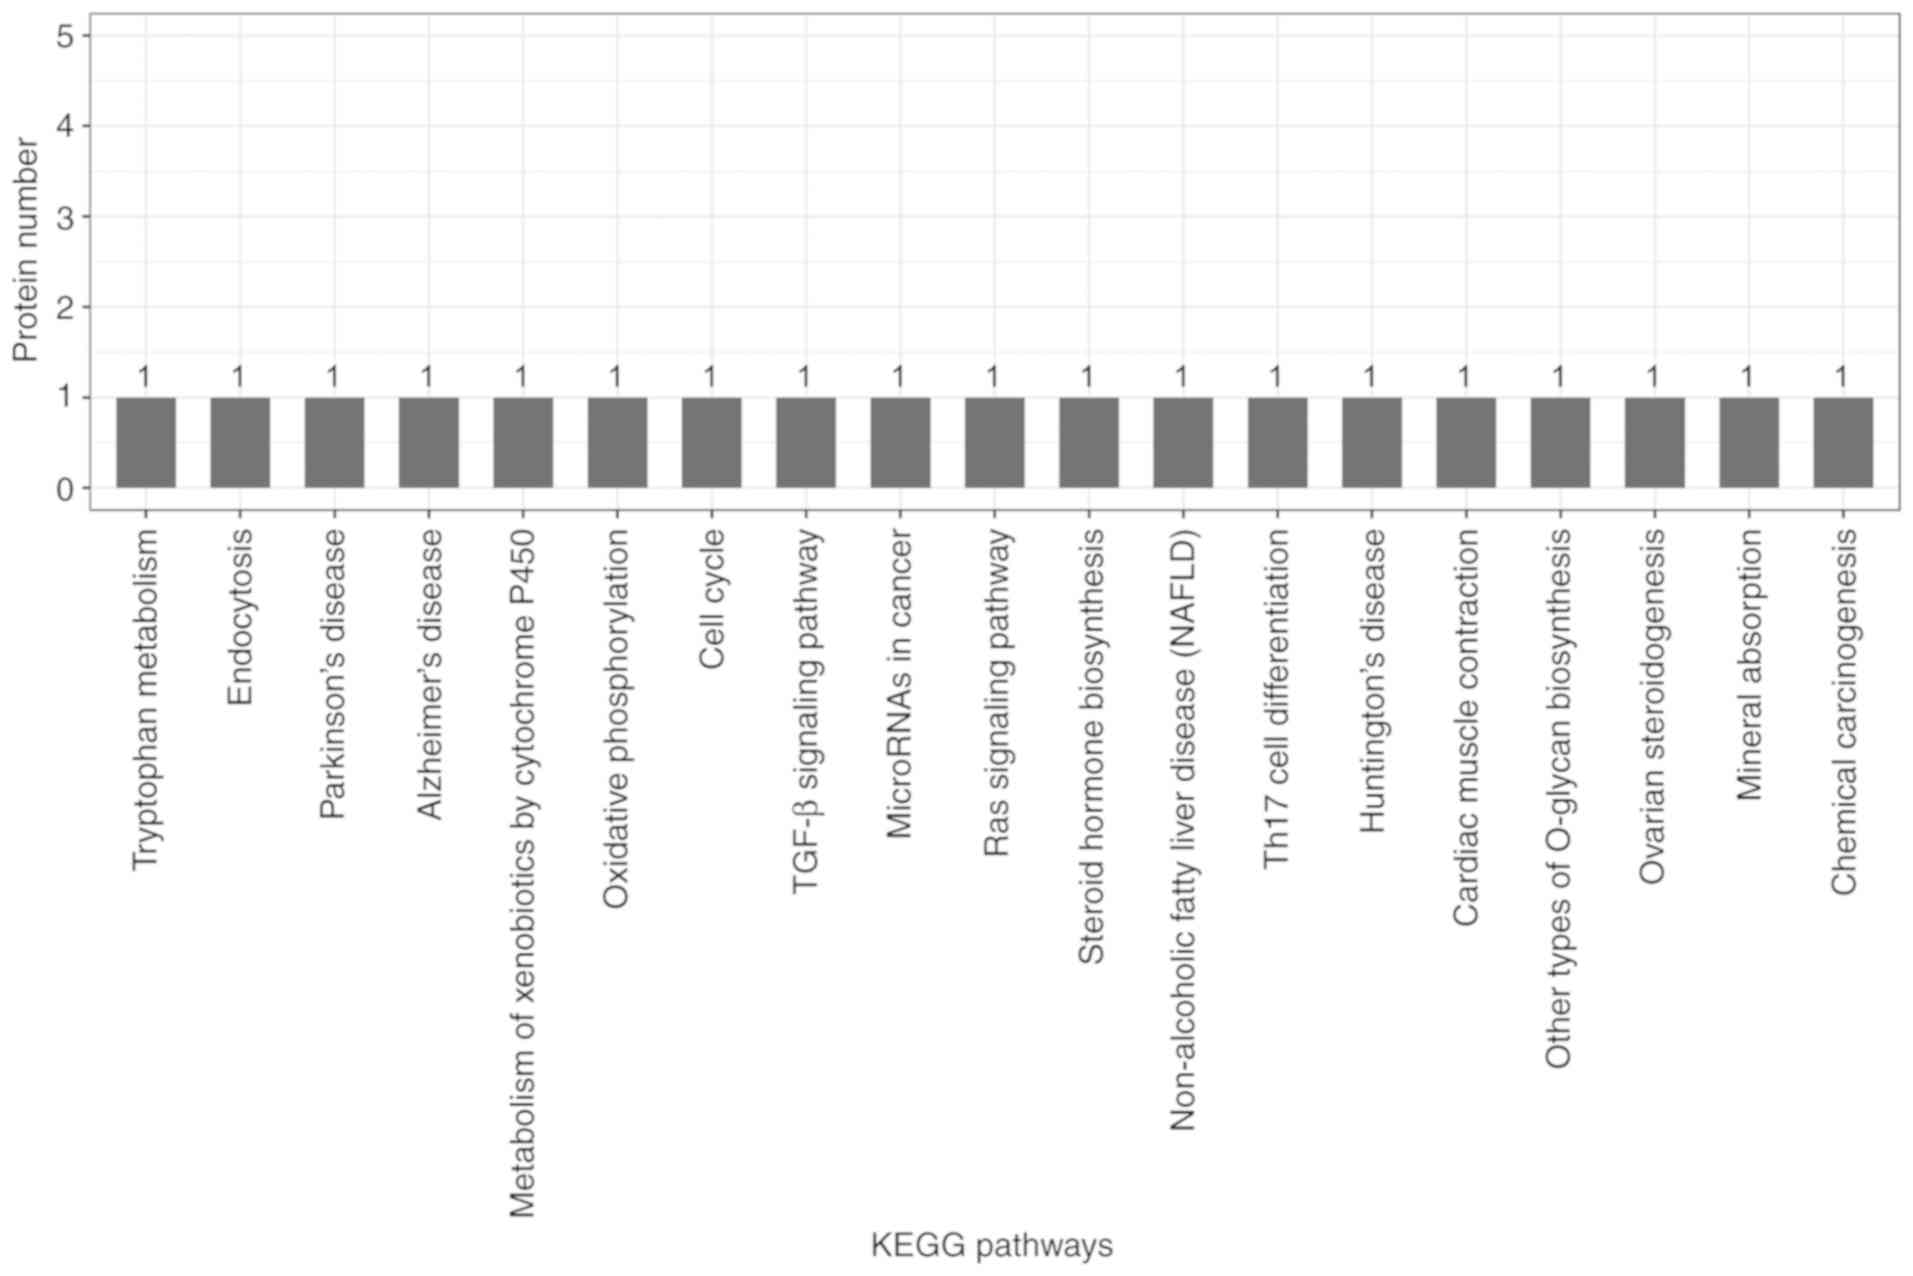
KEGG pathway analysis
Candidate proteins regulate complex pathological and
physiological processes through interaction and intercoordination
with other proteins. KEGG pathway analysis was conducted to
identify the key signaling pathways and related regulatory
processes underlying the therapeutic effects of ACBP, OXA and
ACBP-OXA (Tables SIX–XI). The identified signaling pathways in
the ACBP group were associated with glycosylation biosynthesis,
steroid hormone synthesis, mineral element absorption and cell
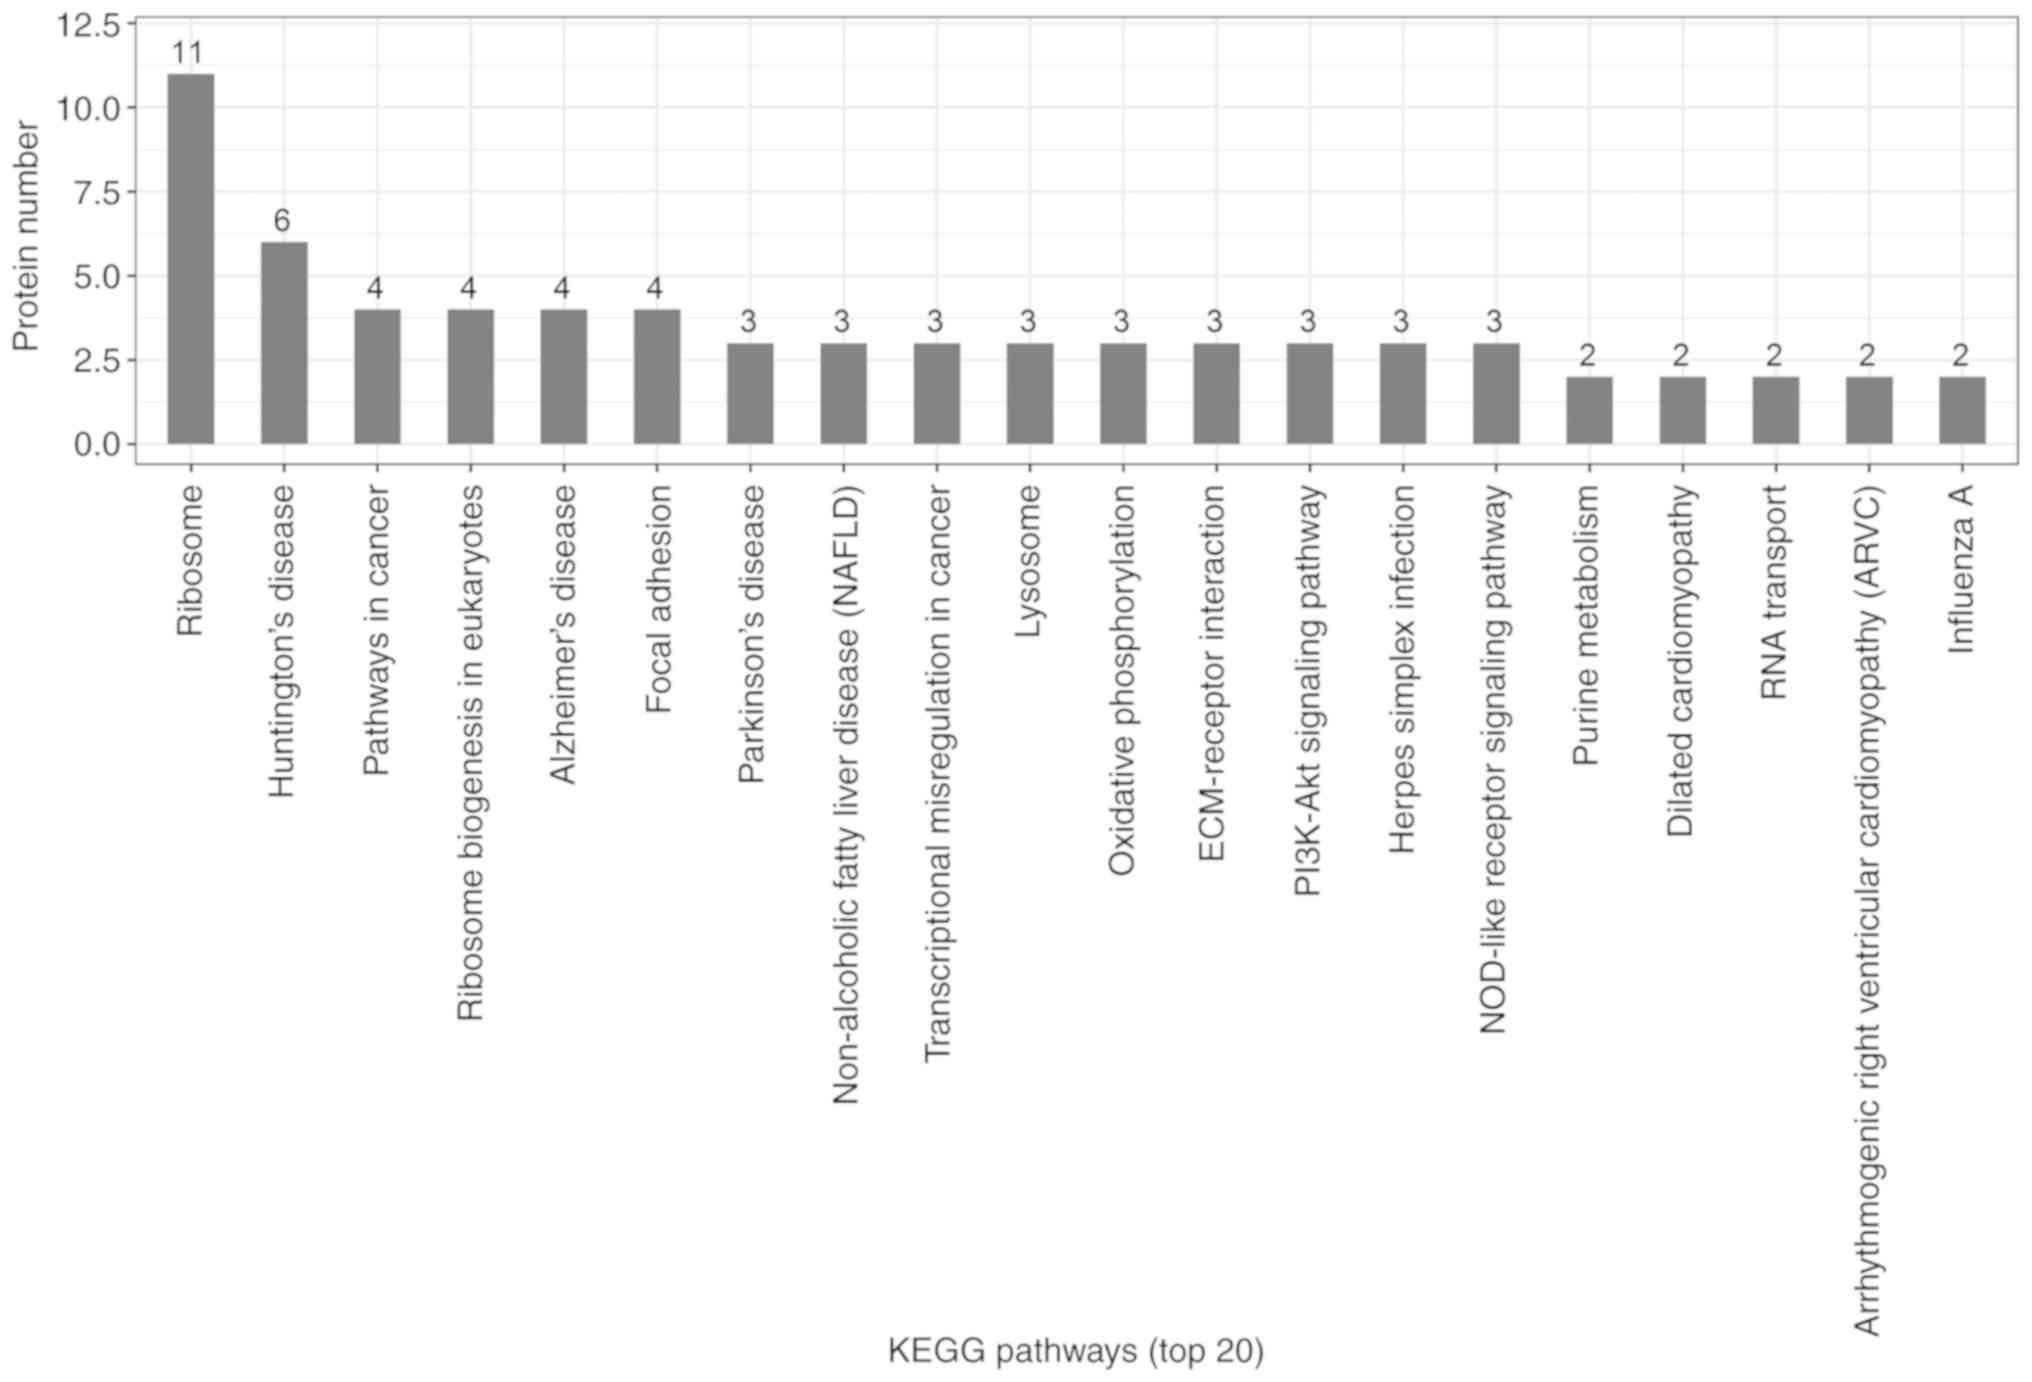
cycle, among others (Fig. 7). KEGG
signaling pathways in the OXA group were associated with
cancer-related signaling pathways, adhesions, transcriptional error
regulation in cancer, RNA transcription, ECM-receptor activation
and PI3-AKT signaling, among others (Fig.
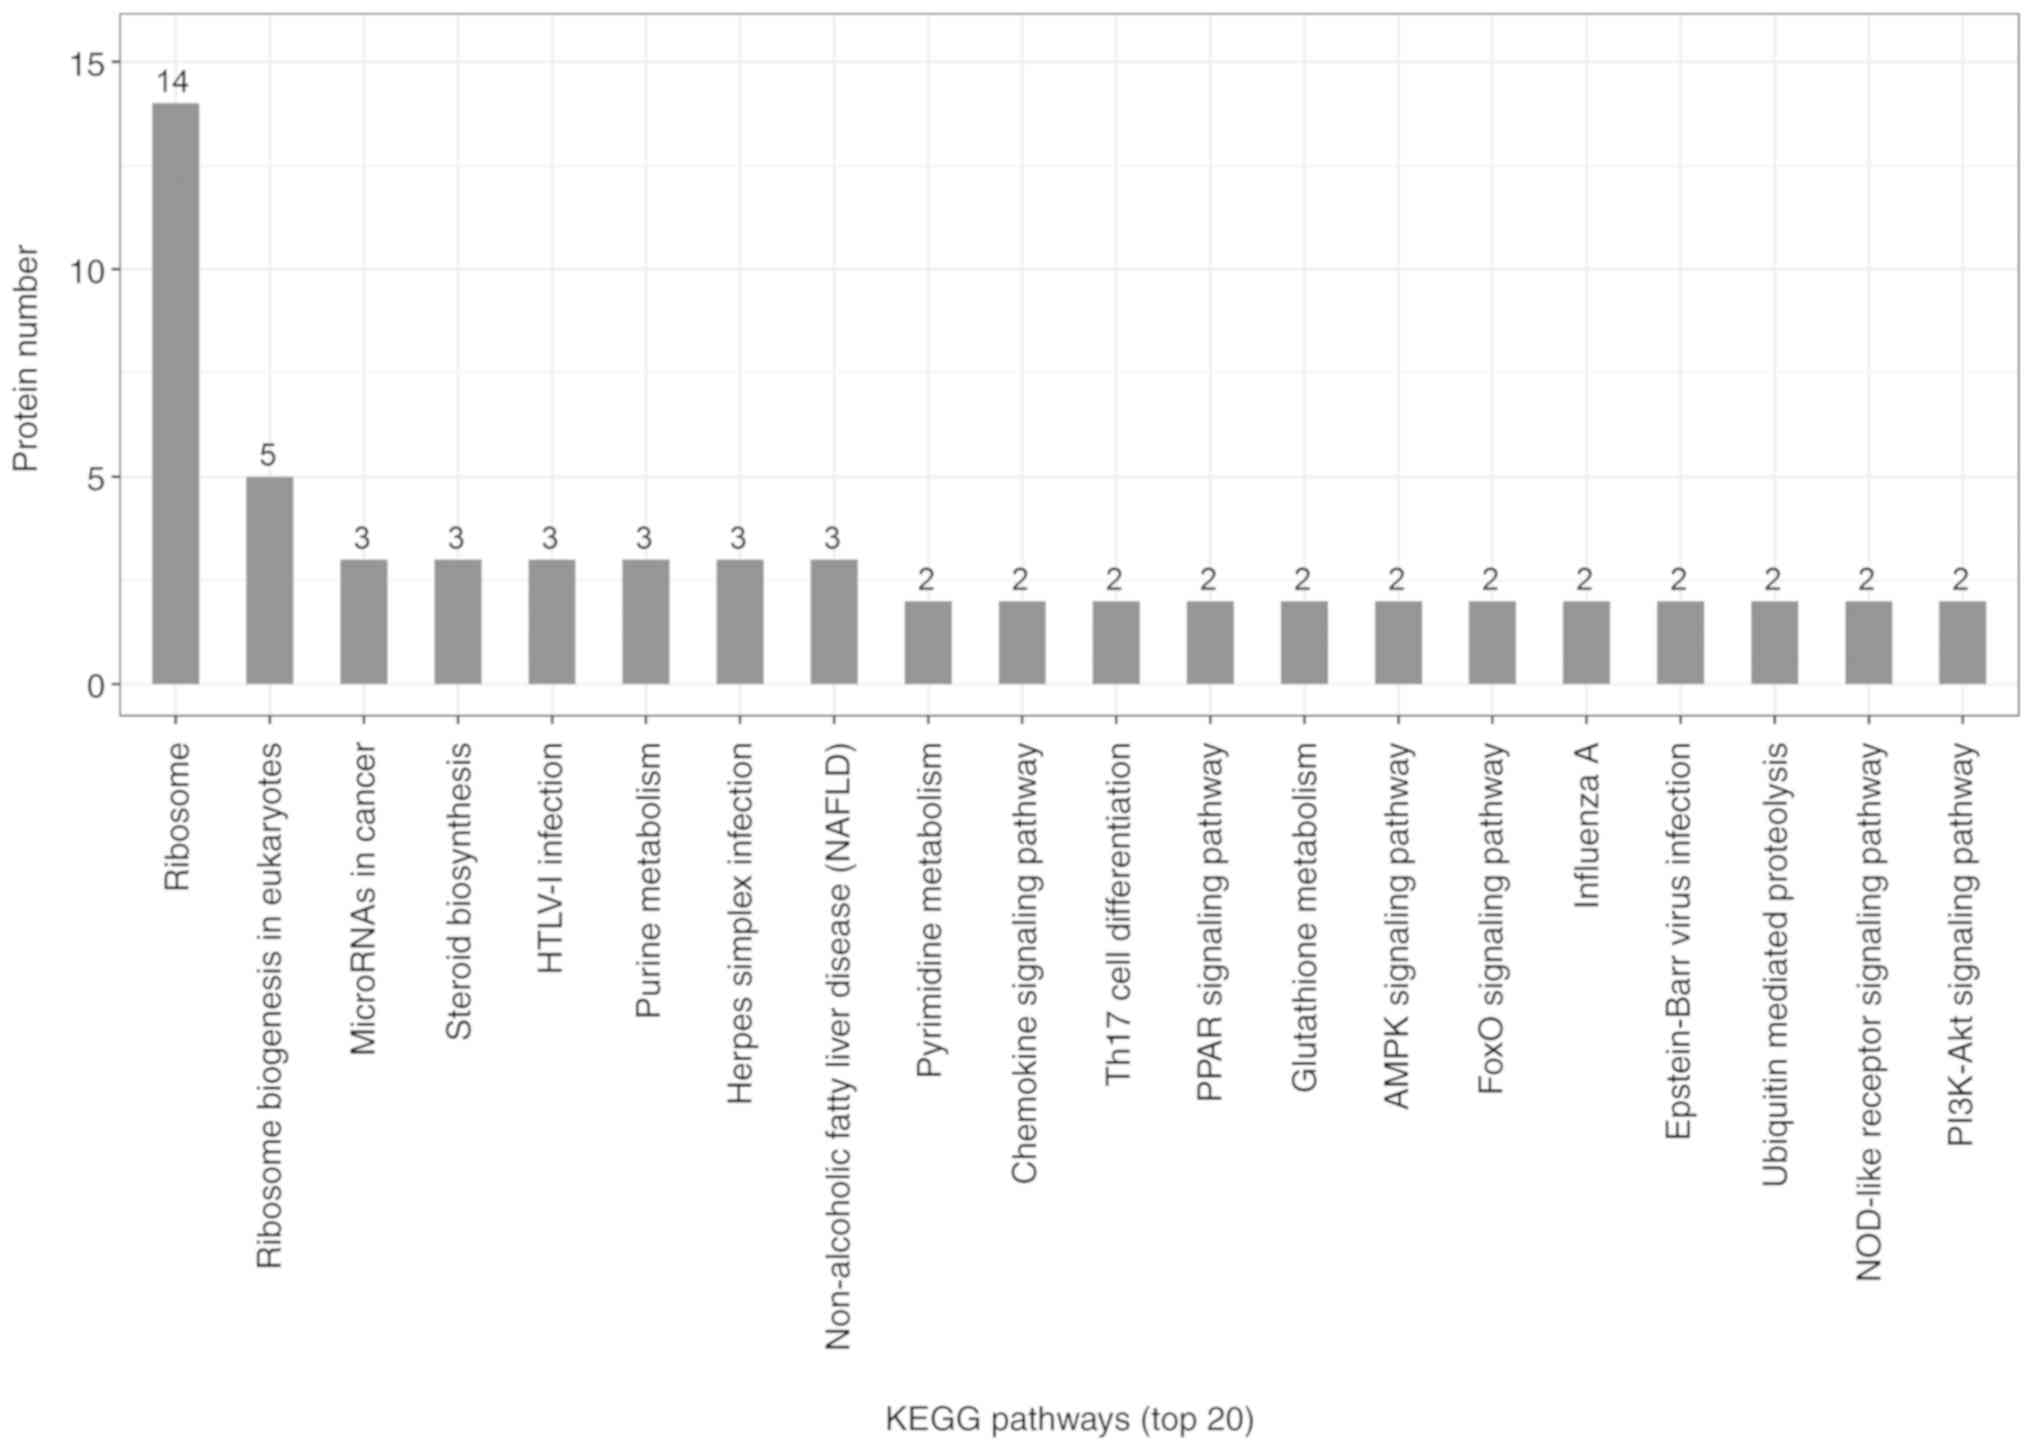
8). The KEGG signaling pathway in the ACBP-OXA group was
associated with ribosomes, cancer-related signaling pathways,
chemokines, PPAR and AMPK, among others (Fig. 9).
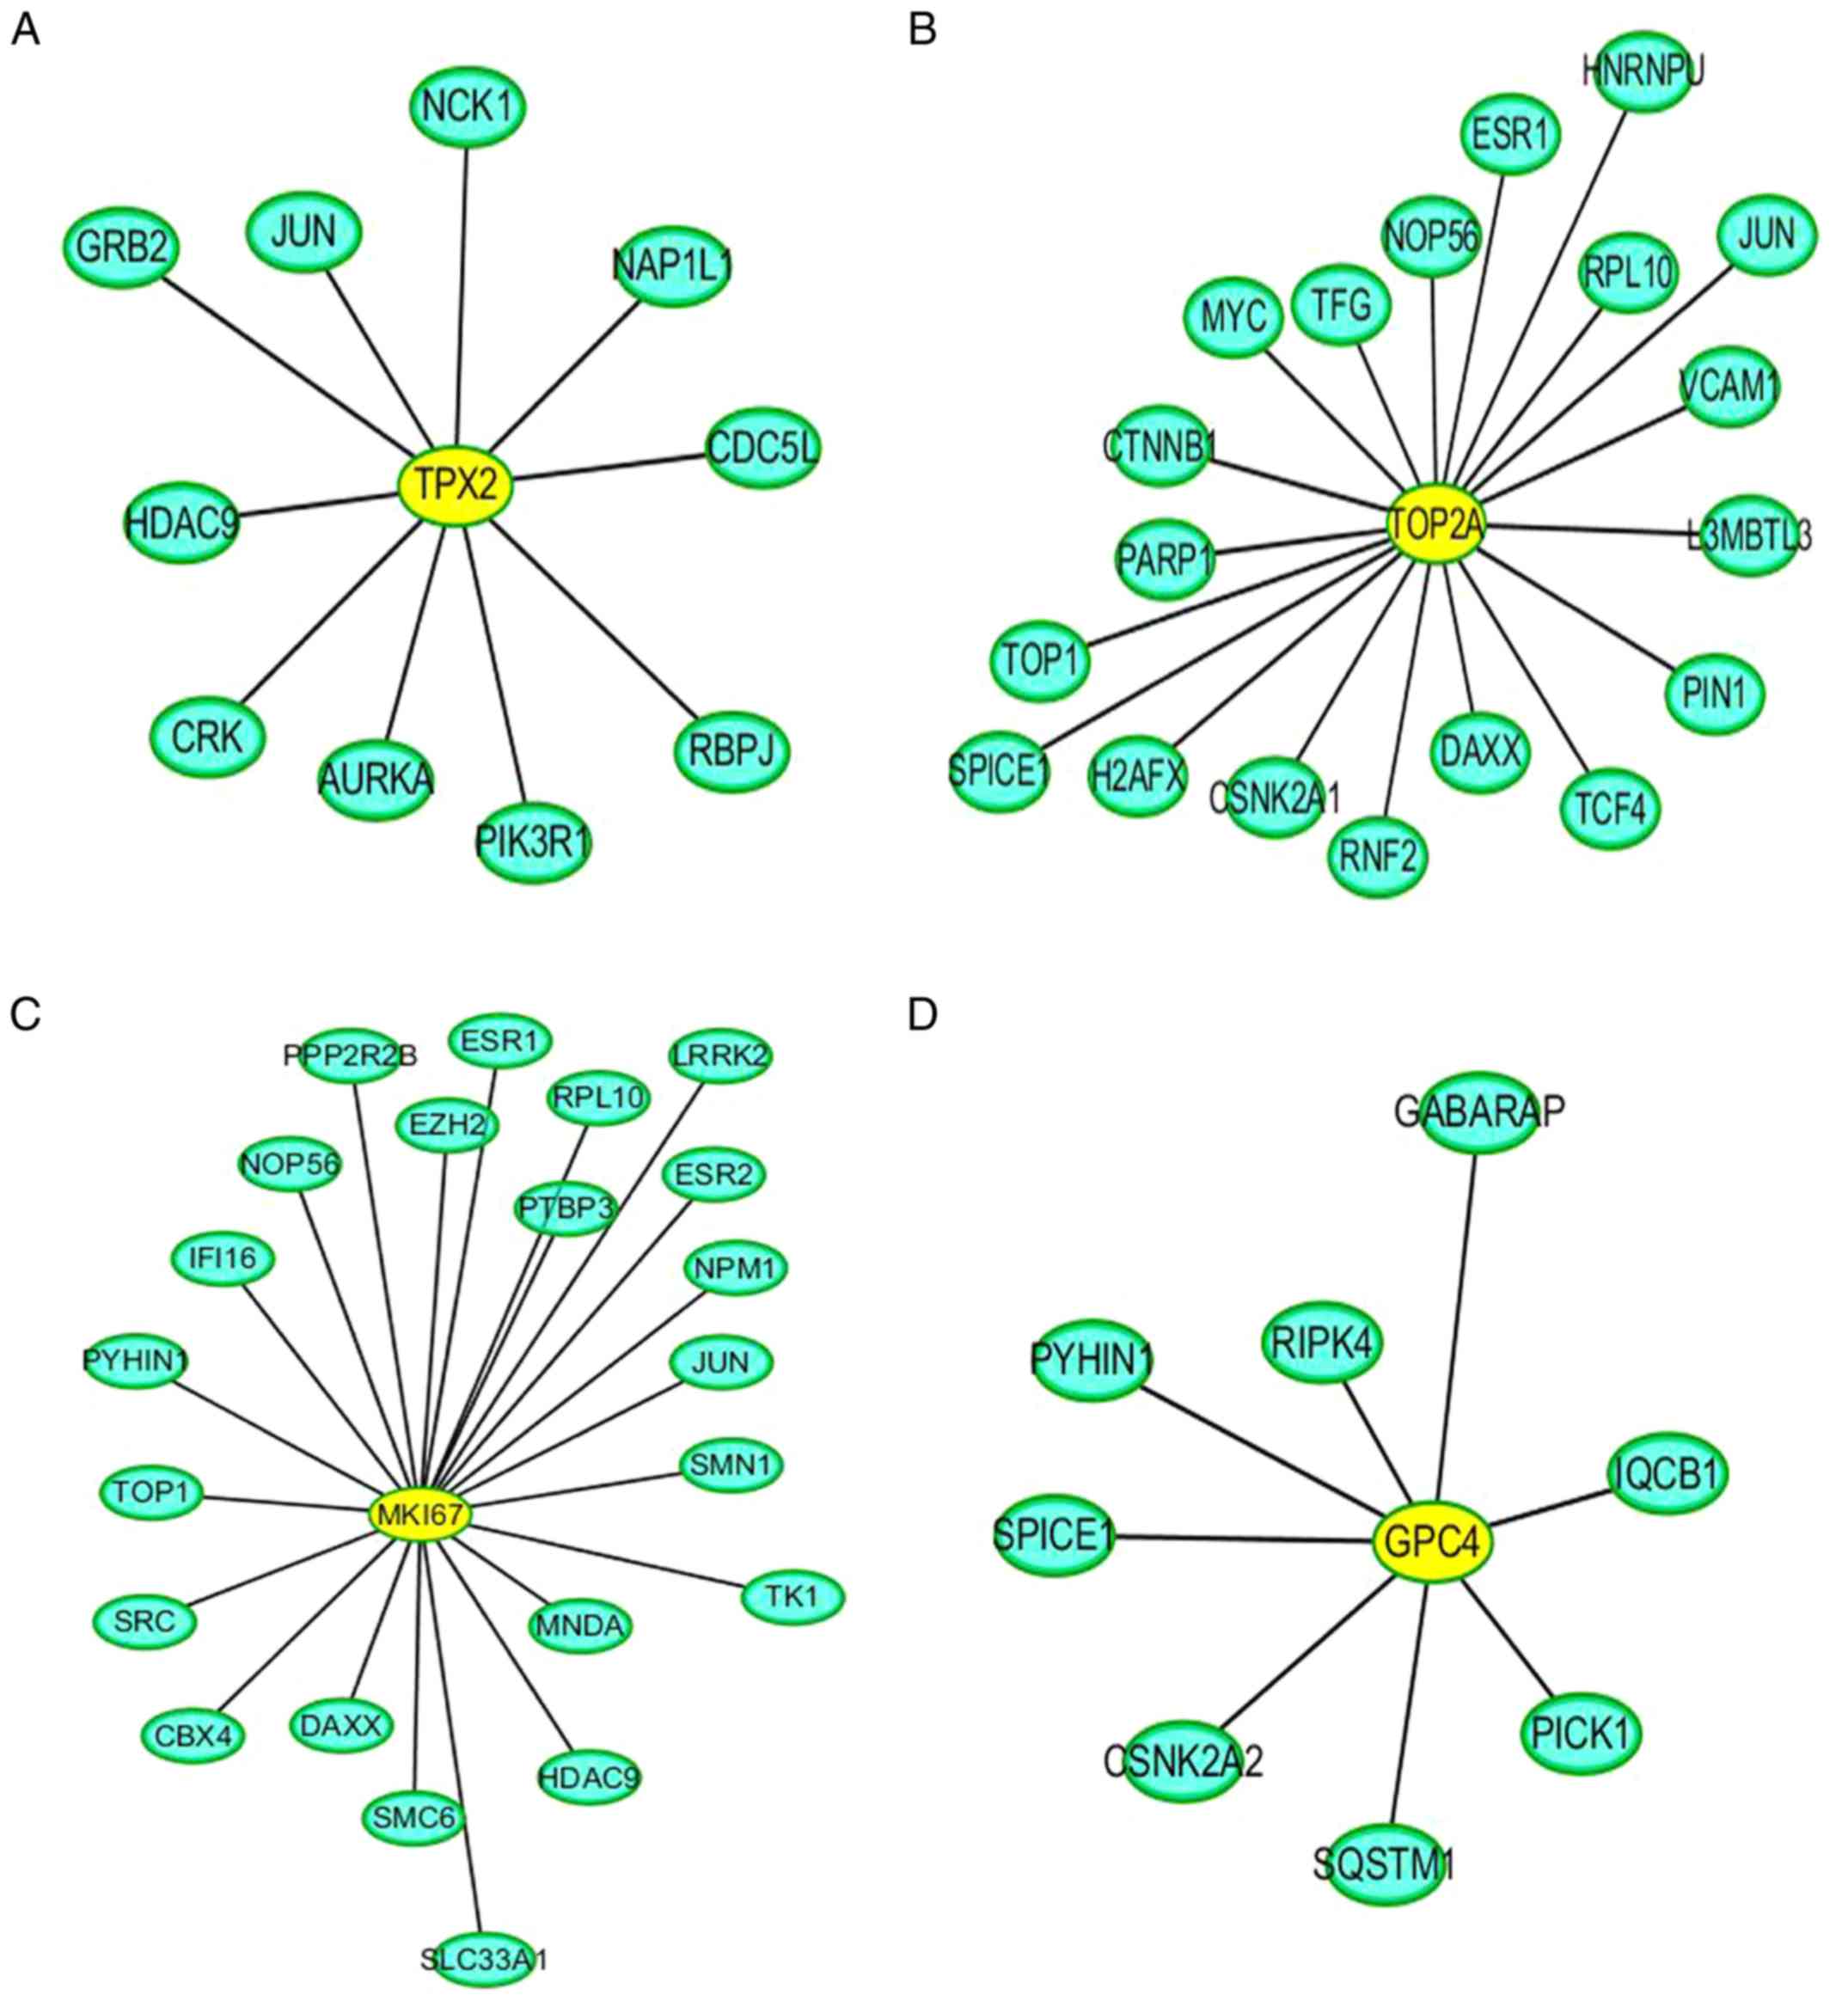
PPI network analysis
Direct interaction patterns between differently
expressed proteins can be beneficial for extracting important
information on target proteins. As shown in Fig. 10, the yellow color indicates the
differentially expressed target proteins, and the blue color
represents the proteins that interacted with these differentially
expressed target proteins. In addition, PPI analysis revealed the
connectivity degree of the protein interactions. A high
connectivity degree may be more indicative of a protein complex.
Through intergroup comparison between the ACBP-OXA and control
groups (Fig. S3), it was
demonstrated that TPX2 (Fig. 10A),
TOP2A (Fig. 10B), MKi-67 (Fig. 10C) and GPC4 (Fig. 10D) exhibited a high degree of
connectivity, which was located at the center of the network.
Discussion
The conventional single-agent chemotherapeutic
approach may not be effective in treating gastric cancer (28,29).
Combination therapy has obvious advantages in terms of enhancing
the efficacy of chemotherapeutic drugs, minimizing multidrug
resistance in cancer cells and preventing the potential adverse
effects resulting from overdose and long-term use of a single drug.
In recent years, exploring new combination therapies for treating
gastric cancer has become a focus of research (30).
OXA is a third-generation platinum-based
chemotherapy drug that has been widely used for gastrointestinal
malignancies. However, its long-term use may lead to multidrug
resistance and irreversible alterations in cancer cells, thus
reducing the efficacy of the treatment (31). Thus, current clinical research has
been focusing on finding novel anticancer drugs with higher
efficiency, lower toxicity and improved targeting ability. Previous
studies have reported that ACBP combined with chemotherapy drugs
(e.g., cisplatin and OXA) can inhibit the proliferation of MKN-45
cells, promote apoptosis and induce G2/M phase arrest (13,20).
However, the mechanisms underlying the inhibitory effects of ACBP
and chemotherapeutic drugs on cell growth remain largely unclear.
Several studies have reported that disordered protein expression is
commonly found in various types of cancer, including gastric
cancer. Hence, there is an urgent need to identify novel diagnostic
biomarkers and new therapeutic targets for the treatment of gastric
cancer.
In the post-genomic era, proteins have been proposed
as the main regulators of biological functions. A high-throughput
screening of the proteome expression patterns in cells, tissues and
organs can further improve the reliability of disease diagnosis and
prognosis prediction and accurately reflect the actual changes in
the body compared to candidate protein expression. Therefore, to
identify the key regulators and underlying mechanisms of action of
combined ACBP and OXA in the inhibition of gastric cancer cell
proliferation, iTRAQ technology was used to detect the proteomics
profile of MKN-45 cells treated with ACBP and/or OXA.
The present study systematically identified and
analyzed the differential proteome expression of the gastric cancer
cell in response to combined treatment with ACBP and OXA. The
ACBP-OXA, OXA and ACBP treatment groups exhibited 128, 111 and 17
differentially expressed proteins, respectively, compared with the
control group. The protein expression patterns analyzed by PRM were
consistent with the iTRAQ proteomics data, indicating that the
proteomics results of iTRAQ were reliable and may be used for
further analysis. Moreover, our findings demonstrated that the
number of differentially expressed proteins in the combination
therapy group was higher compared with that in either single-drug
therapy group. Thus, these differentially expressed proteins may be
used as important biomarkers for evaluating the therapeutic effect
of ACBP-OXA on gastric cancer, and guide future strategies for
treating gastric cancer. The present study revealed the important
molecular mechanism underlying the role of combined ACBP and OXA in
the treatment of gastric cancer.
Through GO annotation and KEGG pathway analysis, the
specific regulatory mechanisms and signal transduction pathways
during the process of ACBP-OXA treatment were identified, providing
new insights into the development of gastric cancer and suggesting
potential therapeutic strategies. GO functional annotation revealed
a total of 128 differentially expressed proteins in the ACBP-OXA
treatment group compared with the control group. These
differentially expressed proteins are mainly found in the nucleus
and the membrane-enclosed lumen, and can influence signaling,
cellular component organization or biogenesis and negative
regulation of biological processes. In addition, the results
indicate that these two drugs exert complementary and synergistic
effects, and their combination affects biological processes such as
growth inhibition and metabolic processes. In addition, KEGG
pathway analysis revealed that the signaling pathways in the
ACBP-OXA treatment group were enriched in ribosomes,
cancer-associated signaling pathways, chemokines, PPAR and AMPK,
among others. Enriched signaling pathways are involved in the
growth and metabolism of gastric cancer cells. Ribosomes are
involved in protein translation, which is the key to regulating
intracellular protein synthesis. KEGG analysis revealed that a
total of 19 differentially expressed proteins in the ACBP-OXA
treatment group regulate ribosome-related pathways, and may
regulate intracellular protein synthesis, protein localization and
protein transport in gastric cells. Furthermore, the ACBP treatment
group exhibited significant differences in the regulatory
mechanisms of gastric cancer cells compared with the OXA treatment
group. The enrichment results of the AMPK metabolic pathway were
consistent with those of lncRNA in MKN-45 cells treated with
ACBP-OXA (20), suggesting a close
relationship between the two. The AMPK signaling pathway mainly
regulates cell metabolism and plays a key role in the regulation of
cell energy homeostasis. ACBP-OXA may regulate the homeostasis and
energy metabolism of gastric cancer cells by regulating the AMPK
signaling pathway. Therefore, ACBP-OXA holds great promise for
treating gastric cancer and its actions may be mediated via the
AMPK signaling pathway. Furthermore, the cell cycle process was
enriched in ACBP-treated MKN-45 cells, which is consistent with our
previous report on cell cycle arrest in cancer cells treated with
ACBP. The growth inhibition of gastric cancer cells was further
supported by the findings that ACBP-OXA regulates cellular
metabolism by modulating the AMPK signaling pathway. Taken
together, the identified differentially expressed proteins
exhibited a similar expression trend with the proteomics expression
patterns validated through PRM analysis. Of note, the proteins
selected from the ACBP-OXA group exhibited lower expression levels
compared with the ACBP, OXA and control groups.
The present study demonstrated that downregulation
of the targeting protein for xenopus kinesin-like protein 2 (TPX2)
may be an important factor for promoting cell cycle arrest and
apoptosis in gastric cancer cells after treatment with ACBP-OXA.
TPX2 is a novel oncogene found in several types of cancer, and its
overexpression is strongly associated with poor prognosis. TPX2
recruits other mitosis-related factors to activate spindle assembly
and maintain the structural stability of the spindle (32–34). Thus,
TPX2 appears to be a key mediator of cell mitosis. The binding of
TPX2 to Aurora A can trigger the conformation change of Aurora A
kinase, in which the N-terminus of TPX2 binds to Aurora A to
activate and stabilize its kinase activities. In addition, TPX2 can
prevent the premature degradation of Aurora A kinase and promote
the local connection of Aurora A kinase with microtubules. The
induction of Aurora A kinase activity may interfere with the DNA
damage detection sites in the G2/M phase of the cell cycle, and the
loss of genetic integrity may promote tumor cell proliferation and
accelerate cancer progression (35–38). These
observations are consistent with our findings that ACBP-OXA
significantly induces G2/M phase arrest in MKN-45 cells. Therefore,
it may be inferred that TPX2 is among the research priorities for
combination therapy.
In addition, we found that the expression levels of
the NUSAP1, TOP2A, YAP, MKi-67 and GPC4 proteins were significantly
reduced in the ACBP-OXA group compared with the control group.
Nucleolar spindle-associated protein 1 (NuSAP1) is a
microtubule-binding protein that ensures normal cell division and
plays an important role in spindle assembly. In recent years, it
has been found that NuSAP1 is overexpressed in several cancers and
is significantly associated with tumor invasiveness (39–41). DNA
topoisomerase 2-α (TOP2A) protein expression is closely associated
with the proliferation rate of tumor cells. It has been considered
a predictive biomarker for cancer development and represents a
major target for chemotherapeutic drugs (42,43). TOP2A
plays key roles in chromosome segregation, pairing, concentration,
structure formation and alteration of DNA supercoiled structure
(44).
Yes-associated protein 1 (YAP), a member of the SCr
kinase family, is highly expressed in tumor cells and appears to be
a promising chemotherapeutic target (45). Studies have shown that YAP protein
overexpression promotes the proliferation and metastasis of tumor
cells. Thus, it is of great clinical significance in the early
diagnosis of cancer (46–48). The proliferation marker protein Ki-67
(MKi-67) antigen has been widely used as a cell proliferation
protein biomarker, which is specifically expressed in the nucleus
during the cell cycle (G1, S, G2 and M phases), but not in the
resting (G0) phase (49). MKi-67 is
the only protein whose expression pattern is closely associated
with cell proliferation and the cell-division cycle, and is
considered the best marker for discriminating proliferating,
quiescent and apoptotic cell populations. An increase in the MKi-67
proliferation index is often associated with clinical deterioration
in cancer patients. Moreover, it has been reported to be of value
in predicting the survival of cancer patients and tumor recurrence
(50–53). Glypican-4 (GPC4) is a member of the
heparin proteoglycan family that plays a key role in regulating
cell proliferation and differentiation. In addition, GPC4 has been
shown to regulate cell migration (54). A previous study reported that a GPC4
gene polymorphism (rs1048369) is closely associated with the
development of gastric cancer (55).
Notably, TPX2, TOP2A, MKi-67 and GPC4 are
collectively found centrally in the PPI network. Therefore, our
data indicate that these differentially expressed proteins can
provide important proteomics information regarding the mechanisms
of action of combination therapy in treating gastric cancer. The
iTRAQ technique was applied to analyze the proteomics profile of
MKN-45 cells treated with ACBP and OXA, identify the specific
target proteins, and determine the effect of ACBP-OXA inhibition on
MKN-45 gastric cancer cells. Taken together, these results may
provide new insights into the therapeutic role of combined ACBP and
OXA in gastric cancer.
In conclusion, the iTRAQ-based proteomics data and
PRM analyses presented herein may help elucidate the proteomics
profile of MKN-45 cells treated with ACBP and OXA. These data may
also improve our understanding of the molecular mechanisms involved
in these processes. Six differentially expressed proteins (i.e.,
TPX2, NUSAP1, TOP2A, YAP, MKi-67 and GPC4) were found to be
significantly decreased in MKN-45 cells treated with ACBP-OXA. KEGG
indicated that the AMPK signaling pathway may be one of the
important ways through which ACBP-OXA inhibits MKN-45gastric cancer
cells. PPI analyses indicated that TPX2, TOP2A, MKi-67 and GPC4
exhibited a high degree of connectivity, which was located at the
center of the network. These differentially expressed proteins may
be the key to the inhibitory effect of ACBP-OXA on MKN-45 cells,
and indicate the potential molecular mechanisms underlying this
effect. The limitation of the present study was the screening of
differentially expressed proteins by in vitro experiments.
In future studies, in vivo and in vitro experiments
must be combined to further analyze the role and mechanism of
ACBP-OXA from different perspectives and in a complementary
manner.
Supplementary Material
Supporting Data
Supporting Data
Supporting Data
Supporting Data
Supporting Data
Supporting Data
Supporting Data
Supporting Data
Supporting Data
Supporting Data
Supporting Data
Supporting Data
Acknowledgements
The authors would like to thank Shanghai Applied
Protein Technology Co., Ltd. for technical support of
proteomics.
Funding
The present study was supported by grants from the
National Natural Science Foundation of China (nos. 81660468 and
81960560) and the Autonomous Region Science and Technology
Innovation Fund (nos. 1639005 and ×201002).
Availability of data and materials
All data generated or analyzed during the present
study are included in this published article.
Authors' contributions
XS conceived and designed the experiments. YX
performed the experiments and analyzed the data. XL performed the
language editing and data statistical analysis. All authors have
read and approved the final manuscript and agree to be accountable
for all aspects of the research in ensuring that the accuracy or
integrity of any part of the work are appropriately investigated
and resolved.
Ethics approval and consent to
participate
Not applicable.
Patient consent for publication
Not applicable.
Competing interests
All the authors declare that they do not have any
commercial or associative interest that represents a conflict of
interest in connection with the work submitted.
Glossary
Abbreviations
Abbreviations:
|
iTRAQ
|
isobaric tag for relative and absolute
quantitation
|
|
ACBP
|
anticancer bioactive peptides
|
|
OXA
|
oxaliplatin
|
|
C
|
control group
|
|
PRM
|
parallel reaction monitoring
|
|
PPI
|
protein-protein interaction
|
|
GO
|
Gene Ontology
|
|
TPX2
|
targeting protein for xenopus
kinesin-like protein 2
|
|
NUSAP1
|
nucleolar spindle-associated protein
1
|
|
TOP2A
|
DNA topoisomerase 2-α
|
|
YAP
|
Yes-associated protein
|
|
GPC4
|
glypican-4
|
|
KEGG
|
Kyoto Encyclopedia of Genes and
Genomes
|
|
MS
|
mass spectrometry
|
|
SCX
|
strong cation exchange
|
|
HPLC
|
high-performance liquid
chromatography
|
|
BP
|
biological process
|
|
MF
|
molecular function
|
|
CC
|
cellular component
|
|
PBS
|
phosphate-buffered saline
|
|
HCD
|
higher-energy collisional
dissociation
|
|
BLAST
|
basic local alignment search tool
|
References
|
1
|
Ferro A, Peleteiro B, Malvezzi M, Bosetti
C, Bertuccio P, Levi F, Negri E, La Vecchia C and Lunet N:
Worldwide trends in gastric cancer mortality (1980–2011), with
predictions to 2015, and incidence by subtype. Eur J Cancer.
50:1330–1344. 2014. View Article : Google Scholar : PubMed/NCBI
|
|
2
|
Karimi P, Islami F, Anandasabapathy S,
Freedman ND and Kamangar F: Gastric cancer: Descriptive
epidemiology, risk factors, screening, and prevention. Cancer
Epidemiol Biomarkers Prev. 23:700–713. 2014. View Article : Google Scholar : PubMed/NCBI
|
|
3
|
Ferlay J, Soerjomataram I, Dikshit R, Eser
S, Mathers C, Rebelo M, Parkin DM, Forman D and Bray F: Cancer
incidence and mortality worldwide: Sources, methods and major
patterns in GLOBOCAN 2012. Int J Cancer. 136:E359–E386. 2015.
View Article : Google Scholar : PubMed/NCBI
|
|
4
|
Suzuki S, Gotoda T, Hatta W, Oyama T,
Kawata N, Takahashi A, Yoshifuku Y, Hoteya S, Nakagawa M, Hirano M,
et al: Survival benefit of additional surgery after non-curative
endoscopic submucosal dissection for early gastric cancer: A
propensity score matching analysis. Ann Surg Oncol. 24:3353–3360.
2017. View Article : Google Scholar : PubMed/NCBI
|
|
5
|
Ohnita K, Isomoto H, Shikuwa S, Yajima H,
Minami H, Matsushima K, Akazawa Y, Yamaguchi N, Fukuda E, Nishiyama
H, et al: Early and long-term outcomes of endoscopic submucosal
dissection for early gastric cancer in a large patient series. Exp
Ther Med. 7:594–598. 2014. View Article : Google Scholar : PubMed/NCBI
|
|
6
|
Di Caro S, Tao H, Grillo A, Franceschi F,
Elia C, Zocco MA, Gasbarrini G, Sepulveda AR and Gasbarrini A:
Bacillus clausii effect on gene expression pattern in small
bowel mucosa using DNA microarray analysis. Eur J Gastroenterol
Hepatol. 17:951–960. 2005. View Article : Google Scholar : PubMed/NCBI
|
|
7
|
Ray B, Gupta B and Mehrotra R: Binding of
platinum derivative, oxaliplatin to deoxyribonucleic acid:
Structural insight into antitumor action. J Biomol Struct Dyn.
37:3838–3847. 2019. View Article : Google Scholar : PubMed/NCBI
|
|
8
|
Drott J, Starkhammar H, Kjellgren K and
Berterö C: Neurotoxic side effects early in the oxaliplatin
treatment period in patients with colorectal cancer. Oncol Nurs
Forum. 45:690–697. 2018.PubMed/NCBI
|
|
9
|
Su LY, Xin HY, Liu YL, Zhang JL, Xin HW
and Su XL: Anticancer bioactive peptide (ACBP) inhibits gastric
cancer cells by upregulating growth arrest and DNA damage-inducible
gene 45A (GADD45A). Tumour Biol. 35:10051–10056. 2014. View Article : Google Scholar : PubMed/NCBI
|
|
10
|
Zhao YY, Peng SD and Su XL: Effects of
anti-cancer bioactive peptide on cell cycle in human nasopharyngeal
carcinoma strain CNE. Zhonghua Er Bi Yan Hou Tou Jing Wai Ke Za
Zhi. 41:607–611. 2006.(In Chinese). PubMed/NCBI
|
|
11
|
Xing Z, Yu L, Li X and Su X: Anticancer
bioactive peptide-3 inhibits human gastric cancer growth by
targeting miR-338-5p. Cell Biosci. 6:532016. View Article : Google Scholar : PubMed/NCBI
|
|
12
|
Su X, Dong C, Zhang J, Su L, Wang X, Cui H
and Chen Z: Combination therapy of anti-cancer bioactive peptide
with Cisplatin decreases chemotherapy dosing and toxicity to
improve the quality of life in xenograft nude mice bearing human
gastric cancer. Cell Biosci. 4:72014. View Article : Google Scholar : PubMed/NCBI
|
|
13
|
Li X, Wu H, Ouyang X, Zhang B and Su X:
New bioactive peptide reduces the toxicity of chemotherapy drugs
and increases drug sensitivity. Oncol Rep. 38:129–140. 2017.
View Article : Google Scholar : PubMed/NCBI
|
|
14
|
Su L, Xu G, Shen J, Tuo Y, Zhang X, Jia S,
Chen Z and Su X: Anticancer bioactive peptide suppresses human
gastric cancer growth through modulation of apoptosis and the cell
cycle. Oncol Rep. 23:3–9. 2010.PubMed/NCBI
|
|
15
|
Moulder R, Bhosale SD, Goodlett DR and
Lahesmaa R: Analysis of the plasma proteome using iTRAQ and
TMT-based Isobaric labeling. Mass Spectrom Rev. 37:583–606. 2018.
View Article : Google Scholar : PubMed/NCBI
|
|
16
|
Zhang P, Dai Y, Xiong J, Zhu S, Zhao M,
Ding S and Li J: iTRAQ-based differential proteomics analysis of
the brains in a rat model of delayedcarbon monoxide encephalopathy.
Brain Res Bull. 137:329–337. 2018. View Article : Google Scholar : PubMed/NCBI
|
|
17
|
Li Y, Wang Z, Zhao Z and Cui Y:
iTRAQ-based proteome profiling of hyposaline responses in zygotes
of the Pacific oyster Crassostrea gigas. Comp Biochem Physiol Part
D Genomics Proteomics. 30:14–24. 2019. View Article : Google Scholar : PubMed/NCBI
|
|
18
|
Takaishi S, Okumura T, Tu S, Wang SS,
Shibata W, Vigneshwaran R, Gordon SA, Shimada Y and Wang TC:
Identification of gastric cancer stem cells using the cell surface
marker CD44. Stem Cells. 27:1006–1020. 2009. View Article : Google Scholar : PubMed/NCBI
|
|
19
|
Zhang P, Zhu S, Zhao M, Zhao P, Zhao H,
Deng J and Li J: Identification of plasma biomarkers for diffuse
axonal injury in rats by iTRAQ-coupled LC-MS/MS and bioinformatics
analysis. Brain Res Bull. 142:224–232. 2018. View Article : Google Scholar : PubMed/NCBI
|
|
20
|
Han W, Xiao R, Zhang C, Suyila Q, Li X and
Su X: Selecting lncRNAs in gastric cancer cells for directed
therapy with bioactive peptides and chemotherapy drugs. Oncotarget.
8:86082–86097. 2017. View Article : Google Scholar : PubMed/NCBI
|
|
21
|
Bhusal P, Rahiri JL, Sua B, McDonald JE,
Bansal M, Hanning S, Sharma M, Chandramouli K, Harrison J, Procter
G, et al: Comparing human peritoneal fluid and phosphate-buffered
saline for drug delivery: Do we need bio-relevant media? Drug Deliv
Transl Res. 8:708–718. 2018. View Article : Google Scholar : PubMed/NCBI
|
|
22
|
Thorat AA and Suryanarayanan R:
Characterization of phosphate buffered saline (PBS) in frozen State
and after Freeze-drying. Pharm Res. 36:982019. View Article : Google Scholar : PubMed/NCBI
|
|
23
|
Yu L, Yang L, An W and Su X: Anticancer
bioactive peptide-3 inhibits human gastric cancer growth by
suppressing gastric cancer stem cells. J Cell Biochem. 115:697–711.
2014. View Article : Google Scholar : PubMed/NCBI
|
|
24
|
Wisniewski JR, Zougman A, Nagaraj N and
Mann M: Universal sample preparation method for proteome analysis.
Nat Methods. 6:359–362. 2009. View Article : Google Scholar : PubMed/NCBI
|
|
25
|
Götz S, García-Gómez JM, Terol J, Williams
TD, Nagaraj SH, Nueda MJ, Robles M, Talón M, Dopazo J and Conesa A:
High-throughput functional annotation and data mining with the
Blast2GO suite. Nucleic Acids Res. 36:3420–3435. 2008. View Article : Google Scholar : PubMed/NCBI
|
|
26
|
Peterson AC, Russell JD, Bailey DJ,
Westphall MS and Coon JJ: Parallel reaction monitoring for high
resolution and high mass accuracy quantitative, targeted
proteomics. Mol Cell Proteomics. 11:1475–1488. 2012. View Article : Google Scholar : PubMed/NCBI
|
|
27
|
MacLean B, Tomazela DM, Shulman N,
Chambers M, Finney GL, Frewen B, Kern R, Tabb DL, Liebler DC and
MacCoss MJ: Skyline: An open source document editor for creating
and analyzing targeted proteomics experiments. Bioinformatics.
26:966–968. 2010. View Article : Google Scholar : PubMed/NCBI
|
|
28
|
Ito Y, Yoshikawa T, Fujiwara M, Kojima H,
Matsui T, Mochizuki Y, Cho H, Aoyama T, Ito S, Misawa K, et al:
Quality of life and nutritional consequences after aboral pouch
reconstruction following total gastrectomy for gastric cancer:
Randomized controlled trial CCG1101. Gastric Cancer. 19:977–985.
2016. View Article : Google Scholar : PubMed/NCBI
|
|
29
|
Kalfusova A, Hilska I, Krskova L, Kalinova
M, Linke Z and Kodet R: Gastrointestinal stromal
tumors-quantitative detection of the Ki-67, TPX2, TOP2A, and hTERT
telomerase subunit mRNA levels to determine proliferation activity
and a potential for aggressive biological behavior. Neoplasma.
63:484–492. 2016. View Article : Google Scholar : PubMed/NCBI
|
|
30
|
Villanueva MT: Combination therapy: Update
on gastric cancer in East Asia. Nat Rev Clin Oncol. 8:6902011.
View Article : Google Scholar : PubMed/NCBI
|
|
31
|
Berretta M, Taibi R, Bearz A, La Mura N,
Berretta S, Tirelli U and Frustaci S: Dysphonia as an unusual toxic
event of oxaliplatin-based chemotherapy. J Chemother. 16:595–598.
2004. View Article : Google Scholar : PubMed/NCBI
|
|
32
|
Wadsworth P: Tpx2. Curr Biol.
25:R1156–R1158. 2015. View Article : Google Scholar : PubMed/NCBI
|
|
33
|
Neumayer G, Belzil C, Gruss OJ and Nguyen
MD: TPX2: Of spindle assembly, DNA damage response, and cancer.
Cell Mol Life Sci. 71:3027–3047. 2014. View Article : Google Scholar : PubMed/NCBI
|
|
34
|
Alfaro-Aco R and Petry S: How TPX2 helps
microtubules branch out. Cell Cycle. 16:1560–1561. 2017. View Article : Google Scholar : PubMed/NCBI
|
|
35
|
Lee SY, Kim EY, Kim KH and Lee KA:
Bcl2l10, a new Tpx2 binding partner, is a master regulator of
Aurora kinase A in mouse oocytes. Cell Cycle. 15:3296–3305. 2016.
View Article : Google Scholar : PubMed/NCBI
|
|
36
|
Garrido G and Vernos I: Non-centrosomal
TPX2-dependent regulation of the Aurora A Kinase: Functional
implications for healthy and pathological cell division. Front
Oncol. 6:882016. View Article : Google Scholar : PubMed/NCBI
|
|
37
|
Grover A, Singh R, Shandilya A, Priyandoko
D, Agrawal V, Bisaria VS, Wadhwa R, Kaul SC and Sundar D:
Ashwagandha derived withanone targets TPX2-Aurora A complex:
Computational and experimental evidence to its anticancer activity.
PLoS One. 7:e308902012. View Article : Google Scholar : PubMed/NCBI
|
|
38
|
Pascreau G, Eckerdt F, Lewellyn AL,
Prigent C and Maller JL: Phosphorylation of p53 is regulated by
TPX2-Aurora A in xenopus oocytes. J Biol Chem. 284:5497–5505. 2009.
View Article : Google Scholar : PubMed/NCBI
|
|
39
|
Liu Z, Guan C, Lu C, Liu Y, Ni R, Xiao M
and Bian Z: High NUSAP1 expression predicts poor prognosis in colon
cancer. Pathol Res Pract. 214:968–973. 2018. View Article : Google Scholar : PubMed/NCBI
|
|
40
|
Gordon CA, Gong X, Ganesh D and Brooks JD:
NUSAP1 promotes invasion and metastasis of prostate cancer.
Oncotarget. 8:29935–29950. 2017. View Article : Google Scholar : PubMed/NCBI
|
|
41
|
Han G, Wei Z, Cui H, Zhang W, Wei X, Lu Z
and Bai X: NUSAP1 gene silencing inhibits cell proliferation,
migration and invasion through inhibiting DNMT1 gene expression in
human colorectal cancer. Exp Cell Res. 367:216–221. 2018.
View Article : Google Scholar : PubMed/NCBI
|
|
42
|
Ye M, He Z, Dai W, Li Z, Chen X and Liu J:
A TOP2A-derived cancer panel drives cancer progression in papillary
renal cell carcinoma. Oncol Lett. 16:4169–4178. 2018.PubMed/NCBI
|
|
43
|
Engstrom MJ, Ytterhus B, Vatten LJ, Opdahl
S and Bofin AM: TOP2A gene copy number change in breast cancer. J
Clin Pathol. 67:420–425. 2014. View Article : Google Scholar : PubMed/NCBI
|
|
44
|
de Resende MF, Vieira S, Chinen LT,
Chiappelli F, da Fonseca FP, Guimarães GC, Soares FA, Neves I,
Pagotty S, Pellionisz PA, et al: Prognostication of prostate cancer
based on TOP2A protein and gene assessment: TOP2A in prostate
cancer. J Transl Med. 11:362013. View Article : Google Scholar : PubMed/NCBI
|
|
45
|
Zhang J, Yang YC, Zhu JS, Zhou Z and Chen
WX: Clinicopathologic characteristics of YES-associated protein 1
overexpression and its relationship to tumor biomarkers in gastric
cancer. Int J Immunopathol Pharmacol. 25:977–987. 2012. View Article : Google Scholar : PubMed/NCBI
|
|
46
|
Chang HL, Chen HA, Bamodu OA, Lee KF,
Tzeng YM, Lee WH and Tsai JT: Ovatodiolide suppresses
yes-associated protein 1-modulated cancer stem cell phenotypes in
highly malignant hepatocellular carcinoma and sensitizes cancer
cells to chemotherapy in vitro. Toxicol In Vitro. 51:74–82. 2018.
View Article : Google Scholar : PubMed/NCBI
|
|
47
|
Kang W, Tong JH, Chan AW, Lee TL, Lung RW,
Leung PP, So KK, Wu K, Fan D, Yu J, et al: Yes-associated protein 1
exhibits oncogenic property in gastric cancer and its nuclear
accumulation associates with poor prognosis. Clin Cancer Res.
17:2130–2139. 2011. View Article : Google Scholar : PubMed/NCBI
|
|
48
|
Lee SE, Lee JU, Lee MH, Ryu MJ, Kim SJ,
Kim YK, Choi MJ, Kim KS, Kim JM, Kim JW, et al: RAF kinase
inhibitor-independent constitutive activation of Yes-associated
protein 1 promotes tumor progression in thyroid cancer.
Oncogenesis. 2:e552013. View Article : Google Scholar : PubMed/NCBI
|
|
49
|
Li HH, Qi LN, Ma L, Chen ZS, Xiang BD and
Li LQ: Effect of KI-67 positive cellular index on prognosis after
hepatectomy in Barcelona Clinic Liver Cancer stage A and B
hepatocellular carcinoma with microvascular invasion. Onco Targets
Ther. 11:4747–4754. 2018. View Article : Google Scholar : PubMed/NCBI
|
|
50
|
Yoshikawa K, Shimada M, Higashijima J,
Nakao T, Nishi M, Takasu C, Kashihara H, Eto S and Bando Y: Ki-67
and survivin as predictive factors for rectal cancer treated with
preoperative chemoradiotherapy. Anticancer Res. 38:1735–1739.
2018.PubMed/NCBI
|
|
51
|
Warli SM, Kadar DD and Siregar GP: Ki-67
expression as a predictive factor of muscle invasion in bladder
cancer. Open Access Maced J Med Sci. 6:260–262. 2018. View Article : Google Scholar : PubMed/NCBI
|
|
52
|
Belinsky I, Murchison AP, Evans JJ,
Andrews DW, Farrell CJ, Casey JP, Curtis MT, Nowak Choi KA,
Werner-Wasik M and Bilyk JR: Spheno-orbital meningiomas: An
analysis based on World health organization classification and
Ki-67 proliferative index. Ophthalmic Plast Reconstr Surg.
34:143–150. 2018. View Article : Google Scholar : PubMed/NCBI
|
|
53
|
Ishibashi N, Nishimaki H, Maebayashi T,
Hata M, Adachi K, Sakurai K, Masuda S and Okada M: Changes in the
Ki-67 labeling index between primary breast cancer and metachronous
metastatic axillary lymph node: A retrospective observational
study. Thorac Cancer. 10:96–102. 2019. View Article : Google Scholar : PubMed/NCBI
|
|
54
|
Dono R: Glypican 4 down-regulation in
pluripotent stem cells as a potential strategy to improve
differentiation and to impair tumorigenicity of cell transplants.
Neural Regen Res. 10:1576–1577. 2015. View Article : Google Scholar : PubMed/NCBI
|
|
55
|
Zhao D, Liu S, Sun L, Zhao Z, Liu S, Kuang
X, Shu J and Luo B: Glypican-4 gene polymorphism (rs1048369) and
susceptibility to Epstein-Barr virus-associated and -negative
gastric carcinoma. Virus Res. 220:52–56. 2016. View Article : Google Scholar : PubMed/NCBI
|