Introduction
Lung cancer is the leading cause of cancer-related
deaths worldwide, with non-small cell lung cancer (NSCLC) making up
the bulk of newly diagnosed cases (1). NSCLC is essentially untreatable,
although many strategies have been proposed to improve patient
survival (2). Most patients are
diagnosed at an advanced stage, and half of them have distant
metastatic disease at initial diagnosis, with poor prognosis
(3). Thus, there is an urgent need
for novel therapeutic targets and for advanced therapeutic
strategies for the effective diagnosis and treatment of NSCLC.
With the development of genomic technologies, more
and more molecular information including The Cancer Genome Atlas
(TCGA) and Gene Expression Omnibus (GEO) represent a remarkable
opportunity to analyze the gene expression data for the discovery
of novel targets (4). The TCGA
database has provided abundant resources for biological discovery
due to the fact that it collects data related to over 30 types of
human cancers (5). A recent study has
reported that abnormal epigenetic modulation of mRNAs by microRNAs
(miRNAs) may be associated with tumorigenesis (6). miRNAs are a class of endogenous RNAs of
approximately 19–24 nucleotides (7),
which play regulatory roles in cancers by targeting mRNAs for
translational repression or degradation (8). Prognostic gene signatures for NSCLC have
uncovered mutations in mRNAs and some aberrantly expressed miRNAs
(9,10). For instance, the expression of miR-34
is often altered in NSCLC tumor tissues. Of note, miR-34 targets
key oncogenes involved in the tumorigenic process, such as BCL2,
MYC, and MET (11,12). A recent simultaneous analysis of mRNA
and miRNA expression profiles in NSCLC discovered 3,530
differentially expressed genes (DEGs) and 211 differentially
expressed miRNAs (DEMs) in NSCLC when compared with matched
para-carcinoma tissues (6). However,
the combined potential of these DEGs and DEMs for effective
molecular diagnosis of NSCLC still remains unclear.
In the present study, we re-analyzed the expression
profiles of mRNAs and miRNAs in NSCLC in order to explore more
specific molecular targets involved in the tumorigenesis of NSCLC,
with the aim of establishing a combined diagnostic model based on
several key genes and miRNAs. We perform a survival analysis for
some key genes and miRNAs, followed by a multivariate logistic
regression analysis.
Materials and methods
Expression profile dataset
collection
Two datasets, GSE102286 and GSE101929 (13), containing the largest sample data sets
of miRNAs and mRNAs with consistent samples (non-small cell lung
cancer, tissue samples) collected in the past three years (since
2017) were downloaded from the GEO database. Briefly, GSE102286 is
an miRNA expression profile dataset of 91 tumor tissue samples and
88 normal tissue samples from NSCLC patients obtained using the
GPL23871 NanoString nCounter Human miRNA Expression Assay v1.6
platform. GSE101929 is an mRNA expression profile of 32 NSCLC tumor
and 34 normal tissue samples from NSCLC patients, obtained using
the GPL570 [HG-U133_Plus_2] Affymetrix Human Genome U133 Plus 2.0
Array platform. Moreover, the two sets of non-small cell lung
cancer samples were confirmed to be lung adenocarcinoma.
Additionally, lung adenocarcinoma miRNA and mRNA expression
profiles were downloaded from the TCGA database, and information
from 518 tumor and 58 adjacent tissue samples (control) were
obtained. Of these samples, 490 had detailed clinical
information.
Data preprocessing
After the CEL data were downloaded from the GEO
database, the Oligo R software package (14) (version 1.34.0) was used for background
correction of expression values and for uniform preprocessing of
expression profile data, including format transformation, supplying
missing values, background correction (MAS method), and data
normalization by quantiles. The probes were annotated using the
platform annotation file to remove the unmatched probes. If
different probes mapped to the same gene or miRNA, the mean value
of the different probes was used as the final expression value. The
preprocessed data from TCGA, including the mRNA and miRNA counts,
were downloaded.
Screening of differentially expressed
genes/miRNAs
The expression matrices were divided into disease
and control groups and were screened for DEMs and DEGs in the three
datasets. Briefly, the processed data were analyzed using the
paired samples t-test and corrected with the Benjamini/Hochberg
method. An adjusted P-value <0.05 and |log2 fold change
(FC)|>1 were used as the threshold.
Venn analysis of DEMs and DEGs
The DEMs and DEGs that were common (overlapping in
the Venn diagram) to both the TCGA and GEO (GSE102286 for DEM,
GSE101929 for DEG) datasets were selected for subsequent
analyses.
miRNA and target gene
The miRWalk2.0 (15)
tool was used to predict the miRNA target genes for all the
overlapped DEMs. The commonly used databases (miRWalk (http://mirwalk.umm.uni-heidelberg.de/),
miRanda (http://miranda.org.uk/), miRDB
(http://mirdb.org/), miRNAMap (16), RNA22 (http://www.mybiosoftware.com/rna22-v2-microrna-target-detection.html)
and Targetscan (http://www.targetscan.org/vert_72/)) were used for
these predictions. The miRNA target pairs that were predicted by at
least five databases were matched with the overlapped DEGs to
obtain the DEM-DEG regulatory pairs. These regulatory relation
pairs were visualized using Cytoscape (version 3.2.0) (17) and the topological properties of the
network nodes were also analyzed.
Functional analysis of miRNAs and
target genes
Based on the DEM-DEG interaction information, the
miRNAs were subjected to Kyoto Encyclopedia of Genes and Genomes
(KEGG) enrichment analysis (18)
using the R software package clusterProfiler (19) (version 2.4.3). Results with P<0.05
and count >2 were considered to be significantly enriched.
Moreover, functional enrichment analyses using Gene
Ontology (GO) (20) and Kyoto
Encyclopedia of Genes and Genomes (KEGG) were conducted on the DEGs
of the DEM-DEG pairs using the gene functional enrichment analysis
tool DAVID (version 6.8) (21,22).
P<0.05 and count >2 were used as the enrichment
threshold.
Protein-protein interaction (PPI)
network analysis
Using STRING (version 10.0) (23), the DEGs of the DEM-DEG pairs were
analyzed to identify interactions between the DEGs. The PPI network
was constructed using Cytoscape 3.2.0 and a PPI score of 0.4
(medium confidence). PPI network clustering modules were then
analyzed using the Cytoscape plugin MCODE (version 1.4.2) (24) with a threshold of score >10. KEGG
and GO enrichment analyses were then performed on the significant
clustering modules.
Survival analysis of key miRNAs and
DEGs
Using the miRNA matrix data from the regulatory
network, the genes in the key TCGA modules and clinical
information, the nodes were divided into high and low expression
groups using the Survival R software package (25) (version 2.42–6) by median expression.
Genes or miRNAs with a correlation coefficient of P<0.05 were
considered to influence survival prognosis, and the Kaplan-Meier
(K-M) curve was drawn. Clinical information was analyzed based on
the overall survival provided by TCGA.
Tissues samples from patients with
NSCLC
This study was approved by the Ethics Committee of
The Affiliated Huai'an Hospital of Xuzhou Medical University
(Huai'an, China). A total of 32 pairs of NSCLC and normal tissue
samples were collected from 45 NSCLC patients between January 2016
and December 2018 at the Affiliated Huai'an Hospital of Xuzhou
Medical University. Each participant signed an informed consent
form before the samples were collected. The clinical pathological
parameters were as follows: 19 males and 13 females; average age
was 54±12 years; pathological types: Squamous cell carcinoma (14
cases), adenocarcinoma (18 cases), low differentiation (18 cases)
and high differentiation (14 cases); there were 3 cases of stage I,
6 cases of stage II, 22 cases of stage III and 1 case of stage
IV.
Cell lines and culture conditions
Additionally, human pulmonary alveolar epithelial
cells (HPAEpiC; purchased from the Shanghai Guangdao Biotechnology
Co., Ltd.) and three types of NSCLC cell lines (A549, H1299 and
H460; purchased from the Cell Bank of the Chinese Academy of
Science) were used in this study. All cells were culture at 37°C in
a humidified atmosphere of 5% CO2 using Dulbecco's
modified Eagles medium (DMEM; Solarbio, Shanghai, China) with 10%
fetal bovine serum (FBS; Gibco; Thermo Fisher Scientific, Inc.).
Before verification of key miRNAs (those with the 18 highest
degrees in the DEM-DEG regulatory network) and mRNAs (those with
the five highest degrees in the significant modules) in the NSCLC
tissue samples, the expression levels of these miRNAs and mRNAs
were measured in HPAEpiC and three types of NSCLC cell lines using
RT-qPCR. The mRNAs and miRNAs that had significantly differential
expression in the HPAEpiC and at least two NSCLC cell lines were
selected for verification in the tissue samples.
Real-time quantitative PCR
(RT-qPCR)
Total RNA was isolated from the cells and tissues
using TRIzol reagent (Takara). Reverse transcription was conducted
with the reverse transcription kit and qPCR kit (Takara). PCR was
carried out using the SYBR Green qPCR Kit (Thermo Fisher
Scientific, Inc.) with Applied Biosystems Viia7 Real-Time PCR
System (Thermo Fisher Scientific, Inc.). Relative expression levels
of mRNA were normalized to β-actin and calculated with the
2−ΔΔCq method. Primers of mRNA used in this study are
listed in Table SI. The levels of
miRNAs were measured by RT-qPCR using miDETECT A Track miRNA
qRT-PCR Kit (RiboBio Co.). The primers for miRNAs and U6 small
nuclear RNA were obtained from RiboBio Co. The sequences are
covered by a patent. Analyses of miRNA expression were normalized
to the expression of internal control U6 using the
2−ΔΔCq method.
Statistical analysis
Statistical analyses were performed using SPSS 23.0
(IBM Corp.). Differences between groups were analyzed by one-way
analysis of variance (ANOVA) with the LSD test and were considered
significant if the P-value was <0.05.
Additionally, the Receiver Operating Characteristic
(ROC) curves for key miRNAs and mRNAs were drawn using GraphPad
Prism 7 (GraphPad Software, Inc.). Multivariate logistic regression
analysis was then performed for key miRNAs and mRNAs with an area
under the curve (AUC) >0.7 to explore the diagnosis value of the
combined multi-index for NSCLC. The contingency table result was
tested using the Hosmer-Lemeshow test for logistic regression
analysis. A scatter diagram was drawn of the actual observed values
(Observed) and the model-predicted values (Expected) and a linear
trend line was fitted (calibration line) to obtain the calibration
curve. The equation y=x was used as the standard line equation. The
closer the calibration line was to the standard line equation, the
better the calibration capability of the model would be. In
addition, the C-index and ROC curves were used to verify the
fitting effect of the model. A C-index >0.9 and AUC >0.9
indicated that the model had a good fitting effect.
Survival analysis was performed by Kaplan-Meier with
log rank test, comparing high and low expression of each gene of
interest (mean expression as the cut off value).
Network analysis for key miRNAs and
mRNAs
After RT-qPCR and multivariate logistic regression
analysis, reserved key miRNAs were subjected to miRNA-DEGs
interaction analysis. The miRNA-DEG network was constructed using
Cytoscape 3.2.0, and the topological properties of the network
nodes were analyzed.
PPI network analysis of the DEGs in the miRNA-DEG
interaction network was conducted with a low confidence PPI score
of 0.15. The modules in this network were analyzed using MCODE and
scores >5 were regarded as significant. KEGG and GO enrichment
analyses were carried out for the modules with significant PPI
scores.
Furthermore, transcription factors (TFs) were
predicted for the significant module genes using the
Overrepresentation Enrichment Analysis (ORA) method in the
WebGestalt toolkit (26). Cytoscape
was used to construct the regulatory network from the top 10 TFs,
with significant P-values.
Results
DEM and DEG identification
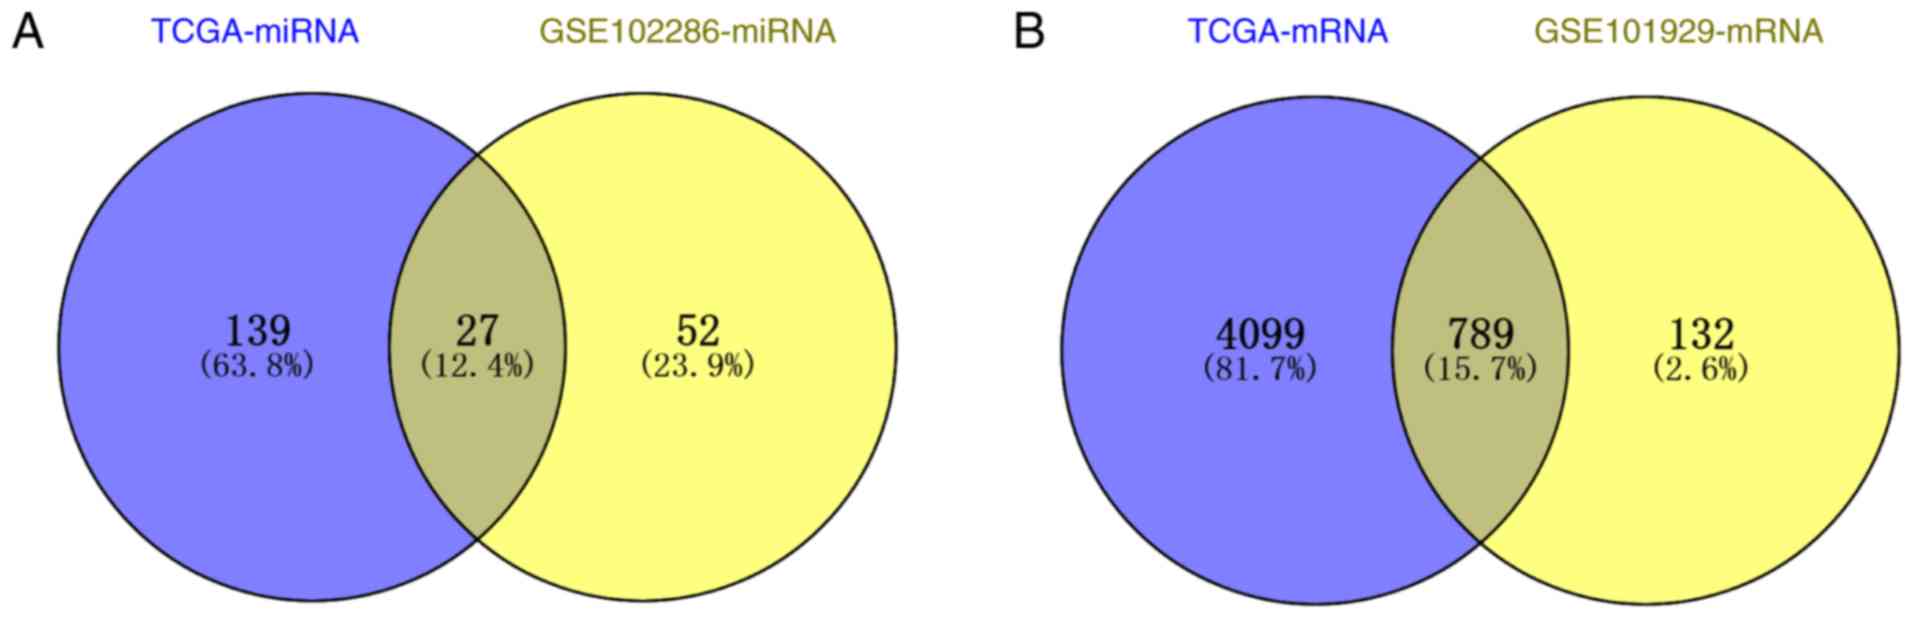
After preprocessing the miRNA data, a total of 166
DEMs were identified from the TCGA database, of which 127 were
significantly upregulated and 39 were significantly downregulated.
A total of 79 DEMs were obtained from GSE102286, of which 51 were
upregulated and 28 were downregulated. Venn diagram analysis
identified 27 DEMs common to both datasets (Fig. 1A). Two of the 27 DEMs had opposite
changes in expression in the two datasets; thus, the remaining 25
DEMs with consistent changes in expression (20 upregulated and five
downregulated) were used for subsequent analyses.
From the mRNA data, a total of 4,888 DEGs consisting
of 1,887 significantly upregulated DEGs and 3,001 significantly
downregulated DEGs were obtained from TCGA. While 921 DEGs were
obtained from GSE101929, consisting of 309 upregulated genes and
612 downregulated genes, Venn diagram analysis identified 789
common DEGs, of which 262 were upregulated and 527 were
downregulated (Fig. 1B).
DEM-DEG regulatory network
construction
Using the miRWalk2.0 database, 19 of the 25
overlapping DEMs were predicted to have miRNA target genes. The
target DEGs were selected from the miRNA target pairs, finally
producing 695 DEM-DEG relationship pairs. The 695 DEM-DEG pairs
included 15 upregulated DEMs, 4 downregulated DEMs, 99 upregulated
DEGs and 239 downregulated DEGs. A regulatory network was
constructed with 357 nodes and 695 relationship pairs (Fig. 2A). The nodes with the highest degrees
(top 20) are shown in Table I.
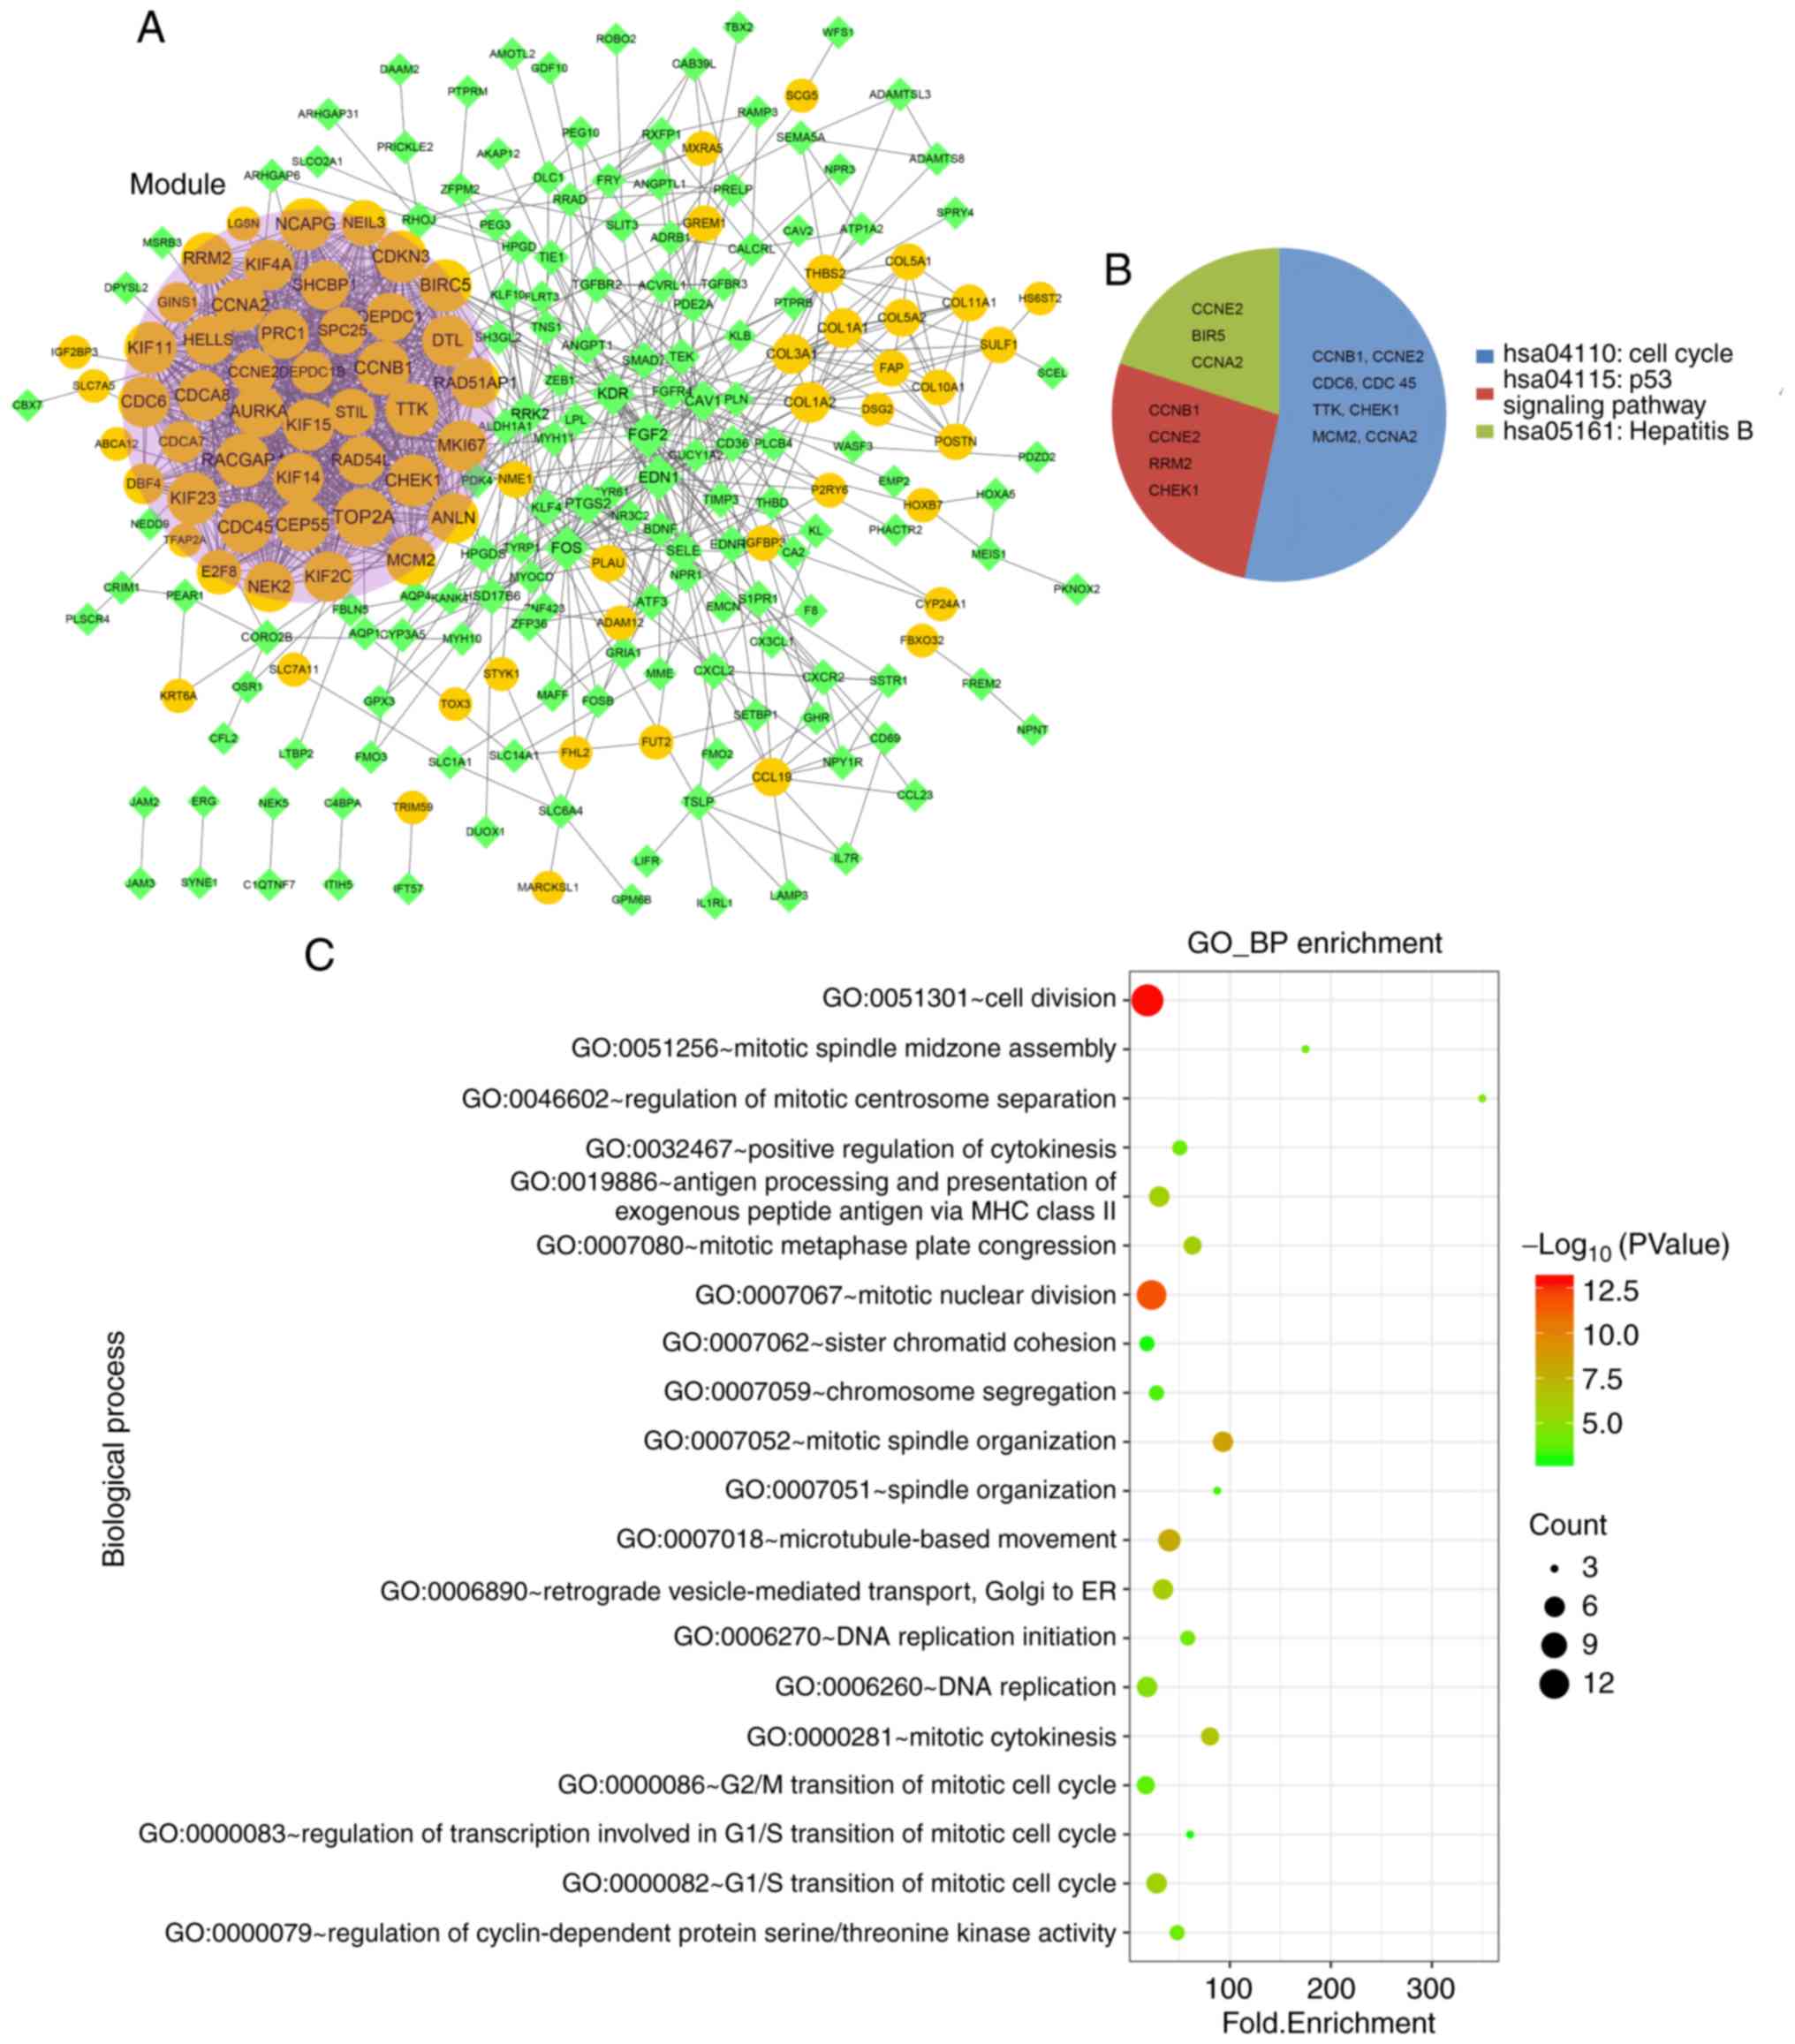
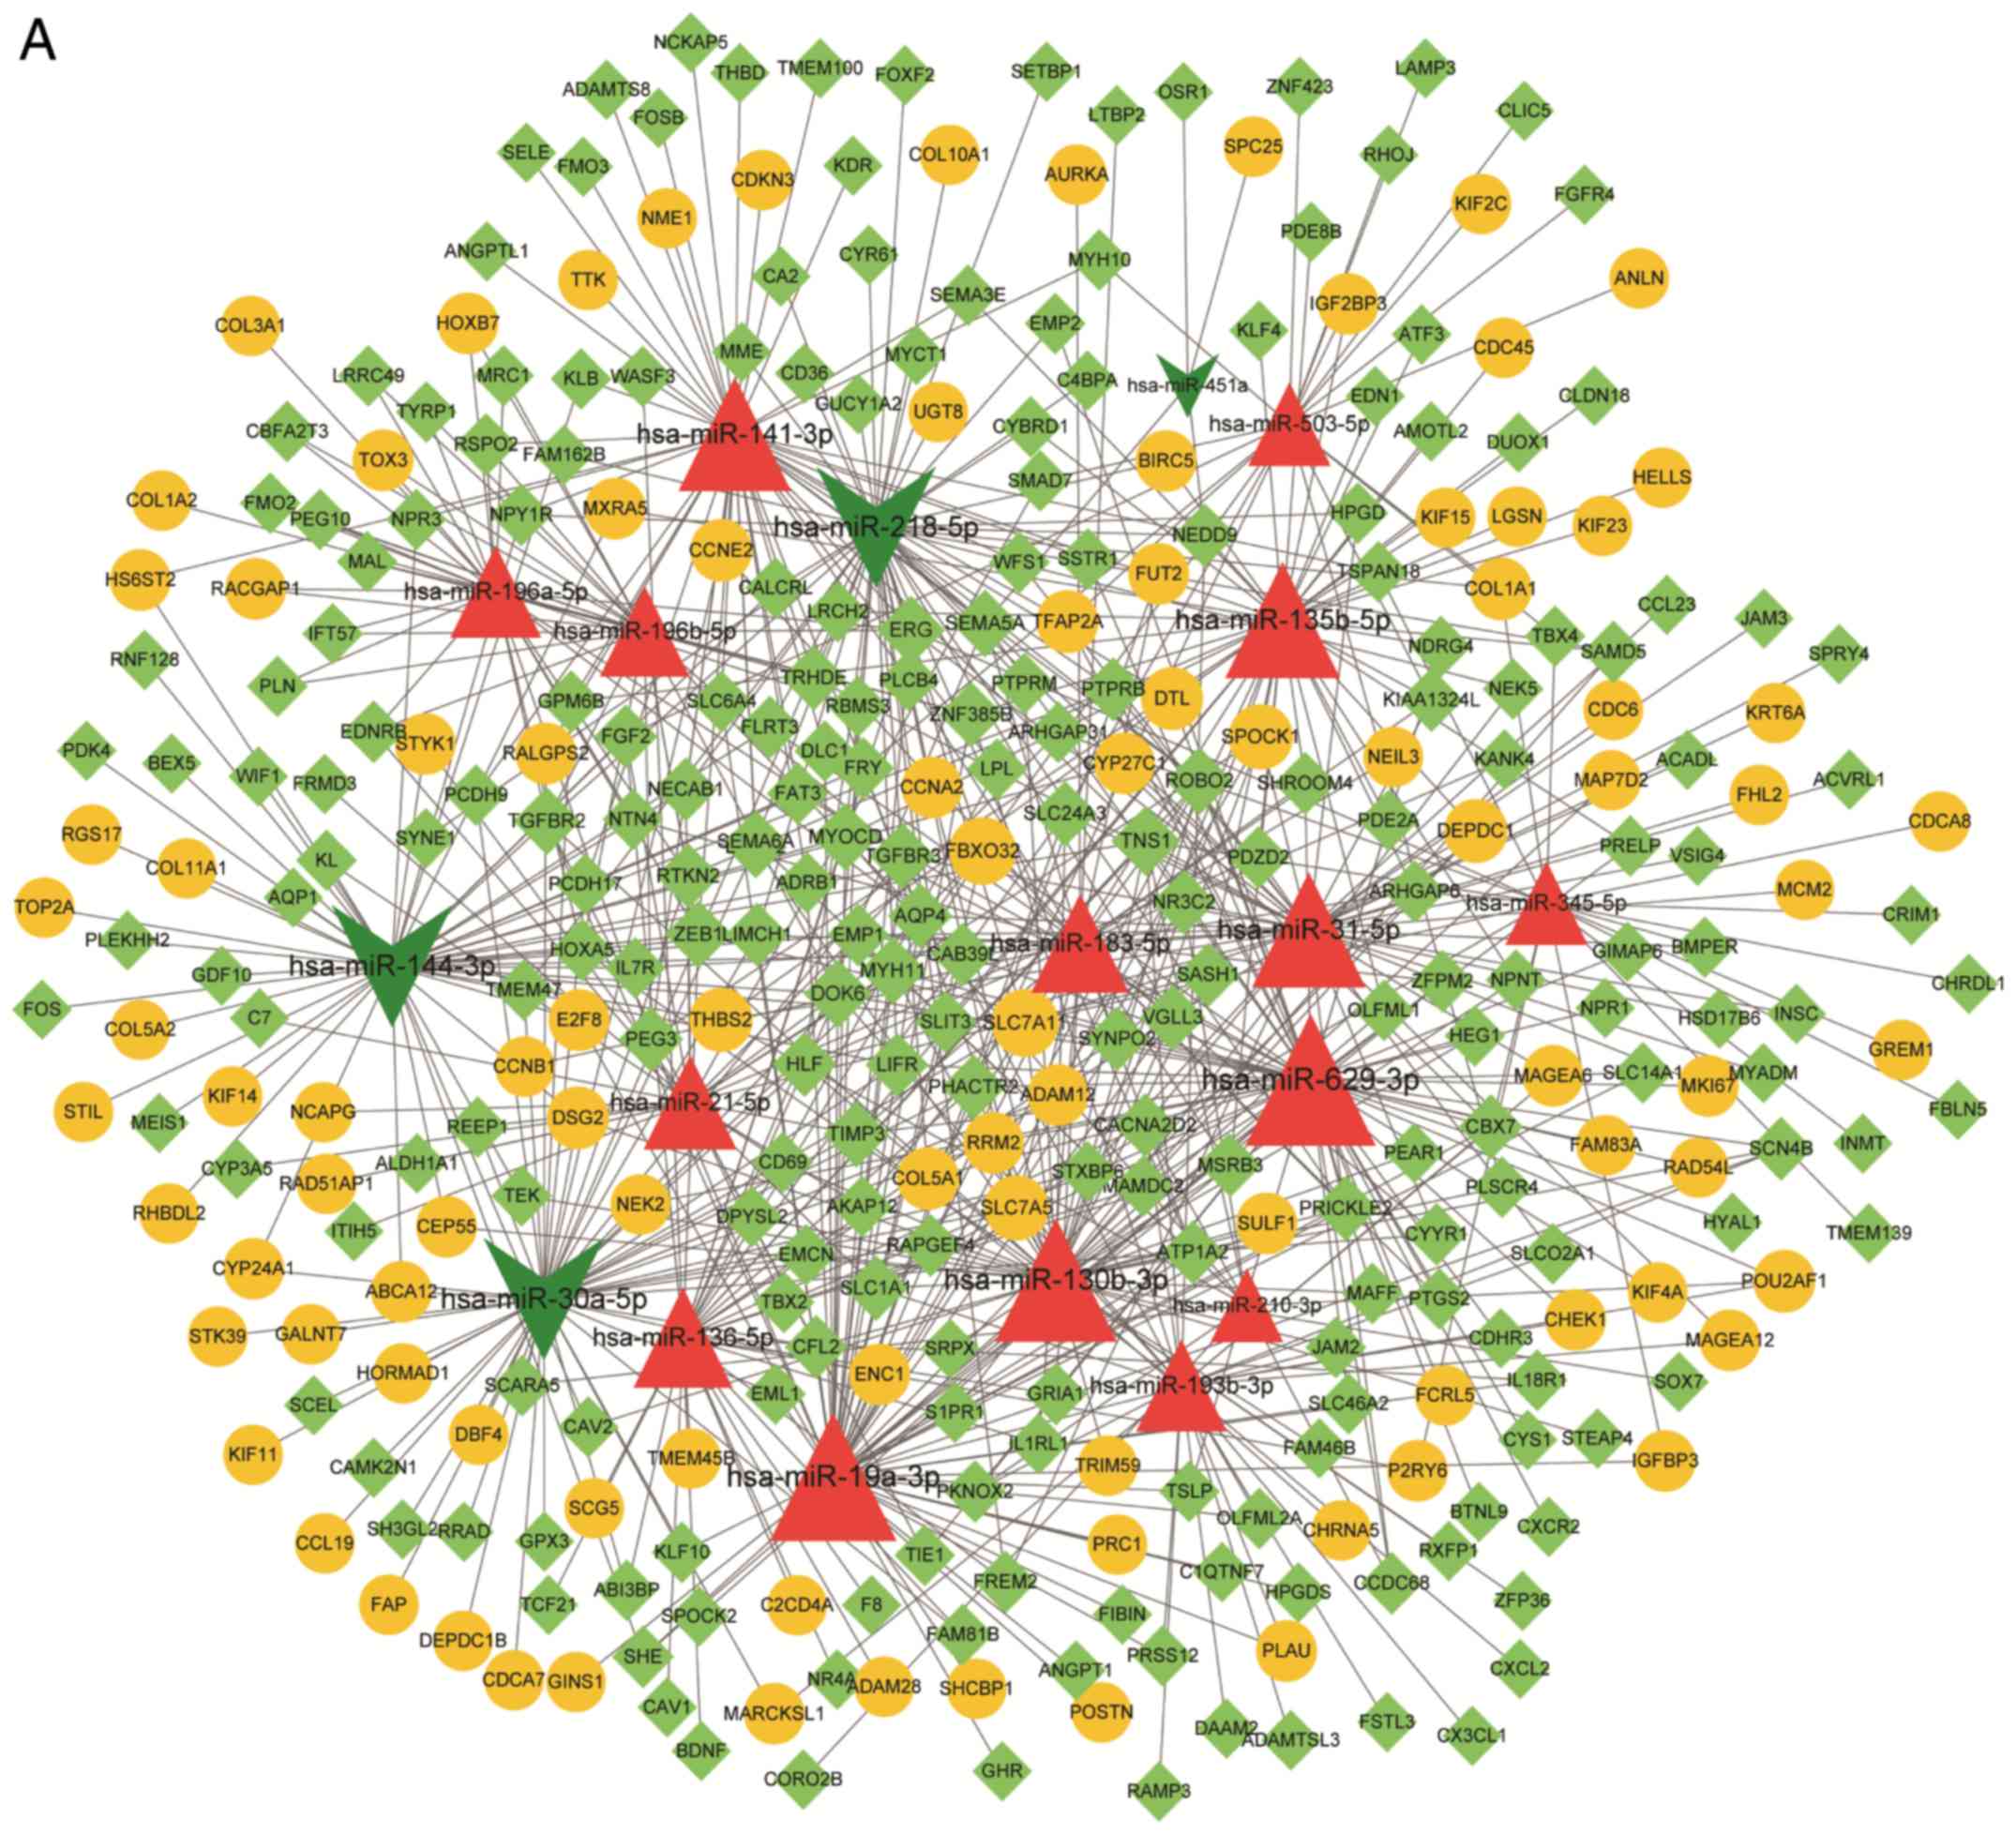 | Figure 2.(A) miRNA target gene regulatory
network for common differentially expressed miRNAs and mRNAs. Red
triangles indicate upregulated miRNAs, dark green arrows indicate
downregulated miRNAs, yellow circles indicate upregulated genes,
and light green prisms indicate downregulated genes. (B) miRNA
target gene regulatory network for validated differentially
expressed miRNAs and mRNAs. Red triangles indicate upregulated
miRNAs, green arrows indicate downregulated miRNAs, yellow circles
indicate upregulated genes, green prisms indicate downregulated
genes, and the arrow indicates the regulation direction. (C) PPI
and module network diagram. Yellow circles represent upregulated
genes, and green rhombuses represent downregulated genes. The area
shaded in red is the module. Node size represents degree: The
higher the degree, the larger the node. (D) Transcription
factor-target regulatory network. Yellow circles represent
upregulated genes, blue hexagons represent transcription factors,
and node size represents degree. PPI, protein-protein
interaction. |
 | Table I.Degree nodes in the miRNA target gene
regulatory network (top 20). |
Table I.
Degree nodes in the miRNA target gene
regulatory network (top 20).
| Nodes | Description | Degree | Nodes | Description | Degree |
|---|
| miR-629-3p | Up-miRNA | 60 | miR-183-5p | Up-miRNA | 33 |
| miR-19a-3p | Up-miRNA | 57 | miR-21-5p | Up-miRNA | 29 |
| miR-130b-3p | Up-miRNA | 53 | miR-193b-3p | Up-miRNA | 27 |
| miR-144-3p | Down-miRNA | 52 | miR-196a-5p | Up-miRNA | 27 |
| miR-30a-5p | Down-miRNA | 52 | miR-196b-5p | Up-miRNA | 26 |
| miR-218-5p | Down-miRNA | 51 | miR-503-5p | Up-miRNA | 20 |
| miR-135b-5p | Up-miRNA | 47 | miR-345-5p | Up-miRNA | 20 |
| miR-31-5p | Up-miRNA | 46 | miR-210-3p | Up-miRNA | 12 |
| miR-141-3p | Up-miRNA | 45 | TNS1 | Down-gene | 9 |
| miR-136-5p | Up-miRNA | 34 | DOK6 | Down-gene | 8 |
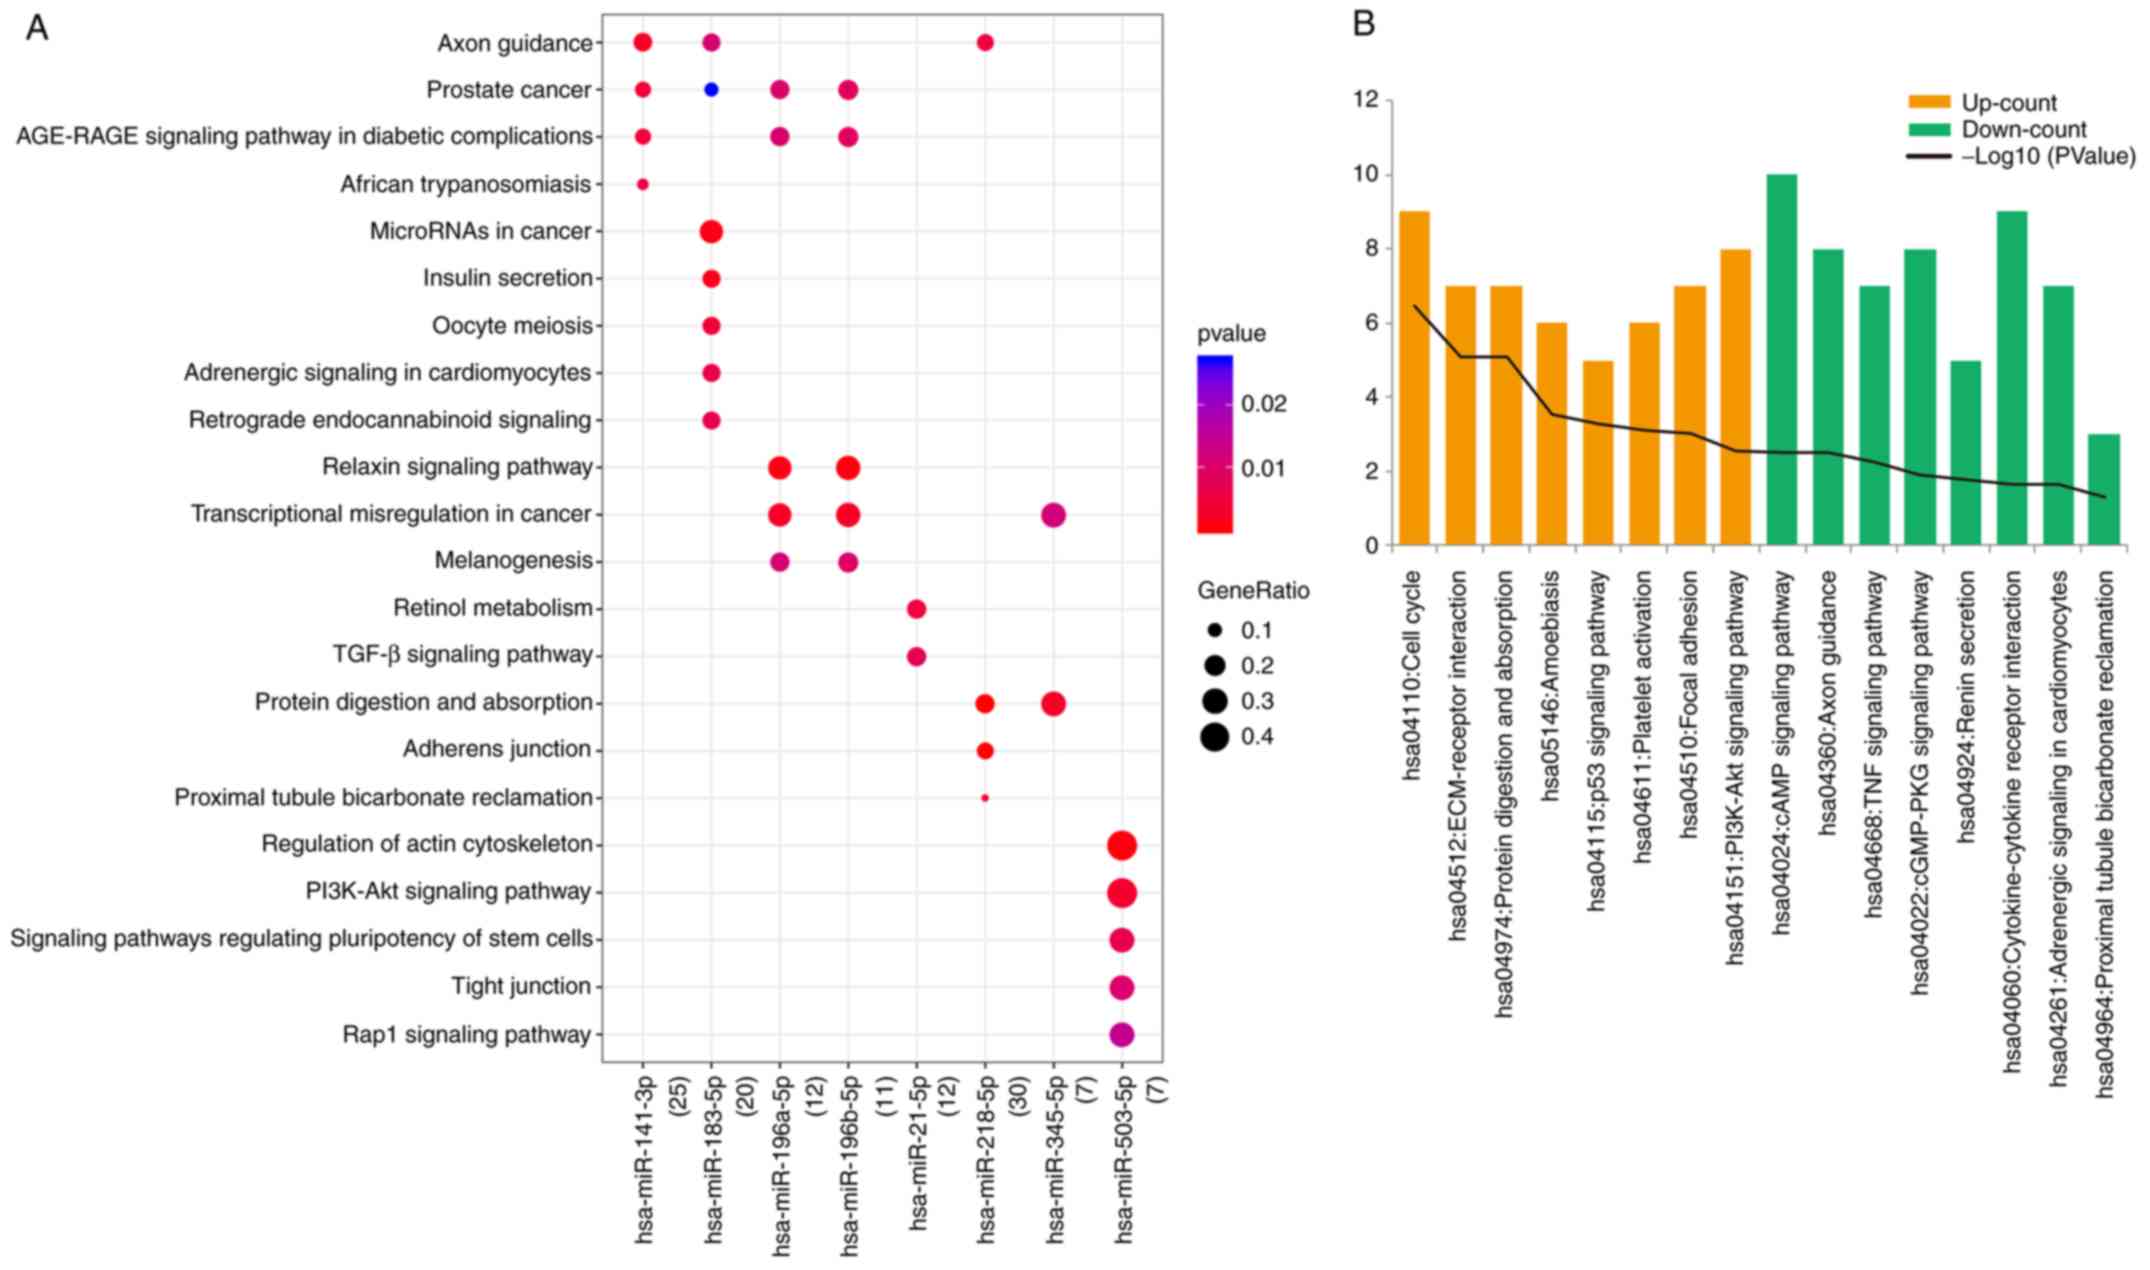
DEM-DEG functional enrichment
In the DEM-DEG pairs, eight miRNAs were
significantly enriched in 59 KEGG pathways, such as axon guidance,
microRNAs in cancer, and TGF-β signaling pathway. The top 5 most
significant pathways are displayed in Fig. 3A.
The upregulated DEGs in DEM-DEG pairs were
significantly enriched in 8 KEGG pathways, such as hsa04110: Cell
cycle, hsa04512: ECM-receptor interaction, and hsa04115: p53
signaling pathway, and enriched in 50 GO terms, such as cell
division, and mitotic nuclear division. The downregulated genes
were enriched in 8 KEGG pathways, such as hsa04024: cAMP signaling
pathway, and hsa04360: Axon guidance, and enriched in 110 GO terms.
Due to the large number of GO results, we selected the top 20 terms
for display (Fig. 3B-D).
PPI network construction
A PPI network was constructed based on the DEGs in
the DEM-DEG pairs, as shown in Fig.
4A. The PPI network contained 228 nodes and 1,153 interaction
pairs, including 79 upregulated DEGs and 149 downregulated DEGs.
One module (score=34.171) was obtained, containing 36 nodes and 598
relationship pairs. The degrees of the nodes in the module are
shown in Table II. Functional
analyses revealed that the module genes were significantly enriched
in three pathways (hsa04110: Cell cycle, hsa04115: p53 signaling
pathway, and hsa05161: Hepatitis B) and 41 GO functions (such as
cell division, and mitotic nuclear division) (Fig. 4B and C).
| Table II.Degree values of the module
nodes. |
Table II.
Degree values of the module
nodes.
| Nodes | Description | Degree | Nodes | Description | Degree |
|---|
| TOP2A | Up-gene | 53 | MKI67 | Up-gene | 37 |
| CCNB1 | Up-gene | 43 | KIF4A | Up-gene | 37 |
| RACGAP1 | Up-gene | 43 | PRC1 | Up-gene | 36 |
| BIRC5 | Up-gene | 41 | ANLN | Up-gene | 36 |
| TTK | Up-gene | 41 | CDCA8 | Up-gene | 36 |
| CDKN3 | Up-gene | 40 | NEK2 | Up-gene | 36 |
| CHEK1 | Up-gene | 40 | KIF2C | Up-gene | 36 |
| KIF11 | Up-gene | 40 | KIF14 | Up-gene | 36 |
| CCNA2 | Up-gene | 40 | MCM2 | Up-gene | 35 |
| KIF23 | Up-gene | 40 |
RAD51AP1 | Up-gene | 35 |
| NCAPG | Up-gene | 40 | SHCBP1 | Up-gene | 34 |
| CEP55 | Up-gene | 40 | DEPDC1 | Up-gene | 33 |
| RRM2 | Up-gene | 39 | HELLS | Up-gene | 33 |
| AURKA | Up-gene | 39 | RAD54L | Up-gene | 31 |
| CDC45 | Up-gene | 39 | STIL | Up-gene | 29 |
| CDC6 | Up-gene | 38 | SPC25 | Up-gene | 29 |
| KIF15 | Up-gene | 38 | NEIL3 | Up-gene | 27 |
| DTL | Up-gene | 38 | CCNE2 | Up-gene | 26 |
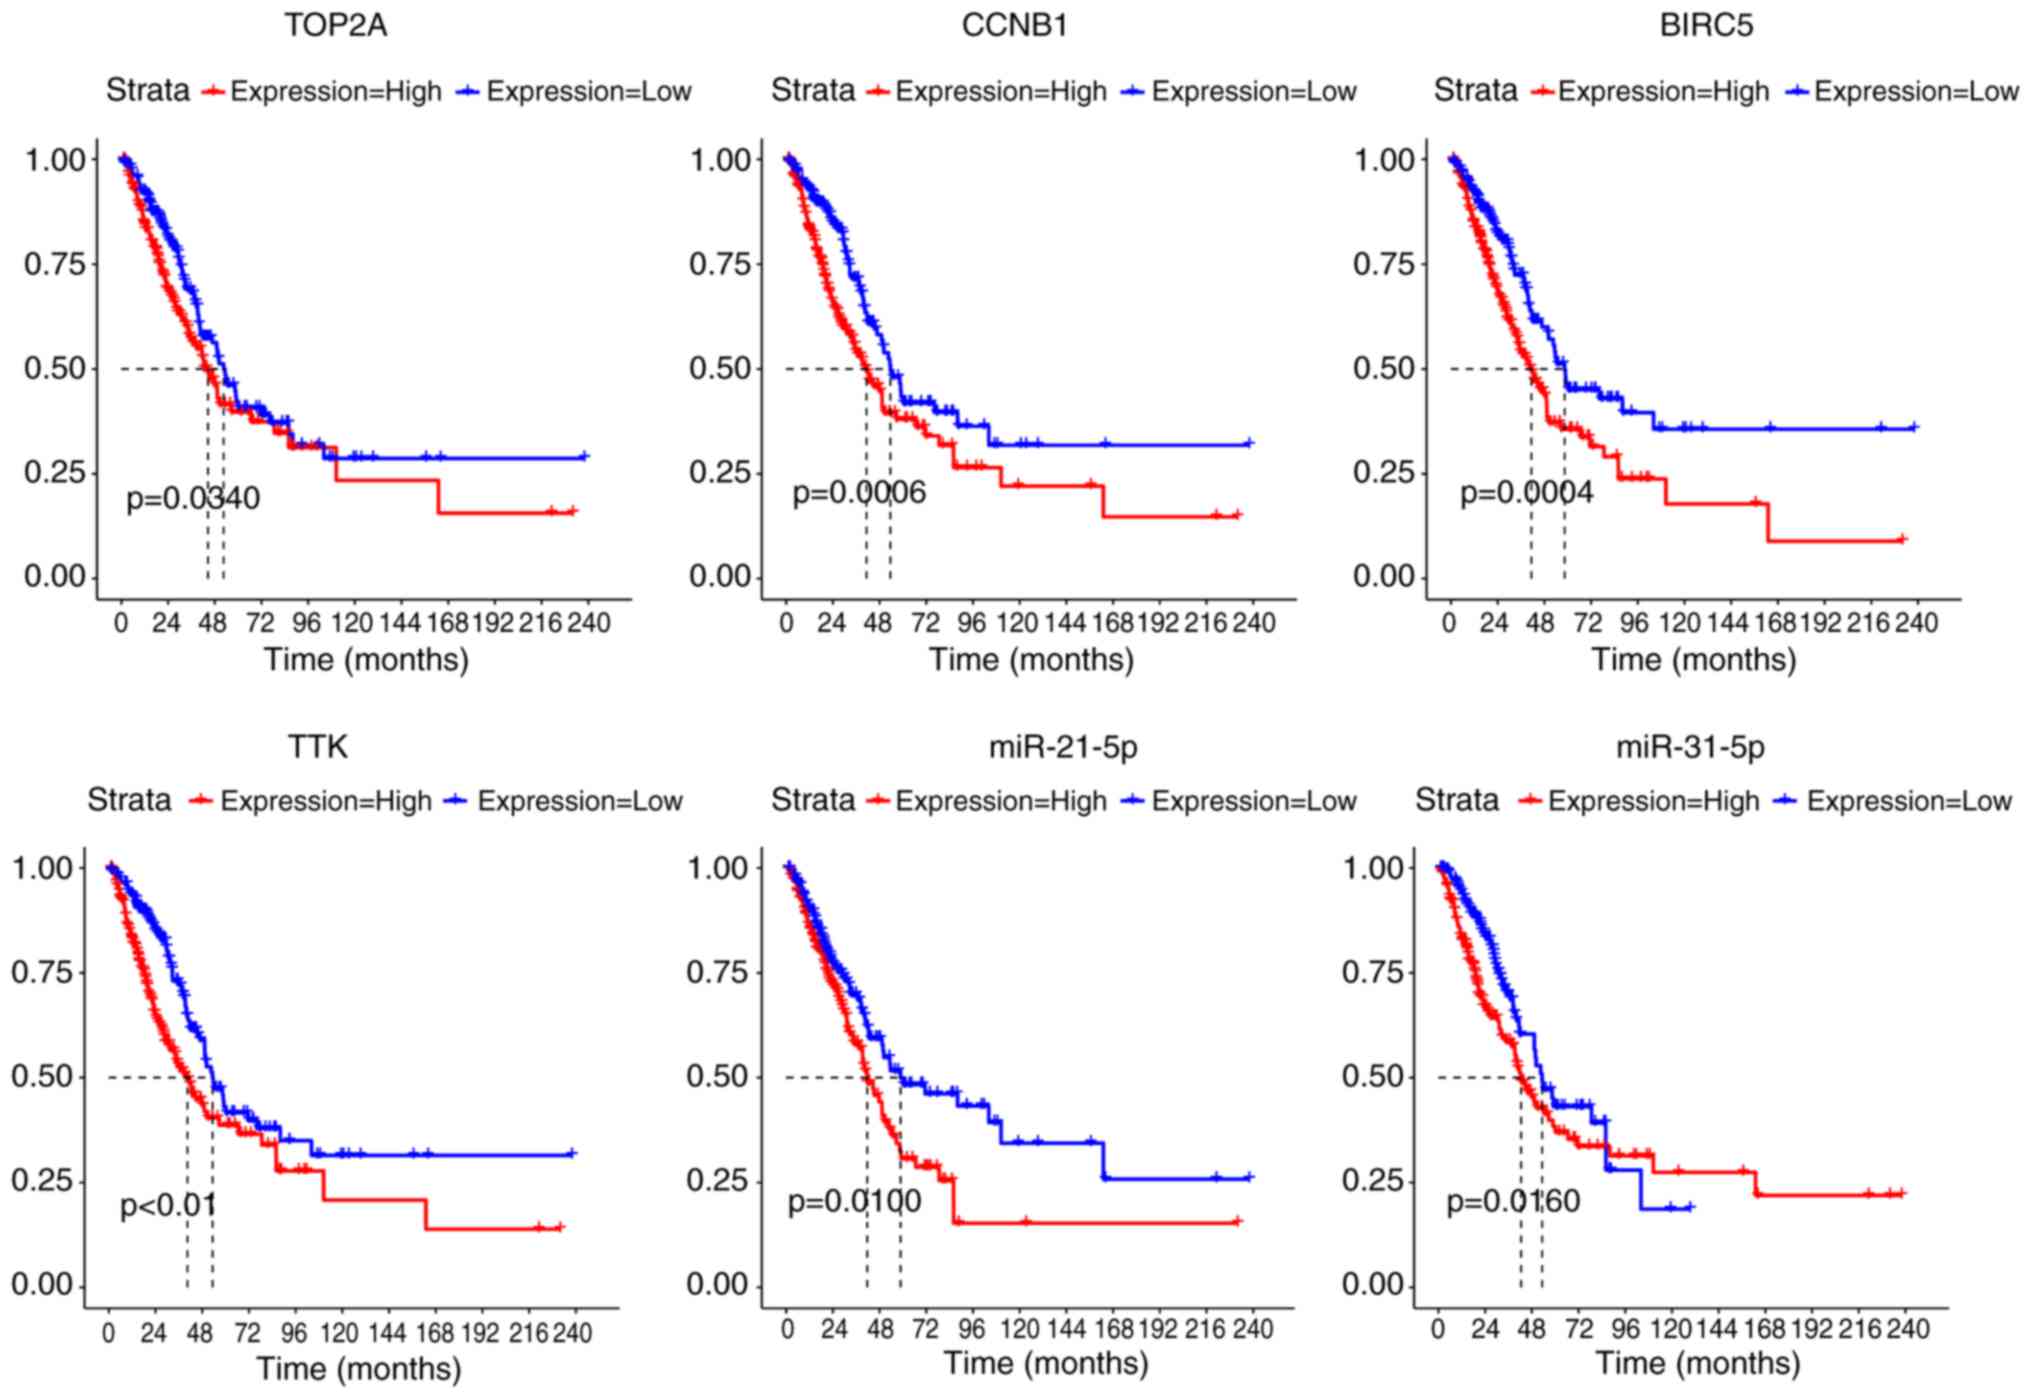
Survival analysis results
Based on the matrix data and clinical information
obtained from the TCGA, we performed survival analysis for the 19
DEMs in the DEM-DEG pairs and 36 DEGs in the significant modules.
The results showed a significant association between 34 DEGs
including TOP2A (DNA topoisomerase II α), CCNB1
(cyclin B1), BIRC5 (baculoviral IAP repeat containing 5),
TTK (TTK protein kinase) and two miRNAs (miR-21-5p and
miR-31-5p) and patient prognosis (Fig.
5).
RT-qPCR verification results
After verification in the cell lines (Fig. 6A), 3 mRNAs (TOP2A, CCNB1 and
BIRC5) and eight miRNAs (miR-19a-3p, miR-144-3p, miR-30a-5p,
miR-31-5p, miR-21-5p, miR-193b-3p, miR-196a-5p and miR-210-3p) were
further verified in tissue samples. As shown in Fig. 6B, the 3 mRNAs had significantly higher
expression levels in cancer tissues than the controls.
Additionally, miR-21-5p, miR-193b-3p, miR-31-5p and miR-210-3p were
significantly upregulated while miR-30a-5p was significantly
downregulated in cancer tissues in comparison with the control.
These results were in accordance with ‘DEM and DEG identification’
results obtained by the bioinformatic analysis above.
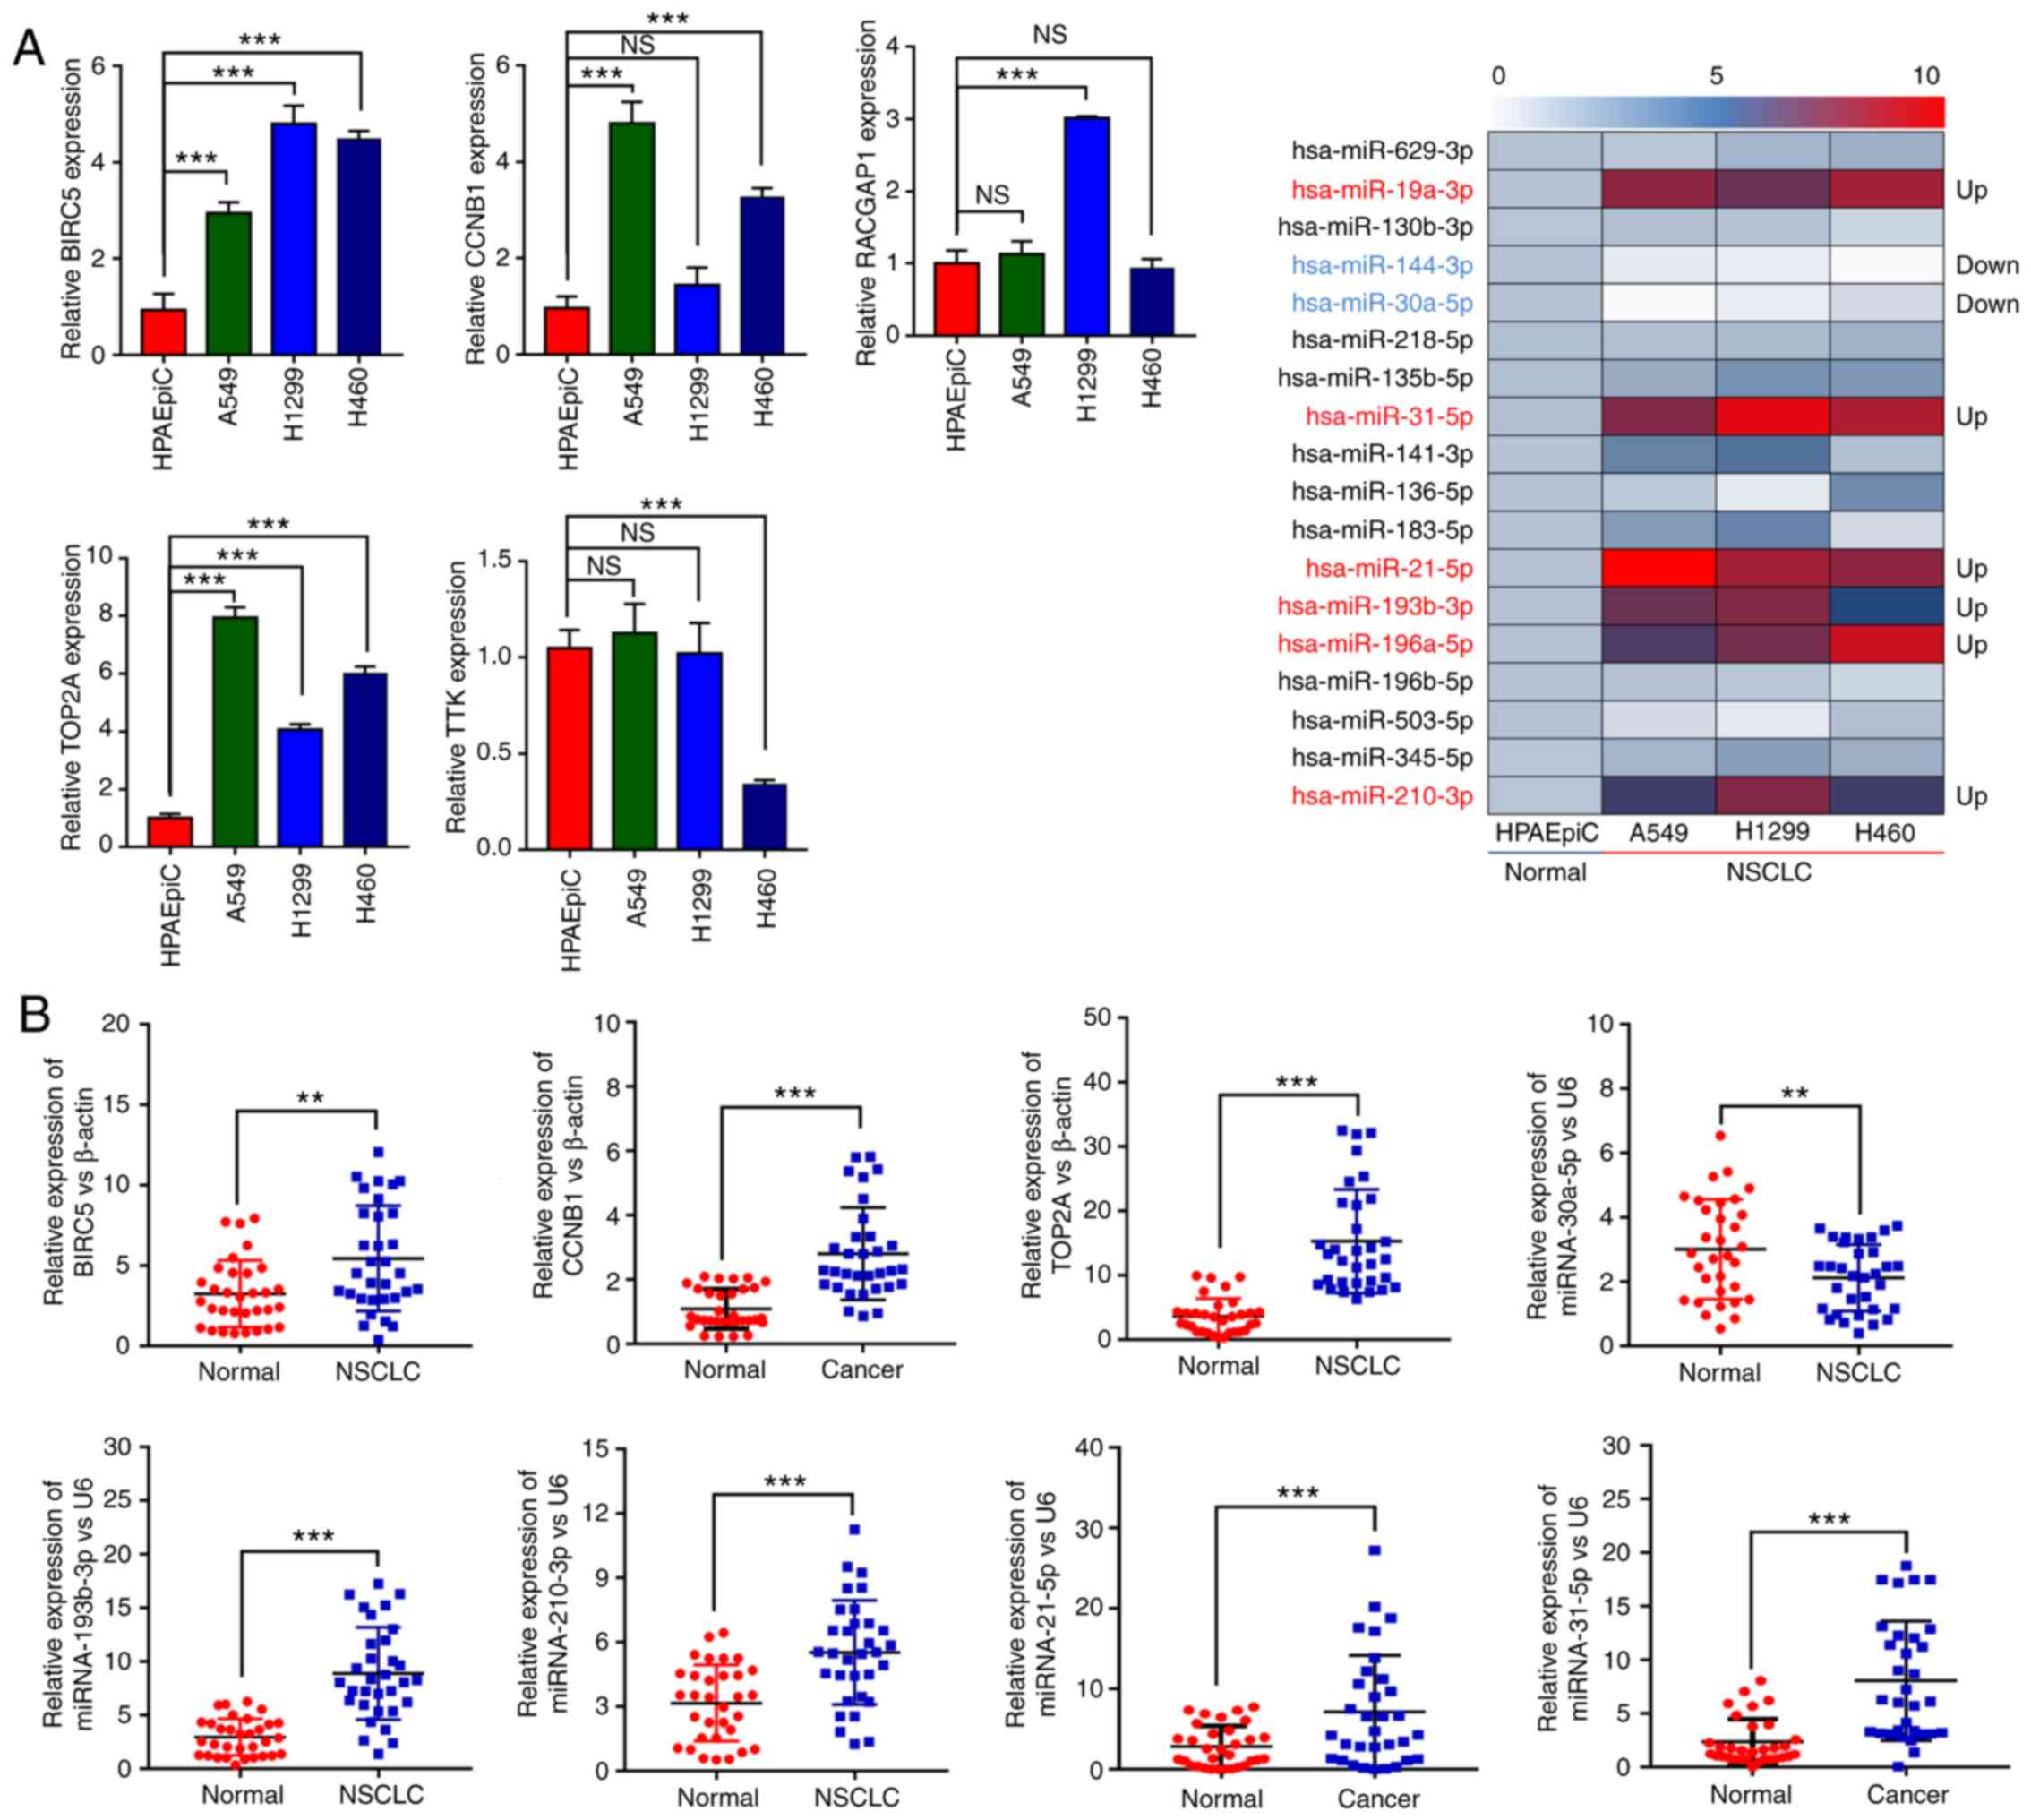 | Figure 6.(A) Relative expression levels of
five DEGs and 18 DEMs in NSCLC and normal cells. (B) The relative
expression levels of TOP2A, CCNB1, BIRC5, miR-30a-5p,
miR-21-5p, miR-193b-3p, miR-31-5p and miR-210-3p in cancer and
normal tissues. (C) The ROC curves of TOP2A, CCNB1, BIRC5,
miR-30a-5p, miR-21-5p, miR-193b-3p, miR-31-5p and miR-210-3p. DEGs,
differentially expressed genes; DEMs, differentially expressed
miRNAs; NSCLC, non-small cell lung cancer; TPO2A, DNA
topoisomerase II α; CCNB1, cyclin B1; RACGAP1, Rac
GTPase activating protein 1; BIRC5, baculoviral IAP repeat
containing 5; TTK, TTK protein kinase. |
Multivariate logistic regression
analysis results
The ROC curves of the three mRNAs (TOP2A,
CCNB1, and BIRC5) and five miRNAs (miR-21-5p,
miR-193b-3p, miR-31-5p, miR-210-3p and miR-30a-5p) are shown in
Fig. 6C. After analysis of the ROC
curves, miR-30a-5p showed low diagnostic value for NSCLC
(AUC=0.665), while the remaining miRNAs and all the mRNAs had high
diagnostic values (AUC>0.7) in the TCGA dataset. Thus, TOP2A,
CCNB1, BIRC5, miR-21-5p, miR-193b-3p, miR-210-3p and miR-31-5p
were selected for multivariate logistic regression analysis. The
results of the multivariate logistic regression analysis of the
selected mRNAs and miRNAs in the TCGA dataset and 32 pairs of
tissue samples, and the ROC curves for combined diagnosis are shown
in Tables SII–SV and Fig. 7,
respectively.
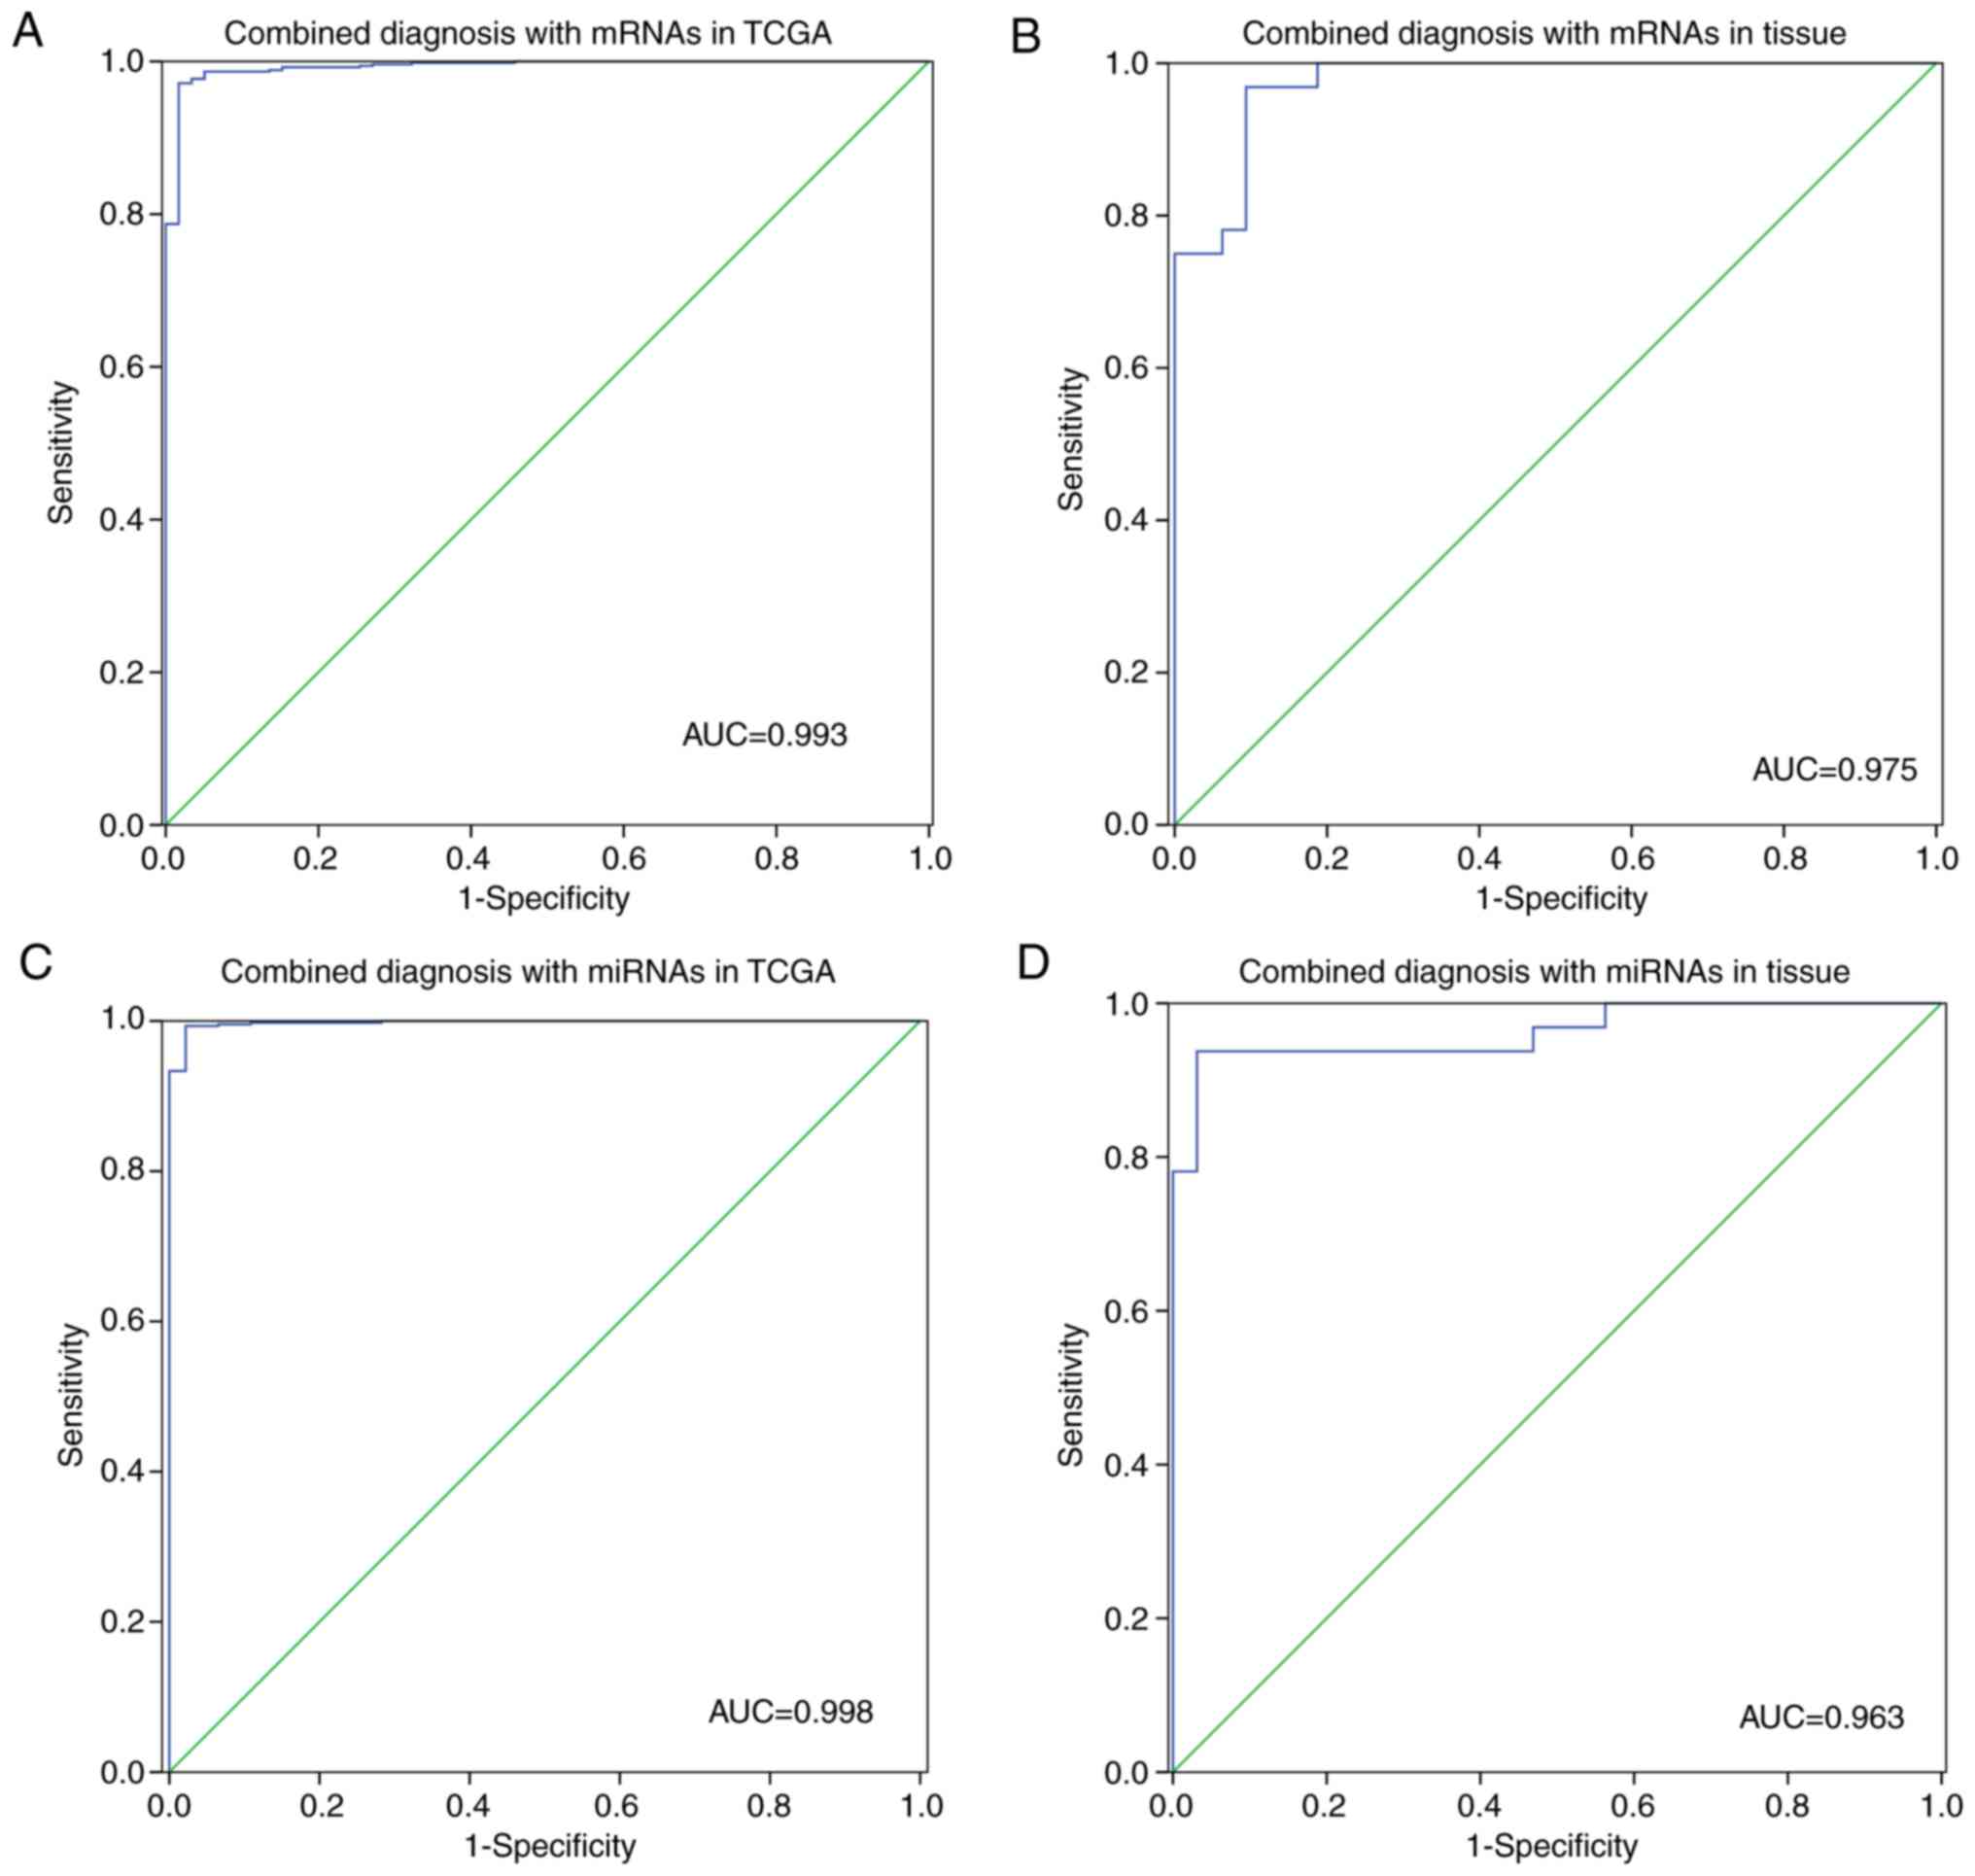 | Figure 7.ROC curves for combined diagnosis
with (A and B) 4 miRNAs (miR-21-5p, miR-193b-3p, miR-31-5p,
miR-210-3p) and (C and D) 3 mRNAs (TOP2A, CCNB1, BIRC5) in
the TCGA dataset and 32 pairs of tissue samples, respectively. ROC,
receiver operating characteristic; AUC, area under the ROC curve;
TCGA, The Cancer Genome Atlas; TPO2A, DNA topoisomerase II
α; CCNB1, cyclin B1; BIRC5, baculoviral IAP repeat
containing 5. |
Network analysis for three mRNAs and
four miRNAs
Based on the four selected miRNAs, a miRNA-DEG
regulatory network was constructed with 107 nodes (3 upregulated
miRNAs, 1 downregulated miRNAs, 31 upregulated DEGs and 72
downregulated DEGs) and 120 interaction pairs (Fig. 2B).
The PPI network constructed from the 31 upregulated
DEGs and 72 downregulated DEGs consisted of 75 nodes and 248
interaction pairs. From this network, one module (score=9) was
extracted, which included nine nodes and 36 interaction pairs
(Fig. 2C). The genes in the module
were involved in two pathways (hsa04115: p53 signaling pathway, and
hsa04110: cell cycle) and 5 GO functions, including cell division,
and the G1/S transition of the mitotic cell cycle.
Furthermore, 7 TFs, such as SRY-box 9 (SOX9), were
predicted for the genes in the module, involving 15 regulatory
relationship pairs (Fig. 2D).
Discussion
In the present study, 25 overlapped differentially
expressed miRNAs (DEMs) and 789 overlapped differentially expressed
genes (DEGs) were identified, which were then used to construct a
DEM-DEG regulatory network and protein-protein interaction (PPI)
network module. Survival analysis of the 19 DEMs in the DEM-DEG
regulatory network and the 36 DEGs in the PPI network module
revealed that 34 DEGs (including TOP2A, CCNB1, BIRC5, TTK)
and two miRNAs (miR-21-5p and miR-31-5p) were significantly
associated with patient prognosis. Moreover, RT-qPCR analysis of
the top 18 DEMs in the DEM-DEG regulatory network and the top 5
DEGs in the PPI network module identified 3 DEGs and 5 DEMs that
had expression profiles consistent with the bioinformatic analysis
results. Finally, multivariate logistic regression analysis
suggested that TOP2A, CCNB1, BIRC5, miR-21-5p, miR-193b-3p,
miR-210-3p and miR-31-5p could be used together for the diagnosis
of non-small cell lung cancer (NSCLC).
TOP2A (DNA topoisomerase II α) had the
highest degree in the significant module. It encodes a DNA
topoisomerase II, which controls the topological state of the DNA
during transcription. It has been reported that topoisomerase II is
involved in DNA synthesis and cell proliferation, both of which are
common targets of antitumor drugs (27). Recently, Terashima et al
(28) demonstrated that in patients
with stage II/III gastric cancer, the TOP2A level in primary
tumors is associated with a higher risk of hematogenous recurrence
of cancer. Importantly, a previous study suggested that
TOP2A expression is related to tumor cell proliferation and
clinicopathological parameters in lung adenocarcinoma (29). In this study, TOP2A was
upregulated in non-small cell lung cancer (NSCLC) cell lines and
tissues. In addition, TOP2A was predicted to be a prognostic
factor and had high diagnostic value in NSCLC. Based on a review of
previous studies and the results of this study, TOP2A may
serve as an important diagnostic and therapeutic target in
NSCLC.
CCNB1 (cyclin B1), a cell cycle regulator, which
combines with cyclin-dependent kinase 1 (CDK1) to form a complex,
had the second highest degree in the module. The CCNB1-CDK1 complex
has been reported to be a key factor controlling the G2/M phase of
the cell cycle (30). In line with
that report, our functional analysis revealed that CCNB1 was
involved in the hsa04110: Cell cycle pathway. This study also
supports previous observations where CCNB1 has been shown to
be overexpressed in many cancers, including lung cancers (31,32).
Notably, in the present study, CCNB1 was shown to be
enriched in the hsa04115: p53 signaling pathway. Human p53 is a
393-amino acid nuclear protein that acts as a transcription factor
(TF) and tumor suppressor (33).
Activated p53 is known to induce growth arrest, which allows cells
to repair damage. Moreover, p53 is frequently inactivated during
human carcinogenesis (34). Thus,
CCNB1 may be involved in the progression of NSCLC via the
cell cycle and p53 signaling pathways.
BIRC5 (baculoviral IAP repeat containing 5)
is a unique member of the inhibitor-of-apoptosis gene family
(35), which is usually present in
transformed cells, fetal development, as well as tumors, but absent
in most normally differentiated adult tissues (36). It has previously been reported that
BIRC5 can inhibit apoptosis via both the mitochondrial and the
death-receptor pathways (37).
Additionally, it acts as a regulator of cell division. In line with
the previous studies, the functional analysis conducted in this
study also suggests that BIRC5 is associated with cell
division and mitotic nuclear division. Furthermore, circulating
antibodies to BIRC5 have been shown to be elevated in many
malignant tumors, including NSCLC (38). Therefore, upregulated BIRC5 may serve
as a useful biomarker for the prognostic assessment and diagnosis
of NSCLC.
miR-30a-5p is a member of the miR-30 family, which
plays a key role in several physiological and pathological
processes, including differentiation, development, and apoptosis
(39). The results of the current
study are consistent with earlier observations, which have shown
that this miRNA is significantly downregulated in NSCLC tissues
(40). Interestingly, three target
genes of miR-30a-5p, including ribonucleotide reductase subunit M2
(RRM2), cell division cycle associated 7 (CDCA7), and
DBF4 zinc finger (DBF4), were predicted to be
transcriptionally controlled by the TF SOX9. High levels of SOX9
are correlated with poor survival of NSCLC patients (41). We speculate that there is a regulatory
relationship between miR-30a-5p and SOX9 in the pathogenesis of
NSCLC, which needs to be further investigated. Remarkably, a recent
study by Świtlik et al (42)
revealed that miR-30a-5p together with miR-210-3p can distinguish
NSCLC tissues from normal adjacent tissues. Moreover, they reported
a high diagnostic value for a combination of the two miRNAs through
ROC analysis and also suggested the combination of miR-30a-5p with
miR-210-3p as an independent biomarker for NSCLC.
miR-21 has been previously reported to be a key
biomarker for the early detection of lung cancer, and
overexpression of miR-21 is implicated in a worse prognosis for
lung cancer patients (43). In this
study, high expression of miR-21-5p was likewise correlated with
poor prognosis of NSCLC patients. KEGG pathway analysis showed that
miR-21-5p was enriched in the TGF-β signaling pathway. This pathway
has been suggested to facilitate tumor metastasis in lung
adenocarcinoma (44). In the
miR-21-5p associated DEM-DEG regulatory network, the non-SMC
condensin I complex subunit G (NCAPG) was one of its targets
and is involved in GO function related to cell division. A recent
study suggested that NCAPG promotes tumor proliferation by
regulating the G2/M phase in lung adenocarcinoma (45). Thus, we speculate that miR-21-5p may
play a role in NSCLC progression through the TGF-β signaling
pathway or by regulating NCAPG.
A recent study suggested that miR-193b has both
tumor-suppressor and oncogenic functions in human cancers. Lower
levels of miR-193b expression were detected in NSCLC cells when
compared to that in non-cancerous cells (46). In contrast, using RT-qPCR our study
verified that miR-193b-3p was upregulated in NSCLC cells and
tissues compared to the controls. These results corroborated with
our bioinformatic analysis. Although these findings contradict
previous results, we can conclude that the aberrant expression of
miR-193b-3p may serve as a biomarker of NSCLC.
However, there were some limitations to our study.
First, although the data set contained two databases with a large
sample size, it still had no absolute universal significance and
could only be of reference significance to a certain extent.
Second, the in-depth analysis of DEGs was limited to those with
regulatory relationship with DEMs, and could have missed various
gene studies with other roles. Our future research will focus on
verifying the clinical utility of these genes and miRNAs in larger
samples.
In conclusion, our study combined mRNA and miRNA
expression profiles in NSCLC to identify more diagnostic and
therapeutic targets for NSCLC. TOP2A, CCNB1, BIRC5,
miR-21-5p, miR-193b-3p, miR-210-3p and miR-30a-5p may serve as
biomarkers and can be combined for the diagnosis of NSCLC.
Supplementary Material
Supporting Data
Acknowledgements
Not applicable.
Funding
This study was supported by grants from the Natural
Science Research Program of Huai'an City (HAB201813).
Availability of data and materials
The data used to support the findings of this study
are included within the article and supplementary files.
Authors' contributions
YW, SC and YulZ conceived and designed the
experiments. JZ and DL performed the experiments. YueZ and ZD
analyzed the data. JZ and DL drafted the manuscript. All authors
read and approved the final manuscript.
Ethics approval and consent to
participate
This study was approved by the Ethics Committee of
the Affiliated Huai'an Hospital of Xuzhou Medical University
(Huai'an, China). Each participant signed an informed consent form
before the samples were collected.
Patient consent for publication
Not applicable.
Competing interests
The authors declare that they have no competing
interests.
References
|
1
|
Kasinski AL, Kelnar K, Stahlhut C,
Orellana E, Zhao J, Shimer E, Dysart S, Chen X, Bader AG and Slack
FJ: A combinatorial microRNA therapeutics approach to suppressing
non-small cell lung cancer. Oncogene. 34:3547–3555. 2015.
View Article : Google Scholar : PubMed/NCBI
|
|
2
|
Fassina A, Cappellesso R and Fassan M:
Classification of non-small cell lung carcinoma in transthoracic
needle specimens using microRNA expression profiling. Chest.
140:1305–1311. 2011. View Article : Google Scholar : PubMed/NCBI
|
|
3
|
Reungwetwattana T, Weroha SJ and Molina
JR: Oncogenic pathways, molecularly targeted therapies, and
highlighted clinical trials in non-small-cell lung cancer (NSCLC).
Clin Lung Cancer. 13:252–266. 2012. View Article : Google Scholar : PubMed/NCBI
|
|
4
|
Horvath S, Zhang B, Carlson M, Lu KV, Zhu
S, Felciano RM, Laurance MF, Zhao W, Qi S, Chen Z, et al: Analysis
of oncogenic signaling networks in glioblastoma identifies ASPM as
a molecular target. Proc Natl Acad Sci USA. 103:17402–17407. 2006.
View Article : Google Scholar : PubMed/NCBI
|
|
5
|
Hutter C and Zenklusen JC: The cancer
genome atlas: Creating lasting value beyond its data. Cell.
173:283–285. 2018. View Article : Google Scholar : PubMed/NCBI
|
|
6
|
Yang C, Sun C, Liang X, Xie S, Huang J and
Li D: Integrative analysis of microRNA and mRNA expression profiles
in non-small-cell lung cancer. Cancer Gene Ther. 23:90–97. 2016.
View Article : Google Scholar : PubMed/NCBI
|
|
7
|
Friedman RC, Farh KK, Burge CB and Bartel
DP: Most mammalian mRNAs are conserved targets of microRNAs. Genome
Res. 19:92–105. 2009. View Article : Google Scholar : PubMed/NCBI
|
|
8
|
Reddy KB: MicroRNA (miRNA) in cancer.
Cancer Cell Int. 15:382015. View Article : Google Scholar : PubMed/NCBI
|
|
9
|
Yanaihara N, Caplen N, Bowman E, Seike M,
Kumamoto K, Yi M, Stephens RM, Okamoto A, Yokota J, Tanaka T, et
al: Unique microRNA molecular profiles in lung cancer diagnosis and
prognosis. Cancer Cell. 9:189–198. 2006. View Article : Google Scholar : PubMed/NCBI
|
|
10
|
Lee HY, Han SS, Rhee H, Park JH, Lee JS,
Oh YM, Choi SS, Shin SH and Kim WJ: Differential expression of
microRNAs and their target genes in non-small-cell lung cancer. Mol
Med Rep. 11:2034–2040. 2015. View Article : Google Scholar : PubMed/NCBI
|
|
11
|
Gallardo E, Navarro A, Viñolas N, Marrades
RM, Diaz T, Gel B, Quera A, Bandres E, Garcia-Foncillas J, Ramirez
J and Monzo M: miR-34a as a prognostic marker of relapse in
surgically resected non-small-cell lung cancer. Carcinogenesis.
30:1903–1909. 2009. View Article : Google Scholar : PubMed/NCBI
|
|
12
|
Wei JS, Song YK, Durinck S, Chen QR, Cheuk
AT, Tsang P, Zhang Q, Thiele CJ, Slack A, Shohet J and Khan J: The
MYCN oncogene is a direct target of miR-34a. Oncogene.
27:5204–5213. 2008. View Article : Google Scholar : PubMed/NCBI
|
|
13
|
Mitchell KA, Zingone A, Toulabi L,
Boeckelman J and Ryan BM: Comparative transcriptome profiling
reveals coding and noncoding RNA differences in NSCLC from African
Americans and European Americans. Clin Cancer Res. 23:7412–7425.
2017. View Article : Google Scholar : PubMed/NCBI
|
|
14
|
Irizarry RA, Hobbs B, Collin F,
Beazer-Barclay YD, Antonellis KJ, Scherf U and Speed TP:
Exploration, normalization, and summaries of high density
oligonucleotide array probe level data. Biostatistics. 4:249–264.
2003. View Article : Google Scholar : PubMed/NCBI
|
|
15
|
Dweep H and Gretz N: miRWalk2.0: A
comprehensive atlas of microRNA-target interactions. Nat Methods.
12:6972015. View Article : Google Scholar : PubMed/NCBI
|
|
16
|
Hsu SD, Chu CH, Tsou AP, Chen SJ, Chen HC,
Hsu PW, Wong YH, Chen YH, Chen GH and Huang HD: miRNAMap 2.0:
Genomic maps of microRNAs in metazoan genomes. Nucleic Acids Res.
36((Database Issue)): D165–D169. 2008.PubMed/NCBI
|
|
17
|
Shannon P, Markiel A, Ozier O, Baliga NS,
Wang JT, Ramage D, Amin N, Schwikowski B and Ideker T: Cytoscape: A
software environment for integrated models of biomolecular
interaction networks. Genome Res. 13:2498–2504. 2003. View Article : Google Scholar : PubMed/NCBI
|
|
18
|
Kanehisa M and Goto S: KEGG: Kyoto
encyclopedia of genes and genomes. Nucleic Acids Res. 28:27–30.
2000. View Article : Google Scholar : PubMed/NCBI
|
|
19
|
Yu G, Wang LG, Han Y and He QY:
clusterProfiler: An R package for comparing biological themes among
gene clusters. OMICS. 16:284–287. 2012. View Article : Google Scholar : PubMed/NCBI
|
|
20
|
Ashburner M, Ball CA, Blake JA, Botstein
D, Butler H, Cherry JM, Davis AP, Dolinski K, Dwight SS, Eppig JT,
et al: Gene ontology: Tool for the unification of biology: The Gene
Ontology Consortium. Nat Genet. 25:25–29. 2000. View Article : Google Scholar : PubMed/NCBI
|
|
21
|
Huang da W, Sherman BT and Lempicki RA:
Systematic and integrative analysis of large gene lists using DAVID
bioinformatics resources. Nat Protoc. 4:44–57. 2009. View Article : Google Scholar : PubMed/NCBI
|
|
22
|
Huang da W, Sherman BT and Lempicki RA:
Bioinformatics enrichment tools: Paths toward the comprehensive
functional analysis of large gene lists. Nucleic Acids Res.
37:1–13. 2009. View Article : Google Scholar : PubMed/NCBI
|
|
23
|
Szklarczyk D, Franceschini A, Kuhn M,
Simonovic M, Roth A, Minguez P, Doerks T, Stark M, Muller J, Bork
P, et al: The STRING database in 2011: Functional interaction
networks of proteins, globally integrated and scored. Nucleic Acids
Res. 39((Database Issue)): D561–D568. 2011. View Article : Google Scholar : PubMed/NCBI
|
|
24
|
Bandettini WP, Kellman P, Mancini C,
Booker OJ, Vasu S, Leung SW, Wilson JR, Shanbhag SM, Chen MY and
Arai AE: MultiContrast delayed enhancement (MCODE) improves
detection of subendocardial myocardial infarction by late
gadolinium enhancement cardiovascular magnetic resonance: A
clinical validation study. J Cardiovasc Magn Reson. 14:832012.
View Article : Google Scholar : PubMed/NCBI
|
|
25
|
Therneau T and Lumley T: Survival:
Survival analysis, including penalised likelihood. R package
version 2.36–5. Survival: Survival analysis, including penalised
likelihood R package version 2.36–2.2010. 2011.
|
|
26
|
Zhang B, Kirov S and Snoddy J: WebGestalt:
An integrated system for exploring gene sets in various biological
contexts. Nucleic Acids Res. 33:W741–W748. 2005. View Article : Google Scholar : PubMed/NCBI
|
|
27
|
Braybrooke JP, O'Byrne KJ, Propper DJ,
Blann A, Saunders M, Dobbs N, Han C, Woodhull J, Mitchell K, Crew
J, et al: A phase II study of razoxane, an antiangiogenic
topoisomerase II inhibitor, in renal cell cancer with assessment of
potential surrogate markers of angiogenesis. Clin Cancer Res.
6:4697–4704. 2000.PubMed/NCBI
|
|
28
|
Terashima M, Ichikawa W, Ochiai A, Kitada
K, Kurahashi I, Sakuramoto S, Katai H, Sano T, Imamura H and Sasako
M; ACTS-GC Group, : TOP2A, GGH, and PECAM1 are associated with
hematogenous, lymph node, and peritoneal recurrence in stage II/III
gastric cancer patients enrolled in the ACTS-GC study. Oncotarget.
8:57574–57582. 2017. View Article : Google Scholar : PubMed/NCBI
|
|
29
|
Kodiakov DS, Klimachëv VV, Avdalian AM,
Bobrov IP, Lazarev AF, Lushnikova EL and Nepomiashchikh LM:
Topoisomerase IIa expression in correlation with clinical and
morphological parameters and proliferation (based on argyrophilic
proteins of nucleolar organizer regions and Ki-67 antigen) in lung
adenocarcinoma. Vopr Onkol. 60:63–68. 2014.(In Russian). PubMed/NCBI
|
|
30
|
Nakayama Y and Yamaguchi N: Role of cyclin
B1 levels in DNA damage and DNA damage-induced senescence. Int Rev
Cell Mol Biol. 305:303–337. 2013. View Article : Google Scholar : PubMed/NCBI
|
|
31
|
Yuan J, Krämer A, Matthess Y, Yan R,
Spänkuch B, Gätje R, Knecht R, Kaufmann M and Strebhardt K: Stable
gene silencing of cyclin B1 in tumor cells increases susceptibility
to taxol and leads to growth arrest in vivo. Oncogene.
25:1753–1762. 2006. View Article : Google Scholar : PubMed/NCBI
|
|
32
|
Soria JC, Jang SJ, Khuri FR, Hassan K, Liu
D, Hong WK and Mao L: Overexpression of cyclin B1 in early-stage
non-small cell lung cancer and its clinical implication. Cancer
Res. 60:4000–4004. 2000.PubMed/NCBI
|
|
33
|
Vogelstein B, Lane D and Levine AJ:
Surfing the p53 network. Nature. 408:307–310. 2000. View Article : Google Scholar : PubMed/NCBI
|
|
34
|
Jung IL, Kang HJ, Kim KC and Kim IG:
PTEN/pAkt/p53 signaling pathway correlates with the radioresponse
of non-small cell lung cancer. Int J Mol Med. 25:517–523.
2010.PubMed/NCBI
|
|
35
|
Altieri DC: The molecular basis and
potential role of survivin in cancer diagnosis and therapy. Trends
Mol Med. 7:542–547. 2001. View Article : Google Scholar : PubMed/NCBI
|
|
36
|
Li F: Survivin study: What is the next
wave? J Cell Physiol. 197:8–29. 2003. View Article : Google Scholar : PubMed/NCBI
|
|
37
|
Shivapurkar N, Reddy J, Chaudhary PM and
Gazdar AF: Apoptosis and lung cancer: A review. J Cell Biochem.
88:885–898. 2003. View Article : Google Scholar : PubMed/NCBI
|
|
38
|
Zhao H, Zhang X, Han Z, Wang Z and Wang Y:
Plasma anti-BIRC5 IgG may be a useful marker for evaluating the
prognosis of nonsmall cell lung cancer. FEBS Open Bio. 8:829–835.
2018. View Article : Google Scholar : PubMed/NCBI
|
|
39
|
Zhu H, Wu H, Liu X, Li B, Chen Y, Ren X,
Liu CG and Yang JM: Regulation of autophagy by a beclin 1-targeted
microRNA, miR-30a, in cancer cells. Autophagy. 5:816–823. 2009.
View Article : Google Scholar : PubMed/NCBI
|
|
40
|
Zhu J, Zeng Y, Xu C, Qin H, Lei Z, Shen D,
Liu Z and Huang JA: Expression profile analysis of microRNAs and
downregulated miR-486-5p and miR-30a-5p in non-small cell lung
cancer. Oncol Rep. 34:1779–1786. 2015. View Article : Google Scholar : PubMed/NCBI
|
|
41
|
Voronkova M, Luanpitpong S, Riedel H and
Rojanasakul Y: Abstract 1913: SOX9 regulates cancer stem-like cells
in non-small cell lung cancer. Cancer Res. 77:19132017.
|
|
42
|
Świtlik W, Karbownik MS, Suwalski M, Kozak
J and Szemraj J: miR-30a-5p together with miR-210-3p as a promising
biomarker for non-small cell lung cancer: A preliminary study.
Cancer Biomark. 21:479–488. 2018. View Article : Google Scholar : PubMed/NCBI
|
|
43
|
Yu L, Todd NW, Xing L, Xie Y, Zhang H, Liu
Z, Fang H, Zhang J, Katz RL and Jiang F: Early detection of lung
adenocarcinoma in sputum by a panel of microRNA markers. Int J
Cancer. 127:2870–2878. 2010. View Article : Google Scholar : PubMed/NCBI
|
|
44
|
Yu JR, Tai Y, Jin Y, Hammell MC, Wilkinson
JE, Roe JS, Vakoc CR and Van Aelst L: TGF-β/Smad signaling through
DOCK4 facilitates lung adenocarcinoma metastasis. Genes Dev.
29:250–261. 2015. View Article : Google Scholar : PubMed/NCBI
|
|
45
|
Zhan P, Xi GM, Zhang B, Wu Y, Liu HB, Liu
YF, Xu WJ, Zhu Q, Cai F, Zhou ZJ, et al: NCAPG2 promotes tumour
proliferation by regulating G2/M phase and associates with poor
prognosis in lung adenocarcinoma. J Cell Mol Med. 21:665–676. 2017.
View Article : Google Scholar : PubMed/NCBI
|
|
46
|
Hu H, Li S, Liu J and Ni B: MicroRNA-193b
modulates proliferation, migration, and invasion of non-small cell
lung cancer cells. Acta Biochim Biophys Sin (Shanghai). 44:424–430.
2012. View Article : Google Scholar : PubMed/NCBI
|