Introduction
Oral squamous cell carcinoma (OSCC) results in
significant morbidity and mortality. Early diagnosis is the key to
prolonged survival (1, 2) and detection at a preinvasive stage is a
clinical priority. Many oral potentially malignant disorders (OPMD)
that predispose to oral carcinoma are recognized (3) and biopsy for detection and grading of
dysplasia is the standard of care to assess the risk of malignant
transformation. Unfortunately, the grading of oral epithelial
dysplasia (OED) has proven to be a poor predictor of malignant
transformation in several large studies (4–6).
Dysplasia may regress (7–9) and non-dysplastic lesions may transform
(4,10,11).
We (12,13) and others (14) have shown that DNA ploidy analysis
assessed by DNA image cytometry (ICM) can predict malignant
transformation in OPMD. This matches its clinical utility in a
range of other human precancers (15) and in light of the fact that
chromosomal instability (CI) is a hallmark of cancer (16). Alternative techniques to detect
chromosomal instability in OPMD include comparative genomic
hybridization (CGH) (17,18), single nucleotide polymorphism (SNP)
analysis (19) and fluorescence
in situ hybridization (FISH) (20).
The molecular changes of oral potentially malignant
diseases are well described at the level of whole tissue (21). However, there is almost no data
describing the clonal architecture of oral dysplasia, which can
only be revealed by a single cell technique because of the
relatively small size of lesions. The clonal structure of dysplasia
in other sites such as colon has been well defined and has
implications for the diagnosis and management of field change. The
aims of this investigation were to determine the number and tissue
organization of aneuploid cells in oral dysplasia, the number of
loci affected in different cells and to compare findings using a
FISH marker panel with image-based DNA ploidy analysis.
Materials and methods
Tissue samples
Oral biopsy samples from 20 patients with epithelial
dysplasia were retrieved from diagnostic archives of the Head and
Neck Pathology Service at Kings College London/Guy's Hospital,
London, UK. Patient consent procedures for use of tissue and
information were approved by the UK Patient Information Advisory
Group. DNA ploidy status was defined by ICM of dispersed
Feulgen-stained epithelial nuclei monolayers prepared from
formalin-fixed paraffin-embedded tissue after microdissection as
previously described (12).
Briefly, 50 µm thick paraffin sections were dewaxed in xylene and
rehydrated in alcohols. Nuclei were extracted by incubation in
0.05% protease type XXIV (Sigma-Aldrich; Merck KGaA) at 37°C for 90
min with shaking and cytospin monolayers were stained with
Fuelgen-PAS. Monolayers were analyzed (ZMZ) on a semi-automated
ploidy analyzer (Room4 Group Ltd., UK) and all images were reviewed
by a pathologist (EWO). ICM DNA ploidy result was the reference
test for ploidy status. Dysplasia was graded by agreement of two
histopathologists. Cases were selected to provide a range of
dysplasia grades and ploidy status; 7 with mild, 10 with moderate
and 3 with severe dysplasia, of which 2 mild, 4 moderate and 1
severe case were diploid and the remainder aneuploid on ICM DNA
ploidy.
Fluorescence in situ hybridization
DNA probes
Sections from each sample were subjected to five
separate duplex FISH hybridizations to one of each of five
chromosomal loci known to be frequently duplicated in OPMD. For
each region, a well characterized gene was selected as a marker for
the region rather than any putative role in oncogenesis. The
regions were 3q28 (TP63), 7p11.2 (EGFR), 8q24.3
(PTK2), 11q13.3 (CCND1) and 20q13.12 (MMP9)
labelled with Texas Red and a complementary centromeric probe
labelled with fluorescein isothiocyanate (FITC) or, in the case of
chromosome 20, a telomeric probe. The chromosome 7 probe pair was
commercially available and the remainder were custom designed
(Cytocell, UK) (sequences are provided in Table SI). Correct localization of novel
probes was confirmed on metaphase preparations.
Procedure
FISH was performed according to the manufacturer's
protocol (Cytocell, UK), with minor modifications, on 5-µm
paraffin-embedded tissue sections mounted on charged slides. In
brief, after dewaxing and rehydration, tissues were pre-treated
with Aquarius LPS100 enzyme solution (Cytocell, UK), dehydrated and
incubated with 10 µl of premixed probe solution sealed under a
coverslip, denatured at 85°C for 5 min and hybridized at 37°C for
20 h. Excess probe was removed by washing for 2 min in 0.4X SSC
stringent wash (pH 7.0) at 72°C, 2X SSC/0.05% Tween and finally
PBS, all at room temperature. Slides were air-dried and mounted
with 10 µl of DAPI nuclear counterstain containing premixed
antifade (Cytocell). Slides were stored in the dark at 4°C until
image capture.
Scoring and analysis
All scoring was performed blinded to the DNA ploidy
status and dysplasia grade. FISH signals in 47 independent tissue
areas were visualized using an Olympus BX61 microscope with
appropriate filters. Preliminary counts identified the epithelium
with the highest signal counts independently for each probe pair.
In all cases this area was the same area displaying the highest
grade of dysplasia. Depending on the size of the tissue, up to five
evenly spaced areas were selected for copy number assessment.
Red and green FISH signals were counted in 200
discrete non-overlapping nuclei in continuous sequences of basal
and para-basal cells up to five cells thick superficial to the
basement membrane in composite photomicrographs captured at ×600
magnification with an Olympus XM10 camera and Image Cell software
(Olympus Corp.). Blinded duplicate counts were performed to
calculate interobserver error.
Nuclei in the underlying connective tissue acted as
a methodological and diploid control. All areas assessed were from
within the area of epithelium that had been subjected to DNA
ICM.
Threshold detection and statistical
analysis
Cut-off FISH signal counts to define aneuploidy were
calculated for each probe using two standard methods; the mean
percentage of control diploid cells with signal count of three or
four plus three-times standard deviation (mean + 3SD) (22) and receiver operating characteristic
(ROC) analysis. Nuclei showing gene amplification, defined as tight
clusters of numerous overlapping signals that could not be counted,
were classified as DNA aneuploid without numerical analysis.
SPSS version 21 (IBM Corp.) was used to calculate
the mean percentage of nuclei with each copy number for each target
and to perform ROC. Power calculation and probability estimates for
ROC analysis were performed using MedCalc version 15.6.1 (MedCalc
Ostend). The agreement between DNA ICM ploidy and FISH ploidy
results was determined by calculating the κ-statistic.
Results
Of the 20 samples included in the study, 8 were from
males. The average age of the patients was 62 years (age range,
31–90 years). Four of the patients were smokers, 9 had no history
of smoking while the smoking history of the remainder was unknown.
The sites of biopsy were lateral tongue (n=10), ventral tongue
(n=1), tongue (n=1), buccal mucosa (n=3), floor of the mouth (n=3),
gingiva (n=1) and soft palate (n=1).
A total of 47 tissue areas were evaluated by FISH
from the 19 samples (3 cases with one area assessed, 8 cases with
two areas, 7 cases with three areas and 1 case with six areas,
depending on biopsy size). One additional area was scored for CCND1
only when amplification was found unexpectedly outside the area of
high signal counts for other probes. One tissue sample was excluded
after the failure of in situ hybridization.
In all samples, all connective tissue cell nuclei
were diploid, confirming lack of germ line polymorphism at all the
loci being assessed in each patient.
Copy number in ICM diploid
samples
All ICM DNA diploid samples (n=7) had FISH results
compatible with diploid status (Table
I). Signal counts of three and four, which might represent low
copy number gain or cells in S phase, G2 or mitosis, were
distributed unequally between samples with counts of three ranging
from 0.5 to 14.5% of the total. Only two samples (D6 and D7) had
cells with four signals per nucleus, in a total of 1% of nuclei.
These data were used to calculate the threshold for aneuploidy.
 | Table I.FISH ploidy status for each probe in
each tissue sample. |
Table I.
FISH ploidy status for each probe in
each tissue sample.
|
|
Chromosome
locus | Total probes |
|
|---|
|
|
|
|
|
|---|
| Sample number | Cen3 | 3q28 | Cen7 | 7p11.2 | Cen8 | 8q24.3 | Cen11 | 11q13.3 | Tel20p | 20q13.12 | D | A | Overall result |
|---|
| D1 | D | D | Da | Da | D | D | D | D | D | D | 10 | 0 | Da |
| D2 | D | D | D | D | D | D | D | D | D | D | 10 | 0 | D |
| D3 | D | D | D | D | D | D | D | D | D | D | 10 | 0 | D |
| D4 | D | D | D | D | D | D | D | D | D | D | 10 | 0 | D |
| D5 | D | D | D | D | D | D | D | D | D | D | 10 | 0 | D |
| D6 | D | D | D | D | D | D | D | D | D | D | 10 | 0 | D |
| D7 | D | D | D | D | D | D | D | D | D | D | 10 | 0 | D |
| A1 | A | A | A | A | A | A | A | A | A | A | 0 | 10 | A |
| A2 | D | D | Da | D | D | D | Da | Da | Da | D | 10 | 0 | Da |
| A3 | D | D | A | A | A | A | D | D | D | D | 6 | 4 | A |
| A4 | D | A | A | A | A | A | A | A | A | A | 1 | 9 | A |
| A5 | A | A | A | A | A | A | A | A | A | A | 0 | 10 | A |
| A6 | A | A | A | A | A | A | A | A | A | A | 0 | 10 | A |
| A7 | A | A | A | A | A | A | A | A | A | A | 0 | 10 | A |
| A8 | A | A | A | A | A | A | A | A | A | A | 0 | 10 | A |
| A9 | A | D | A | D | D | D | A | A | A | A | 4 | 6 | A |
| A10 | A | A | A | A | A | A | D | A | A | A | 1 | 9 | A |
| A11 | A | A | A | A | A | A | D | A | A | A | 1 | 9 | A |
| A12 | A | A | D | A | A | A | A | A | A | A | 1 | 9 | A |
| Total A | 9 | 9 | 10 | 10 | 10 | 10 | 8 | 10 | 10 | 10 | – | – | – |
All probes identified some diploid nuclei with copy
number of three and all samples contained some nuclei with copy
number three with multiple probes, suggesting variation caused by
normal cell cycle. Probes against PTK2 and CCND1
produced no nuclei with four signals.
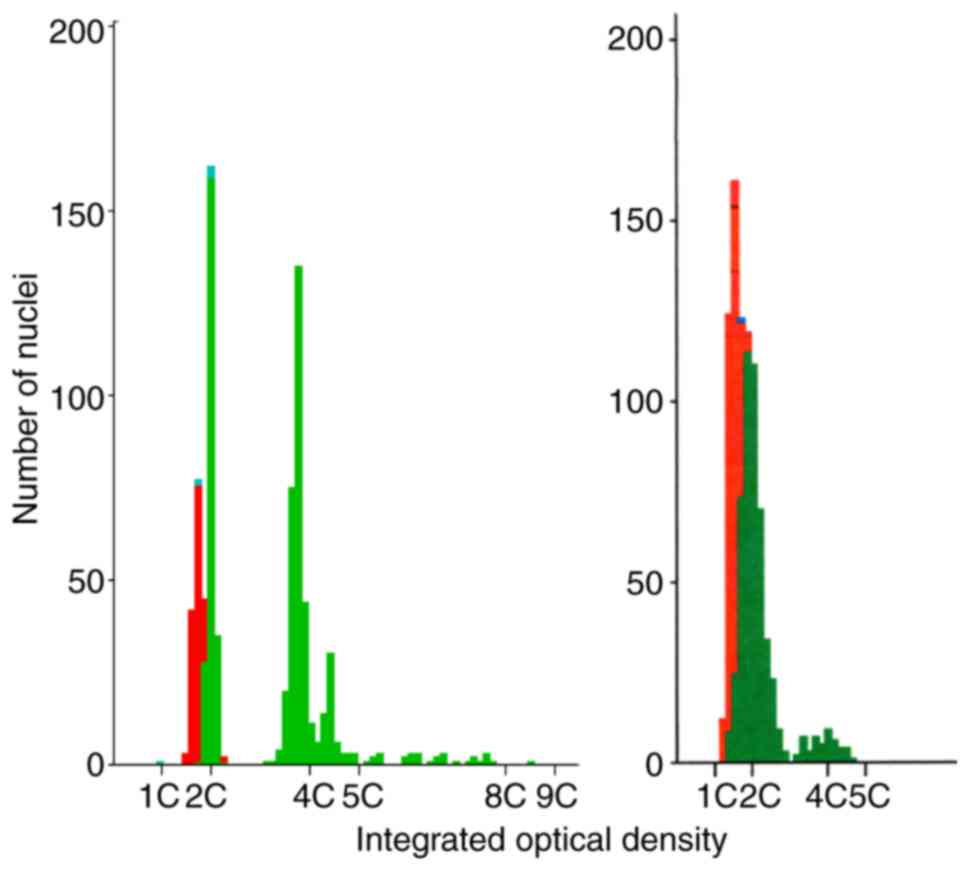
Copy number in ICM aneuploid
samples
Samples classified as aneuploid by ICM DNA ploidy
analysis showed heterogeneous patterns of copy number change with
all probes (Table I).
The most frequent changes were copy number changes
of three and four copies, amounting to low copy number gain, which
were found in between 10 and 30% of cells in all samples. Signal
counts of five or higher per nucleus were found in most cases but
were detected at only low frequency, in less than 5% of cells. The
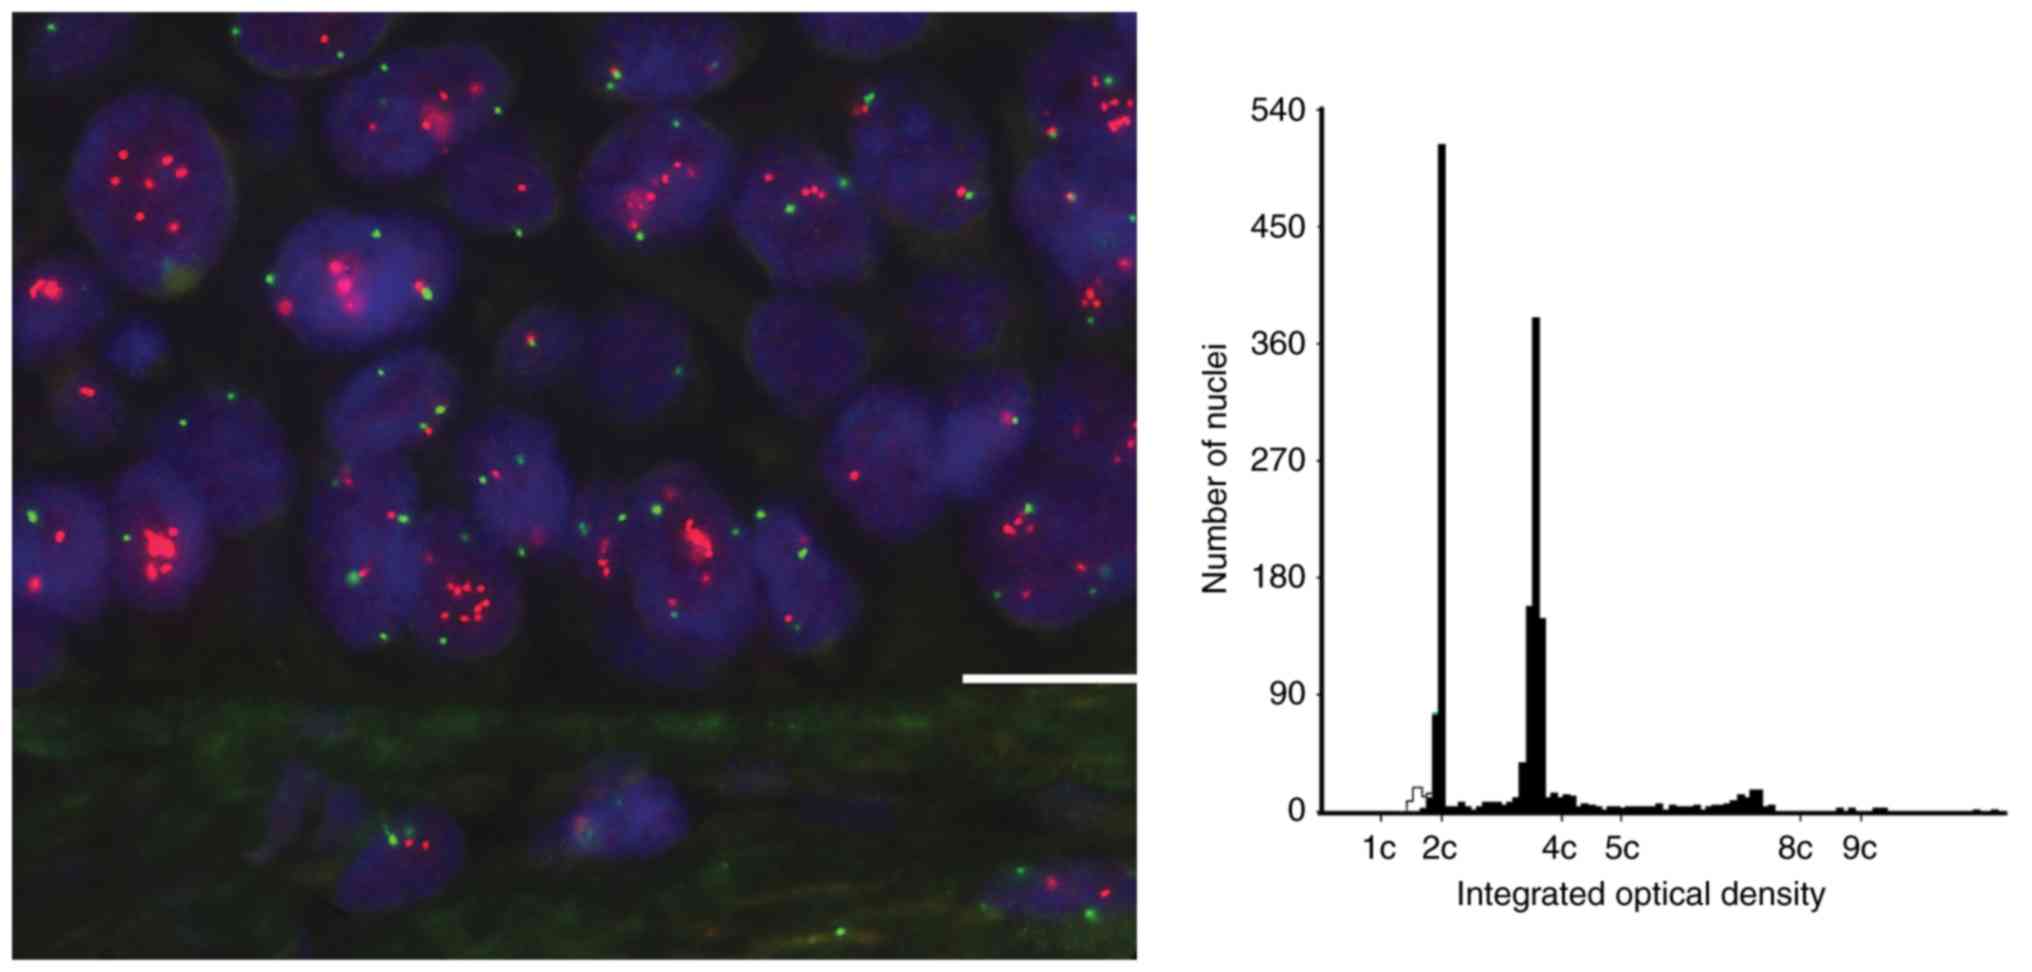
highest copy number for any locus per nucleus was 12 but this was a
rare occurrence (Fig. 1) and cells
with only one or two copies of each locus were predominant in most
samples. Mean copy number per nucleus ranged from 1.32 to 11.54 and
there was general concordance between increased copy number of
centromeric and gene-specific telomeric probes (Table SII).
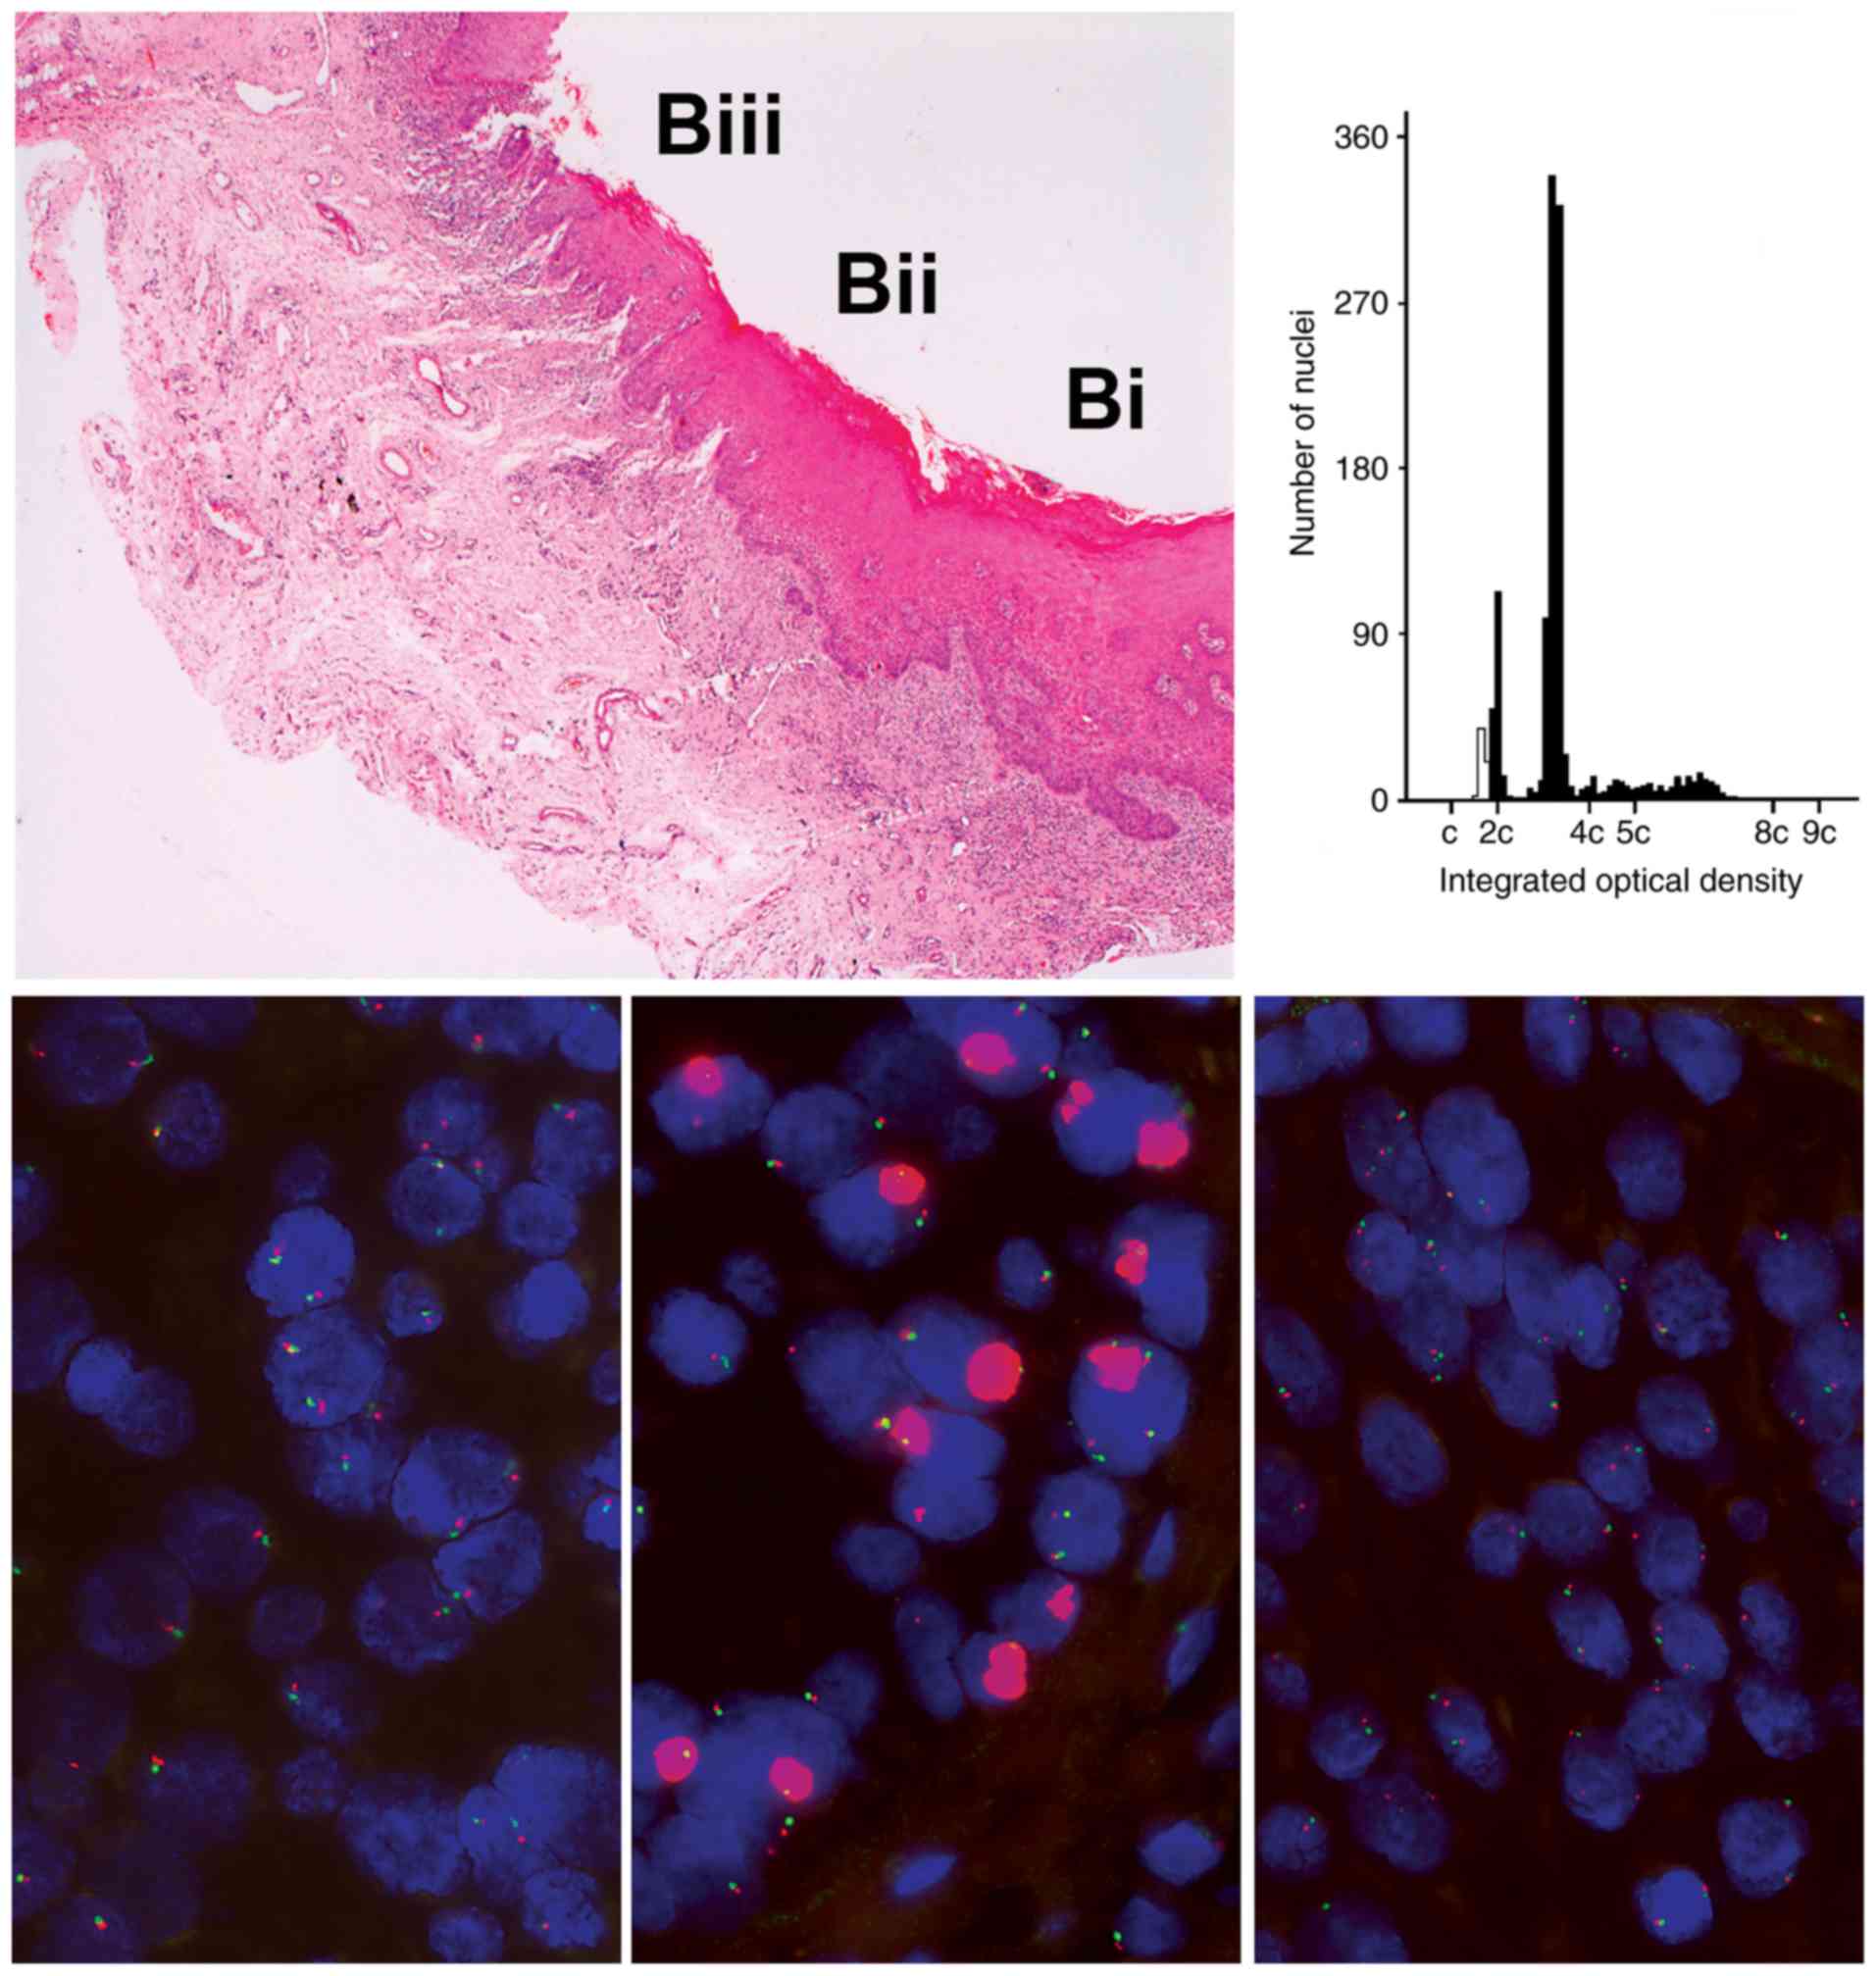
Gene amplification
Amplification, FISH signals too numerous and
clustered to count (Fig. 2), was a
relatively infrequent change observed only with EGFR and
CCND1. CCND1 amplification was found in four of 12
lesions. One lesion contained a single area that demonstrated
amplification of EGFR that was sharply demarcated and not
noted in adjacent epithelium, was not present in separate tissue
slices on the same slide and was not in the area showing the most
severe dysplasia and not identifiable from changes in routine
histological stains (Fig. 2).
Calculation of FISH threshold to
define aneuploidy
Two methods were used to set a diagnostic threshold
value for signal counts that would differentiate diploid status
from low copy number gain and both produced similar results.
Using the standard method of Kearney, the threshold
was determined over a total of 31,516 diploid cells scored in this
study. The highest mean percentage of nuclei with signal counts of
three and four plus three standard deviations found with any probe
was 12.8% for that against centromere 7 (Table II). Intraobserver error of 2.6% was
added and the threshold was set at 15%, rounded to the nearest
whole percent. Addition of intraobserver error adds a further
element of confidence when defining a cut off level and is an
additional precaution that has not been applied in previous
studies. This is a conservative threshold; the individually
calculated threshold for seven of the probes did not exceed
10%.
| Table II.Total mean percentage of nuclei plus
three standard deviations of copy number 3, 4, and 3 and 4 for each
probe target. |
Table II.
Total mean percentage of nuclei plus
three standard deviations of copy number 3, 4, and 3 and 4 for each
probe target.
|
| Mean percentage of
nuclei + 3SD |
|---|
|
|
|
|---|
| Locus | Copy number 3 | Copy number 4 | Copy number 3 and
4 |
|---|
| Cen 3 | 3.88 | 0.99 | 4.87 |
| 3q28 | 1.97 | 0.57 | 2.54 |
| Cen 7 | 12.18 | 0.58 | 12.76 |
| 7p11.2 | 10.06 | 0.41 | 10.47 |
| Cen 8 | 4.60 | 0.41 | 5.01 |
| 8q24.3 | 4.84 | 0.00 | 4.84 |
| Cen 11 | 6.86 | 0.41 | 7.27 |
| 11q13.3 | 2.26 | 0.00 | 2.26 |
| Tel 20p | 8.86 | 0.91 | 9.77 |
| 20q13.12 | 3.54 | 0.57 | 4.12 |
ROC analysis calculated from the 47 areas achieved a
probability of distinguishing diploid from low copy number
aneuploid samples of 0.8 with an area under the curve of 0.951 (95%
CI: 0.89–1.00). The minimum distance value to identify the optimum
threshold (balancing sensitivity and specificity) was 0.032,
providing a sensitivity of 0.833 (95% CI: 0.73–0.94) and
specificity of 0.938 (95% CI: 0.87–1.00). Based on ROC, a sample
was classified as aneuploid when more than 10% of all nuclei had
three or more signals, a slightly less stringent threshold than the
Kearney method, but in terms of the result almost directly
equivalent for most probes.
Concordance between FISH and ICM
Applying the standard calculated threshold, there
was complete concordance between FISH and reference standard ICM
for diagnosis of the seven diploid samples. For the aneuploid
samples, one of 12 ICM samples (A10) was misclassified as diploid,
making the results concordant between FISH and ICM in 18 out of 19
samples (94.7%, κ-value 0.89).
From the ROC calculated threshold, one ICM diploid
sample (D1) correctly classified as diploid at the 15% threshold
was misclassified as aneuploid by FISH. The ICM DNA aneuploid case
misclassified as diploid by FISH at the standard calculated
threshold was correctly classified as aneuploid.
The 12 ICM DNA aneuploid samples showed a range of
copy number aberrations with different probes and most were
confirmed to be aneuploid at multiple loci (Tables I and SIII).
Discordant results
Misclassification against the ICM reference standard
was reviewed (Fig. 3). Sample A10
was clearly aneuploid (CV diploid peak 2.98, aneuploid stem lines
at DI 1.88 and 2.2, 5c exceeding rate 3.98%). However, sample D1
lay at the ICM threshold definition of aneuploidy (CV diploid peak
9.9, multiple minor peaks in total comprising 9.98% of the total
epithelial nuclei with an average diploid index of 1.95 and a 5c
exceeding rate of 0%), just failing to reach the 10% threshold peak
size to be diagnosed as aneuploid. This was a true borderline
result using both tests.
Tissue architecture in dysplasia
The total number of aneuploid cells detected by FISH
ranged from 5 to 59% of the basal and suprabasal compartments, but
FISH detected fewer aneuploid cells than were found in the
aneuploid stem peaks using ICM DNA ploidy in seven cases. These
data are shown in Table III
together with the values of parameters acquired from ICM DNA ploidy
analysis, indicating the number of stem lines detected and their
relative DNA content. The results for each probe were constant
between areas in the same sample. Gene amplification was not found
within zones of copy number gain and these appeared independent
processes in the samples tested.
| Table III.Comparison between ICM DNA ploidy
parameters and FISH aneuploid cell detection. |
Table III.
Comparison between ICM DNA ploidy
parameters and FISH aneuploid cell detection.
| Sample number | Diploid index of
stem peak(s) on ICM | % epithelial cells
in stem peak on ICM | % 5c exceeding
frequency on ICM | Total % aneuploid
epithelial cells on ICM | Total % aneuploid
cells on FISH (all probes) | Number of FISH
probes showing aneuploidy |
|---|
| A1 | 1.9 | 13 | 1.00 | 17 | 33.7 | 10 |
|
| 2.2 | 3a |
|
|
|
|
| A2 | 1.88 | 47 | 4.0 | 59 | 5.0 | 0b |
|
| 2.2 | 8a |
|
|
|
|
| A3 | 1.1 | 29 | 0 | 29 | 6.7 | 4 |
| A4 | 1.6 | 10 | 0.4 | 10.4 | 12.0 | 9 |
| A5 | 1.8 | 42 | 3.1 | 45.1 | 27.4 | 10 |
| A6 | 2.0 | 22 | 1.8 | 23.8 | 29.7 | 10 |
| A7 | 3.5 | 87 | 11.1 | 87 | 47.4 | 10 |
| A8 | 2.8 | 11 | 11.5 | 22.5 | 59.3 | 10 |
| A9 | 1.8 | 44 | 8.9 | 52.9 | 10.7 | 6 |
| A10 | 1.6 | 15 | 0.8 | 15.8 | 24.2 | 9 |
| A11 | 2.18 | 51 | 11 | 62 | 19.6 | 9 |
| A12 | 1.6 | 66 | 10.1 | 76.1 | 37.7 | 9 |
Discussion
This study utilized two different methods to assess
chromosomal instability through copy number gain in oral epithelial
dysplasia. Image-based cytometry (ICM) DNA ploidy analysis is a
gross DNA measurement technique that works well to predict
development of carcinoma in clinical practice (12,14,23,24).
It can identify stable stem lines or clones within the lesion but
reveals nothing of the tissue architecture. In contrast, in
situ hybridization detects specific sequence changes in DNA in
single cells and can detect the spatial arrangement of DNA changes
at a tissue organizational level. However, fluorescence in
situ hybridization (FISH) is inefficient to detect deletions as
some of the nuclei will always be sectioned and incomplete,
mimicking deletion and the small numerical reductions make it
difficult to detect statistically significant reductions.
The FISH target sequences used here were selected as
markers of sites of common amplification in oral potentially
malignant disorders (OPMD), based on our previous research
(25) and published data (18, 26–29).
The specific sequences at 3q28, 7p11.2, 8q24.3, 11q13.3 and
20q13.12 were in genes TP63, EGFR, PTK2, CCND1 and
MMP9. However, these genes were chosen for their good
characterization and location in commonly amplified regions, rather
than any putative role in malignant transformation. We attach no
significance to these specific genes in interpreting our data.
EGFR and CCND1 have been used in previous similar
studies but the probes for 3q, 8q and 20q are novel. Centromeric,
and one remote telomeric probes were included to assess possible
chromosomal duplication, two of which were novel.
FISH signal counting was performed in continuous
runs of basal and transit amplifying cells in sections optimized to
minimize nuclear loss but reduce nuclear overlap. Standard clinical
diagnostic counting and diagnostic techniques were used, but we
counted many more cells than are normally counted in similar
studies (20,29), and sampled across a much wider
spatial range in each sample. Control cells were reproducibly
diploid with all probes, excluding false-positive results from
pseudogenes. ICM DNA samples were taken from adjacent sections,
with microdissection if required, to ensure both samples were as
similar as possible.
There are no standardized criteria to define
aneuploidy by FISH. Signal counts of three or four per nucleus
could represent either cells in S, G2 phase or mitosis, or
low-level copy number gain. In other similar studies, counts of
three or four per nucleus have been interpreted as either low copy
number gain (30), trisomy and
tetrasomy (20), or trisomy or
polysomy (29), sometimes without
statistical support. We applied the standard thresholding method
(22), which is well established
(31–34) to define a diagnostic threshold and
our data supports Poh et al (30) in defining cases with copy number
variation of three and four as having low copy number gain.
Using the maximum threshold value of 15% to exclude
false-positive results, only one incorrect classification of
diploid status was made by FISH, compared to reference standard
ICM. Using the diagnostic criteria applied by Poh et al
(30), this sample (A10) would have
been classified as low copy number gain.
Receiver operating characteristic (ROC) analysis,
although a more accurate method, could achieve only a low
statistical power in the sample size, despite a high area under the
ROC curve. Applying the calculated threshold classified all ICM DNA
aneuploid samples correctly but generated one false-positive
aneuploid result. A threshold of 10% was used by Poh et al
without calculation, adopted from earlier studies in lung carcinoma
(30). There are no published data
on threshold calculations in other similar publications (20,29).
With both the ROC analysis and the standard method, the FISH assay
has good concordance with ICM DNA ploidy, good sensitivity and
specificity.
Recently, Siebers et al showed an association
between malignant transformation and aneuploidy assessed by two
centromeric probes, for chromosomes 1 and 7 (20). Using only two FISH markers the
agreement with ICM ploidy status was only 63% compared to 90%
agreement with the present 10 marker panel. Addition of more target
loci would be expected to increase the predictive value of the
panel, and its agreement with ICM, but with diminishing returns as
additional probes are selected against less frequently amplified
loci. Our panel of 10 probes almost reached equivalence to DNA ICM,
and thus exceeded the predictive value of conventional dysplasia
grading (35).
The clonal structure of precancer is well defined in
the colon (36) and at other sites.
Dysplasia of the oral mucosa is often sharply demarcated laterally
and this is generally considered to indicate a clonal structure, as
has been identified by X-linked histochemical methods (37) and, less specifically, by differences
in loss of heterozygosity patterns within lesions (38). Oral mucosa has a similar stem cell
and clonal structure to skin (39),
which is better developed in epithelia with well-developed rete
processes (40). Understanding the
clonal structure of premalignant oral epithelium is important as it
may affect therapeutic interventions for field change and reflect
the initial clonality of oral squamous carcinomas. Recent molecular
data suggest that oral dysplasia is clonal and has neutral clonal
evolution rather than being epithelium that is progressively being
completely replaced by clones selected by greater growth potential
(41). This is consistent with
research suggesting that cancer pathways in dysplasia are
frequently inhibited rather than activated (21). This FISH analysis has revealed
insights into the spatial molecular architecture of oral dysplastic
lesions that are not observed by other methods and are consistent
with the concept that some aneuploid cells in dysplasia are
incapable of maintaining a pure clonal population.
Our results showed that amplification at a specific
locus is only carried by a minority of epithelial cells in any
lesion and that clearly aneuploid samples rarely contained cells
with high copy number gains, consistent with ICM results that OPMD
usually only harbor stem lines with DNA content of 3c or less. FISH
showed that most aneuploid lesions had amplification with the
majority, or all, probes, suggesting one abnormal clonal
population.
DNA ICM is the more sensitive technique, detecting
many more aneuploid cells than FISH in most samples, and revealing
a single stem line population in 10 of 12 aneuploid samples. Our
results show that ICM DNA aneuploid stem lines are relatively
homogeneous at a molecular level, at least within the detection
limits of both techniques and 10 probes. Two aneuploid samples
lacked ICM stem line peaks, and one was aneuploid with all 10 FISH
probes despite apparently being ICM non-clonal.
Concordance between centromeric and telomeric
amplification suggests that whole chromosomes or large parts of
chromosomes are duplicated, consistent with the concept that the
cause of DNA ploidy anomalies is usually non-disjunction.
Multiple copy gene amplification involved only
CCND1 (four samples) and EGFR (one sample) and both
loci showed distinctive patches of clustered signals with sharp
boundaries suggesting a clonal architecture. CCND1
amplification co-localized with severe dysplasia, but EGFR
amplification did not correlate with dysplasia in routine sections
and the affected epithelium appeared normal. Both of the other
adjacent tissue slices in the block from this latter lesion were
diploid throughout, showing the size of the clone carrying
EGFR amplification to be small, less than 2 mm across.
EGFR and CCND1 amplifications have
been previously investigated in 35 oral dysplastic lesions and high
copy number was strongly associated with malignant transformation
(30). That study also showed
amplification of EGFR and CCND1, but in fewer cases
than in the present study. In another study of 20 oral premalignant
lesions, only one had gene amplification (29), together suggesting it is a
relatively infrequent change.
In summary, a panel of 10 FISH probes against loci
that frequently show increased copy number in oral dysplasia
revealed that aneuploid cells in our oral dysplasia samples were
interspersed with normal diploid cells so that dysplastic
epithelium did not comprise a uniform clonal population of cells.
In all cases, aneuploid cells formed only a minority population and
high copy number gain was unusual. These findings add weight to the
suggestion that oral dysplasia contains cells with inhibited cancer
pathways (21) and develops through
neutral clonal evolution (41)
rather than being a progressive replacement of epithelium by clones
with a growth advantage on a relentless pathway to carcinoma. In
any one lesion the aneuploid cells had amplification at all or
almost all loci tested, matched to chromosome-specific loci and
therefore the result of chromosome or large fragment duplication,
making non-disjunction the likely cause. A few small clones were
detected by gene amplification. The present study utilized the
broadest panel of FISH probes applied to oral dysplasia and the
panel had almost equal ability to detect aneuploidy as image-based
DNA ploidy analysis.
Supplementary Material
Supporting Data
Supporting Data
Supporting Data
Acknowledgements
Not applicable.
Funding
This study was funded by a scholarship granted to
ZMZ from the Ministry of Higher Education Malaysia (reference no.
KPT(BS)740612086532). The funder had no role in the design of the
study, in the collection, analyses, or interpretation of data, in
the writing of the manuscript, and in the decision to publish the
results.
Availability of data and materials
The datasets used and analysed in the present study
are available from the corresponding authors on reasonable
request.
Authors' contributions
ZMZ conceived and performed the experiments,
analyzed the data, carried out the statistical analysis and wrote
the manuscript. EWO conceived and designed the study, carried out
acquisition of the samples and edited the manuscript. AS
contributed to the study design and selection of markers. MN and MT
provided expert advice on experimental protocol and facilitated the
interpretation of the results. All authors reviewed, edited and
approved the final version of the manuscript, and all agree to be
accountable for all aspects of the research in ensuring that the
accuracy or integrity of any part of the work are appropriately
investigated and resolved.
Ethics approval and consent to
participate
This study complies with UK guidelines and
legislation and use of material and individuals' information has
been specifically approved by the UK Patient Information Advisory
Group [PIAG reference 4-09(f)2003].
Patient consent for publication
Specifically exempted under the ethics approval
above.
Competing interests
The authors declare that they have no competing
interests.
Glossary
Abbreviations
Abbreviations:
|
CGH
|
comparative genomic hybridization
|
|
CI
|
chromosomal instability
|
|
FISH
|
fluorescence in situ
hybridization
|
|
FITC
|
fluorescein isothiocyanate
|
|
ICM
|
image-based cytometry
|
|
OED
|
oral epithelial dysplasia
|
|
OPMD
|
oral potentially malignant
disorders
|
|
OSCC
|
oral squamous cell carcinoma
|
|
SNP
|
single nucleotide polymorphism
|
|
3SD
|
three-times the standard deviation
|
|
CCND1
|
cyclin D1
|
|
TP63
|
tumor protein P63
|
|
EGFR
|
epidermal growth factor receptor
|
|
PTK2
|
protein tyrosine kinase 2
|
|
MMP9
|
matrix metalloproteinase-9
|
References
|
1
|
Woolgar JA: Histopathological
prognosticators in oral and oropharyngeal squamous cell carcinoma.
Oral Oncol. 42:229–239. 2006. View Article : Google Scholar : PubMed/NCBI
|
|
2
|
Massano J, Regateiro FS, Januário G and
Ferreira A: Oral squamous cell carcinoma: Review of prognostic and
predictive factors. Oral Surg Oral Med Oral Pathol Oral Radiol
Endod. 102:67–76. 2006. View Article : Google Scholar : PubMed/NCBI
|
|
3
|
Warnakulasuriya S, Johnson NW and van der
Waal I: Nomenclature and classification of potentially malignant
disorders of the oral mucosa. J Oral Pathol Med. 36:575–580. 2007.
View Article : Google Scholar : PubMed/NCBI
|
|
4
|
Holmstrup P, Vedtofte P, Reibel J and
Stoltze K: Long-term treatment outcome of oral premalignant
lesions. Oral Oncol. 42:461–474. 2006. View Article : Google Scholar : PubMed/NCBI
|
|
5
|
Dost F, Lê Cao K, Ford PJ, Ades C and
Farah CS: Malignant transformation of oral epithelial dysplasia: A
real-world evaluation of histopathologic grading. Oral Surg Oral
Med Oral Pathol Oral Radiol. 117:343–352. 2014. View Article : Google Scholar : PubMed/NCBI
|
|
6
|
Brouns E, Baart J, Karagozoglu Kh, Aartman
I, Bloemena E and van der Waal I: Malignant transformation of oral
leukoplakia in a well-defined cohort of 144 patients. Oral Dis.
20:e19–e24. 2014. View Article : Google Scholar : PubMed/NCBI
|
|
7
|
Gupta PC, Mehta FS, Daftary DK, Pindborg
JJ, Bhonsle RB, Jalnawalla PN, Sinor PN, Pitkar VK, Murti PR, Irani
RR, et al: Incidence rates of oral cancer and natural history of
oral precancerous lesions in a 10-year follow-up study of Indian
villagers. Community Dent Oral Epidemiol. 8:283–333. 1980.
View Article : Google Scholar : PubMed/NCBI
|
|
8
|
Mincer HH, Coleman SA and Hopkins KP:
Observations on the clinical characteristics of oral lesions
showing histologic epithelial dysplasia. Oral Surg Oral Med Oral
Pathol. 33:389–399. 1972. View Article : Google Scholar : PubMed/NCBI
|
|
9
|
Bánóczy J and Sugár L: Longitudinal
studies in oral leukoplakias. J Oral Pathol. 1:265–272. 1972.
View Article : Google Scholar : PubMed/NCBI
|
|
10
|
Silverman S Jr, Gorsky M and Lozada F:
Oral leukoplakia and malignant transformation. A follow-up study of
257 patients. Cancer. 53:563–568. 1984. View Article : Google Scholar : PubMed/NCBI
|
|
11
|
Schepman KP, van der Meij EH, Smeele LE
and van der Waal I: Malignant transformation of oral leukoplakia: A
follow-up study of a hospital-based population of 166 patients with
oral leukoplakia from The Netherlands. Oral Oncol. 34:270–275.
1998. View Article : Google Scholar : PubMed/NCBI
|
|
12
|
Sperandio M, Brown AL, Lock C, Morgan PR,
Coupland VH, Madden PB, Warnakulasuriya S, Møller H and Odell EW:
Predictive value of dysplasia grading and DNA ploidy in malignant
transformation of oral potentially malignant disorders. Cancer Prev
Res (Phila). 6:822–831. 2013. View Article : Google Scholar : PubMed/NCBI
|
|
13
|
Zaini ZM, McParland H, Møller H, Husband K
and Odell EW: Predicting malignant progression in clinically
high-risk lesions by DNA ploidy analysis and dysplasia grading. Sci
Rep. 8:158742018. View Article : Google Scholar : PubMed/NCBI
|
|
14
|
Bradley G, Odell EW, Raphael S, Ho J, Le
LW, Benchimol S and Kamel-Reid S: Abnormal DNA content in oral
epithelial dysplasia is associated with increased risk of
progression to carcinoma. Br J Cancer. 103:1432–1442. 2010.
View Article : Google Scholar : PubMed/NCBI
|
|
15
|
Danielsen HE, Pradhan M and Novelli M:
Revisiting tumour aneuploidy-the place of ploidy assessment in the
molecular era. Nat Rev Clin Oncol. 13:291–304. 2016. View Article : Google Scholar : PubMed/NCBI
|
|
16
|
Hanahan D and Weinberg RA: Hallmarks of
cancer: The next generation. Cell. 144:646–674. 2011. View Article : Google Scholar : PubMed/NCBI
|
|
17
|
Garnis C, Chari R, Buys TP, Zhang L, Ng
RT, Rosin MP and Lam WL: Genomic imbalances in precancerous tissues
signal oral cancer risk. Mol Cancer. 8:502009. View Article : Google Scholar : PubMed/NCBI
|
|
18
|
Tsui IF, Rosin MP, Zhang L, Ng RT and Lam
WL: Multiple aberrations of chromosome 3p detected in oral
premalignant lesions. Cancer Prev Res (Phila). 1:424–429. 2008.
View Article : Google Scholar : PubMed/NCBI
|
|
19
|
Zhou X, Li C, Mok SC, Chen Z and Wong DT:
Whole genome loss of heterozygosity profiling on oral squamous cell
carcinoma by high-density single nucleotide polymorphic allele
(SNP) array. Cancer Genet Cytogenet. 151:82–84. 2004. View Article : Google Scholar : PubMed/NCBI
|
|
20
|
Siebers TJ, Bergshoeff VE, Otte-Höller I,
Kremer B, Speel EJ, van der Laak JA, Merkx MA and Slootweg PJ:
Chromosome instability predicts the progression of premalignant
oral lesions. Oral Oncol. 49:1121–1128. 2013. View Article : Google Scholar : PubMed/NCBI
|
|
21
|
Makarev E, Schubert AD, Kanherkar RR,
London N, Teka M, Ozerov I, Lezhnina K, Bedi A, Ravi R, Mehra R, et
al: In silico analysis of pathways activation landscape in
oral squamous cell carcinoma and oral leukoplakia. Cell Death
Discov. 3:170222017. View Article : Google Scholar : PubMed/NCBI
|
|
22
|
Kearney L: Molecular cytogenetics. Best
Pract Res Clin Haematol. 14:645–669. 2001. View Article : Google Scholar : PubMed/NCBI
|
|
23
|
van Zyl AW, van Heerden MB, Langenegger E
and van Heerden WF: Correlation between dysplasia and ploidy status
in oral leukoplakia. Head Neck Pathol. 6:322–327. 2012. View Article : Google Scholar : PubMed/NCBI
|
|
24
|
Torres-Rendon A, Stewart R, Craig GT,
Wells M and Speight PM: DNA ploidy analysis by image cytometry
helps to identify oral epithelial dysplasias with a high risk of
malignant progression. Oral Oncol. 45:468–473. 2009. View Article : Google Scholar : PubMed/NCBI
|
|
25
|
Stokes A, Drozdov I, Guerra E, Ouzounis
CA, Warnakulasuriya S, Gleeson MJ, McGurk M, Tavassoli M and Odell
EW: Copy number and loss of heterozygosity detected by SNP array of
formalin-fixed tissues using whole-genome amplification. PLoS One.
6:e245032011. View Article : Google Scholar : PubMed/NCBI
|
|
26
|
Leemans CR, Braakhuis BJ and Brakenhoff
RH: The molecular biology of head and neck cancer. Nat Rev Cancer.
11:9–22. 2011. View Article : Google Scholar : PubMed/NCBI
|
|
27
|
Saintigny P, Zhang L, Fan YH, El-Naggar
AK, Papadimitrakopoulou VA, Feng L, Lee JJ, Kim ES, Ki Hong W and
Mao L: Gene expression profiling predicts the development of oral
cancer. Cancer Prev Res (Phila). 4:218–229. 2011. View Article : Google Scholar : PubMed/NCBI
|
|
28
|
Cha JD, Kim HJ and Cha IH: Genetic
alterations in oral squamous cell carcinoma progression detected by
combining array-based comparative genomic hybridization and
multiplex ligation-dependent probe amplification. Oral Surg Oral
Med Oral Pathol Oral Radiol Endod. 111:594–607. 2011. View Article : Google Scholar : PubMed/NCBI
|
|
29
|
Taoudi Benchekroun M, Saintigny P, Thomas
SM, El-Naggar AK, Papadimitrakopoulou V, Ren H, Lang W, Fan YH,
Huang J, Feng L, et al: Epidermal growth factor receptor expression
and gene copy number in the risk of oral cancer. Cancer Prev Res
(Phila). 3:800–809. 2010. View Article : Google Scholar : PubMed/NCBI
|
|
30
|
Poh CF, Zhu Y, Chen E, Berean KW, Wu L,
Zhang L and Rosin MP: Unique FISH patterns associated with cancer
progression of oral dysplasia. J Dent Res. 91:52–57. 2012.
View Article : Google Scholar : PubMed/NCBI
|
|
31
|
Bentz M, Cabot G, Moos M, Speicher MR,
Ganser A, Lichter P and Döhner H: Detection of chimeric BCR-ABL
genes on bone marrow samples and blood smears in chronic myeloid
and acute lymphoblastic leukemia by in situ hybridization. Blood.
83:1922–1928. 1994. View Article : Google Scholar : PubMed/NCBI
|
|
32
|
Qian J, Bostwick DG, Takahashi S, Borell
TJ, Brown JA, Lieber MM and Jenkins RB: Comparison of fluorescence
in situ hybridization analysis of isolated nuclei and routine
histological sections from paraffin-embedded prostatic
adenocarcinoma specimens. Am J Pathol. 149:1193–1199.
1996.PubMed/NCBI
|
|
33
|
Veltman JA, Bot FJ, Huynen FC, Ramaekers
FC, Manni JJ and Hopman AH: Chromosome instability as an indicator
of malignant progression in laryngeal mucosa. J Clin Oncol.
18:1644–1651. 2000. View Article : Google Scholar : PubMed/NCBI
|
|
34
|
Schwarz S, Bier J, Driemel O, Reichert TE,
Hauke S, Hartmann A and Brockhoff G: Losses of 3p14 and 9p21 as
shown by fluorescence in situ hybridization are early events in
tumorigenesis of oral squamous cell carcinoma and already occur in
simple keratosis. Cytometry A. 73:305–311. 2008. View Article : Google Scholar : PubMed/NCBI
|
|
35
|
Mehanna HM, Rattay T, Smith J and McConkey
CC: Treatment and follow-up of oral dysplasia-a systematic review
and meta-analysis. Head Neck. 31:1600–1609. 2009. View Article : Google Scholar : PubMed/NCBI
|
|
36
|
Humphries A and Wright NA: Colonic crypt
organization and tumorigenesis. Nat Rev Cancer. 8:415–424. 2008.
View Article : Google Scholar : PubMed/NCBI
|
|
37
|
Seddon SV: An investigation of the clonal
organisation of normal and neoplastic oral epithelium using
x-linked histochemistry (unpublished PhD thesis). Cardiff
University; 1993
|
|
38
|
Gomes CC, Fonseca-Silva T, Galvão CF,
Friedman E, De Marco L and Gomez RS: Inter- and intra-lesional
molecular heterogeneity of oral leukoplakia. Oral Oncol.
51:178–181. 2015. View Article : Google Scholar : PubMed/NCBI
|
|
39
|
Hume WJ and Potten CS: The ordered
columnar structure of mouse filiform papillae. J Cell Sci.
22:149–160. 1976.PubMed/NCBI
|
|
40
|
Asaka T, Akiyama M, Kitagawa Y and Shimizu
H: Higher density of label-retaining cells in gingival epithelium.
J Dermatol Sci. 55:132–134. 2009. View Article : Google Scholar : PubMed/NCBI
|
|
41
|
Wood HM, Daly C, Chalkley R, Senguven B,
Ross L, Egan P, Chengot P, Graham J, Sethi N, Ong TK, et al: The
genomic road to invasion-examining the similarities and differences
in the genomes of associated oral pre-cancer and cancer samples.
Genome Med. 9:532017. View Article : Google Scholar : PubMed/NCBI
|