Introduction
As the most common type of adult leukemia, acute
myeloid leukemia (AML) is characterized by the excessive expansion
of immature myeloblasts from leukemic stem cells (LSCs) (1). LSC-based gene sets have previously
been selected to predict the clinical outcomes of AML, particularly
cytogenetically normal AML (CN-AML) (2,3). The
t(8;21) chromosomal rearrangement is one of the most classic
genetic abnormalities in AML, and results in a transcript encoding
for the fusion protein acute myeloid leukemia 1 protein-protein ETO
(AML1-ETO; also known as RUNX1-RUNX1T1) (4). Following conventional chemotherapy,
patients with t(8;21) AML have a relatively favorable prognosis,
and steady progress has been observed in the success of t(8;21) AML
treatment (5). However, the relapse
and long-term survival rate are less than optimal, and highlight
the requirement for more accurate diagnostic and therapeutic
strategies (6); elucidation of the
molecular mechanisms of t(8;21) AML are fundamental to the
development of more precise diagnostic and therapeutic methods.
Single-cell RNA sequencing (scRNA-seq) has been
widely used in developmental biology and oncological research,
primarily due to its ability to profile rare or heterogeneous
populations of cells (7). In the
present study, scRNA-seq analysis was performed on 87 cells from
two patients with t(8;21) AML. Single cells were separated into
subpopulations with specific gene marker expression patterns; 31
differentially expressed genes (DEGs) were identified from the
cells of patient B, which were considered to be associated with
poor patient outcome. Furthermore, three genes, namely AT-rich
interaction domain 2 (ARID2), lysine methyltransferase 2A
(MLL) and synaptotagmin binding cytoplasmic RNA interacting
protein (SYNCRIP) were demonstrated to have prognostic
significance in two bulk expression datasets of patients with
t(8;21) AML (GSE37642 and GSE6891) (8,9). To
conclude, the present study is, to the best of the authors'
knowledge, the first to demonstrate the single-cell transcriptome
profile of two patients with t(8;21) AML, and to suggest several
possible prognostic biomarkers.
Materials and methods
Patients and specimens
Patient recruitment and sample collection took place
at Chinese PLA General Hospital from January 2014 to December 2015.
The present study was approved by The Institutional Review Board of
Chinese PLA General Hospital, and written informed consent was
obtained from both patients with AML. To classify the subtype and
prognostic risk of the two patients, chromosome banding,
immunophenotyping, flow cytometric analysis and real-time PCR for
the fusion genes were conducted.
Targeted DNA sequencing
Targeted DNA sequencing of bone marrow samples was
performed as previously described (10).
Single-cell isolation, cDNA
amplification and RNA-sequencing
Single cells were isolated from the bone marrow (BM)
and peripheral blood (PB) of the two patients. Single-cell loading,
capture and cDNA amplification were carried out using the C1™
Single-Cell Auto Prep system (Fluidigm). A total of 87 single cells
were loaded into a medium-sized C1 Single-Cell Auto Prep integrated
fluidics circuit, as previously described (11). Afterwards, capture, reverse
transcription and cDNA amplification were immediately performed
according to the manufacturer's instructions (Fig. S1). RNA was extracted from samples
and cDNA was reverse transcribed (Reverse Transcription System
A3500; Promega Corporation) from RNA with TRIzol®
reagent (Invitrogen; Thermo Fisher Scientific, Inc.). The reaction
conditions used were as follows: Pre-denaturation at 95°C for 15
min; then denaturation at 94°C for 30 sec, annealing at 53°C for 30
sec, and extension at 72°C for 30 sec, 28 cycles; final extension
at 72°C for 8 min. Sequencing libraries were constructed using the
Nextera XT DNA Sample Prep kit (Illumina, Inc.) and sequenced using
the HiSeq2500 platform (Illumina, Inc.). Paired-end 100-bp reads
were quality- and adapter-filtered using Trim Galore! software
(http://www.bioinformatics.babraham.ac.uk/projects/trim_galore/;
version 0.4.4).
Gene fusion prediction
For each cell, the clean reads were mapped to the
human genome reference sequences (hg19 version) using the STAR
aligner (v2.4.1) (12), and fusion
gene detection was performed using STAR-Fusion (https://github.com/STAR-Fusion/STAR-Fusion; v1.3.2),
which compared with other methods, was sufficient for fusion RNA
prediction (13).
Quantitative-PCR (qPCR)
qPCR was performed with the iQ™
SYBR® Green Supermix (Bio-Rad Laboratories, Inc.) using
cDNA from five cells from patient A (newly diagnosed) with
potential AML1-ETO gene fusion. The following reaction conditions
were used: Pre-denaturation at 95°C for 1 min; then denaturation at
95°C for 5 sec, and extension at 53°C for 20 sec, 40 cycles; final
denaturation at 95°C for 1 min, 60°C for 1 min, 95°C for 30 sec.
GAPDH was used as an internal reference gene, and the primer
sequences of GAPDH were as follows: Forward,
5′-GAGTCAACGGATTTGGTCGT-3′ and reverse, 5′-TTGATTTTGGAGGGATCTCG-3′;
and the primer sequences of AML1-ETO were as follows: Forward,
5′-AACCACTCCACTGCCTTTAACC-3′ and reverse,
5′-TGGAGGAGTCAGCCTAGATTGC-3′. The 2−∆∆Cq method
(14) was used to quantify the
AML1-ETO gene fusions. Due to the shortages of cDNA left over after
the construction of the sequencing libraries, AML1-ETO fusion in
each cell was measured using both the Mx3005P qPCR System (Agilent
Technologies, Inc.) and the ABI 7500 Real-Time PCR System (Applied
Biosystems; Thermo Fisher Scientific, Inc.).
Bioinformatics analysis
The high-quality reads were pseudo-aligned with the
human genome reference sequence (Ensembl Release 72 of GRCh37)
annotations using Kallisto (15),
and quantified as transcript per million (TPM) using AltAnalyze
(16). Expression levels were
transformed as log2(TPM/10+1) as described in previous
studies (17,18), and single cells were subjected to
hierarchical clustering according to their expression levels.
Principal component analysis (PCA) was then performed based on the
results of hierarchical clustering. Furthermore, unsupervised
clustering was performed with scRNA-seq data from patient B using
the SC3 pipeline (version 1.12.0) (19). The functions of DGEs were determined
through a literature review (20–36).
Interactions between DEGs were analyzed using the Gene Multiple
Association Network Integration Algorithm (GeneMANIA; http://www.genemania.org/; accessed July 24, 2019)
(37). The Search Tool for the
Retrieval of Interacting Genes (STRING; https://string-db.org/; accessed July 24, 2019) was
used to investigate the protein-protein interactions between DEGs
(38).
Statistical analysis
The heatmap of 31 DEGs were performed using the
pheatmap (https://CRAN.R-project.org/package=pheatmap; version
1.0.12) R package. The expression levels of the four marker genes
were analyzed using the ggpubr (https://CRAN.R-project.org/package=ggpubr; version
1.0.12) R package and Kruskal-Wallis test.
Survival analysis
The expression matrices of two GEO datasets GSE37642
(9) and GSE6891 (8) were downloaded from The National Center
of Biotechnology Information using the GEOquery (version 2.52.0) R
package (39). In total, 30 and 22
patients with t(8;21) AML from GSE37642 and GSE6891, respectively,
were selected for survival analysis. For each gene, the expression
value of a selected probe was used to represent the expression
level of the gene. A median, tri-sectional quantile or quartile
threshold of expression values was used to categorize patients into
high- and low-expression groups. The survminer (https://CRAN.R-project.org/package=survminer; version
2.52.0) R package and Log-rank test were used for visualizing the
Kaplan-Meier estimates of survival curves.
Results
scRNA-seq for two patients with
t(8;21) AML
The two enrolled female patients represented the two
stages of AML: Newly diagnosed (patient A) and relapse after
hematopoietic stem cell transplantation (HSCT; patient B). The
clinical information of these two patients is presented in Table I. The French American-British
Cooperative Group Criteria (5),
chromosomal karyotype analysis, flow cytometric analysis, reverse
transcription and real-time fluorescent qPCR all suggested that
both patients possessed the t(8;21) translocation, which classified
them as AML type M2. A total of five cells from patient A were
predicted to possess the AML1-ETO (RUNX1-RUNX1T1) gene fusion
(Table SI), which was confirmed by
qPCR (Fig. S2). These results
based on scRNA-seq data demonstrated the existence of the AML1-ETO
fusion in patient A. However, due to the low amount of data, none
of the cells from patient B were predicted to harbor AML1-ETO
fusions. Moreover, none of the known AML-associated somatic
mutations were detected by targeted DNA-sequencing.
 | Table I.Clinical information of two patients
with acute myeloid leukemia. |
Table I.
Clinical information of two patients
with acute myeloid leukemia.
| Name | Age, years | Sex | Tissue | Blast,
%a | Stage at
analysis | Karyotype |
|---|
| Patient A | 74 | Female | PB | 81 | New diagnosis | 46,XX,t(8;21) |
| Patient B | 29 | Female | BM | 94 | Relapse after
HSCT | 46,XX,t(8;21) |
The treatment outcome for patient A was more
favorable, as she achieved complete remission after a course of
chemotherapy, and didn't relapse until death from another cause ~15
months later. On the contrary, the outcome for patient B was poor,
due to relapse after the 15th course of chemotherapy and a second
relapse 3 months after HSCT.
Single cells were isolated from the PB and BM of the
two patients, and 87 cells qualified for the generation of RNA-seq
data. With the exception of one of the cells (with a total read of
19 million), the total reads of the 87 cells ranged from 0.4 to 9
million (Table SI), which was
sufficient for scRNA-seq analysis (10). The median reads of the patient B
cells were relatively lower than those from patient A (Fig. S3), suggesting their abnormal
transcriptional programs.
Separation of leukemia cell
subpopulations
scRNA-seq data were pseudo-aligned and quantified as
TPM using Kallisto, an alignment-free-based quantification method
(13). TPM values were then
log2 transformed (after dividing by 10 and adding 1) as
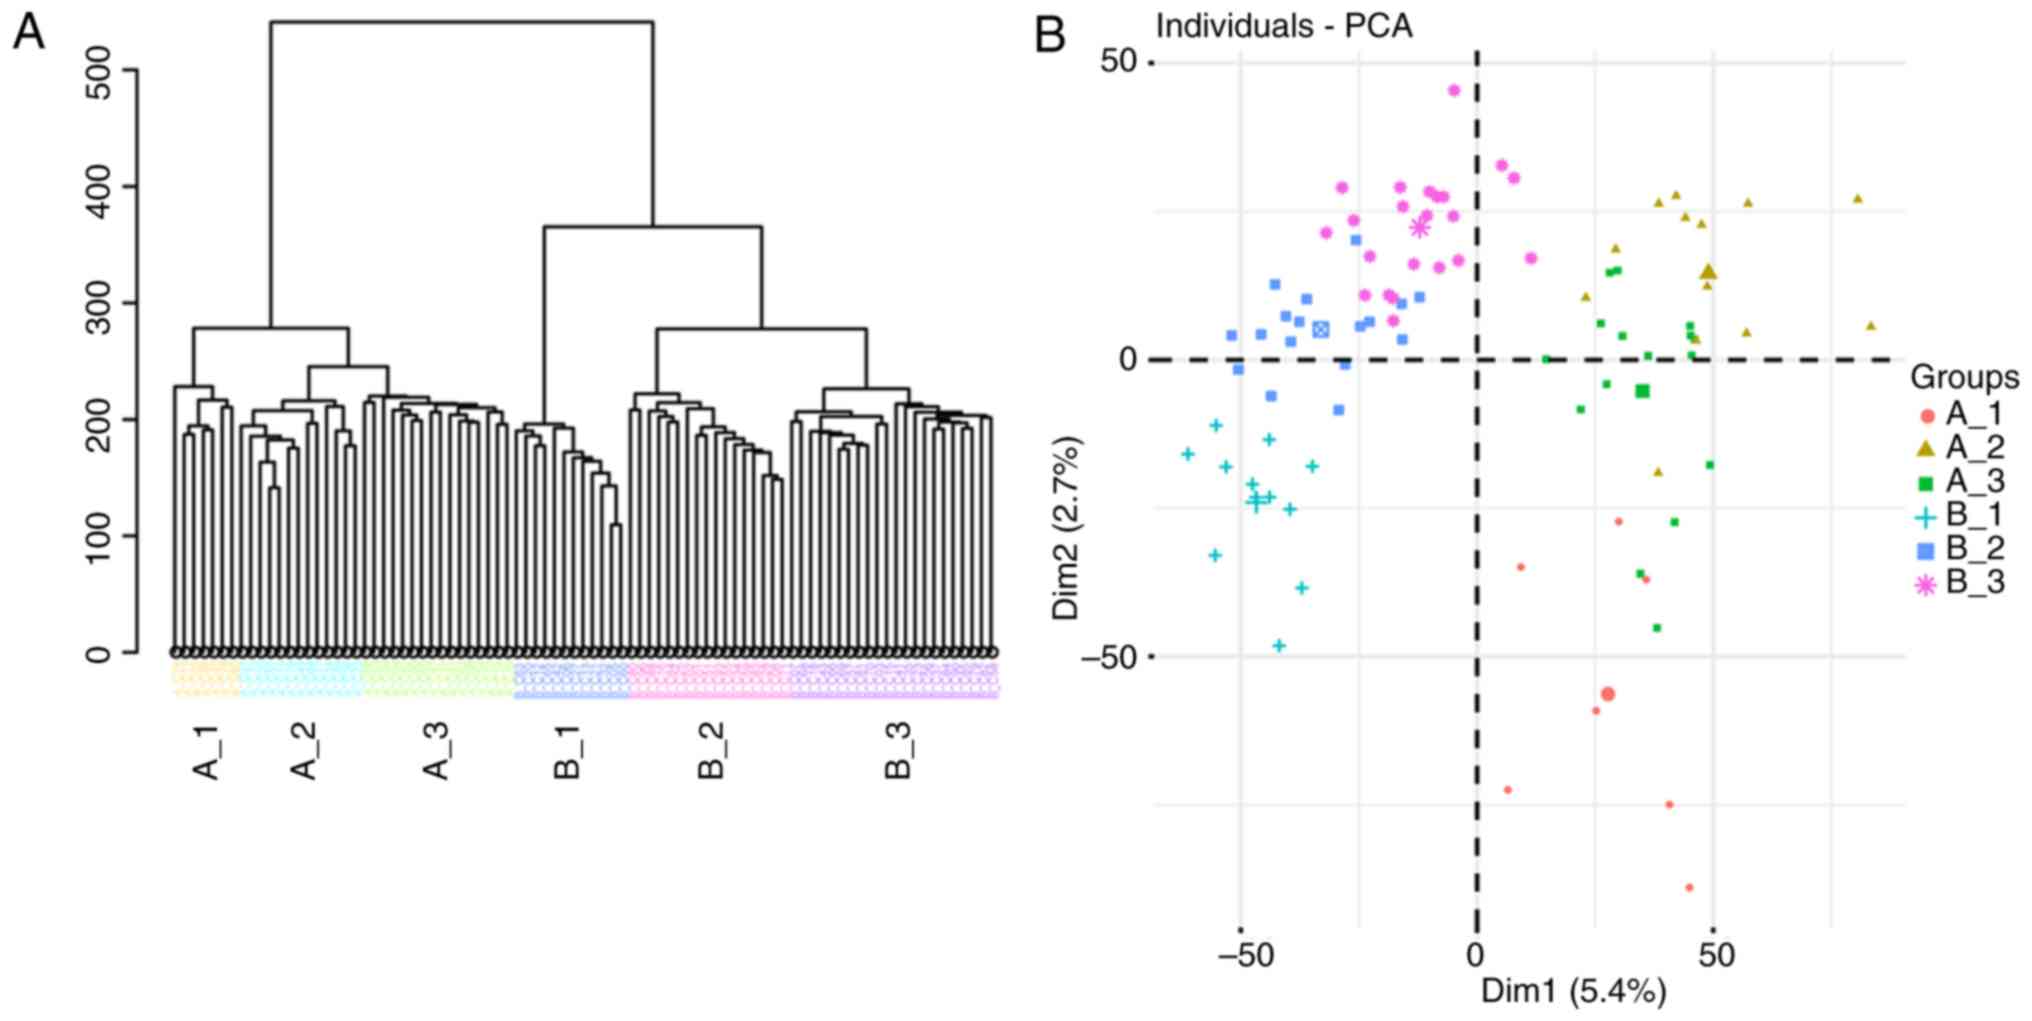
in previous studies (17,18). Hierarchical clustering by ward. D2
linkage distance was used to separate the 87 cells into six groups
(Fig. 1A): Cells from patient A
were divided into three groups (A_1, A_2 and A_3), and cells from
patient B were divided into another three groups (B_1, B_2 and
B_3). As presented in Fig. 1B, the
six groups were crudely separated by PCA, and the genes
contributing to the separation of these subpopulations were
examined using SC3 clustering (19). In total, 2,138 DEGs were detected
(Table SII) and the top 50 DEGs
are presented in Fig. 1C. Among
them, immune-associated genes [major histocompatibility complex,
class II, DR α (HLA-DRA), major histocompatibility complex,
class II, DR β 1, major histocompatibility complex, class I, E and
neural cell adhesion molecule 1] and a DNA methylation-associated
gene [isocitrate dehydrogenase (NADP(+)) 2] were identified; 35
cells (40.2%) in clusters 2, 3 and 5 exhibited upregulation of
these DEGs.
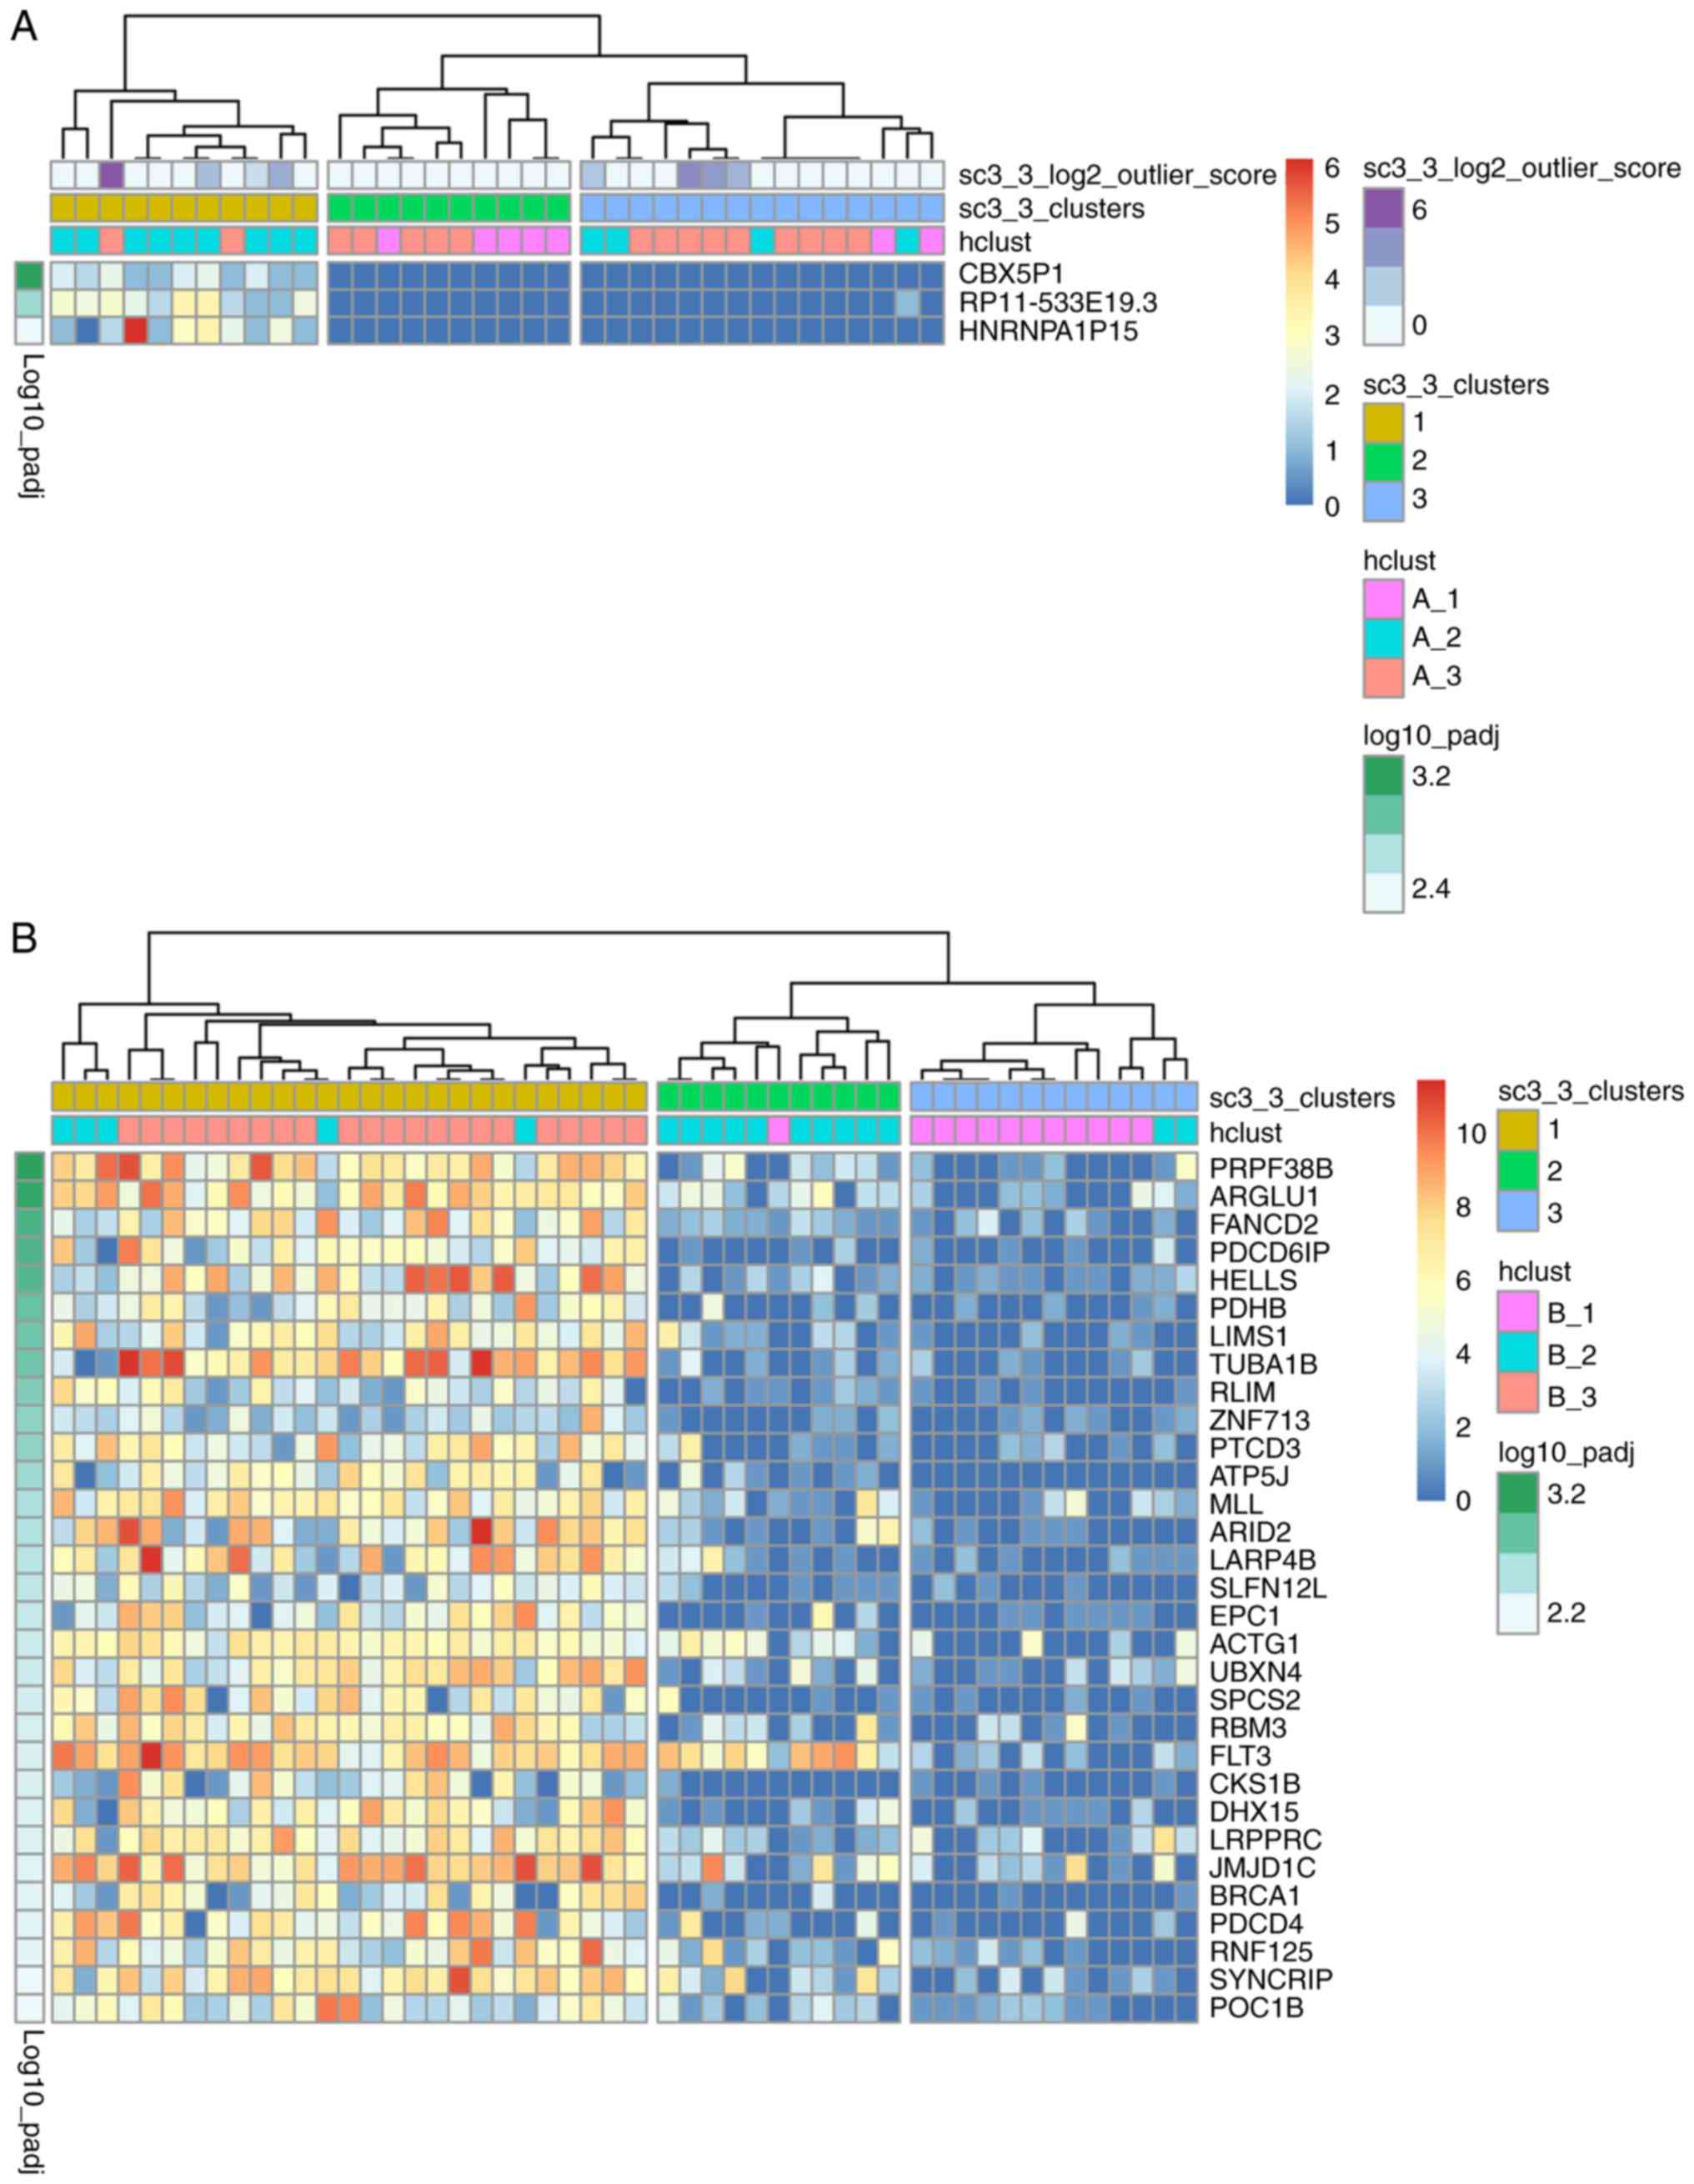
To examine the identity of cells based on the
scRNA-seq data, single-cell consensus clustering (SC3) was
performed (19) using raw read
counts of the cells from both patients. As presented in Fig. 2A, 36 patient A cells were separated
into three groups: The majority of cells in the A_2 group (9 in 13)
were in cluster 1, the majority of the cells in the A_1 group (5 in
7) were in cluster 2, while the cells in the A_3 group were not
evenly distributed in cluster 3 (n=9), cluster 2 (n=5) or cluster 1
(n=2). As shown in Fig. 2B, 51
cells from patient B were separated into 3 groups: The majority of
cells in the B_1 group (11 in 12) were in cluster 3, cluster 2
comprised mainly of cells in the B_2 group, and all cells in the
B_3 group were in cluster 1. The cells were previously separated
into distinct subpopulations using hierarchical clustering
(Fig. 1A), which was highly
consistent with the results of PCA (Fig. 1B). The results of SC3 clustering
(using read counts) were also concordant with those of hierarchical
clustering using log2(TPM/10+1).
Additionally, 3 and 31 DEGs with P<0.01,
corrected for multiple testing using the ‘holm’ method (19), were identified in cells from
patients A and B, respectively. The identified DEGs were
upregulated in 11 of the patient A cells (30.6%) and 27 of the
patient B cells (52.9%) in cluster 1 (Fig. 2A and B, respectively). The 3 DEGs in
the patient A cells were not reported to be associated with AML,
whereas the 31 DEGs in the patient B cells were primarily enriched
in cancer-related functions from a literature review (Table I). There were differences between
the cellular composition and transcription patterns of different
tissues (including BM and PB), which has been previously described
(40). The major subtypes and
proportions of PB mononuclear cells from a healthy donor are
>80% T cells, ~6% NK cells, ~6% B cells and ~7% myeloid cells;
while the major subtypes of BM mononuclear cells (BMMCs) from a
healthy donor are >50% T cells, ~20% B cells, ~10% monocytes and
~20% myeloid cells (40).
Specifically, the level of blast cells and immature erythroids in
the BMMCs of a healthy donor is ~15%; whereas, in patients with AML
this could be 50–80% (40). The
previous study also suggested that cells from BM could predict the
status of patients with AML (40).
Therefore, in the present study, only patient B cells from BM were
used in the following analyses.
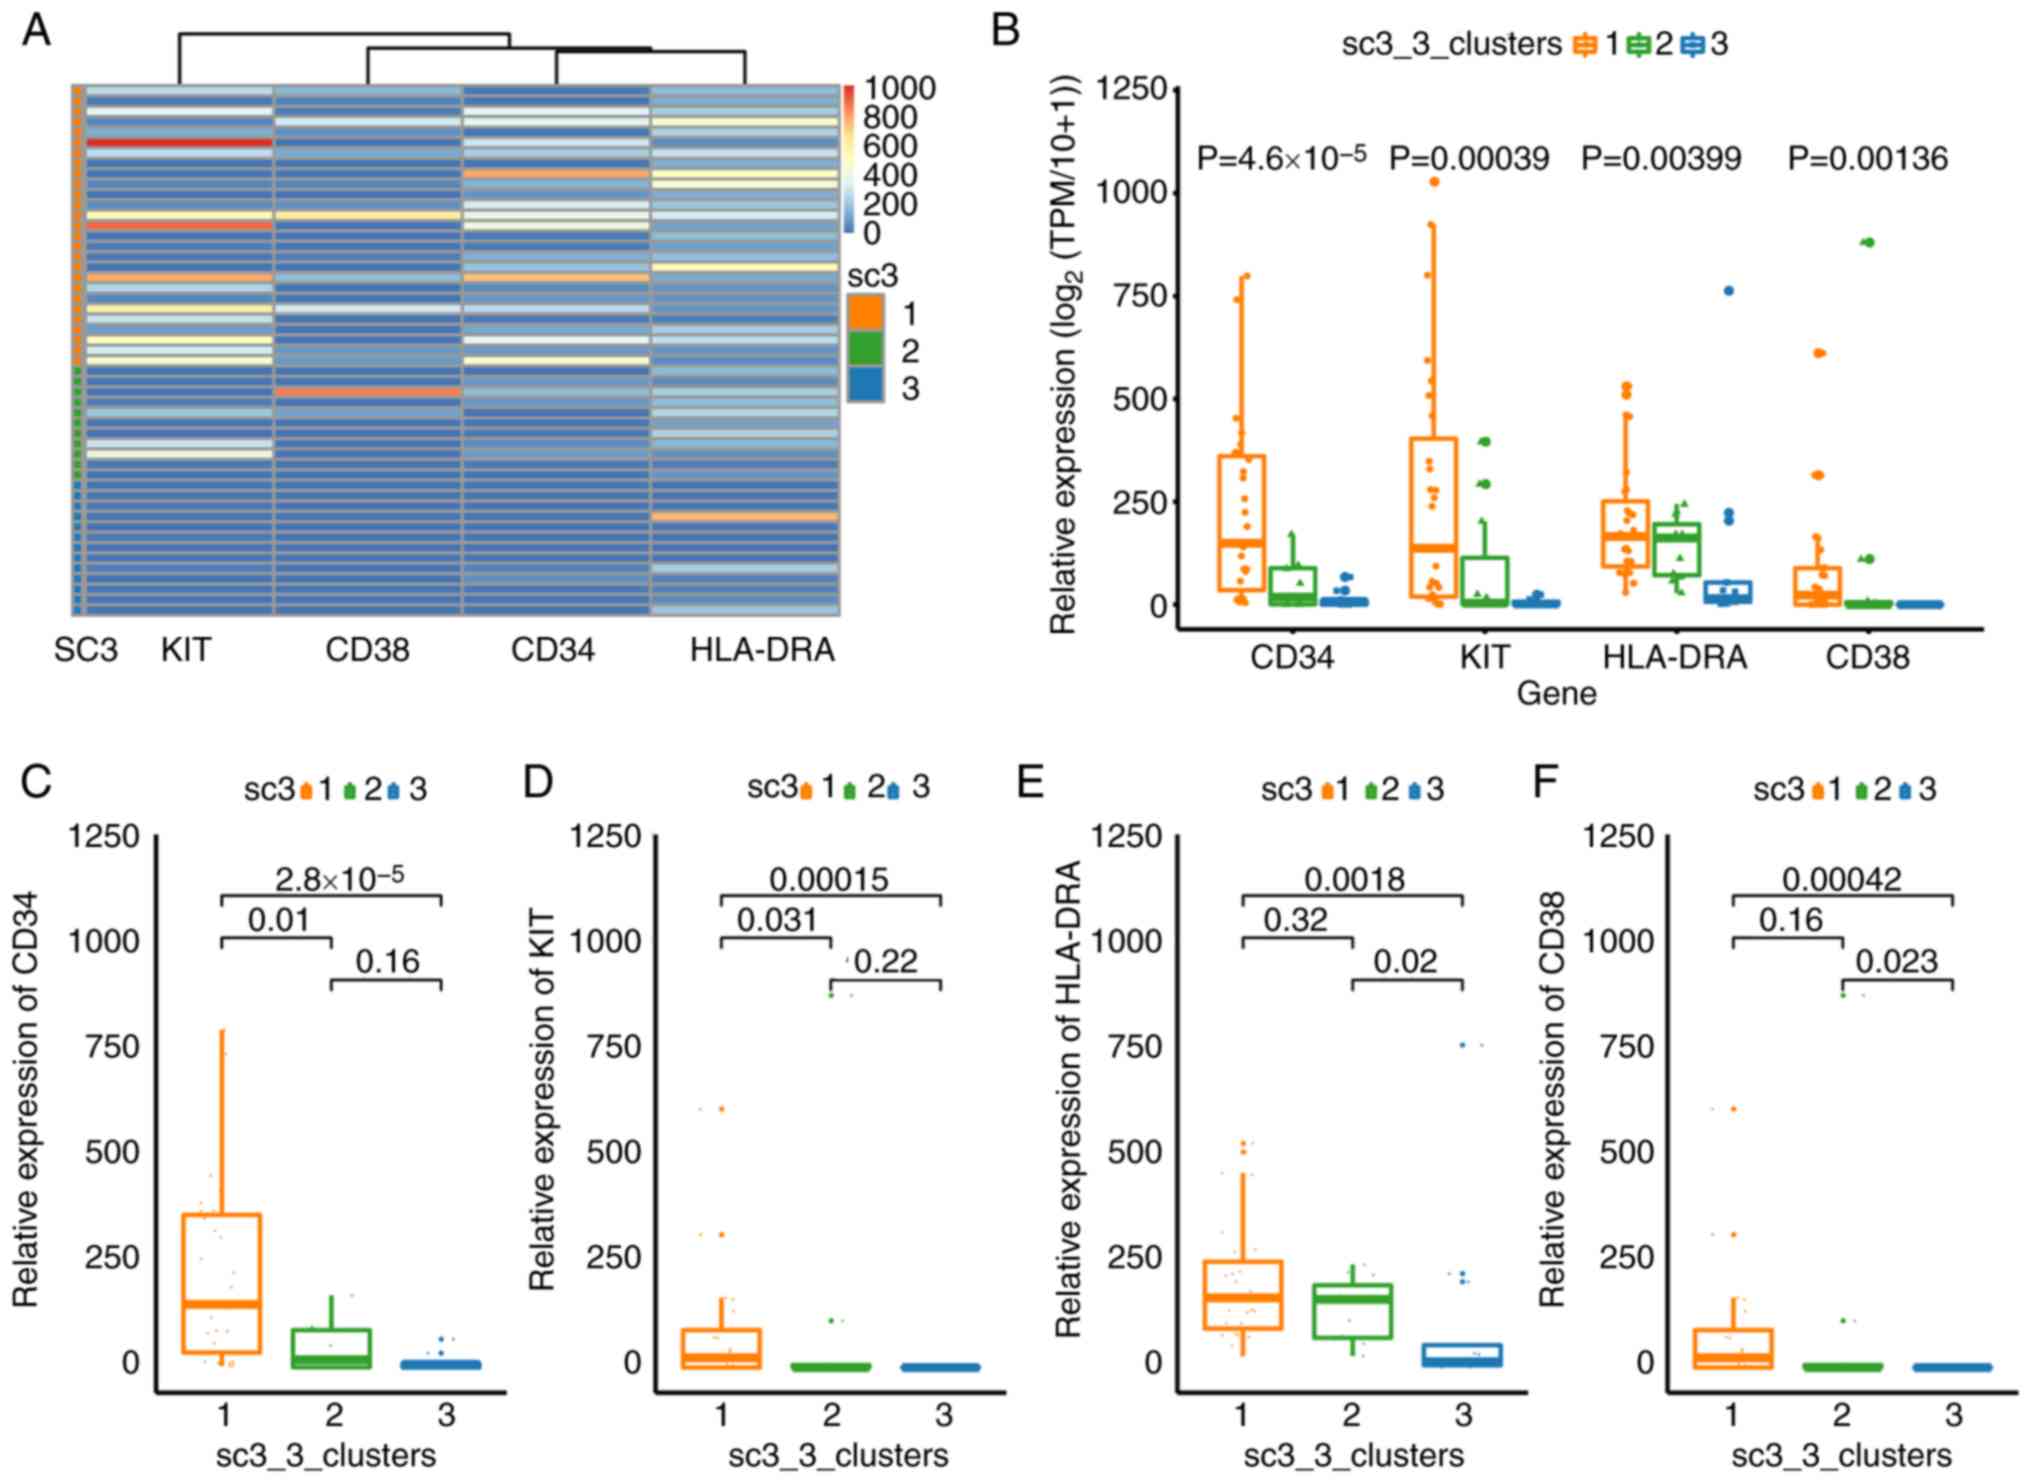
Marker-based classification of cell
subpopulations from patient B
CD34, CD38, mast/stem cell growth factor receptor
Kit (KIT or CD117) and HLA-DRA have been used to sort LSCs or
hematopoietic stem/progenitor cells in different leukemia samples
(41–44). Therefore, these four markers were
selected to broadly classify the cell sub-populations from patient
B. The expression levels of these four markers (Kruskal-Wallis;
P=2.4×10⁻⁸), CD34 (Kruskal-Wallis;
P=4.6×10⁻⁵), KIT (Kruskal-Wallis; P=0.00039), HLA-DRA
(Kruskal-Wallis; P=0.00399) and CD38 (Kruskal-Wallis; P=0.00136)
were significantly different between the cells of three clusters
(Fig. 3B-F). The expression levels
of these four genes were low in the cells of cluster 3, suggesting
an inactive state (Fig. 3A and B).
The expression levels of 31 DEGs in cluster 3 were also low as a
result of SC3 clustering (Fig. 2B).
Cells in cluster 1 expressed high levels of CD34 (Fig. 3C), KIT (Fig. 3D) and HLA-DRA (Fig. 3E), suggesting that these cells were
‘positive blasts’ (44).
Significantly lower expression levels of CD34 and KIT were observed
in cluster 2 compared with cluster 1 (Fig. 3C and D), suggesting that these were
non-leukemic cells. These results not only demonstrate the
functional identities of the cell sub-populations, but also
confirmed the accuracy of SC3 clustering.
Functions and interactions of the 31
DEGs
Numerous genes among the 31 DEGs were associated
with hematological malignancies (Table
II). Internal tandem duplication of receptor-type
tyrosine-protein kinase FLT3 (FLT3) and partial tandem
duplication of lysine methyltransferase 2A (MLL) are the
most common mutations in AML (with frequencies of 30–45% and 5–10%,
respectively, in CN-AML), and are associated with poor therapeutic
outcomes (20,21). Specifically, lymphoid-specific
helicase and enhancer of polycomb homolog 1 were associated with
epigenetic regulation in hematopoiesis (22), ring finger protein, LIM domain
interacting (RLIM) was associated with the ubiquitylation of
AML1-ETO and protein PML-retinoic acid receptor α (23), and programmed cell death 4 was
associated with related signaling pathway (24) in myeloid leukemia. MLL
(KMT2A) was associated with fusions and acute leukemia
(25), and La ribonucleoprotein
domain family member 4B (26),
jumonji domain containing 1C (JMJD1C) (27) and SYNCRIP (28) were associated with LSC self-renewal.
Additionally, FLT3 (29),
DEAH-box helicase 15 (DHX15) (30) and JMJD1C (31) were with risk or survival in acute
leukemia, FANCD2 was associated with drug resistance in
leukemia (32), ARID2 was
associated with hematopoietic stem cell (HSC) function (33), CDC28 protein kinase regulatory
subunit 1B was associated with multiple myeloma (34), EPC1 was associated with the
development of T-cell leukemia (35). Furthermore, the functions or
variations of JMJD1C (31),
RLIM (23) and DHX15
(36) were associated with t(8;21)
AML.
| Table II.A total of 13 differentially
expressed genes were associated with the progression of
leukemia. |
Table II.
A total of 13 differentially
expressed genes were associated with the progression of
leukemia.
| Author, year | Gene symbol | Full name | Role in
leukemia | (Refs.) |
|---|
| Prasad et
al, 2014 | HELLS | Helicase, lymphoid
specific | Specifically
expressed in hematopoietic progenitor cells | (22) |
| Prasad et
al, 2014; Nakahata et al, 2009 | EPC1 | Enhancer of
polycomb homolog 1 | Lowly expressed in
leukemia cells, involved in chromosomal translocation in ALL | (22,35) |
| Kramer et
al, 2008 | RLIM | Ring finger
protein, LIM domain interacting | A substrate of
E3-ligase SIAH-1, contributing to the ubiquitin-dependent
degradation of AML1-ETO and protein PML-retinoic acid receptor α
fusion proteins | (23) |
| Espadinha et
al, 2017 | PDCD4 | Programmed cell
death 4 | A tumor suppressor,
was repressed by phosphorylated STAT5 and microRNA-21 in chronic
myeloid leukemia and AML models | (24) |
| Prasad et
al, 2014; Meyer et al, 2018 | MLL
(KMT2A) | Lysine
methyltransferase 2A | Highly expressed in
the lymphoid lineage, chromosomal rearrangements of MLL are
associated with acute leukemias, and display a bad outcome | (22,25) |
| Zhang et al,
2015 | LARP4B | La
ribonucleoprotein domain family member 4B | Involved in LSC
maintenance, and may regulate the cell cycle of LSCs | (26) |
| Zhu et al,
2016; Chen et al, 2015 | JMJD1C | Jumonji domain
containing 1C | A coactivator for
RUNX1-RUNX1T1, mediates of MLL-AF9- and HOXA9-driven LSC
function | (27,31) |
| Vu et al,
2017 | SYNCRIP | Synaptotagmin
binding interacting cytoplasmic RNA protein | Interacts with MSI2
indirectly, controls the myeloid LSC program | (28) |
| Thiede et
al, 2002; Cheng et al, 2018 | FLT3 | Fms related
tyrosine kinase 3 | Internal tandem
duplication of FLT3 results in the failure of leukemia treatment
and contribute to a poor prognosis; significantly upregulated in
AML and ALL, reduces survival rates | (20,29) |
| Pan et al,
2017; Christen et al, 2019 | DHX15 | DEAH-box helicase
15 | Regulates cell
apoptosis through NF-κB signaling pathway, associated with poor
prognosis in AML, with mutations in t(8;21) AML | (30,36) |
| Yao et al,
2015 | FANCD2 | FA complementation
group D2 | May confer leukemia
resistance to adriamycin via enhanced DNA interstrand crosslink
repair | (32) |
| Liu et al,
2018 | ARID2
(BAF200) | AT-rich interaction
domain 2 | Required for the
maintenance of HSC homeostasis, ARID2 deficiency accelerates the
progression of MLL-AF9-induced leukemia | (33) |
| Walker et
al, 2019 | CKS1B | CDC28 protein
kinase regulatory subunit 1B | Amplification (≥4
copies) of CKS1B was observed in high-risk multiple myeloma | (34) |
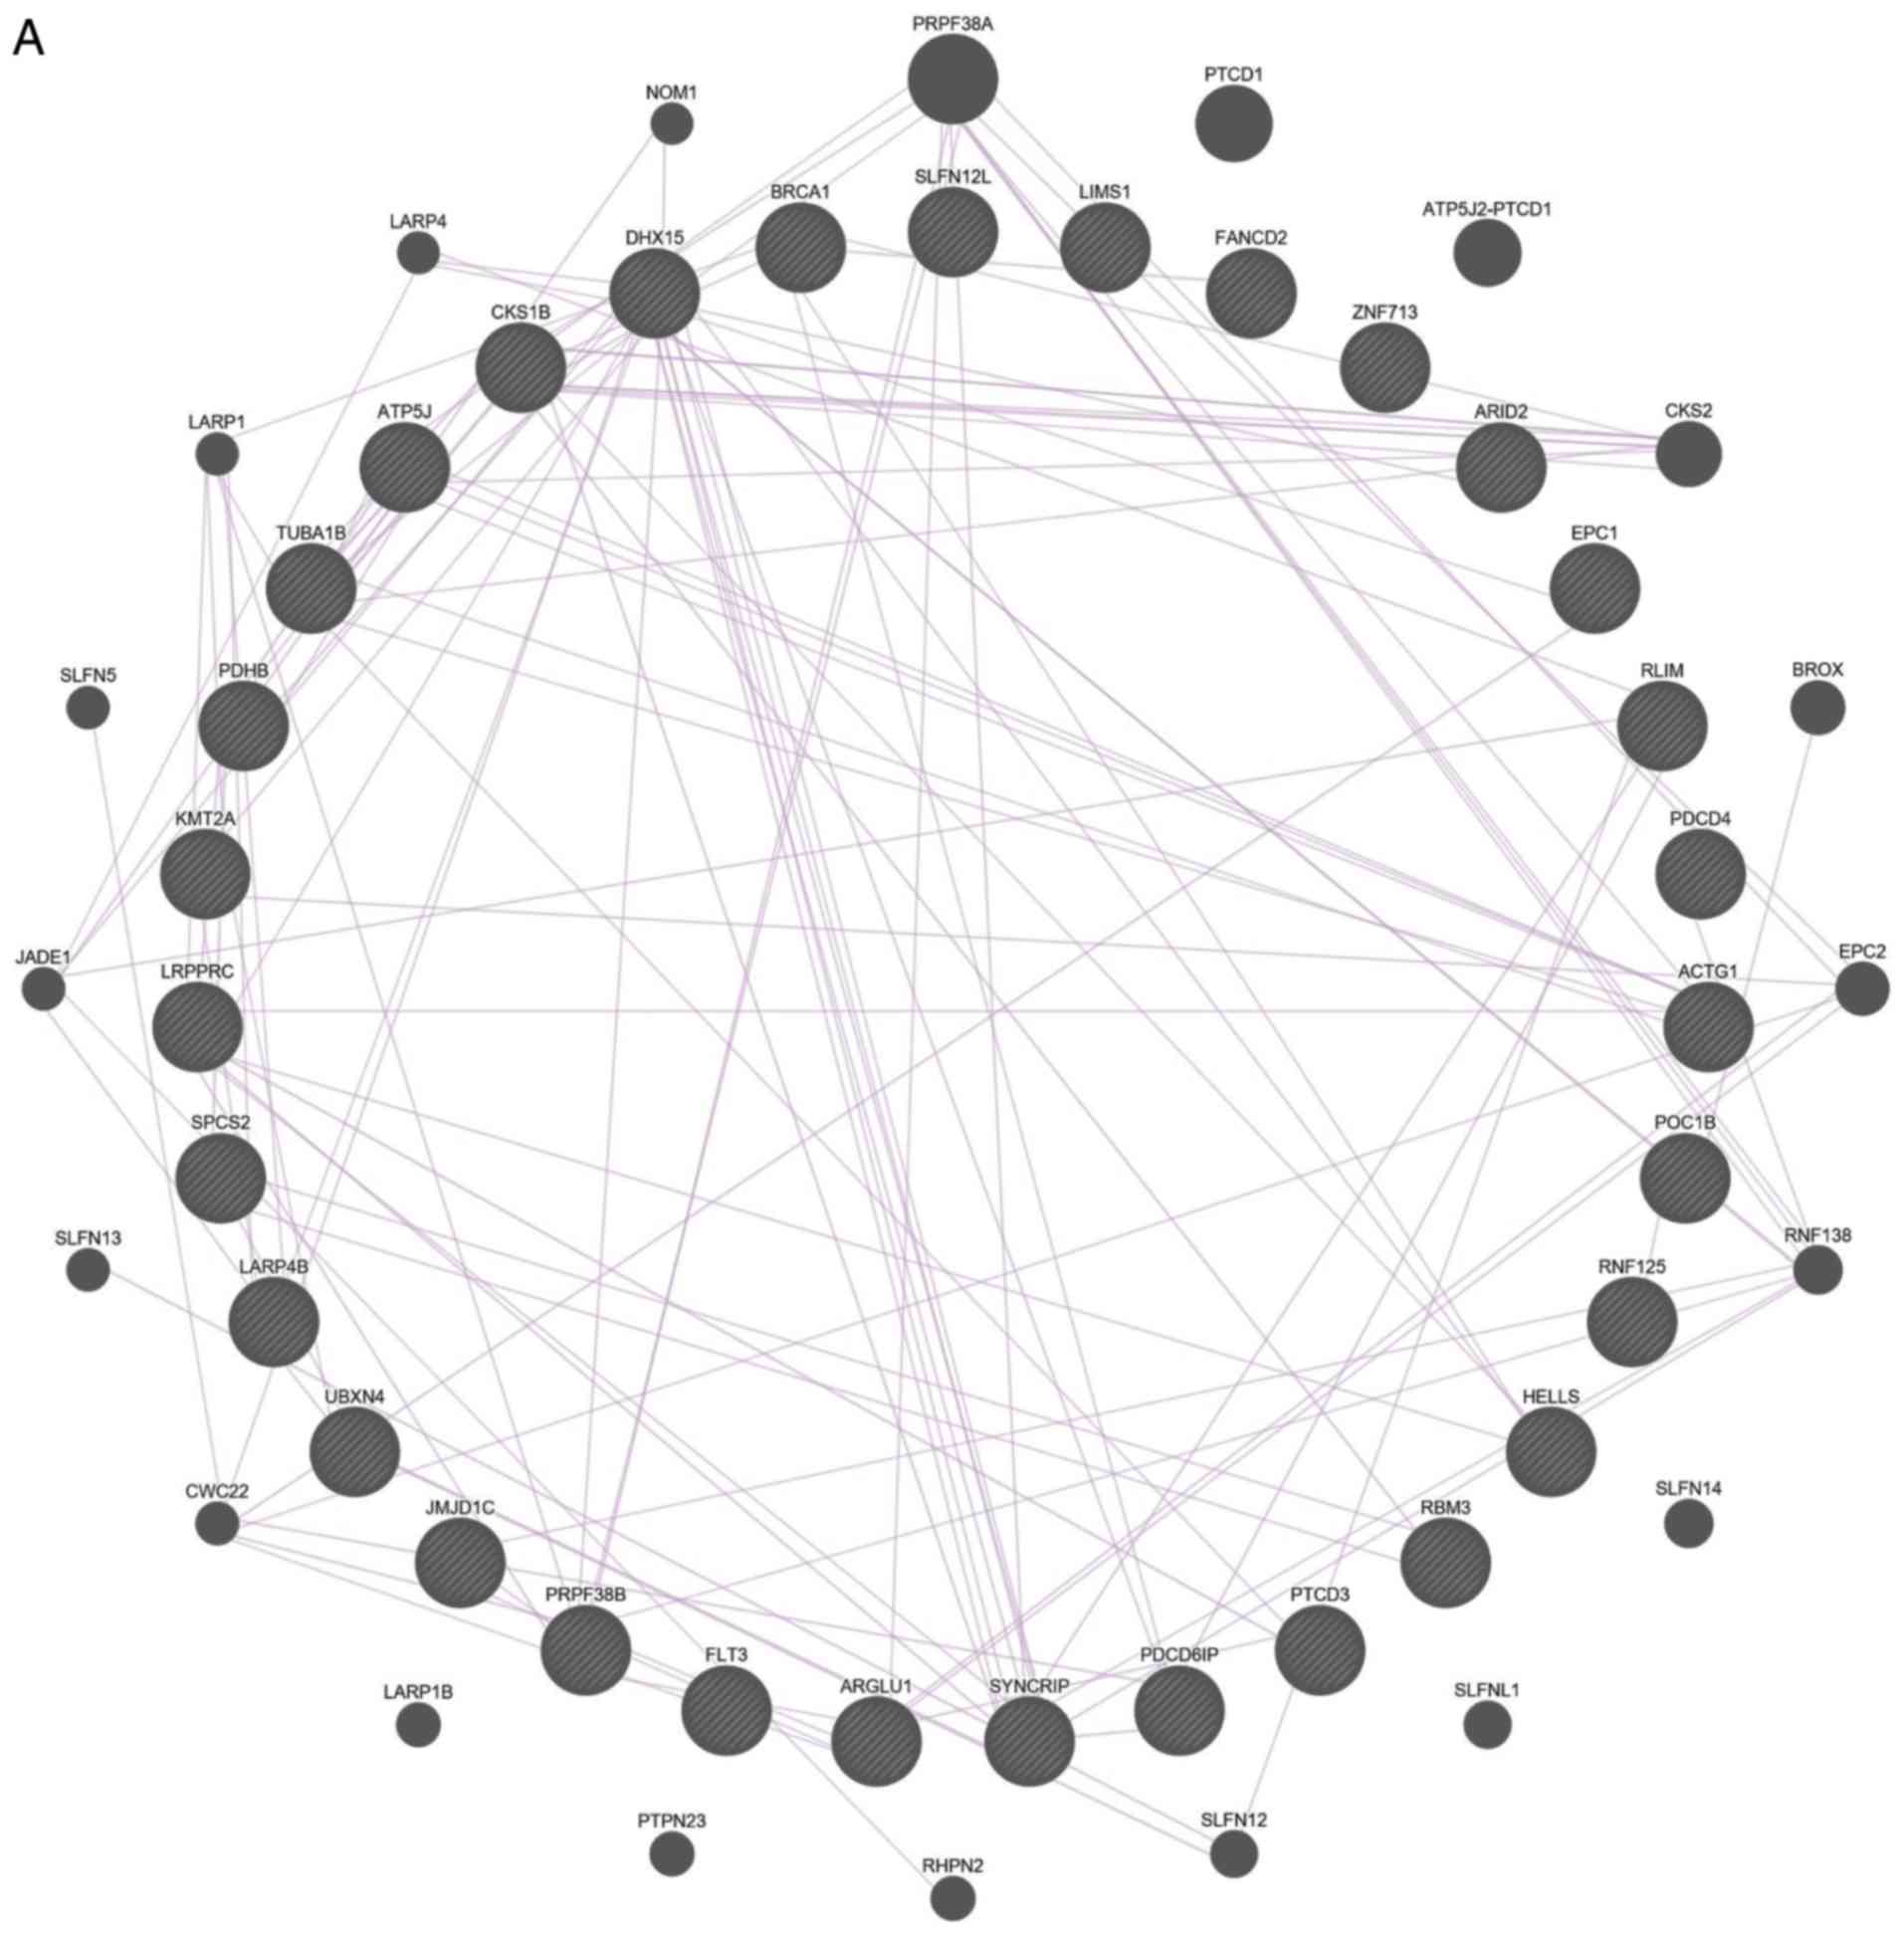
The interactions between these 31 DEGs were also
examined (Fig. 4). The results of
both gene-gene and protein-protein interaction analyses suggested
that the DEGs are functionally related.
Possible biomarkers for rapid
prediction of prognostic risk in t(8;21) AML
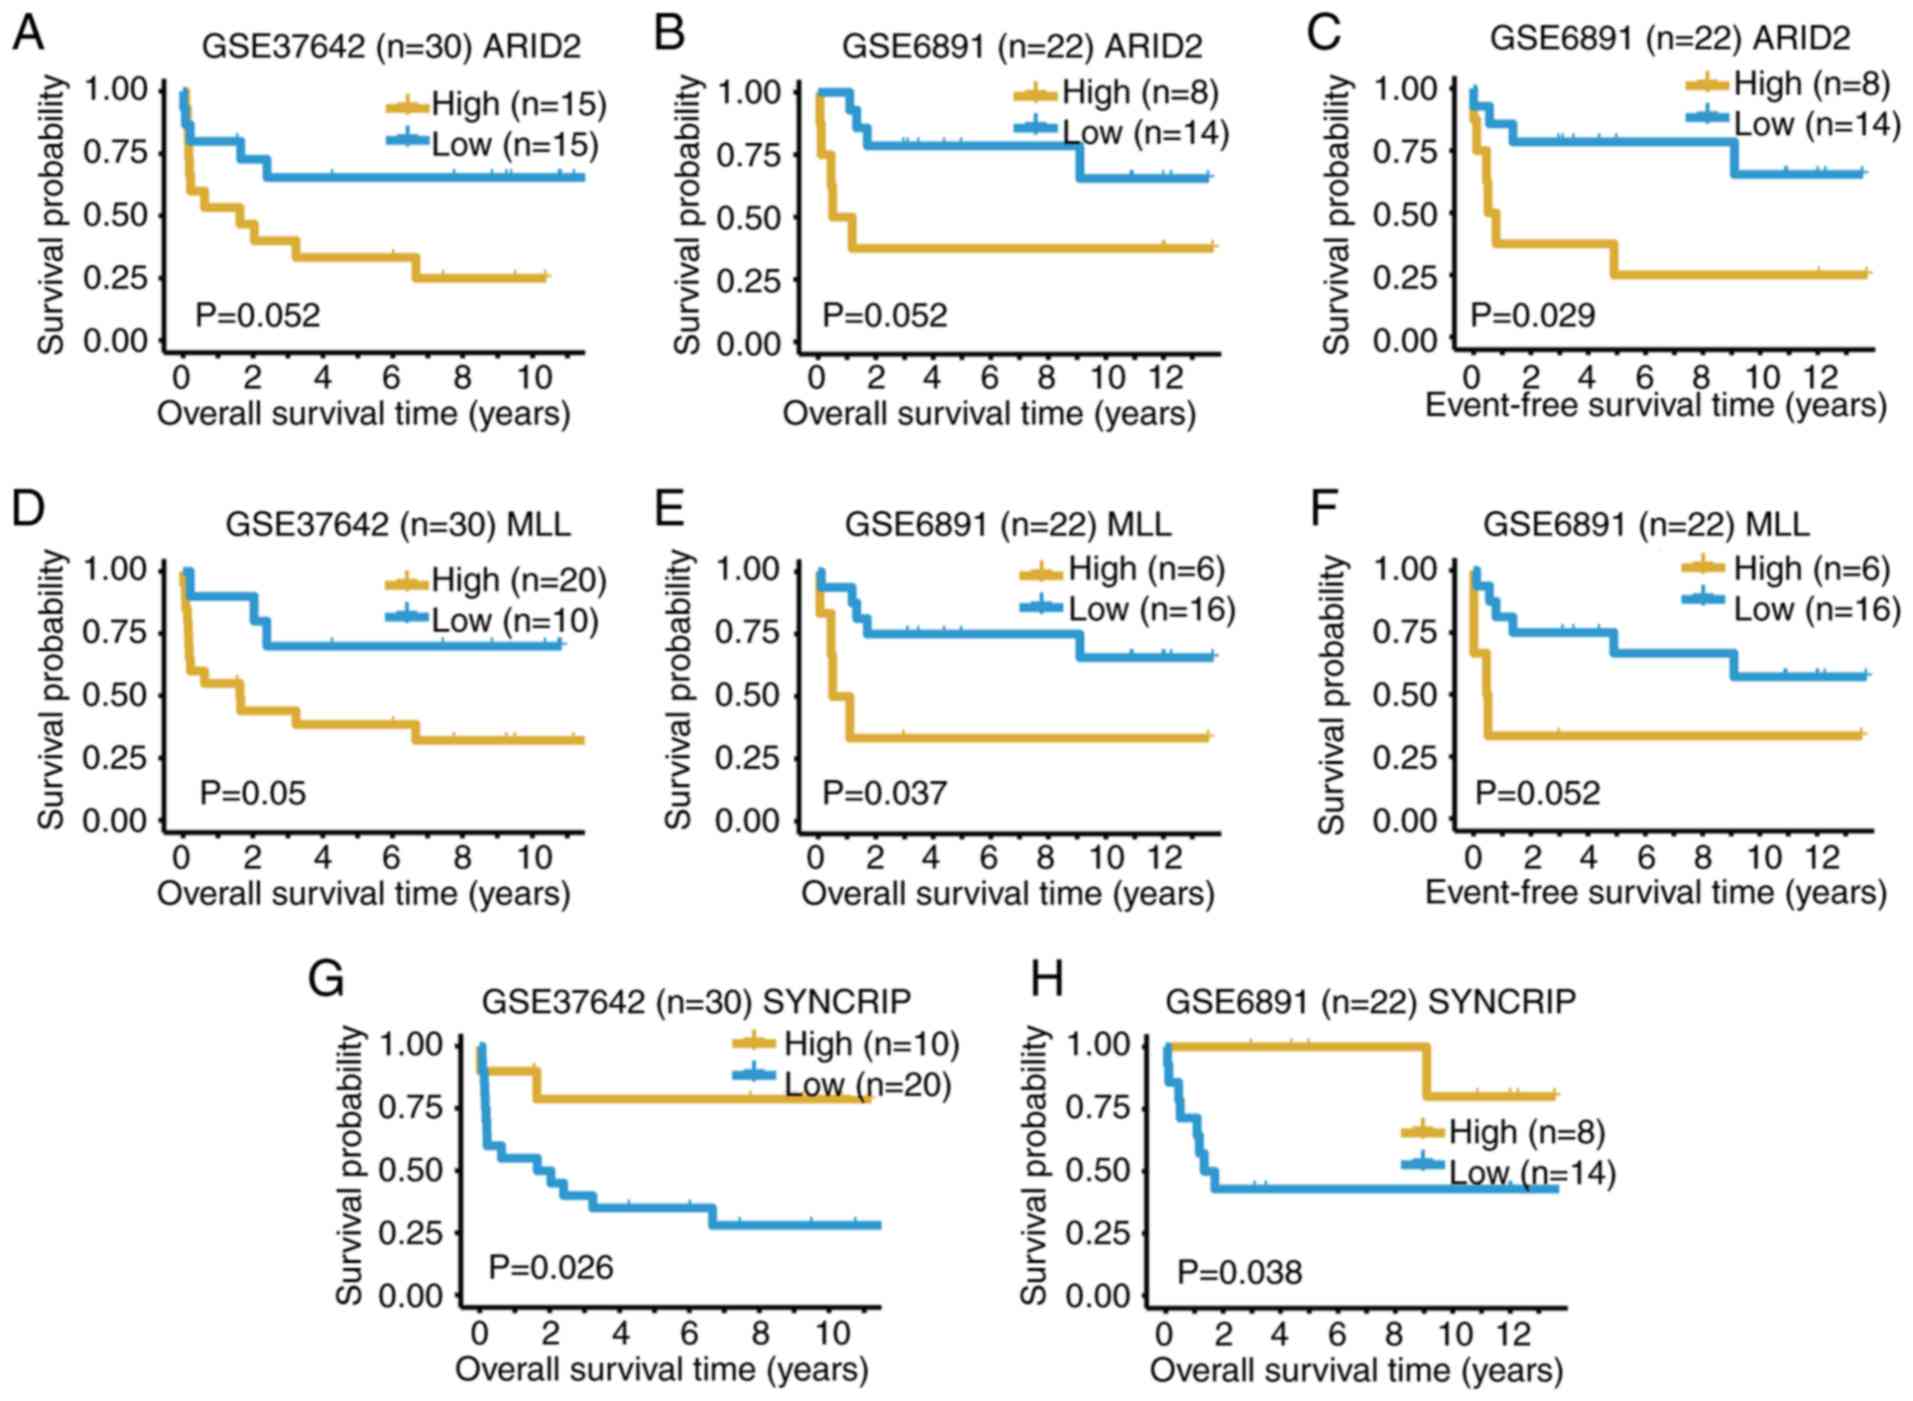
Potential prognostic biomarkers from the 31 DEGs of
the patient B cells were investigated, which included the DEGs
between ‘positive blasts’ and other cells. The dataset GSE6891
(8), containing both the overall
survival (OS) and event-free survival information of 22 patients
with t(8;21) AML, and the dataset GSE37642 (9) with the OS information of 30 patients
with t(8;21) AML, were selected to determine the prognostic
significance of the identified DEGs. The expression values of
ARID2, MLL and SYNCRIP could predict the OS outcomes
of patients with t(8;21) AML in both datasets with P≤0.052
(Fig. 5). High expression levels of
ARID2 and MLL indicate a poor outcome, whilst high
expression of SYNCRIP suggests a more favorable outcome
(Fig. 5). The expression values of
various genes in either dataset GSE37642 (Fig. S4) or GSE6891 (Fig. S5) could also predict the OS
outcomes of t(8;21) AML. In summary, the present results from the
two bulk expression datasets supported the conclusions from the
scRNA-seq data.
Discussion
scRNA-seq of AML undergoing allogeneic HSCT has been
previously conducted (40);
however, to the best of the authors' knowledge, investigations into
the malignant development of t(8;21) AML are limited. In the
present pilot study, the single-cell transcriptomes of two patients
with t(8;21) AML were profiled, and the cells were separated into
sub-populations with different gene expression patterns.
Among the 31 identified DEGs in cells from patient B
(the treatment outcome for whom was poor), several genes were
identified to be associated with leukemia; the prognostic
significance of three of these genes, ARID2, MLL and
SYNCRIP, was validated in two t(8;21) AML datasets.
ARID2 is a tumor repressor that plays important roles in the
maintenance of HSC homeostasis, and ARID2 deficiency
accelerates the progression of MLL-protein AF-9-induced leukemia
(33). Chromosomal rearrangements
of MLL are associated with acute leukemia, and subsequently
result in poor patient outcome (25). Together with musashi RNA binding
protein 2 indirectly, SYNCRIP regulates the myeloid LSC
program, and is required for the survival of leukemia cells
(28). The prognostic significance
of ARID2 and MLL determined in the present study are
consistent with those presented in the literature (25,33),
while that of SYNCRIP was the opposite, which may due to the
tissue difference and requires further validation in the future.
Furthermore, the functional and prognostic significance of the
other various genes require future experimental clarification.
scRNA-seq is a powerful technology that is
frequently used in cancer research, and the flow cytometric
targeting of cell surface antigens has been used to isolate tumor
cells in a number of previous studies (17,45).
In the present study, the presence of ‘positive blasts’ was
predicted using marker genes as indicated in a previous study
(44). Different gene-based
stemness scores have been developed to determine the risk of AML.
The weighted sum of a subset of LSC-related genes has been used to
determine the prognosis for AML in a number of previous studies,
and a sufficient number of datasets and samples were used for
training and validation. However, the LSC-related scores only
perform well in CN-AML (2,3). In the present study, three prognostic
biomarkers were identified in AML with an abnormal chromosomal
karyotype. This differs from previous studies (2,3); the
candidate genes were analyzed from the high-throughput sequencing
data of single cells, rather than selected from microarray
expression data of bulk cells, and the biomarkers in the present
study are applicable to AML with a t(8;21) translocation.
There are some limitations to the present pilot
study. Besides second relapse, the BM samples at other time points,
such as new diagnosis, first relapse and after HSCT, were not
collected from patient B and the patient has subsequently died.
Therefore, it was not possible to track the clonal evolution of
t(8;21) AML by taking advantage of scRNA-seq in the present study.
A larger number of patients at different disease progression
stages, and a larger number of collected cells may better
illustrate the clonal evolution and development of t(8;21) AML.
Additionally, due to the availability of resources, the dataset
used for biomarker validation was not very large. Specific genomic
variations, such as single nucleotide variants (40) and copy number variants (17), may be inferred in the assistance of
genomic sequencing methods in future work. The present study
provided evidence that scRNA-seq plays an important role in the
study of t(8;21) AML and suggested that strategies promoting
scRNA-seq may be valuable techniques for hematological malignancy
therapy.
Supplementary Material
Supporting Data
Supporting Data
Supporting Data
Acknowledgements
Not applicable.
Funding
The present study was supported by The National
Natural Science Fund (grant. no. 81670162), The PLA General
Hospital Science and Technology Project (grant. no. 18KMM01) and
Beijing Natural Science Foundation (grant. no. 7204305).
Availability of data and materials
The datasets analyzed in the current study are
available from the corresponding author upon reasonable
request.
Authors' contributions
LY, MQZ, YC, YZ, YHL, SH and NL designed the
research. SH collected clinical samples and clinical information,
and contributed to the acquisition of data. YC and LS performed
single-cell RNA sequencing. QX, BLZ, LS and SHL analyzed the
sequencing data. CL, YD, WWL and LLW performed the reverse
transcription-PCR experiments. QX and SH drafted the manuscript.
LY, BLZ, MQZ and YHL provided valuable advice and also critically
revised the manuscript. All authors read and approved the final
manuscript.
Ethics approval and consent to
participate
The present study was approved by The Institutional
Review Board of Chinese PLA General Hospital, and all patients
provided signed informed consent for the collection of specimens
and detailed analyses of the derived genetic material.
Patient consent for publication
Not applicable.
Competing interests
The authors declare that they have no competing
interests.
References
|
1
|
Hope KJ, Jin L and Dick JE: Acute myeloid
leukemia originates from a hierarchy of leukemic stem cell classes
that differ in self-renewal capacity. Nat Immunol. 5:738–743. 2004.
View Article : Google Scholar : PubMed/NCBI
|
|
2
|
Gentles AJ, Plevritis SK, Majeti R and
Alizadeh AA: Association of a leukemic stem cell gene expression
signature with clinical outcomes in acute myeloid leukemia. JAMA.
304:2706–2715. 2010. View Article : Google Scholar : PubMed/NCBI
|
|
3
|
Ng SW, Mitchell A, Kennedy JA, Chen WC,
McLeod J, Ibrahimova N, Arruda A, Popescu A, Gupta V, Schimmer AD,
et al: A 17-gene stemness score for rapid determination of risk in
acute leukaemia. Nature. 540:433–437. 2016. View Article : Google Scholar : PubMed/NCBI
|
|
4
|
Licht JD: AML1 and the AML1-ETO fusion
protein in the pathogenesis of t(8;21) AML. Oncogene. 20:5660–5679.
2001. View Article : Google Scholar : PubMed/NCBI
|
|
5
|
Huang S, Jiang MM, Chen GF, Qian K, Gao
HH, Guan W, Shi JL, Liu AQ, Liu J, Wang BH, et al: Epigenetic
silencing of eyes absent 4 gene by acute myeloid leukemia
1-eight-twenty-one oncoprotein contributes to leukemogenesis in
t(8;21) acute myeloid leukemia. Chin Med J (Engl). 129:1355–1362.
2016. View Article : Google Scholar : PubMed/NCBI
|
|
6
|
Reikvam H, Hatfield KJ, Kittang AO,
Hovland R and Bruserud O: Acute myeloid leukemia with the t(8;21)
translocation: Clinical consequences and biological implications. J
Biomed Biotechnol. 2011:1046312011. View Article : Google Scholar : PubMed/NCBI
|
|
7
|
Wu AR, Neff NF, Kalisky T, Dalerba P,
Treutlein B, Rothenberg ME, Mburu FM, Mantalas GL, Sim S, Clarke MF
and Quake SR: Quantitative assessment of single-cell RNA-sequencing
methods. Nat Methods. 11:41–46. 2014. View Article : Google Scholar : PubMed/NCBI
|
|
8
|
Verhaak RG, Wouters BJ, Erpelinck CA,
Abbas S, Beverloo HB, Lugthart S, Lowenberg B, Delwel R and Valk
PJ: Prediction of molecular subtypes in acute myeloid leukemia
based on gene expression profiling. Haematologica. 94:131–134.
2009. View Article : Google Scholar : PubMed/NCBI
|
|
9
|
Li Z, Herold T, He C, Valk PJ, Chen P,
Jurinovic V, Mansmann U, Radmacher MD, Maharry KS, Sun M, et al:
Identification of a 24-gene prognostic signature that improves the
European LeukemiaNet risk classification of acute myeloid leukemia:
An international collaborative study. J Clin Oncol. 31:1172–1181.
2013. View Article : Google Scholar : PubMed/NCBI
|
|
10
|
Wang B, Liu Y, Hou G, Wang L, Lv N, Xu Y,
Xu Y, Wang X, Xuan Z, Jing Y, et al: Mutational spectrum and risk
stratification of intermediate-risk acute myeloid leukemia patients
based on next-generation sequencing. Oncotarget. 7:32065–32078.
2016.PubMed/NCBI
|
|
11
|
Pollen AA, Nowakowski TJ, Shuga J, Wang X,
Leyrat AA, Lui JH, Li N, Szpankowski L, Fowler B, Chen P, et al:
Low-coverage single-cell mRNA sequencing reveals cellular
heterogeneity and activated signaling pathways in developing
cerebral cortex. Nat Biotechnol. 32:1053–1058. 2014. View Article : Google Scholar : PubMed/NCBI
|
|
12
|
Dobin A, Davis CA, Schlesinger F, Drenkow
J, Zaleski C, Jha S, Batut P, Chaisson M and Gingeras TR: STAR:
Ultrafast universal RNA-seq aligner. Bioinformatics. 29:15–21.
2013. View Article : Google Scholar : PubMed/NCBI
|
|
13
|
Kumar S, Vo AD, Qin F and Li H:
Comparative assessment of methods for the fusion transcripts
detection from RNA-Seq data. Sci Rep. 6:215972016. View Article : Google Scholar : PubMed/NCBI
|
|
14
|
Livak KJ and Schmittgen TD: Analysis of
relative gene expression data using real-time quantitative PCR and
the 2(-Delta Delta C(T)) method. Methods. 25:402–408. 2001.
View Article : Google Scholar : PubMed/NCBI
|
|
15
|
Bray NL, Pimentel H, Melsted P and Pachter
L: Near-optimal probabilistic RNA-seq quantification. Nat
Biotechnol. 34:525–527. 2016. View Article : Google Scholar : PubMed/NCBI
|
|
16
|
Emig D, Salomonis N, Baumbach J, Lengauer
T, Conklin BR and Albrecht M: AltAnalyze and DomainGraph: Analyzing
and visualizing exon expression data. Nucleic Acids Res. 38((Web
Server Issue)): W755–W762. 2010. View Article : Google Scholar : PubMed/NCBI
|
|
17
|
Puram SV, Tirosh I, Parikh AS, Patel AP,
Yizhak K, Gillespie S, Rodman C, Luo CL, Mroz EA, Emerick KS, et
al: Single-cell transcriptomic analysis of primary and metastatic
tumor ecosystems in head and neck cancer. Cell. 171:1611–1624 e24.
2017. View Article : Google Scholar : PubMed/NCBI
|
|
18
|
Kim C, Gao R, Sei E, Brandt R, Hartman J,
Hatschek T, Crosetto N, Foukakis T and Navin NE: Chemoresistance
evolution in triple-negative breast cancer delineated by
single-cell sequencing. Cell. 173:879–893 e13. 2018. View Article : Google Scholar : PubMed/NCBI
|
|
19
|
Kiselev VY, Kirschner K, Schaub MT,
Andrews T, Yiu A, Chandra T, Natarajan KN, Reik W, Barahona M,
Green AR and Hemberg M: SC3: Consensus clustering of single-cell
RNA-seq data. Nat Methods. 14:483–486. 2017. View Article : Google Scholar : PubMed/NCBI
|
|
20
|
Thiede C, Steudel C, Mohr B, Schaich M,
Schakel U, Platzbecker U, Wermke M, Bornhauser M, Ritter M,
Neubauer A, et al: Analysis of FLT3-activating mutations in 979
patients with acute myelogenous leukemia: Association with FAB
subtypes and identification of subgroups with poor prognosis.
Blood. 99:4326–4335. 2002. View Article : Google Scholar : PubMed/NCBI
|
|
21
|
Basecke J, Whelan JT, Griesinger F and
Bertrand FE: The MLL partial tandem duplication in acute myeloid
leukaemia. Br J Haematol. 135:438–449. 2006. View Article : Google Scholar : PubMed/NCBI
|
|
22
|
Prasad P, Rönnerblad M, Arner E, Itoh M,
Kawaji H, Lassmann T, Daub CO, Forrest AR, Lennartsson A and Ekwall
K; FANTOM consortium, : High-throughput transcription profiling
identifies putative epigenetic regulators of hematopoiesis. Blood.
123:e46–e57. 2014. View Article : Google Scholar : PubMed/NCBI
|
|
23
|
Kramer OH, Muller S, Buchwald M, Reichardt
S and Heinzel T: Mechanism for ubiquitylation of the leukemia
fusion proteins AML1-ETO and PML-RARalpha. FASEB J. 22:1369–1379.
2008. View Article : Google Scholar : PubMed/NCBI
|
|
24
|
Espadinha AS, Prouzet-Mauleon V, Claverol
S, Lagarde V, Bonneu M, Mahon FX and Cardinaud B: A tyrosine
kinase-STAT5-miR21-PDCD4 regulatory axis in chronic and acute
myeloid leukemia cells. Oncotarget. 8:76174–76188. 2017. View Article : Google Scholar : PubMed/NCBI
|
|
25
|
Meyer C, Burmeister T, Groger D, Tsaur G,
Fechina L, Renneville A, Sutton R, Venn NC, Emerenciano M,
Pombo-de-Oliveira MS, et al: The MLL recombinome of acute leukemias
in 2017. Leukemia. 32:273–284. 2018. View Article : Google Scholar : PubMed/NCBI
|
|
26
|
Zhang Y, Peng L, Hu T, Wan Y, Ren Y, Zhang
J, Wang X, Zhou Y, Yuan W, Wang Q, et al: La-related protein 4B
maintains murine MLL-AF9 leukemia stem cell self-renewal by
regulating cell cycle progression. Exp Hematol. 43:309–318 e2.
2015. View Article : Google Scholar : PubMed/NCBI
|
|
27
|
Zhu N, Chen M, Eng R, DeJong J, Sinha AU,
Rahnamay NF, Koche R, Al-Shahrour F, Minehart JC, Chen CW, et al:
MLL-AF9- and HOXA9-mediated acute myeloid leukemia stem cell
self-renewal requires JMJD1C. J Clin Invest. 126:997–1011. 2016.
View Article : Google Scholar : PubMed/NCBI
|
|
28
|
Vu LP, Prieto C, Amin EM, Chhangawala S,
Krivtsov A, Calvo-Vidal MN, Chou T, Chow A, Minuesa G, Park SM, et
al: Functional screen of MSI2 interactors identifies an essential
role for SYNCRIP in myeloid leukemia stem cells. Nat Genet.
49:866–875. 2017. View Article : Google Scholar : PubMed/NCBI
|
|
29
|
Cheng J, Qu L, Wang J, Cheng L and Wang Y:
High expression of FLT3 is a risk factor in leukemia. Mol Med Rep.
17:2885–2892. 2018.PubMed/NCBI
|
|
30
|
Pan L, Li Y, Zhang HY, Zheng Y, Liu XL, Hu
Z, Wang Y, Wang J, Cai YH, Liu Q, et al: DHX15 is associated with
poor prognosis in acute myeloid leukemia (AML) and regulates cell
apoptosis via the NF-kB signaling pathway. Oncotarget.
8:89643–89654. 2017. View Article : Google Scholar : PubMed/NCBI
|
|
31
|
Chen M, Zhu N, Liu X, Laurent B, Tang Z,
Eng R, Shi Y, Armstrong SA and Roeder RG: JMJD1C is required for
the survival of acute myeloid leukemia by functioning as a
coactivator for key transcription factors. Genes Dev. 29:2123–2139.
2015. View Article : Google Scholar : PubMed/NCBI
|
|
32
|
Yao C, Du W, Chen H, Xiao S, Huang L and
Chen FP: Involvement of Fanconi anemia genes FANCD2 and FANCF in
the molecular basis of drug resistance in leukemia. Mol Med Rep.
11:4605–4610. 2015. View Article : Google Scholar : PubMed/NCBI
|
|
33
|
Liu L, Wan X, Zhou P, Zhou X, Zhang W, Hui
X, Yuan X, Ding X, Zhu R, Meng G, et al: The chromatin remodeling
subunit Baf200 promotes normal hematopoiesis and inhibits
leukemogenesis. J Hematol Oncol. 11:272018. View Article : Google Scholar : PubMed/NCBI
|
|
34
|
Walker BA, Mavrommatis K, Wardell CP,
Ashby TC, Bauer M, Davies F, Rosenthal A, Wang H, Qu P, Hoering A,
et al: A high-risk, Double-Hit, group of newly diagnosed myeloma
identified by genomic analysis. Leukemia. 33:159–170. 2019.
View Article : Google Scholar : PubMed/NCBI
|
|
35
|
Nakahata S, Saito Y, Hamasaki M, Hidaka T,
Arai Y, Taki T, Taniwaki M and Morishita K: Alteration of enhancer
of polycomb 1 at 10p11.2 is one of the genetic events leading to
development of adult T-cell leukemia/lymphoma. Genes Chromosomes
Cancer. 48:768–776. 2009. View Article : Google Scholar : PubMed/NCBI
|
|
36
|
Christen F, Hoyer K, Yoshida K, Hou HA,
Waldhueter N, Heuser M, Hills RK, Chan W, Hablesreiter R, Blau O,
et al: Genomic landscape and clonal evolution of acute myeloid
leukemia with t(8;21): An international study on 331 patients.
Blood. 133:1140–1151. 2019. View Article : Google Scholar : PubMed/NCBI
|
|
37
|
Mostafavi S, Ray D, Warde-Farley D,
Grouios C and Morris Q: GeneMANIA: A real-time multiple association
network integration algorithm for predicting gene function. Genome
Biol. 9 (Suppl 1):S42008. View Article : Google Scholar : PubMed/NCBI
|
|
38
|
Szklarczyk D, Morris JH, Cook H, Kuhn M,
Wyder S, Simonovic M, Santos A, Doncheva NT, Roth A, Bork P, et al:
The STRING database in 2017: Quality-controlled protein-protein
association networks, made broadly accessible. Nucleic Acids Res.
45(D1): D362–D368. 2017. View Article : Google Scholar : PubMed/NCBI
|
|
39
|
Davis S and Meltzer PS: GEOquery: A bridge
between the gene expression omnibus (GEO) and BioConductor.
Bioinformatics. 23:1846–1847. 2007. View Article : Google Scholar : PubMed/NCBI
|
|
40
|
Zheng GX, Terry JM, Belgrader P, Ryvkin P,
Bent ZW, Wilson R, Ziraldo SB, Wheeler TD, McDermott GP, Zhu J, et
al: Massively parallel digital transcriptional profiling of single
cells. Nat Commun. 8:140492017. View Article : Google Scholar : PubMed/NCBI
|
|
41
|
Zhao X, Gao S, Wu Z, Kajigaya S, Feng X,
Liu Q, Townsley DM, Cooper J, Chen J, Keyvanfar K, et al:
Single-cell RNA-seq reveals a distinct transcriptome signature of
aneuploid hematopoietic cells. Blood. 130:2762–2773. 2017.
View Article : Google Scholar : PubMed/NCBI
|
|
42
|
De Bie J, Demeyer S, Alberti-Servera L,
Geerdens E, Segers H, Broux M, De Keersmaecker K, Michaux L,
Vandenberghe P, Voet T, et al: Single-cell sequencing reveals the
origin and the order of mutation acquisition in T-cell acute
lymphoblastic leukemia. Leukemia. 32:1358–1369. 2018. View Article : Google Scholar : PubMed/NCBI
|
|
43
|
Giustacchini A, Thongjuea S, Barkas N,
Woll PS, Povinelli BJ, Booth CAG, Sopp P, Norfo R, Rodriguez-Meira
A, Ashley N, et al: Single-cell transcriptomics uncovers distinct
molecular signatures of stem cells in chronic myeloid leukemia. Nat
Med. 23:692–702. 2017. View Article : Google Scholar : PubMed/NCBI
|
|
44
|
Yan B, Hu Y, Ban KHK, Tiang Z, Ng C, Lee
J, Tan W, Chiu L, Tan TW, Seah E, et al: Single-cell genomic
profiling of acute myeloid leukemia for clinical use: A pilot
study. Oncol Lett. 13:1625–1630. 2017. View Article : Google Scholar : PubMed/NCBI
|
|
45
|
Zheng C, Zheng L, Yoo JK, Guo H, Zhang Y,
Guo X, Kang B, Hu R, Huang JY, Zhang Q, et al: Landscape of
infiltrating t cells in liver cancer revealed by single-cell
sequencing. Cell. 169:1342–1356.e16. 2017. View Article : Google Scholar : PubMed/NCBI
|