Introduction
VL30s constitute a family of murine-specific DNA
sequences characterized by the typical retroviral structure
5′LTR-gag-pol-env-3′LTR. They are represented by 372 sequences,
categorized as 86 full-length and 49 truncated copies, as well as
237 solo LTRs with non-random chromosomal distribution in the mouse
genome (1). As regards the
full-length copies, their internal sequences bear multiple stop
codons and, due to the lack of protein coding capacity, are
classified as non-autonomous LTR retrotransposons (2). VL30 transcription is induced by
various stimuli (3–5), which justify VL30s' prominent feature
as early response genes (2). VL30
transcripts play significant roles in cellular processes regulating
gene expression (6), proto-oncogene
transcription and cellular proliferation (7), as well as steroidogenesis (8). Moreover, they have effects on
tumorigenesis (7,8) and in induced cerebral ischemia,
polyribosome-bound VL30 transcripts can lead to the inhibition of
translation and cell death (9). An
important feature of VL30s is that their typical 30S transcript is
packaged into murine leukemia C-type helper viruses (10) and, following its reverse
transcription into cDNA, can be transmitted to heterologous cells
(11). Accordingly, VL30
retrotransposition occurs in a retroviral fashion mechanism. The
authors have previously demonstrated the VL30s' retrotransposition
competence (12), and new
integrated genomic copies are characterized by 4bp-target site
duplications (5). Importantly,
induced VL30 retrotransposition affects genome integrity, leading
to programmed cell death (13).
Retrotransposition is an intracellular phenomenon
based on a retrotransposon RNA-intermediate, which following its
reverse transcription into cDNA by an active reverse transcriptase,
is randomly integrated into a new genomic site (14)Thus, retrotransposition is a potent
mutagenic process as new retrotransposon copy-integrations can
inactivate or deregulate gene expression. A low retrotransposition
frequency naturally takes place mainly during oogenesis and
embryogenesis (15,16); however, high frequency rates may
result in the onset of genetic diseases or tumorigenesis (16).
Epithelial-to-mesenchymal transition (EMT) occurs
mainly during normal embryonic development. In this process,
epithelial cells lose their cell-to-cell contacts, exhibit
cytoskeletal remodeling, gain migratory properties and switch to a
mesenchyme-like gene expression program. In addition, EMT promotes
cancer progression by facilitating invasion and metastasis
(17–19). EMT induction is associated with the
transcriptional repression of epithelial cadherin (E-cadherin)
triggered by transforming growth factor-β1 (TGF-β1), epidermal
growth factor (EGF) and wingless-related integration site/β-catenin
(Wnt/β-catenin) signaling pathways (20,21).
The majority of these pathways function through pleiotropically
acting transcription factors, such as members of the zinc finger
protein sna1 (Snail-1), snai2-snail homolog 2 (Slug), basic
helix-loop-helix E47 and twist-related protein 1 (Twist) families
(22). Accumulating evidence
suggests a link between EMT and stem cells in cancer (23,24).
Stem cells are characterized by an indefinite cell
division capacity and a potential to self-renew, enabling their
maintenance, regeneration and differentiation into adult tissues. A
functional ductal tree deriving from the mammary epithelial tissue
indicates the presence of stem cells (25). Such cells are relatively dormant and
are activated only during mammary gland development supported by
ductal and alveolar progenitors (26), which have stem cell-like properties
(27). The Wnt (28) and Notch (29) signaling pathways, playing important
roles in self-renewal, can regulate stem cells. A trait of mammary
stem cells is their ability to form mammospheres, observed in
vitro, which retain the undifferentiated, multi-potent and
proliferative state (30). Human
breast tumors bear a small population of cancer stem cells (CSCs),
identified by a CD44high/CD24−/low antigenic
phenotype, also termed as tumor-initiating cells (31). Consistent with this, EMT, cancer and
mammosphere formation are linked with the EMT-induced phenotype in
transformed human mammary epithelial cells characterized by an
increasing CD44+/CD24−/low cell
subpopulation, which exhibits enhanced mammosphere formation
(24).
Given the deleterious effects of retrotransposition,
host organisms have evolved diverse defense mechanisms to silence
retrotransposons. Among others, DNA methylation is an epigenetic
defense mechanism which can block retrotransposition in
differentiated cells by silencing retrotransposon RNA expression
(32). In addition, epigenetic
programs play a key role in the function and differentiation of
stem cells where several genes are expressed as a result of a
hypo-methylation state (33). In
the present study, the question of whether mouse mammary epithelial
HC11 cells characterized by stem-like/progenitor properties
(34–36) have the potential to elicit VL30
retrotransposition events was addressed. Upon transfection with an
engineered VL30 retrotransposon, it was demonstrated that HC11
cells provide an amenable cellular environment for the occurrence
of VL30 retrotransposition events. Notably, the outcome of VL30
retrotransposition was associated with the induction of EMT, CSC
generation and tumorigenesis. The findings of the present study are
the following: i) VL30 retrotransposition as a tumorigenesis agent,
and ii) the induced EMT/CSC/tumorigenesis properties of HC11 cells
may be considered as a marker of such cells.
Materials and methods
Cells and cell culture
HC11 is an immortalized mouse mammary epithelial
cell line (34) with stem-like or
progenitor cell properties (36).
C127 are mouse non-tumorigenic mammary epithelial cells. HC11 and
C127 cell lines were purchased from Life Technologies. J3B1A cells
are a clonal derivative from the spontaneously immortalized mouse
mammary epithelial cell line EpH4 (37) (obtained from Dr Priscilla Soulie,
Medical School Center, Geneva, Switzerland). C127 cells were grown
in Dulbecco's modified Eagle's medium (DMEM) containing high
glucose (4.5 g/l), 10% FBS, 2 mM L-glutamine, penicillin (100
units/ml) and streptomycin (100 mg/ml). J3B1A cells were grown in
DMEM containing low glucose (1 g/l), 10% FBS, 2 mM L-glutamine,
penicillin (100 units/ml) and streptomycin (100 mg/ml). HC11 cells
were cultured in Roswell Park Memorial Institute medium (RPMI)-1640
medium supplemented with 10% FBS, 2 mM L-glutamine, 5 mg/ml insulin
and 10 ng/ml EGF (34). NIH3T3
mouse embryo fibroblasts (CRL-1658, ATCC) were grown under standard
conditions in DMEM growth medium supplemented with 10% (v/v) FCS, 2
mM glutamine, and antibiotics (100 U/ml penicillin and 100 mg/ml
streptomycin).
Transfection and cell cloning
Test cells (0.25×10⁶) were transfected
with 2.5 µg DNA of plasmid NVL-3*/EGFP-INT/hygromycin B (12) using Polyfect® (Qiagen).
Two independent transfections were performed and 20 single or
massive HC11-VL30, J3B1A-VL30 and C127-VL30 cell clones were
isolated following selection with 50–80 µg/ml hygromycin B for 18
days. A total of 2.5 µg DNA of the enhanced green fluorescence
protein (EGFP-N1) plasmid (BD Biosciences) was used for
transfection of the HC11 cells and the selection of
neomycin-resistant clones was performed using G418 at 400 µg/ml for
16 days. Single clone refers to a particular population of cells
isolated from one well-defined cell focus, grown onto a
cell-culture treated plate, produced following antibiotic
selection. Massive clones refer to the remaining
antibiotic-resistant foci isolated from the same plate and further
pooled.
Measurement of retrotransposition
frequency and fluorescence microscopy
The retrotransposition frequency of isolated single
or massive clones was measured by fluorescence-activated cell
sorting (FACS) using trypsinized subconfluent clone cells. Normal
HC11 or J3B1A or C127 cells were used as respective controls to
evaluate EGFP-background fluorescence, setting intensity threshold
values up to 99.60% to be considered as negative and 0.4% as
false-positive. VL30 clone samples with values >0.4% were scored
as retrotransposition-positive. Obtained data were analyzed using
BD CellQuest v.3.1 software as previously described (38). The detection of EGFP-positive cells
was performed with fluorescence microscopy (12,13).
PCR, reverse
transcription-quantitative PCR (RT-qPCR) and reverse
transcription-PCR analysis (RT-PCR)
PCR analysis for the detection of the 342bp VL30
retrotransposition diagnostic band was performed with isolated
clone DNAs and EGFP primers (12).
For real-time PCR analysis, 1 µg of total RNA isolated (using the
RNeasy Mini kit, Qiagen) was converted into cDNA using the
QuantiTect reverse transcription kit (Qiagen). After 1:10 cDNA
dilution, reactions were performed in PCR multi-plate wells
containing 5 µl SYBR PCR Master Mix 2 (KAPA Biosystems), 1 µl cDNA,
3 µl ddH2O and 1 µl primer pair-mix (5 pmol/µl, each
primer). The synthesized pairs of primers, designed using Primer3
primer software were as follows: TGF-β1 forward (F),
5′-tgagtggctgtcttttgacg-3′ and reverse (R),
5′-agccctgtattccgtctcct-3′; Slug F, 5′-tctgcagacccactctgatg-3′ and
R, 5′-agcagccagactcctcatgt-3′; Snail-1 F,
5′-tgagaagccattctcctgct-3′ and R, 5′-cttcacatccgagtgggttt-3′; Twist
F, 5′-cggacaagctgagcaagatt-3′ and R, 5′-gcaggacctggtacaggaag-3′;
homeobox protein nanog (Nanog) F, 5′-aagcagaagatgcggactgt-3′ and R,
5′-atctgctggaggctgaggta-3′; octamer-binding transcription factor 4
(Oct4) F, 5′-ccaatcagcttgggctagag-3′ and R,
5′-ctgggaaaggtgtccctgta-3′; and glyceraldehyde-3-phosphate
dehydrogenase (Gapdh) F, 5′-gcagtggcaaagtggagatt-3′ and R,
5′-gaatttgccgtgagtggagt-3′. Each reaction was performed in
triplicate under the following thermal cycling conditions: Step 1:
95°C/2:00, Step 2: 95°C/0:02, Step 3: 60°C/0:20, Step 4: 60°C/0:01,
repeat steps 2–4 (×39), melting curve: 72°C to 95°C, increment
0.5°C for 0:05 using the CFX96 Real Time System, C1000 Thermal
Cycler (Bio-Rad Laboratories, Inc.). Reverse
transcription-polymerase chain reaction (RT-PCR) analysis was
performed with previously used VL30 (39) and degenerated endogenous reverse
transcriptases (enRTs) primers (5).
In detail, the nucleotide sequence of the degenerated enRT primers
was as follows: 5′-SE,
5′-TGGA(AC)(CT)(AG)(GT)(ACT)(CT)T(GAC)CC(AC)CAGGG(AT)-3′; and
3′-SE, 5′-A(AG)(GAC)AG(AGT)A(AT)GTCATC(CT)A(CT)(AG)TA-3′ designed
at the conserved domains 4 and 5 of amino acid sequences identified
in the amino-terminal coding regions of most known RT polymerases
including that of murine leukemia virus (MuLV) (40).
Western blot analysis, indirect
immunofluorescence analysis and immunofluorescence staining for
FACS
For western blot analysis, cells were harvested in
150 µl RIPA lysis buffer [50 mM Tris-HCl pH 7.5, 150 mM NaCl, 1%
(v/v) Triton X-100, 1% (w/v) sodium deoxycholate and 0.1% (w/v)
SDS] in the presence of 1 mM PMSF, 1 µg/ml pepstatin and 1 µg/ml
leupeptin. The concentration of total extracted proteins was
determined by the Bradford method (Bio-Rad Protein assay kit II
#5000002#). Protein samples of 40 µg were resolved by
electrophoresis using 10% polyacrilamide-0.1% (w/v) SDS gels. The
proteins transferred to nitrocellulose membranes (Schleicher &
Schuell) were finally analyzed by western blotting. The membranes
were blocked in 5% fat-free milk in PBS for 3 h at room temperature
and were subsequently incubated with the follow primary antibodies:
Rabbit polyclonal epithelial cadherin (E-cadherin; sc-7870), rabbit
polyclonal neural cadherin (N-cadherin; sc-7939), mouse monoclonal
vimentin (sc-32322) and mouse monoclonal GAPDH (sc-32233) (all from
Santa Cruz Biotechnology, Inc.) at a 1:250, 1:400, 1:500 and 1:400
dilution, respectively. For protein band visualization, compatible
horseradish peroxidase-conjugated secondary antibodies, namely goat
anti-rabbit IgG-HRP (sc-2004) and goat anti-mouse IgG-HRP
(sc-2005), dilution 1:5,000 and 1:2,000, respectively, were used
for enhanced chemiluminescence (using ECL SuperSignal West Pico
Chemiluminescent Substrate; Pierce, Thermo Fisher Scientific,
Inc.).
For indirect immunofluorescence analysis confluent
normal or clone cells grown on glass coverslips were fixed with
methanol and reacted for 1 h at room temperature with a mixture of
two primary antibodies: Mouse monoclonal fibronectin (sc-59826) and
rabbit polyclonal E-cadherin (sc-7870) (both from Santa Cruz
Biotechnology, Inc.) at a dilution of 1:100 and 1:50, respectively.
The samples were then incubated for 1 h at room temperature with a
mixture of two secondary antibodies Fluorescein (FITC)-AffiniPure
goat anti-mouse IgG (H+L) (Cat. no. 115-095-003) and Cy™5
AffiniPure Goat Anti-Rabbit IgG (H+L) (cat. no. 111-175-144) (both
from Jackson Immunoresearch, UK) at a dilution of 1:100 and 1:200,
respectively, and propidium iodide (PI) following RNase treatment.
Stained samples were observed and photographed using a confocal
microscope (Leica SP).
For immunofluorescence staining, trypsinized cells
were reacted with conjugated allophycocyanin (APC) anti-mouse/human
cluster of differentiation 44 (CD44) (cat. no. 103011, BioLegend)
and phycoerythrin (PE) anti-mouse cluster of differentiation 24
(CD24) antibodies (cat. no. 101807, BioLegend) at 0.1 µg of
antibody per 0.5×10⁶ cells per 100 µl final volume.
Samples were incubated on ice for 15–20 min in the dark, and
following washing and re-suspension in cell staining buffer, were
analyzed by FACS using the flow cytometer BD Facscalibur (BD
Biosciences). The calculation of retrotransposition frequency
values was performed using the BD CellQuest V.3.1 software.
Real-time cell analysis (RTCA)
RTCA was performed with 5,000 cells, in a volume of
100 µl RPMI medium containing 1.25–5% fetal bovine serum (FBS),
transferred into wells of an E-16 plate. The rate of proliferation
(cell index) was measured by a microelectronic biosensor system
[xCELLigence® real-time cell analysis (RTCA) DP] up to 3
days.
Next-generation DNA sequencing of
retrotransposition-positive clones
High-molecular weight genomic DNA isolated from
retrotransposition-positive clone cells was fragmented by digestion
with restriction enzymes and double-stranded linkers were ligated
onto the DNA ends. Nested PCR was conducted using primers designed
at the cytomegalovirus-immediate early (CMV IE) promoter of the
EGFP-based retrotransposition cassette (38), and the 3′ LTR of pNVL-3*/EGFP-INT
(12), respectively. For the first
PCR reaction, the forward primer anneals to the CMV IE promoter
sequence, being downstream of the 3′ LTR, while the reverse one
onto the linker. For the second PCR reaction, the forward primer
anneals to the 3′ VL30 LTR and the same reverse primer was used
(that anneals to poly-linker) at a ratio of 5:1 forward/reverse
primer. PCR products of the second reaction were used for library
preparation and sequencing, according to the Ion Ampliseq library
preparation protocol. Obtained reads were aligned against the
LTR-reference sequence using the bowtie2 algorithm (41) and LTR sequences were filtered out,
using the Cutadapt program (42)
[(http://journal.embnet.org/index.php/embnetjournal/article/view/200/479)].
Xenografts and tumor analysis
Balb/c mice were purchased from Harlan (UK) and were
housed and kept in specific pathogen-free sterile conditions, at
the Transgenic Mouse Facility (TMF) of the Cyprus Institute of
Neurology and Genetics in Nicosia, Cyprus, which is licensed by the
Cyprus Veterinary Services (C.EXP.101). All the bedding and water
for the mice were sterilized by autoclaving. The experiments were
performed under the animal project license (CY/EXP/PR.L6/2011)
provided to A.I.C., issued and approved by the Cyprus Veterinary
services, which is the Cyprus national authority for monitoring
animal research for all academic institutions according to the
regulations contained in the Cyprus Law N.55 (I)/2013 and the EU
Directive 2010/63/EU. Two groups of fourteen (14) female (6-8-week-old) Balb/c mice
(15-20 g weight) were inoculated by injecting 1–5×10⁶
either normal HC11 or massive clone retrotransposition-positive
cells per group into the fat pads near the posterior mammary gland.
Developed tumors along with surrounding tissues were removed,
immediately fixed in 10% neutral-buffered formalin for 24 h and
embedded in paraffin using standard procedures. Paraffin-embedded
tumors were cut in 5-µm-thick sections, stained either with
hematoxylin-eosin alone or analyzed by immunohistochemistry using a
1:300 diluted anti-pan cytokeratin antibody [AE1/AE3] (ab27988,
Abcam) and hematoxylin staining.
Statistical analysis
GraphPad Prism 5.0 version was used for statistical
analysis. Comparisons between multiple groups of retrotransposition
frequency values were determined by one-way analysis of variance
(ANOVA) followed by the Tukey's multiple comparison post hoc-test.
A two-tailed paired sampler Student's t-test was used to examine
the differences between groups of real-time PCR data. In both
cases, differences were considered statistically significant at
P<0.05.
Results
Transfection of a VL30 retrotransposon
in mouse mammary epithelial cells elicits retrotransposition
events
In order to investigate whether VL30
retrotransposition occurs in progenitor mouse mammary epithelial
cells, the present study used HC11 cells that have stem-like or
progenitor cell properties (36),
as well as differentiated J3B1A and C127 cells considered as
controls. The engineered recombinant pNVL-3*/EGFP-INT vector
(12) was also used, which carries
both a VL30 retrotransposon tagged with an EGFP-based
retrotransposition indicator cassette (38), and a hygromycin B gene. Notably,
this VL30 retrotransposon truncated in the internally presumed gag,
pol and env sequences retains its functional retroviral replication
signals primer binding (−PBS), psi (Ψ) packaging signal and
poly-purine tract (PPT), and it is able to retrotranspose (12). The retrotransposition indicator
cassette, cloned in opposite transcriptional orientation to VL30
sequences, consists of a CMV promoter driving the expression of an
EGFP gene, γ-globin intron in opposite orientation to the EGFP gene
interrupting its expression, and a tkpoly(A) signal. The rationale
of detection of a retrotransposition event is based on the
structure of the NVL-3*/EGFP-INT recombinant. Before
retrotransposition, EGFP transcripts originating from the CMV
promoter contain the γ-globin intron and cannot produce the green
fluorescent protein. The detection of EGFP expression and
concomitant fluorescence can only occur, after a retrotransposition
event, following intron removal by splicing and reverse
transcription of the resultant transcript further integrated in the
genome. Thus, the frequency of retrotransposition of a cell
population can be measured using FACS analysis. In addition, the
retrotransposition-positive cells can be observed by fluorescence
microscopy through EGFP expression and further documented with PCR
analysis based on a 342-bp band, diagnostic of new retrotransposon
copies integrated in the genome (12,13).
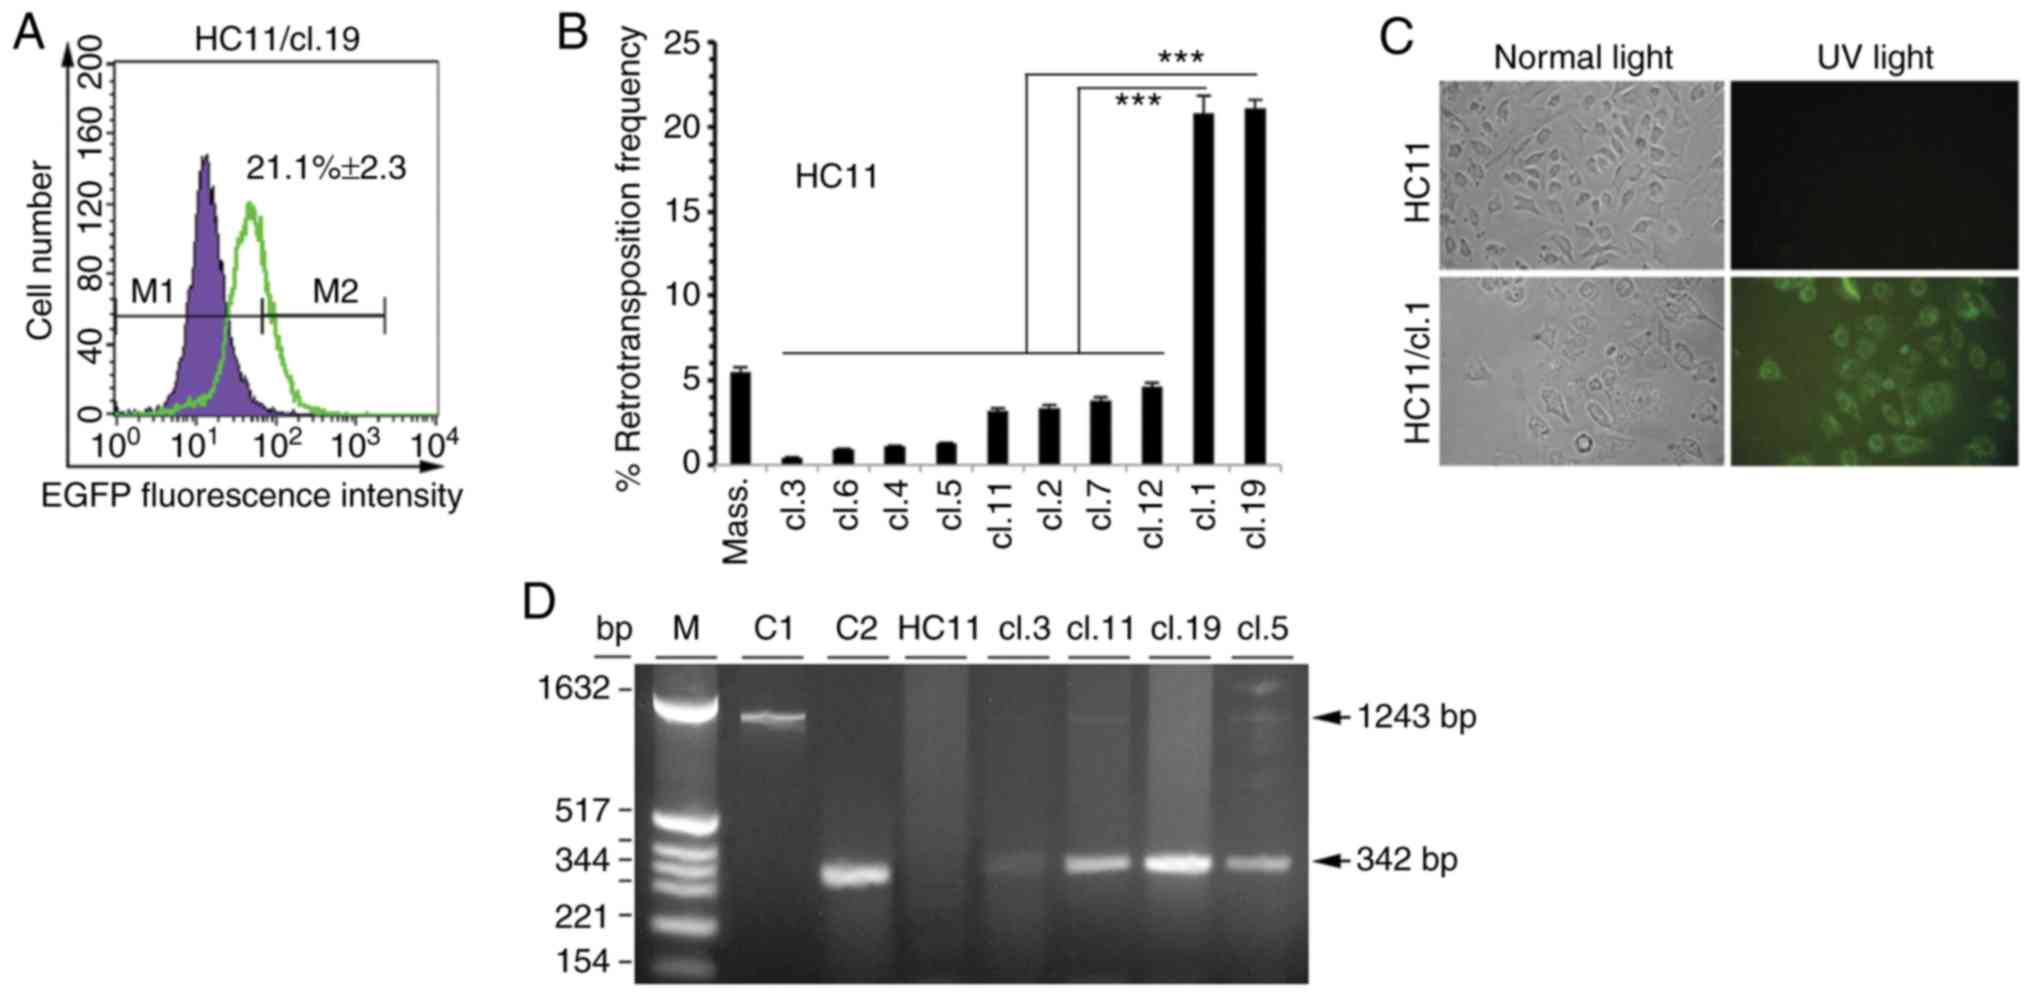
Following cell transfection with pNVL-3*/EGFP-INT
and selection with hygromycin B, 20 random antibiotic-resistant
single clones were isolated from each case of HC11 or C127 or J3B1A
cells, as well as a 72–85 mixed clone population, thereafter
referred to as massive clones. Subsequently, the retrotransposition
frequency of isolated clones were measured by FACS, comparing their
EGFP fluorescence profiles with those of self-fluorescence of
respective non-transfected cells, as exemplified for HC11 clone 19
(HC11/cl.19) (Fig. 1A). Among the
single HC11 clones, it was observed that clones 1 and 19 had a 20.8
and 21.1% retrotransposition frequency, respectively, is
significantly higher to that of <4.8% measured in all other
clones (Fig. 1B). In reference with
the C127 cells, single clones 12 and 7 had the highest
retrotransposition frequency of 5.7 and 6.9%, respectively, while
in the case of J3B1A cells, the highest retrotransposition
frequency was found in single clones 8 and 9 with a similar
percentage of 4.6% (Fig. S1). In
all other clones derived from either the HC11 or C127 or J3B1A
cells, a lower retrotransposition frequency was found, as shown for
a set of 10 clones (Figs. 1B and
S1). Furthermore, in isolated
massive clones, a higher retrotransposition frequency was observed
in the case of HC11 compared to C127 and J3B1A massive clone cells
with respective values of 5.48% (Fig.
1B), 3.5 and 3.2% (Fig.
S1).
Subsequently, whether the retrotransposition events
of retrotransposition-positive clone cells could be microscopically
monitored through EGFP fluorescence was examined. Indeed,
fluorescence microscopy revealed EGFP expression in HC11 or J3B1A
or C127 single clones as exemplified for HC11/cl.1 (Fig. 1C). Furthermore, to gain more
evidence on whether the retrotransposition events, as analyzed by
FACS and observed with fluorescence microscopy, corresponded to new
integrated VL30 copies into the genome, PCR analysis was performed
in retrotransposition-positive clone cells. Using DNA extracted
from non-transfected HC11 cells and 4 retrotransposition-positive
single clones with a low (clone 3), intermediate (clones 5 and 11)
and high retrotransposition frequency (clone 19) (Fig. 1B), in all cases, the expected 342 bp
PCR product (Fig. 1D) was detected,
diagnostic of a retrotransposition event (12).
VL30 retrotransposition-positive HC11
cells acquire a mesenchyme phenotype
Given the potentially mutagenic effect of new VL30
copy-integrations in the genome, whether the
retrotransposition-positive cells had acquired phenotypic changes
was investigated. To examine this, the cell morphology of 20
retrotransposition-positive clones derived from either HC11 or C127
and J3B1A cells 45 days after clonal isolation was microscopically
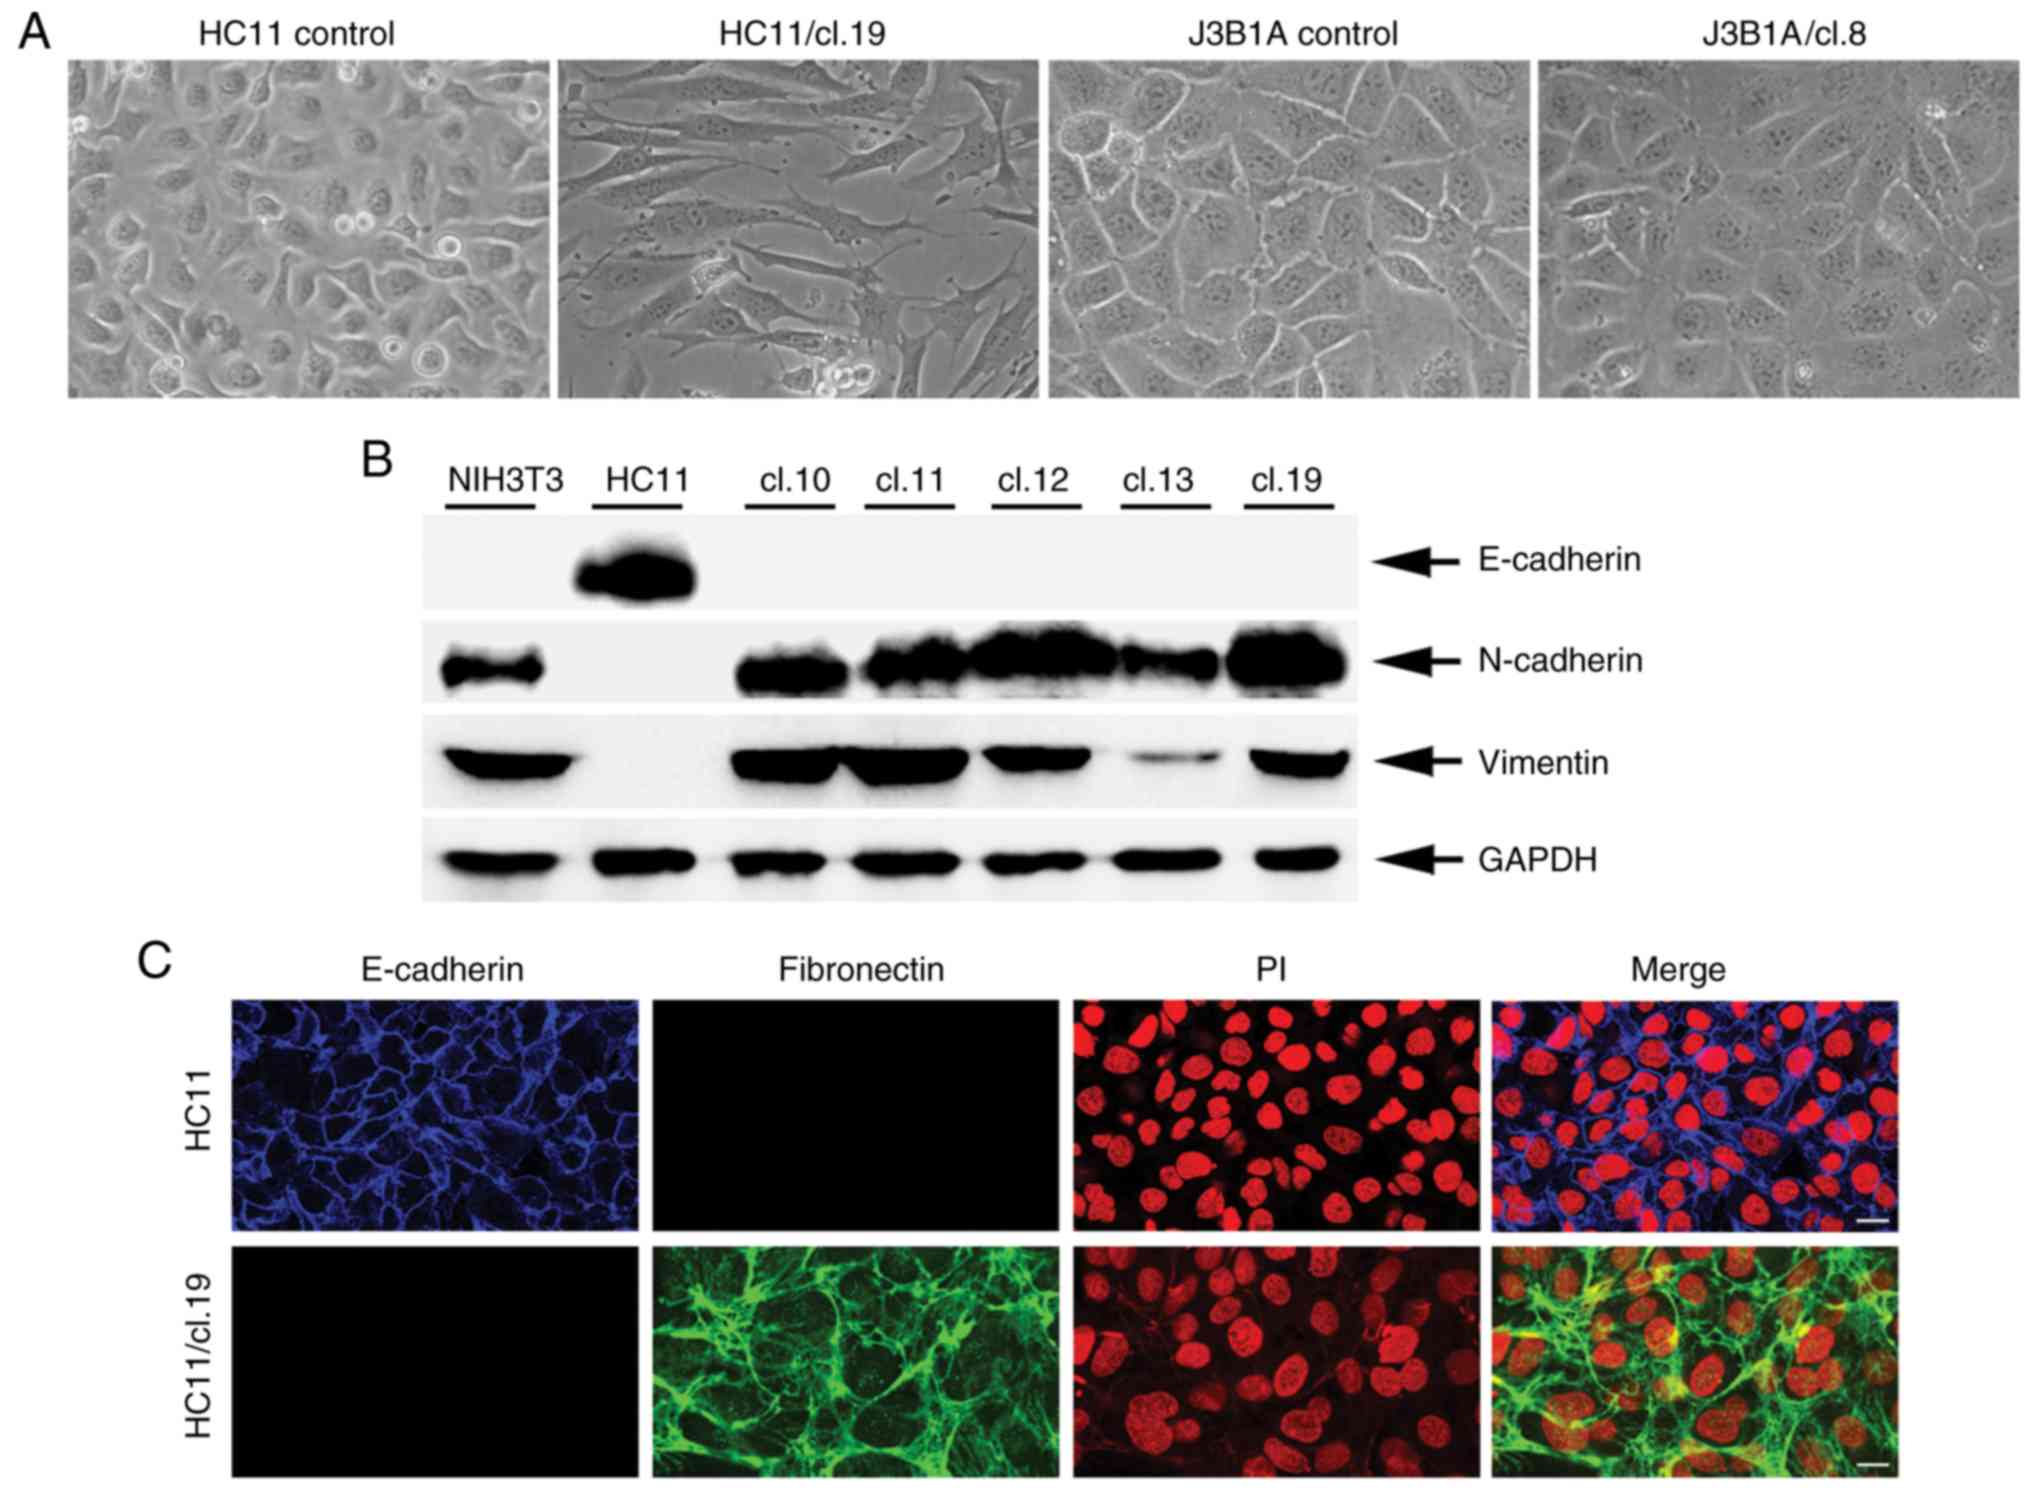
examined. It was found that 18 out of 20 (18/20) HC11 single clones
exhibited a clear phenotypic change, as shown for clone 19
(Fig. 2A), documented by the
typical elongated mesenchymal morphology. By contrast, no such
change was evident in any of the J3B1A or C127 clones, even in
clones with the highest retrotransposition frequency, such as
J3B1A/cl.8 (Fig. 2A) and C127/clone
(cl.)7 (Fig. S2). Notably, the
unaltered phenotype of J3B1A and C127 clones was maintained even
after a prolonged cultivation for 6 months. Finally, to exclude the
potential involvement of the plasmid sequences integrated in the
genome and EGFP expression in the observed phenotypic change of
retrotransposition-positive HC11 cells, we transfected HC11 cells
with plasmid EGFP-N1, which expresses EGFP. Following cultivation
of isolated massive EGFP-N1/G418-resistant clones for 3 months, no
phenotypic change was observed (Fig.
S3).
Mesenchymal phenotype of VL30
retrotransposition-positive HC11 cells is associated with the
induced expression of EMT markers
To further analyze the observed mesenchymal
phenotype of the retrotransposition-positive HC11 clones, the
protein expression of both the epithelial marker E-cadherin and the
mesenchymal markers N-cadherin and vimentin (43) was initially examined by western blot
analysis in normal HC11 cells and NIH3T3 fibroblasts as a positive
and negative control, respectively. In contrast to the HC11 cells,
it was found that a set of 5 retrotransposition-positive clone
cells exhibited a complete loss of E-cadherin expression. In
addition, these clones were strongly positive for N-cadherin and
vimentin expression with a protein expression profile as that of
NIH3T3 fibroblasts (Fig. 2B). To
gain additional evidence at the cellular level on E-cadherin loss
of expression, its expression was examined along with the
expression of the mesenchymal marker, fibronectin (43) by immunofluorescence analysis in
HC11/cl.19 cells. Compared to the control HC11 cells, HC11/cl. 19
cells were marked by a lack of E-cadherin, as well as a strong
increase in fibronectin expression at the extracellular matrix
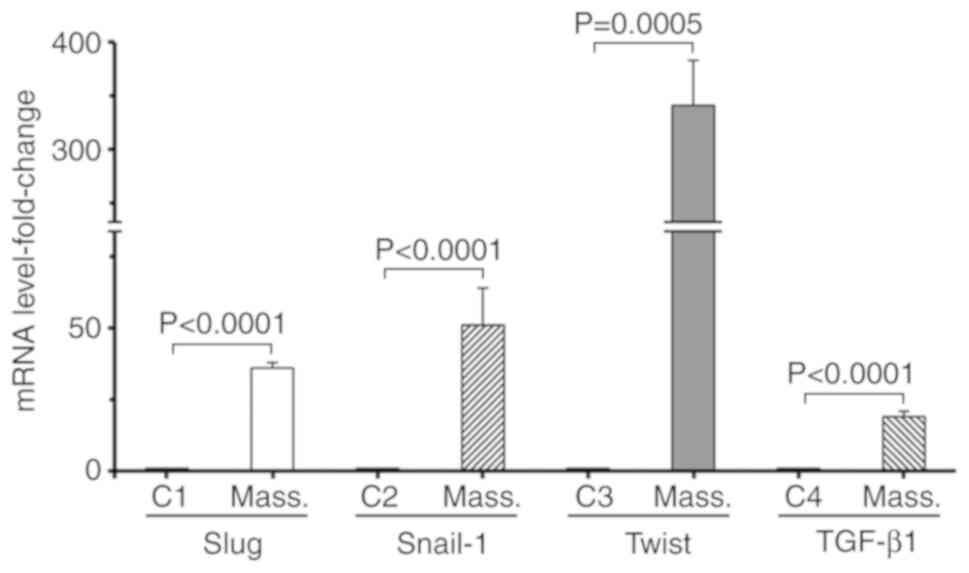
(Fig. 2C). Finally, whether the
expression of the EMT-associated transcriptional factors, Slug,
Snail-1, Twist and cytokine TGF-β1 (23) was affected was investigated, by
examining their expression at the mRNA level. RT-qPCR analysis,
using cDNA generated from normal HC11 cells and respective
retrotransposition-positive massive clones, indicated that the mRNA
expression of TGF-β1, Slug and Snail-1 was strongly increased by
~19-, 36- and 51-fold, respectively. Of note, the RNA expression of
Twist was markedly increased by ~341-fold (Fig. 3).
VL30 retrotransposition-positive HC11
cells exhibit properties of CSCs
A previously demonstrated, the association of EMT
and gain of stem cell properties (24) prompted us to examine whether HC11
retrotransposition-positive cells, characterized by induced EMT,
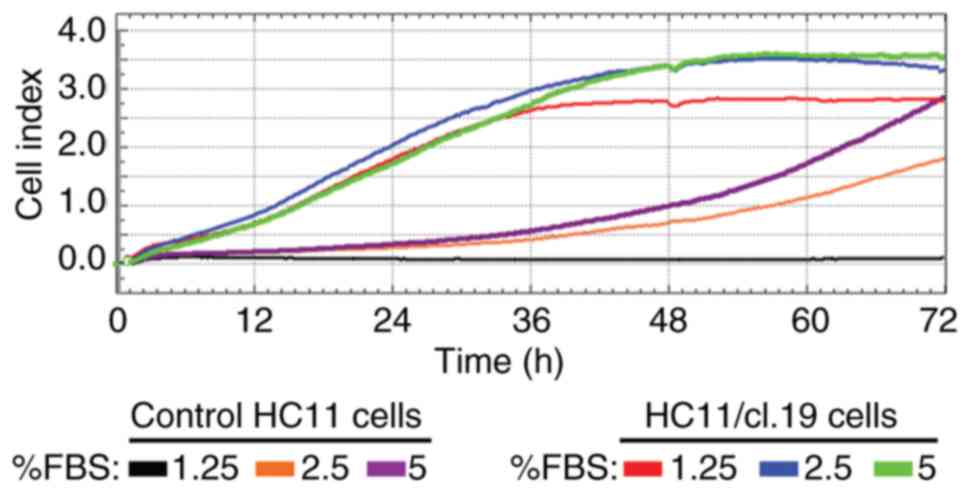
had acquired CSCs properties. To this end, using normal HC11 cells
as a control, the proliferation rate of HC11
retrotransposition-positive single-clone cells was initially
measured by RTCA in low FBS-growth medium for a period up to 72 h.
It was found that clone cells had higher growth rates than the
control cells when cultured in <10% FBS concentrations, as
exemplified for the HC11/cl.19 cells (Fig. 4). Specifically, the cell index of
the control cells supplemented with 2.5- and 5% FBS at 48 h was
0.75 and 1.0, respectively, while the cell index of the HC11/cl.19
cells at both FBS concentrations was much higher at ~3.46.
Furthermore, at the point of 48 h and the 1.25% FBS concentration,
while the control cells could not grow, the HC11/cl.19 cells had a
2.8-cell proliferation index.
Subsequently, the observed ability of HC11
retrotransposition-positive cells to grow in low serum medium
motivated us to examine whether their growth is
anchorage-independent or apoptosis resistant. Thus, trypsinized
cells from 5 retrotransposition/EMT-positive clones 3, 6, 11, 12
and 19 were subjected to the anoikis test for 10 days in
non-adherent plates, using normal HC11 cells as a control. At 5
days post-trypsinization, the control cells failed to proliferate,
exhibiting early cell death effects (Fig. 5A-a). By contrast, all clone cells
were able to attach on the plate surface, proliferate and form cell
clusters characterized by fibroblast-like morphology with
spike-like extensions or filopodia, as well as growing small-sized
cell spheroids or mammospheres on the top, as shown for the
HC11/cl.12 cells (Fig. 5A-b and
-c). Furthermore, after 10 days of cultivation, the size of the
mammospheres was further increased and
anchorage-independent/floating mammospheres were evident in the
culture medium (Fig. 5A-d).
Subsequently, the protein expression of the CD44 and CD24 cell
surface antigen markers in EMT-positive clones was examined by FACS
analysis. It was found that the expression of CD44 was
significantly increased, while that of CD24 was decreased, as shown
for the 3 clones, 11, 12 and 19, compared to the control HC11 cells
(Fig. 5B). Among these clones,
clone 19, characterized by the highest retrotransposition frequency
(Fig. 1B), exhibited a relatively
lower CD24 expression, while clones 11 and 12 the highest increase
in CD44 expression.
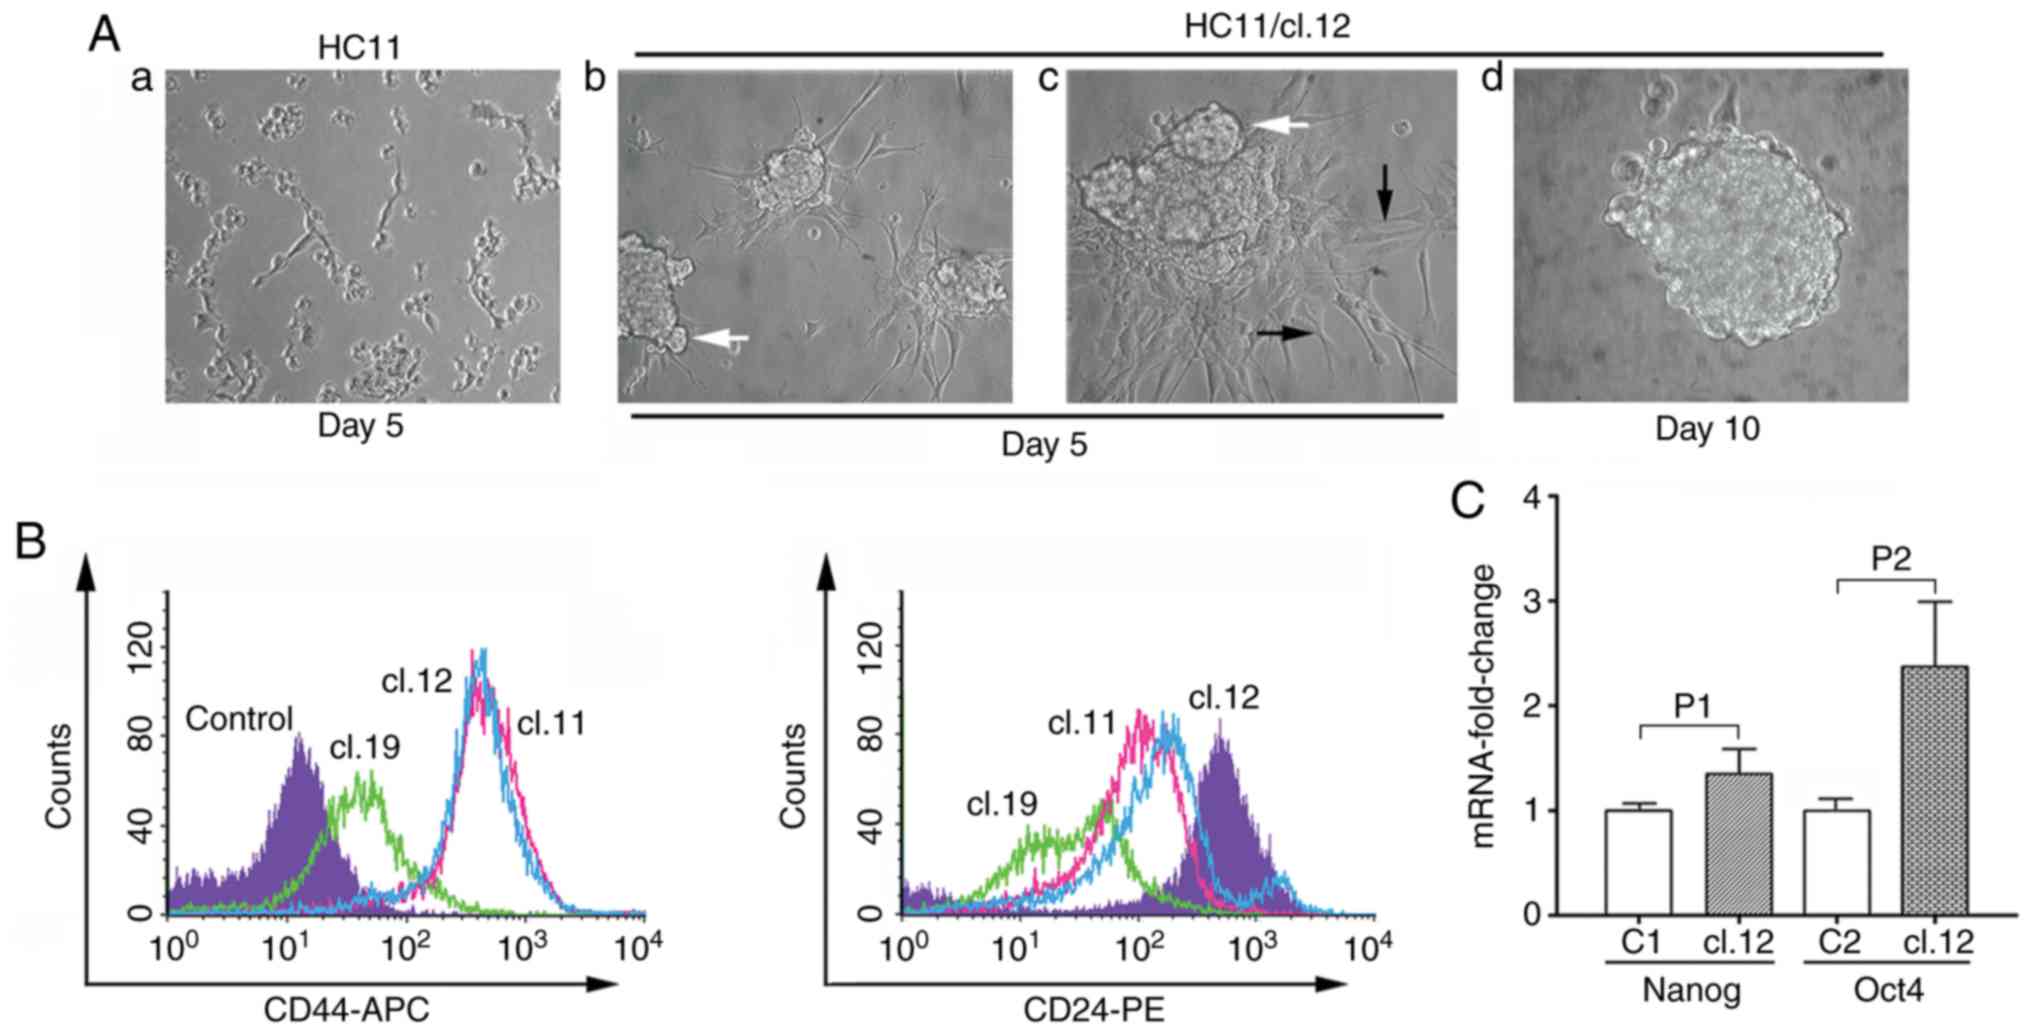 | Figure 5.Mammosphere formation in
anchorage-independent growth conditions, CD44/CD24 antigen analysis
and RNA expression levels of Nanog and Oct4 genes in HC11
retrotransposition-positive cells. (A) 0.2×10⁶
trypsinized control HC11 or HC11/cl.12 cells were seeded into
non-adherent plates and cultured for 10 days. White arrows (in
panels b and c) indicate mammospere outgrowth, while black ones (in
panel c) filopodia-like structures. In panel d, a fully
formed-floating mammosphere is illustrated after 10 days of
culture. Magnification, ×20 in (a and b), and ×40 in (c and d).
Data shown are representative of 3 experiments. (B) 15,000 cells of
clones 11, 12 and 19 stained with specific CD44 or CD24 antibodies
were analyzed by FACS (n=3). Filled-histogram in violet represents
control HC11 cells while empty color-histograms in green, light
blue and pink correspond to clones 19, 12 and 11, respectively. (C)
Total RNA isolated from control HC11 or mammospheres of
retrotransposition-positive clone 12 cells was subjected to RT-qPCR
analysis with designed Nanog or Oct4 gene primers (please see
Materials and Methods). Columns represent the mean value of mRNA
expression measurements with ±SD indicated with bars (n=3). Filled
columns indicate mammosphere mRNA expression levels of Nanog or
Oct4 genes, while empty C1 and C2 columns their respective HC11
control levels. GAPDH was used as control cDNA template
normalization. P1 and P2 correspond to statistically significance
values of 0.0198 and 0.0119, respectively (paired sampler Student's
t-test). |
Finally, mammospheres isolated from
retrotransposition/ EMT-positive clone 12 cells were examined at
the mRNA level for the expression of Oct4 and Nanog stem cell
markers, as well as their potential for self-renewal and
differentiation. As regards the former, RT-qPCR analysis revealed
that the mRNA expression of the Nanog and Oct4 genes was ~0.35- and
~2.3-fold higher than the levels of the control HC11 cells,
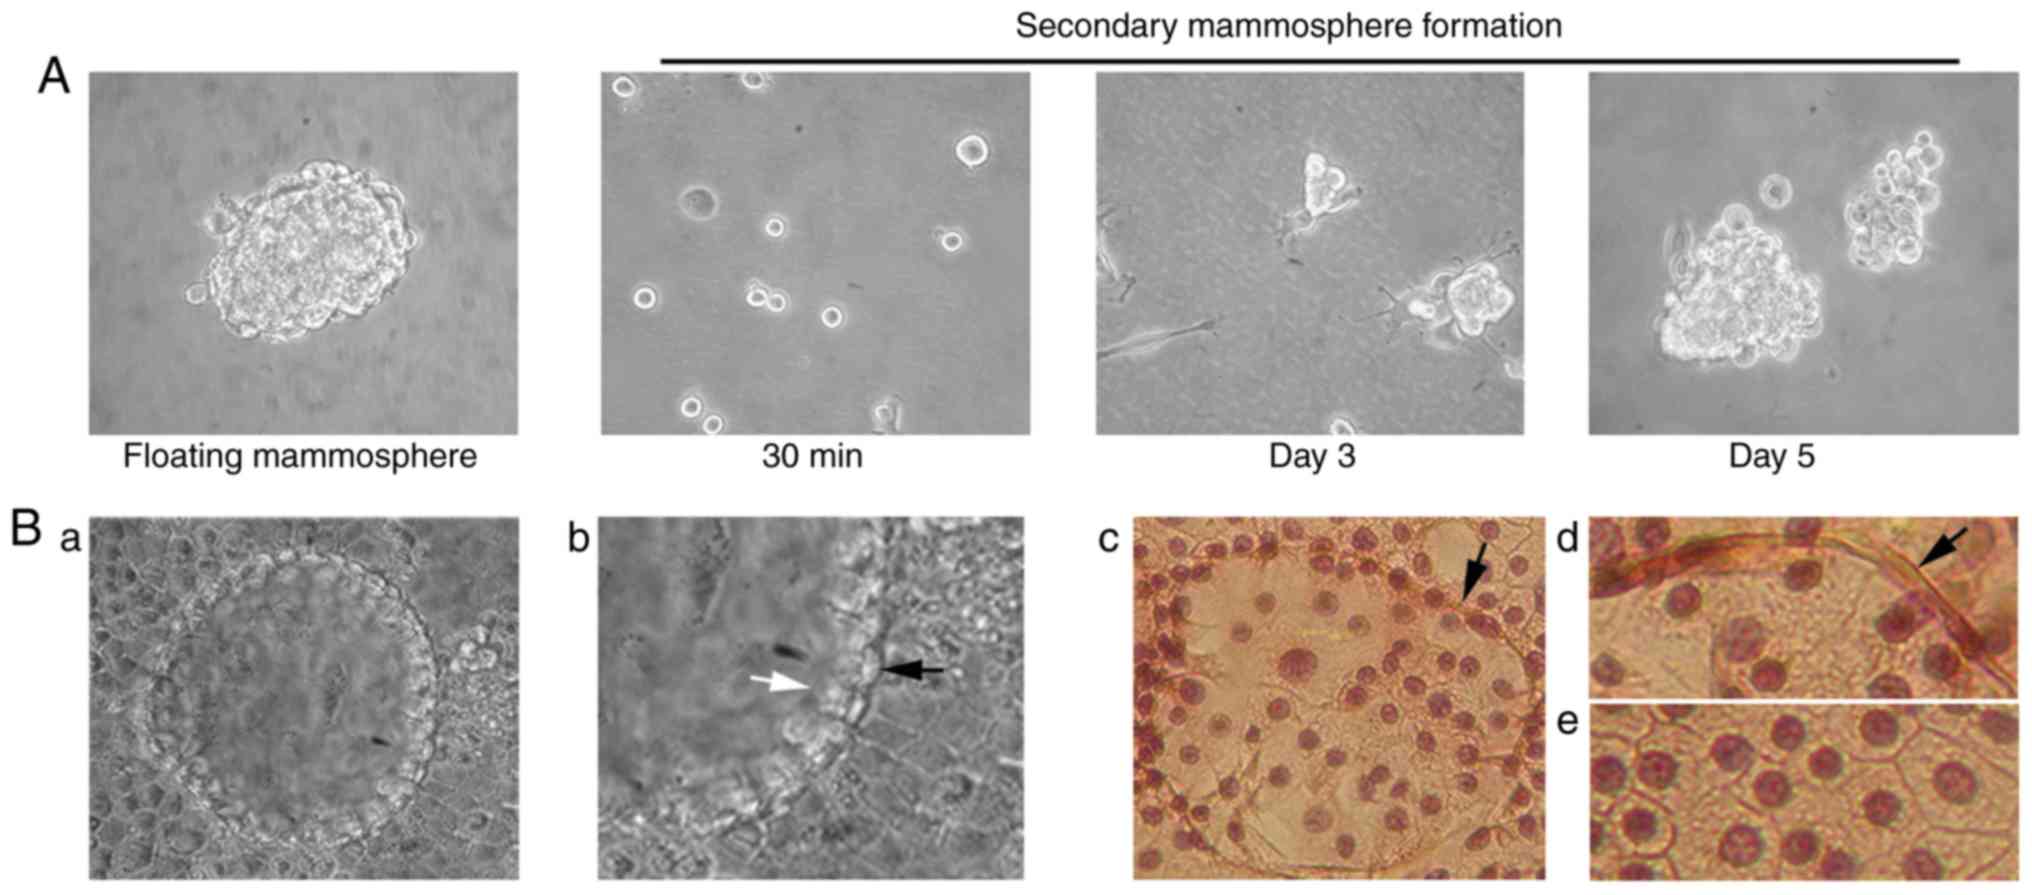
respectively (Fig. 5C). With
respect to the latter, floating mammospheres were isolated,
trypsinized and cultured in non-adherent plates as single cells.
Following 3 days of culture, the generation of secondary
small-sized mammospheres was observed, which had almost half of the
initial mammosphere size in 5–7 days (Fig. 6A). Furthermore, isolated floating
mammospheres, grown in cell-culture treated plates under confluent
conditions for 15–20 days, formed early tissue structures
distinguished by two distinct cell layers: An inner layer consisted
of luminal epithelial-like cells, and a surrounding ring of
myofibroblast-like cells resembling the outer layer of a mammary
acinus (Fig. 6B-a-e).
New retrotransposed VL30 copies are
integrated at the vicinity of cancer-related genes
Taking into account the induced CSC-like properties
observed in retrotransposition-positive HC11 cells, whether the new
genomically integrated VL30 copies were linked with known genes
involved in EMT and cancer was examined.
To this direction, high-molecular weight DNA
isolated from cells of clones 19 and 7, characterized by a
respective high and medium retrotransposition frequency of 21.1%
and ~4% (Fig. 1B), was used for
targeted sequencing analysis. The strategy of sequencing analysis
was based on: i) The human CMV–IE promoter as its particular
sequence is part of the EGFP-etrotransposition indicator cassette
(38), but not present in the mouse
genome; and ii) the end of 3′VL30 LTR in locating the start of a
new integration site in the genome (Fig. S4). Following sequencing analysis,
74,668 and 61,385 total reads were initially received for clones 19
and 7, respectively. Following alignment against the reference
mouse genome sequence (mm10), a respective number of 273 and 230
mapped reads was received. Filtering-out the LTR sequence included
in reads and from the mapped coordinates of trimmed reads, a number
of 24 and 17 high-confidence new VL30 integrations were found in
clone 19 and clone 7 DNA, respectively. Subsequently, whether the
sum of these integrations was linked to a particular chromosome was
examined. It was found that chromosomes 3, 8, 9, 10, 16 and 18 had
no integrations, while the higher number of integrations was
identified in chromosomes 4, 5, 11, 12 and X with a number of 6, 5,
4, 4 and 4 integrations, as presented in Table SI.
Given that LTR sequences harbor promoter and
enhancer sequences that can influence gene expression, the total
number of 41 integrations of both clones was further examined to
determine whether there was any association with a gene involved
either in breast or other types of cancer. It was found that 10
integrations were associated with genes of various types of cancer
and 11 with breast cancer. Furthermore, to link the observed EMT
properties of retrotransposition-positive clones (Fig. 2), these integrations were examined
for any association with genes associated with EMT. Two
integrations were found concerning the zinc finger protein Zfp808
and Gm13151 (or Zfp988) genes, which may be involved in EMT
(44), and two additional
integrations close to Akap2 or Fbxo33 genes that are associated
with both cancer and EMT. Finally, two integrations were found at
the vicinity of the Fam49a and Rragc genes. These genes are
involved in the epidermal growth factor
receptor/phosphatidylinositol-3-kinase/phosphatase and tensin
homolog deleted on chromosome ten (EGFR/PI3K/PTEN), and
serine-threonine protein kinase/mammalian target of rapamycin
(AKT/mTOR) signaling pathways, respectively, associated with both
breast cancer and EMT (45,46). A detailed list of integration data
is presented in Table SI.
VL30 retrotransposition-positive HC11
cells are tumorigenic
The above-mentioned sequencing data showing that the
two independent clones 19 and 7 had a sum of 21 new integrations,
possibly linked with either various types of cancer or breast
cancer (Table SI), prompted the
investigation of whether HC11 retrotransposition-positive cells
could experimentally produce tumors in syngeneic mouse models. To
this end, 2 groups of 14 Balb/c syngeneic mice were injected with
either 1×10⁶ or 5×10⁶ massive
retrotransposition-positive clone cells (Fig. 1B) using as control an equal number
of mice injected with a respective number of normal HC11 cells. In
the case of injections either with 1×10⁶ HC11 or
retrotransposition-positive cells, following visual and palpation
examination of the treated mice for 4 months, no tumor development
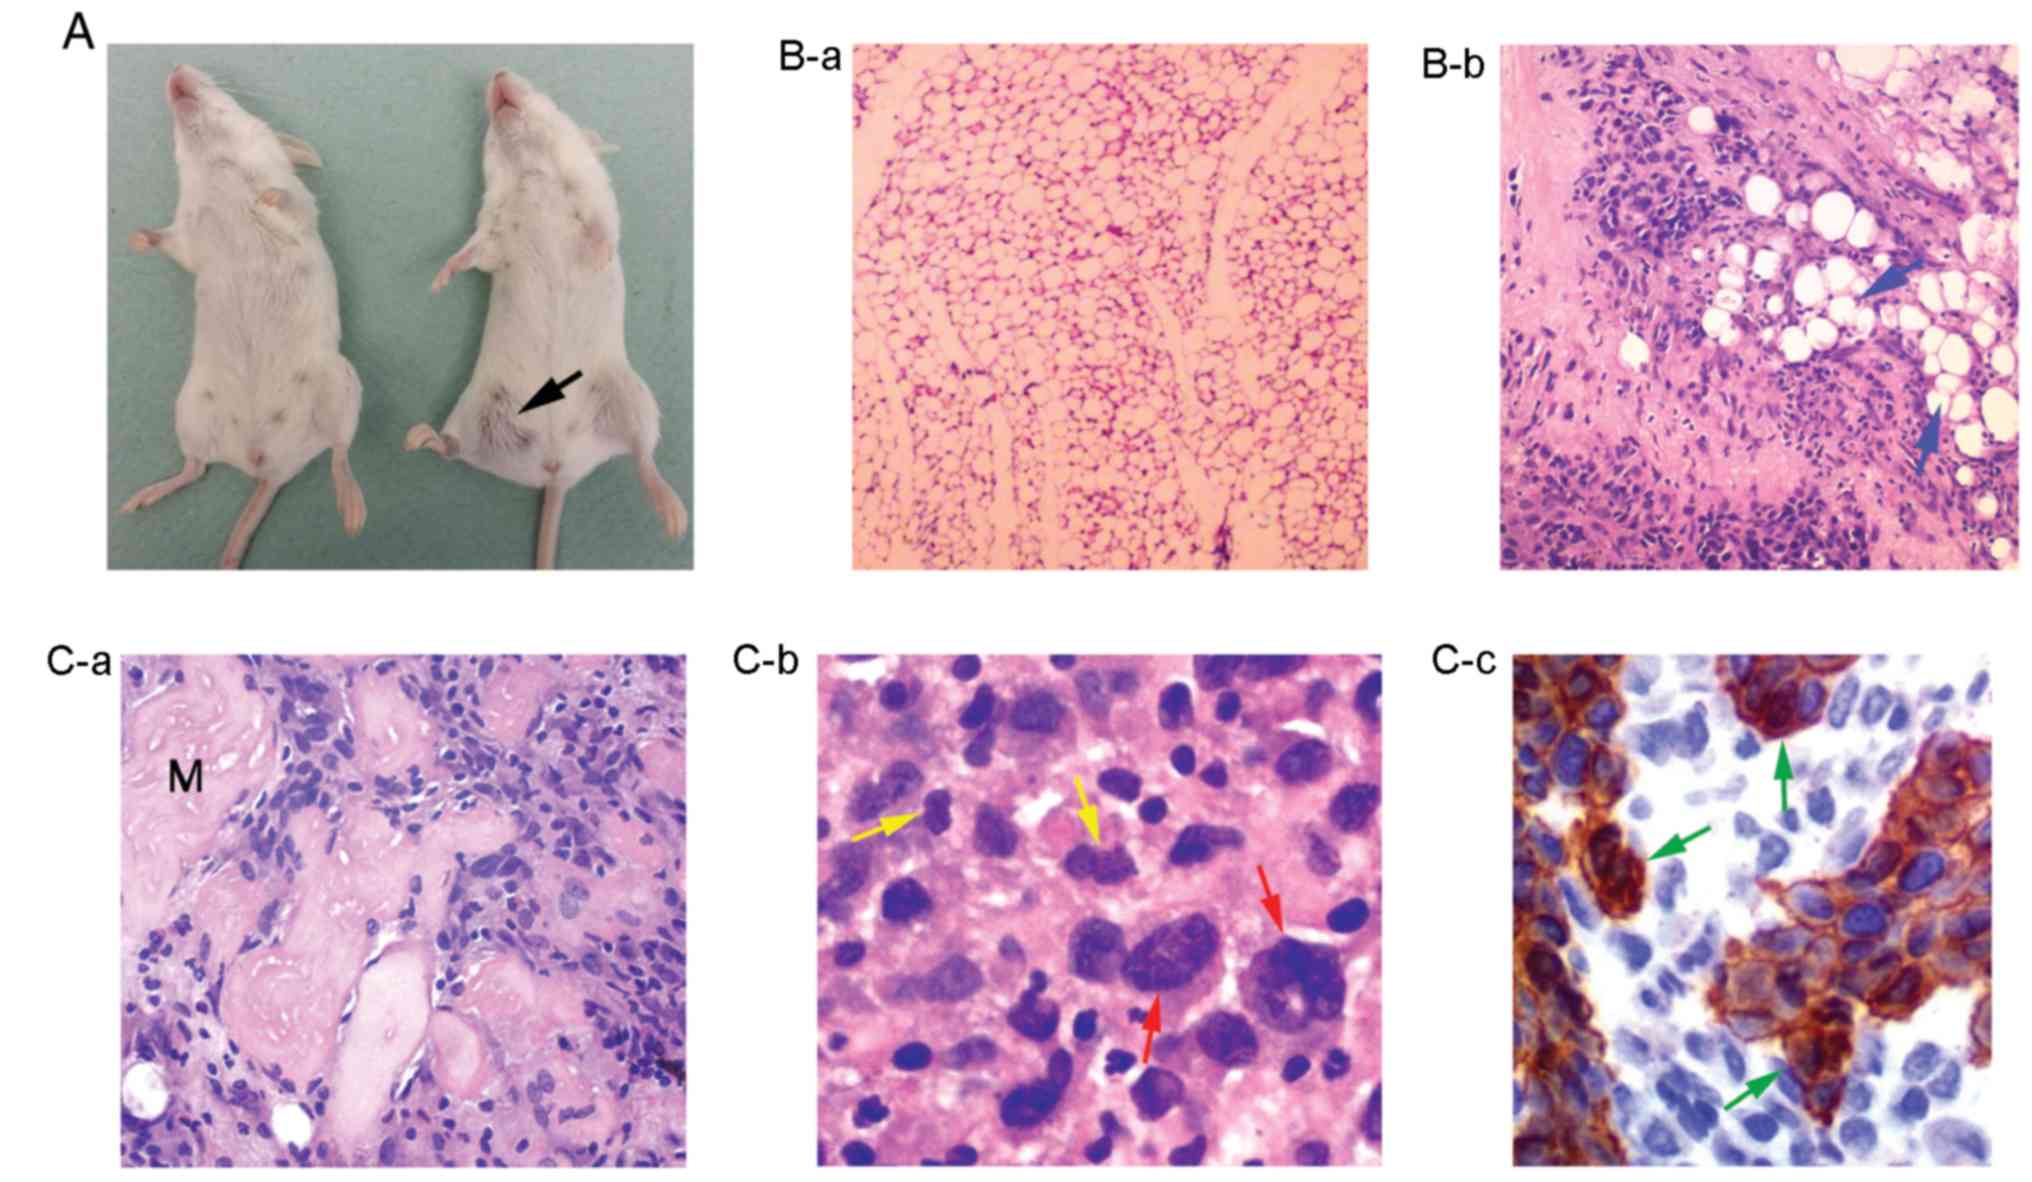
was detected. However, in the case of 5×10⁶ cell
injections, while none of the mice injected with HC11 cells
produced visible tumors, 2 out of 14 (2/14) mice injected with
retrotransposition-positive cells developed ~1 cm-sized tumors at
the same latency period (Fig. 7A).
Tumor section analysis revealed a phenotype of undifferentiated
solid neoplasm with a generally diffuse growth pattern, and in some
sites tumor cells were arranged in cohesive clusters without an
obvious glandular differentiation (Fig.
7B-b and C-a). Moreover, these cells were characterized by a
relatively abundant cytoplasm; enlarged polymorphic nuclei with
prominent nucleoli; a moderate mitotic activity (Fig. 7C-b), and a potential to spread into
surrounding adipose (Fig. 7B-b) and
skeletal muscle tissues (Fig.
7C-a). In addition, sections from surrounding tumor tissues
were examined by immunohistochemical analysis for expression of the
epithelial marker pan-cytokeratin (AE1/AE3) (47). This analysis revealed the presence
of pan-cytokeratin-positive tumor cells able to invade and spread
beyond the initially injected tissues, into surrounding healthy
ones (Fig. 7C-c).
Discussion
A principal finding of the present study was that
either progenitor HC11 or differentiated C127 and J3B1A mouse
mammary epithelial cells elicited VL30 retrotransposition events
upon their transfection with an engineered VL30 retrotransposon
(Figs. 1A and B, and S1). Notably, the retrotransposition
frequency of the HC11 cells was higher than that of the C127 and
J3B1A cells. This was documented by the following: i) Comparing
primarily the retrotransposition value of massive HC11 clones with
that of C127 and J3B1A ones being 1.56- and 1.71-fold higher,
respectively (Figs. 1B and S1); and ii) the fact that 2 out of 10
single HC11 clones (clones 1 and 19) had the highest scored
retrotransposition frequency of ~21% (Fig. 1B) among the respective C127 and
J3B1A clones (Fig. S1). The
authors have previously reported that a highly induced VL30
retrotransposition frequency signals activation of a p53-dependent
cell death pathway (13). In
reference to HC11 cells that harbor mutated p53 gene (48), it was hypothesized that their p53
mutation, rendering these cells unable to activate the
retrotransposition-associated cell death pathway, could justify the
very high retrotransposition frequency of these two clones.
The mechanism of the retrotransposition process
requires both a retrotransposon transcript and an active reverse
transcriptase, while the methylation of repetitive DNA (49,50),
inhibiting retrotransposon RNA expression, is a cell-defense
mechanism against retrotransposition-derived mutation/deleterious
effects. The authors have previously reported VL30
retrotransposition in normal NIH3T3 fibroblasts solely following
treatment with agents, such as vanadium (3), H2O2 (51) or arsenic (52), indicating that normal NIH3T3 cells
do not provide the minimum RNA expression of endogenous VL30s and
enRT enzymes, both required for the generation of a
retrotransposition event (4,12). Of
note, by applying RT-qPCR analysis in this study, higher levels of
enRTs and endogenous VL30 transcripts were found in HC11 cells than
in NIH3T3 cells (Fig. S5). This
demonstrates that the HC11 progenitor state (53) is endowed with an increased
expression, independent of an external stimulus, of both factors
required for a retrotransposition event. Given that the HC11 cells
have stem-like properties, their higher retrotransposition values
could be explained by their hypomethylation status as has been
suggested for human stem cells (54). Apart from the nominal
retrotransposition frequencies found, e.g., in HC11 clones
(Fig. 1B), it was hypothesized that
their true values are higher. This could be due to: Either the
initial VL30 plasmid integration occurred into a relatively low
methylated genomic site, permitting thus the emergence of a
respective low retrotransposition frequency, or the ensuing new
VL30 retrotransposed copies integrated into genomic sites with a
locally higher methylation status. Thus, it can be considered that
the retrotransposition frequencies presented here, particularly of
low retrotransposition-positive clones, are at the lower threshold
that can be reliably measured by FACS. Overall, these data suggest
that both the hypomethylation and p53-mutated states of HC11 cells,
being first permissive for the occurrence and then accumulation of
retrotransposition events, provide an amenable cellular environment
for the emergence of a high retrotransposition frequency. In
addition, the fact that normal HC11 cells do not exhibit an
EMT-cellular phenotype and induced expression of EMT markers
(Fig. 2) implies that the level of
endogenous VL30 transcripts (Fig.
S5) rather consists a cut-off for endogenously or self-derived
retrotransposition events, at least, at a high frequency.
Plausibly, this barrier was exceeded following RNA expression of
our transfected non-autonomous VL30 retrotransposon (less
methylated as plasmid DNA) while an enRT, presumably that of MLV
(10), acted as a
trans-complementation factor for generation of
retrotransposition events.
Three linked lines of evidence document the
specificity of the retrotransposition events found. First, our VL30
recombinant was constructed so that the EGFP is solely expressed
after a retrotransposition event (12,13).
Second, the retrotransposition-positive cells were observed as such
through the EGFP fluorescence (Fig.
1C) further used for making the measurement of a
retrotransposition frequency feasible by FACS analysis (Fig. 1A). Third, the existence of
retrotransposition events was confirmed both as genomic
integrations through the diagnostic 342bp PCR band (Fig. 1D), and target sequencing (Fig. S4 and Table SI). Generally, the natural
retrotransposition frequency is extremely low and for a
non-autonomous or defective endogenous retrovirus/retrotransposon,
such as VL30, it has been estimated to be up to 10−6
retrotransposition events per cell (55). In comparison, HC11
retrotransposition frequencies ranging from 0.3 to 21.2% were
scored (Fig. 1A and B), which
correspond to 30,000- and 212,000-fold higher values, respectively.
Alternatively, assuming a 24-h replication rate of
retrotransposition-positive clone cells and given that their
retrotransposition frequencies were measured 18 days following
antibiotic selection, these values correspond to an increase
between ~1,666- and 11,777-fold per cell/generation, respectively.
Therefore, it is suggested that these unusually high
retrotransposition frequencies, mirroring new VL30 genomic
integrations, contributed to the induced EMT, CSCs generation and
tumorigenesis found.
In an approach to obtain genomic information about
novel VL30 integrations, targeted sequencing analysis was performed
with DNA of clones 7 and 19, and only 41 high-confidence specific
integrations were performed (Table
SI). Notably, the mouse genome contains 458 endogenous LTRs
(1) and their number is expected to
highly increase in retrotransposition-positive cells. Thus, it was
hypothesized that a technical difficulty was responsible for being
unable to identify a much larger number of new integrations, given
that the sequencing design was also based on 3′ LTR sequences
(Fig. S4). Accordingly, this
limited number of integrations cannot support a chromosome
preference of new VL30 integrations. Regarding the location of
integration relative to a gene, the distance of integrations was
not immediately near to genes found (Table SI). Nevertheless, the expression of
these genes could be influenced by enhancers of the VL30 LTRs
(1) even at a long distance, as an
enhancer residing 1 Mb upstream or downstream of a gene can affect
the transcription of a gene in favor of a DNA-looping model,
whereby the enhancer and core gene promoter are brought into close
proximity (reviewed in ref. 56).
Three sets of data document the VL30
retrotransposition-induced EMT. First, the HC11
retrotransposition-positive cells characterized by the acquisition
of a mesenchyme phenotype (Fig. 2A)
and filopodia-cytoskeletal changes (Fig. 5A-c), as reported in induced EMT
(57). Second, these EMT
morphological features were endorsed by a modulated expression of
EMT critical markers (43), such as
the loss of E-cadherin, and a marked increase in N-cadherin,
vimentin (Fig. 2B) and fibronectin
at the protein level (Fig. 2C), as
well as a potent RNA induction of Slug, Snail-1, TGF-β1 and,
mainly, Twist (Fig. 3). These data
are in agreement with findings indicating that the signal
transducer TGF-β1 coordinating the transcriptional induction of
transcription repressors Slug and Snail-1, as well as Twist acting
by binding to the E-cadherin promoter (58) repress the expression of E-cadherin
and induce EMT [reviewed in (59)],
provide primarily a strong explanation for the
retrotransposition-induced EMT observed. Third, at the genomic
level, new VL30 integrations were identified at the vicinity of:
Two zinc finger protein Zfp808 and Gm13151 genes, which may be
involved in EMT; two genes Akap2 and Fbxo33 associated with
cancer/EMT; as well as two genes Fam49a and Rragc involved in the
EGFR/PI3K/PTEN/Akt/mTOR and AKT/mTOR signaling pathways associated
with breast cancer/EMT activation (Table SI). It was thus considered that
these genomic data are indirectly supportive of a VL30
integration-depended induced EMT. As, to the best of our knowledge,
this is the first study on VL30 retrotransposition-induced EMT, the
above integrations at the vicinity of 6 EMT-related genes provide a
hint for a future detailed investigation on the specific EMT
mechanism(s) triggered by VL30 retrotransposition.
Of note, a concomitant feature of
retrotransposition-positive HC11 cells, exhibited an induced EMT
phenotype, was their cancer stem cell properties documented
primarily by the fact that these cells were able to actively
proliferate in low-serum medium (Fig.
4) and generate mammospheres in non-adherent culture plates
(Fig. 5A). Furthermore, the
generated mammospheres: i) exhibited a
CD44+/CD24−/low phenotype (Fig. 5B), (34) acquired self-renewal (Fig. 6A) and cell differentiation
properties, which characterize mammospheres (60), forming acini-like mammary gland
structures consisted of two distinct cell layers likely
corresponding to myoepithelial and luminal cells (Fig. 6B-a-e) and ii) characterized by an
induced RNA expression of the Oct4 gene (Fig. 5C), which is a marker of stem cells
(61). These particular mammosphere
properties are interrelated with the induced expression of TGF-β1
(Fig. 3), known to be associated
with signaling pathways in induction and maintenance of stem cells
(62), as well as Snail-1, Twist
and factors which promote EMT with the
CD44high/CD24low phenotype of CSCs (24). Collectively, these data demonstrate
that VL30 retrotransposition in HC11 cells is associated with CSCs
generation confirming that induced EMT, mammospheres and CSCs are
likely to be linked (24).
It has been reported that the binding of VL30 RNA to
polypyrimidine tract-binding protein-associated splicing factor
(PSF), a proto-oncogene transcription repressor, regulates
tumorigenesis in mice (7). Though,
such a case does not apply to the observed tumor growth (Fig. 7) as the NVL-3*/EGFP-INT recombinant
lacks this particular VL30 binding nucleotide sequence (12). Notably, this study found that
massive HC11 retrotransposition-positive clone cells (Fig. 1B) produced tumors in syngeneic
models using Balb/c mice (Fig. 7A).
In principle, this finding confirms the observed EMT and CSCs
features of representative clones, such as a mesenchymal phenotype
(Fig. 2A), the formation of
mammospheres characterized by a
CD44+/CD24−/low phenotype (Fig. 5A and B), and active cell growth in
low-serum culture conditions (Fig.
4). Notably, this study intentionally used massive clone cells
characterized by a medium 5.5% retrotransposition frequency
(Fig. 1B) to avoid: i) a bias
against clones with a higher retrotransposition frequency such as
clones 1 or 19 (Fig. 1B); and ii)
any particular clone as its clonality per se would be possibly
expected to promote tumorigenesis due to a distinctive number of
integrations/cell. Accordingly, a cell population characterized by
a various retrotransposition frequency/cell is adequate to produce
tumors. Since 2 tumors were found per 14 injected animals, this
~14.3% tumor rate was considered as rather low, and that this was
probably attributed to the normal Balb/c immune system.
Tumor analysis revealed mitotically active cells, as
well as cells with polymorphic enlarged nuclei and multiple
nucleoli (Fig. 7C-b), features of
cancer genome instability (63),
tending to invade the adipose and skeletal muscle tissues (Fig. 7B-b and C-a). In addition,
distinctive cell clusters were strongly positive for
pan-cytokeratin (Fig. 7C-c), a
tumor marker associated with epithelial cell carcinomas and breast
cancer metastasis (reviewed in ref. 47). It was found that each of the
independent clones 19 or 7 had a respective sum of twelve or nine
integrations, but all different in each clone, at the vicinity of
genes related to various types of cancer and breast cancer
(Table SI). This suggests that
each of these clones has a potentially critical number of
integrations for the emergence of tumors. Overall, while the above
morphological tumor features justify the observed tumor malignancy,
we believe that the sum of integrations/cell acted as a triggering
factor for the production of tumor-initiating cells. Without
excluding the case of specific integration(s) this matter remains
for a future detailed investigation, as this study is a first
approach associating LTR retrotransposon-integrations and
tumorigenesis.
In conclusion, the present study links, for the
first time to the best of our knowledge, the
retrotransposition-active LTR retrotransposon VL30 with cells of
the stem-like/progenitor state. To date a direct synergy between
LTR retrotransposition and cancer remains an unexplored question
(16), while an association between
EMT and CSCs (24) and their
co-operation in the establishment of breast cancer has been
proposed (23). In addition, three
theories support that CSCs derive from either mutated stem
(64) or progenitor (65) or de-differentiated cells (66). Based on the findings of the present
study, it can be conclude that: First, the progenitor mouse
epithelial mammary cell, such as stem cells endowed by a lower
methylation, provides an amenable cellular environment for a high
occurrence of VL30 retrotransposition events; second, LTR
retrotransposition renders progenitor cells ‘vulnerable’ to
retrotransposition-induced cancer; third, a number of new
retrotransposon-copy integrations associated with cancer-related
genes and activation of regulatory networks, orchestrated by key
transcription factors, is a critical factor for induced EMT and
CSCs generation; fourth, indeed, there is a synergy between LTR
retrotransposition and cancer as in a retrotransposition-positive
progenitor cell induced EMT and CSCs co-exist; and fifth, selected
cells in a bulk HC11 cell population, being more permissive for
elevated VL30 retrotransposition levels, have a greater tendency to
acquire mesenchymal, CSCs and tumorigenesis properties which mirror
a marker of such cells.
Supplementary Material
Supporting Data
Acknowledgements
The authors would like to thank: Dr Violetta A.
Maltabe and Dr Alexandra Ntouchaniari (Laboratory of General
Biology, School of Health Sciences, Faculty of Medicine, University
of Ioannina); Dr Chara Pitta and Dr Christiana Neophytou
(Department of Biological Sciences, Faculty of Pure and Applied
Sciences, University of Cyprus), and Dr Valentinos Kounnis (Human
Cancer Biobank Center, University of Ioannina, Greece) for
providing technical assistance.
Funding
This study was financially supported by the
Research Promotion Foundation (RPF), Desmi 2009–2010, Project code
PENEK/0609/05, Cyprus. The RPF is the national body responsible for
supporting and promoting research, technological development and
innovation.
Availability of data and materials
All data generated or analyzed during this study
are included in this published article or are available from the
corresponding author on reasonable request.
Authors' contributions
ST performed the laboratory experiments. GV, GM and
DN performed and analyzed the FACS data. SM and FG assisted with
the EMT experiments. PP performed the in vivo experiments.
PK designed and directed the CSC analysis. AC and PP assisted with
the analysis of the tumor sections. AIC and TT conceived the
experiments and wrote the manuscript. All authors read and approved
the final manuscript.
Ethics approval and consent to
participate
Statement on the welfare of animals: Balb/c mice
were housed in the animal facility of the University of Cyprus in a
pathogen-free environment according to the European Commission
Recommendations 2007/526 and the European Directive 2010/63. The
experimental procedures were conducted in agreement with the animal
welfare regulations and guidelines of the Republic of Cyprus and
the European Union under a project license acquired by the Cyprus
Veterinary Services (No CY/EXP/PR.L6/2011), the Cyprus national
authority for monitoring animal research.
Patient consent for publication
Not applicable.
Competing interests
The authors declare that they have no competing
interests.
References
|
1
|
Markopoulos G, Noutsopoulos D, Mantziou S,
Gerogiannis D, Thrasyvoulou S, Vartholomatos G, Kolettas E and
Tzavaras T: Genomic analysis of mouse VL30 retrotransposons. Mob
DNA. 7:102016. View Article : Google Scholar : PubMed/NCBI
|
|
2
|
French NS and Norton JD: Structure and
functional properties of mouse VL30 retrotransposons. Biochim
Biophys Acta. 1352:33–47. 1997. View Article : Google Scholar : PubMed/NCBI
|
|
3
|
Noutsopoulos D, Markopoulos G, Koliou M,
Dova L, Vartholomatos G, Kolettas E and Tzavaras T: Vanadium
induces VL30 retrotransposition at an unusually high level: A
possible carcinogenesis mechanism. J Mol Biol. 374:80–90. 2007.
View Article : Google Scholar : PubMed/NCBI
|
|
4
|
Tzavaras T, Eftaxia S, Tavoulari S, Hatzi
P and Angelidis C: Factors influencing the expression of endogenous
reverse transcriptases and viral-like 30 elements in mouse NIH3T3
cells. Int J Oncol. 23:1237–1243. 2003.PubMed/NCBI
|
|
5
|
Tzavaras T, Kalogera C, Eftaxia S,
Saragosti S and Pagoulatos GN: Clone-specific high-frequency
retrotransposition of a recombinant virus containing a VL30
promoter in SV40-transformed NIH3T3 cells. Biochim Biophys Acta.
1442:186–198. 1998. View Article : Google Scholar : PubMed/NCBI
|
|
6
|
Song X, Sun Y and Garen A: Roles of PSF
protein and VL30 RNA in reversible gene regulation. Proc Natl Acad
Sci USA. 102:12189–12193. 2005. View Article : Google Scholar : PubMed/NCBI
|
|
7
|
Wang G, Cui Y, Zhang G, Garen A and Song
X: Regulation of proto-oncogene transcription, cell proliferation,
and tumorigenesis in mice by PSF protein and a VL30 noncoding RNA.
Proc Natl Acad Sci USA. 106:16794–16798. 2009. View Article : Google Scholar : PubMed/NCBI
|
|
8
|
Song X, Sui A and Garen A: Binding of
mouse VL30 retrotransposon RNA to PSF protein induces genes
repressed by PSF: Effects on steroidogenesis and oncogenesis. Proc
Natl Acad Sci USA. 101:621–626. 2004. View Article : Google Scholar : PubMed/NCBI
|
|
9
|
Costain WJ, Rasquinha I, Graber T,
Luebbert C, Preston E, Slinn J, Xie X and MacManus JP: Cerebral
ischemia induces neuronal expression of novel VL30 mouse
retrotransposons bound to polyribosomes. Brain Res. 1094:24–37.
2006. View Article : Google Scholar : PubMed/NCBI
|
|
10
|
Scolnick EM, Vass WC, Howk RS and Duesberg
PH: Defective retrovirus-like 30S RNA species of rat and mouse
cells are infectious if packaged by type C helper virus. J Virol.
29:964–972. 1979. View Article : Google Scholar : PubMed/NCBI
|
|
11
|
Song X, Wang B, Bromberg M, Hu Z,
Konigsberg W and Garen A: Retroviral-mediated transmission of a
mouse VL30 RNA to human melanoma cells promotes metastasis in an
immunodeficient mouse model. Proc Natl Acad Sci USA. 99:6269–6273.
2002. View Article : Google Scholar : PubMed/NCBI
|
|
12
|
Noutsopoulos D, Vartholomatos G, Kolaitis
N and Tzavaras T: SV40 large T antigen up-regulates the
retrotransposition frequency of viral-like 30 elements. J Mol Biol.
361:450–461. 2006. View Article : Google Scholar : PubMed/NCBI
|
|
13
|
Noutsopoulos D, Markopoulos G,
Vartholomatos G, Kolettas E, Kolaitis N and Tzavaras T: VL30
retrotransposition signals activation of a caspase-independent and
p53-dependent death pathway associated with mitochondrial and
lysosomal damage. Cell Res. 20:553–562. 2010. View Article : Google Scholar : PubMed/NCBI
|
|
14
|
Boeke JD, Garfinkel DJ, Styles CA and Fink
GR: Ty elements transpose through an RNA intermediate. Cell.
40:491–500. 1985. View Article : Google Scholar : PubMed/NCBI
|
|
15
|
Georgiou I, Noutsopoulos D, Dimitriadou E,
Markopoulos G, Apergi A, Lazaros L, Vaxevanoglou T, Pantos K,
Syrrou M and Tzavaras T: Retrotransposon RNA expression and
evidence for retrotransposition events in human oocytes. Hum Mol
Genet. 18:1221–1228. 2009. View Article : Google Scholar : PubMed/NCBI
|
|
16
|
Goodier JL and Kazazian HH Jr:
Retrotransposons revisited: The restraint and rehabilitation of
parasites. Cell. 135:23–35. 2008. View Article : Google Scholar : PubMed/NCBI
|
|
17
|
Guarino M, Rubino B and Ballabio G: The
role of epithelial-mesenchymal transition in cancer pathology.
Pathology. 39:305–318. 2007. View Article : Google Scholar : PubMed/NCBI
|
|
18
|
Hugo H, Ackland ML, Blick T, Lawrence MG,
Clements JA, Williams ED and Thompson EW: Epithelial-mesenchymal
and mesenchymal-epithelial transitions in carcinoma progression. J
Cell Physiol. 213:374–383. 2007. View Article : Google Scholar : PubMed/NCBI
|
|
19
|
Papageorgis P, Lambert AW, Ozturk S, Gao
F, Pan H, Manne U, Alekseyev YO, Thiagalingam A, Abdolmaleky HM,
Lenburg M and Thiagalingam S: Smad signaling is required to
maintain epigenetic silencing during breast cancer progression.
Cancer Res. 70:968–978. 2010. View Article : Google Scholar : PubMed/NCBI
|
|
20
|
Barrallo-Gimeno A and Nieto MA: The Snail
genes as inducers of cell movement and survival: Implications in
development and cancer. Development. 132:3151–3161. 2005.
View Article : Google Scholar : PubMed/NCBI
|
|
21
|
Bhowmick NA, Neilson EG and Moses HL:
Stromal fibroblasts in cancer initiation and progression. Nature.
432:332–337. 2004. View Article : Google Scholar : PubMed/NCBI
|
|
22
|
Moreno-Bueno G, Portillo F and Cano A:
Transcriptional regulation of cell polarity in EMT and cancer.
Oncogene. 27:6958–6969. 2008. View Article : Google Scholar : PubMed/NCBI
|
|
23
|
Hayashida T, Jinno H, Kitagawa Y and
Kitajima M: Cooperation of cancer stem cell properties and
epithelial-mesenchymal transition in the establishment of breast
cancer metastasis. J Oncol. 2011:5914272011. View Article : Google Scholar : PubMed/NCBI
|
|
24
|
Mani SA, Guo W, Liao MJ, Eaton EN, Ayyanan
A, Zhou AY, Brooks M, Reinhard F, Zhang CC, Shipitsin M, et al: The
epithelial-mesenchymal transition generates cells with properties
of stem cells. Cell. 133:704–715. 2008. View Article : Google Scholar : PubMed/NCBI
|
|
25
|
Daniel CW, Young LJ, Medina D and DeOme
KB: The influence of mammogenic hormones on serially transplanted
mouse mammary gland. Exp Gerontol. 6:95–101. 1971. View Article : Google Scholar : PubMed/NCBI
|
|
26
|
Smith GH and Medina D: Re-evaluation of
mammary stem cell biology based on in vivo transplantation. Breast
Cancer Res. 10:2032008. View Article : Google Scholar : PubMed/NCBI
|
|
27
|
Van Keymeulen A, Rocha AS, Ousset M, Beck
B, Bouvencourt G, Rock J, Sharma N, Dekoninck S and Blanpain C:
Distinct stem cells contribute to mammary gland development and
maintenance. Nature. 479:189–193. 2011. View Article : Google Scholar : PubMed/NCBI
|
|
28
|
Holland JD, Klaus A, Garratt AN and
Birchmeier W: Wnt signaling in stem and cancer stem cells. Curr
Opin Cell Biol. 25:254–264. 2013. View Article : Google Scholar : PubMed/NCBI
|
|
29
|
Zhou W, Wang G and Guo S: Regulation of
angiogenesis via Notch signaling in breast cancer and cancer stem
cells. Biochim Biophys Acta. 1836:304–320. 2013.PubMed/NCBI
|
|
30
|
Dontu G, Abdallah WM, Foley JM, Jackson
KW, Clarke MF, Kawamura MJ and Wicha MS: In vitro propagation and
transcriptional profiling of human mammary stem/progenitor cells.
Genes Dev. 17:1253–1270. 2003. View Article : Google Scholar : PubMed/NCBI
|
|
31
|
Al-Hajj M, Wicha MS, Benito-Hernandez A,
Morrison SJ and Clarke MF: Prospective identification of
tumorigenic breast cancer cells. Proc Natl Acad Sci USA.
100:3983–3988. 2003. View Article : Google Scholar : PubMed/NCBI
|
|
32
|
Goodier JL: Restricting retrotransposons:
A review. Mob DNA. 7:162016. View Article : Google Scholar : PubMed/NCBI
|
|
33
|
Wernig M, Meissner A, Foreman R, Brambrink
T, Ku M, Hochedlinger K, Bernstein BE and Jaenisch R: In vitro
reprogramming of fibroblasts into a pluripotent ES-cell-like state.
Nature. 448:318–324. 2007. View Article : Google Scholar : PubMed/NCBI
|
|
34
|
Ball RK, Friis RR, Schoenenberger CA,
Doppler W and Groner B: Prolactin regulation of beta-casein gene
expression and of a cytosolic 120-kd protein in a cloned mouse
mammary epithelial cell line. EMBO J. 7:2089–2095. 1988. View Article : Google Scholar : PubMed/NCBI
|
|
35
|
Humphreys RC and Rosen JM: Stably
transfected HC11 cells provide an in vitro and in vivo model system
for studying Wnt gene function. Cell Growth Differ. 8:839–849.
1997.PubMed/NCBI
|
|
36
|
Williams C, Helguero L, Edvardsson K,
Haldosen LA and Gustafsson JA: Gene expression in murine mammary
epithelial stem cell-like cells shows similarities to human breast
cancer gene expression. Breast Cancer Res. 11:R262009. View Article : Google Scholar : PubMed/NCBI
|
|
37
|
Montesano R, Soriano JV, Fialka I and Orci
L: Isolation of EpH4 mammary epithelial cell subpopulations which
differ in their morphogenetic properties. In Vitro Cell Dev Biol
Anim. 34:468–477. 1998. View Article : Google Scholar : PubMed/NCBI
|
|
38
|
Ostertag EM, Prak ET, DeBerardinis RJ,
Moran JV and Kazazian HH Jr: Determination of L1 retrotransposition
kinetics in cultured cells. Nucleic Acids Res. 28:1418–1423. 2000.
View Article : Google Scholar : PubMed/NCBI
|
|
39
|
Puschendorf M, Stein P, Oakeley EJ,
Schultz RM, Peters AH and Svoboda P: Abundant transcripts from
retrotransposons are unstable in fully grown mouse oocytes. Biochem
Biophys Res Commun. 347:36–43. 2006. View Article : Google Scholar : PubMed/NCBI
|
|
40
|
Xiong Y and Eickbush TH: Origin and
evolution of retroelements based upon their reverse transcriptase
sequences. EMBO J. 9:3353–3362. 1990. View Article : Google Scholar : PubMed/NCBI
|
|
41
|
Langmead B and Salzberg SL: Fast
gapped-read alignment with Bowtie 2. Nat Methods. 9:357–359. 2012.
View Article : Google Scholar : PubMed/NCBI
|
|
42
|
M M: Cutadapt removes adapter sequences
from high-throughput sequencing reads. EMBnet J. 17:10–12. 2011.
View Article : Google Scholar
|
|
43
|
Voulgari A and Pintzas A:
Epithelial-mesenchymal transition in cancer metastasis: Mechanisms,
markers and strategies to overcome drug resistance in the clinic.
Biochim Biophys Acta. 1796:75–90. 2009.PubMed/NCBI
|
|
44
|
Jen J and Wang YC: Zinc finger proteins in
cancer progression. J Biomed Sci. 23:532016. View Article : Google Scholar : PubMed/NCBI
|
|
45
|
Davis NM, Sokolosky M, Stadelman K, Abrams
SL, Libra M, Candido S, Nicoletti F, Polesel J, Maestro R, D'Assoro
A, et al: Deregulation of the EGFR/PI3K/PTEN/Akt/mTORC1 pathway in
breast cancer: Possibilities for therapeutic intervention.
Oncotarget. 5:4603–4650. 2014. View Article : Google Scholar : PubMed/NCBI
|
|
46
|
Li X, Yang Q, Yu H, Wu L, Zhao Y, Zhang C,
Yue X, Liu Z, Wu H, Haffty BG, et al: LIF promotes tumorigenesis
and metastasis of breast cancer through the AKT-mTOR pathway.
Oncotarget. 5:788–801. 2014. View Article : Google Scholar : PubMed/NCBI
|
|
47
|
Barak V, Goike H, Panaretakis KW and
Einarsson R: Clinical utility of cytokeratins as tumor markers.
Clin Biochem. 37:529–540. 2004. View Article : Google Scholar : PubMed/NCBI
|
|
48
|
Merlo GR, Venesio T, Taverna D, Marte BM,
Callahan R and Hynes NE: Growth suppression of normal mammary
epithelial cells by wild-type p53. Oncogene. 9:443–453.
1994.PubMed/NCBI
|
|
49
|
Hancks DC and Kazazian HH Jr: Active human
retrotransposons: Variation and disease. Curr Opin Genet Dev.
22:191–203. 2012. View Article : Google Scholar : PubMed/NCBI
|
|
50
|
Yoder JA, Walsh CP and Bestor TH: Cytosine
methylation and the ecology of intragenomic parasites. Trends
Genet. 13:335–340. 1997. View Article : Google Scholar : PubMed/NCBI
|
|
51
|
Konisti S, Mantziou S, Markopoulos G,
Thrasyvoulou S, Vartholomatos G, Sainis I, Kolettas E, Noutsopoulos
D and Tzavaras T: H2O2 signals via iron induction of VL30
retrotransposition correlated with cytotoxicity. Free Radic Biol
Med. 52:2072–2081. 2012. View Article : Google Scholar : PubMed/NCBI
|
|
52
|
Markopoulos G, Noutsopoulos D, Mantziou S,
Vartholomatos G, Monokrousos N, Angelidis C and Tzavaras T: Arsenic
induces VL30 retrotransposition: The involvement of oxidative
stress and heat-shock protein 70. Toxicol Sci. 134:312–322. 2013.
View Article : Google Scholar : PubMed/NCBI
|
|
53
|
Deugnier MA, Faraldo MM, Teuliere J,
Thiery JP, Medina D and Glukhova MA: Isolation of mouse mammary
epithelial progenitor cells with basal characteristics from the
Comma-Dbeta cell line. Dev Biol. 293:414–425. 2006. View Article : Google Scholar : PubMed/NCBI
|
|
54
|
Bloushtain-Qimron N, Yao J, Snyder EL,
Shipitsin M, Campbell LL, Mani SA, Hu M, Chen H, Ustyansky V,
Antosiewicz JE, et al: Cell type-specific DNA methylation patterns
in the human breast. Proc Natl Acad Sci USA. 105:14076–14081. 2008.
View Article : Google Scholar : PubMed/NCBI
|
|
55
|
Heidmann T, Heidmann O and Nicolas JF: An
indicator gene to demonstrate intracellular transposition of
defective retroviruses. Proc Natl Acad Sci USA. 85:2219–2223. 1988.
View Article : Google Scholar : PubMed/NCBI
|
|
56
|
Maston GA, Evans SK and Green MR:
Transcriptional regulatory elements in the human genome. Annu Rev
Genomics Hum Genet. 7:29–59. 2006. View Article : Google Scholar : PubMed/NCBI
|
|
57
|
Lamouille S, Xu J and Derynck R: Molecular
mechanisms of epithelial-mesenchymal transition. Nature reviews.
Mol Cell Biol. 15:178–196. 2014.
|
|
58
|
Vesuna F, van Diest P, Chen JH and Raman
V: Twist is a transcriptional repressor of E-cadherin gene
expression in breast cancer. Biochem Biophys Res Commun.
367:235–241. 2008. View Article : Google Scholar : PubMed/NCBI
|
|
59
|
Moustakas A and Heldin P: TGFβ and
matrix-regulated epithelial to mesenchymal transition. Biochim
Biophys Acta. 1840:2621–2634. 2014. View Article : Google Scholar : PubMed/NCBI
|
|
60
|
Adissu HA, Asem EK and Lelievre SA:
Three-dimensional cell culture to model epithelia in the female
reproductive system. Reprod Sci. 14:11–19. 2007. View Article : Google Scholar : PubMed/NCBI
|
|
61
|
Tantin D: Oct transcription factors in
development and stem cells: insights and mechanisms. Development.
140:2857–2866. 2013. View Article : Google Scholar : PubMed/NCBI
|
|
62
|
Fuxe J, Vincent T and Garcia de Herreros
A: Transcriptional crosstalk between TGF-beta and stem cell
pathways in tumor cell invasion: Role of EMT promoting Smad
complexes. Cell Cycle. 9:2363–2374. 2010. View Article : Google Scholar : PubMed/NCBI
|
|
63
|
Duensing S and Munger K: Centrosomes,
genomic instability, and cervical carcinogenesis. Crit Rev Eukaryot
Gene Expr. 13:9–23. 2003. View Article : Google Scholar : PubMed/NCBI
|
|
64
|
Ponti D, Zaffaroni N, Capelli C and
Daidone MG: Breast cancer stem cells: An overview. Eur J Cancer.
42:1219–1224. 2006. View Article : Google Scholar : PubMed/NCBI
|
|
65
|
Stingl J and Caldas C: Molecular
heterogeneity of breast carcinomas and the cancer stem cell
hypothesis. Nat Rev Cancer. 7:791–799. 2007. View Article : Google Scholar : PubMed/NCBI
|
|
66
|
Nishi M, Sakai Y, Akutsu H, Nagashima Y,
Quinn G, Masui S, Kimura H, Perrem K, Umezawa A, Yamamoto N, et al:
Induction of cells with cancer stem cell properties from
nontumorigenic human mammary epithelial cells by defined
reprogramming factors. Oncogene. 33:643–652. 2014. View Article : Google Scholar : PubMed/NCBI
|