Introduction
Prostate cancer (PCa) is one of the most common
malignancies of the urinary system among men. According to
estimates in the literature, the incidence of prostate cancer
accounts for 20% of all male cases, and the mortality rate accounts
for 10%, second only to lung cancer (1). Although the incidence and mortality
rates of PCa in China are considerably lower than those in Western
countries, the incidence and mortality rate of early-stage PCa in
Chinese males are increasing annually, due to the gradual
westernization of the lifestyles of Chinese people (2). The standard treatment for PCa is
hormone therapy, however, castration resistance is often developed
following androgen deprivation therapy (ADT). At present, the
molecular mechanism of PCa resistance remains elusive.
The most effective treatment for early localized
non-metastatic PCa, known as androgen-dependent PCa (ADPC), is
surgical castration with ADT, which inhibits androgen production or
blocks the function of androgen receptor (AR) (3). However, after 18–24 months of
treatment (4), the therapeutic
effect of ADT gradually declines, with almost all patients
eventually progressing and developing hormone resistance or
castration-resistant PCa (CRPC) (5), followed by advanced fatal PCa.
Prostate neuroendocrine carcinoma is a subtype of invasive CRPC
with a high degree of malignancy and low survival rates (6). Most evidence has revealed that
neuroendocrine PCa (NEPC) is becoming resistant to ADT
treatment.
NEPC exhibits 50% ERG rearrangement (7) and 63% PTEN (8), similar to CRPC (9). In addition, the cellular variability
of NEPC is associated with the reduced or absent expression of AR
and AR downstream genes, such as prostate-specific antigen (PSA).
NEPC can express NSE, chromogranin A (CgA), SYP and other
neuroendocrine markers associated with certain genomic alterations,
including RB1 (8) and TP53
deletions and mutations, and certain specific pathway disorders
involving neurons, stem cell programs, and EMT (10).
N-Myc proto-oncogene protein (N-Myc) is a member of
the Myc family of transcription factors. The high expression of
N-Myc can lead to uncontrolled proliferation, affect cell
metabolism, and promote cell invasion, apoptosis, and
differentiation (11). N-Myc
expression disorders are associated with the development of a
variety of tumors, including central nervous system tumors, such as
neuroblastoma (12),
medulloblastoma (13,14) and pleomorphic glioma (15,16),
as well as pancreatic (17) and
other types of cancer. N-Myc overexpression has been revealed to
drive NEPC tumorigenesis and we most recently demonstrated that
N-Myc can regulate an miRNA/ATM pathway to promote the progression
of PCa (18).
Fascin (FSCN1) is an actin-binding protein that
participates in cytoskeleton regulation and forms filamentous
pseudopods to initiate cell movement and migration (19). The absence of FSCN1 protein
expression in most adult epithelial cells, including lung
epithelial cells (20), suggests
that it is optional for normal physiology and metabolism in
untransformed epithelia. However, FSCN1 overexpression has been
revealed to play an important role in tumorigenesis (21), metastasis (22) and cancer stemness (23). Notably, metastatic cancer cells
markedly increase the expression of FSCN1 (24–26).
In the present study, it was revealed that the
expression of N-Myc and FSCN1 was considerably higher in PCa
tissues than that in benign prostatic hyperplasia (BPH) tissues.
The expression of N-Myc and FSCN1 in PCa cells was also examined,
and it was found that N-Myc can upregulate FSCN1 expression in PCa
cells. Furthermore, it was demonstrated that FSCN1 mediated, at
least partially, N-Myc-induced aggressive phenotypes of PCa,
including proliferation, migration and neuroendocrine
differentiation.
Materials and methods
Collection of clinical samples
A total of 95 PCa tissue samples and 64 BPH tissue
samples were collected from patients who had not received endocrine
therapy between January 2015 and December 2016 at the First
Affiliated Hospital of Anhui Medical University with the consent of
all participants and approval by the Biomedical Ethics Committee of
Anhui Medical University (approval no. 20170209). This study
retrospectively collected clinical data, such as age, PSA levels,
TNM clinical staging, Gleason scores, and metastatic status from
the medical records of patients. PCa samples can be divided into
three groups in accordance with the Gleason score. To determine the
variation in adenocarcinoma structure in different regions of the
same tumor, the scores of primary and secondary differentiation
were scored separately, and the total values of the two parts were
calculated. By defining different output criteria, we classified
Gleason scores of >7 as poorly differentiated. Other scores were
divided into middle and high differentiation. TNM clinical staging
was performed in accordance with the AJCC clinical staging method
(8th edition). The present study was approved by the institutional
review board of Anhui Medical University.
Cell culture and cell lines
Human LNCaP cells with ADPC characteristics were
obtained from the Cell Bank of the Chinese Academy of Sciences.
C4-2 cells with CRPC characteristics and PC3 cells with NEPC
characteristics were provided by the Institute of Urology of the
First Affiliated Hospital of Anhui Medical University. All cells
were cultured in RPMI-1640 medium (cat. no. SH30809.01; HyClone;
Cytiva) supplemented with 10% fetal bovine serum (cat. no.
04-001-01A; Biological Industries) and 1% penicillin/streptomycin
(cat. no. C0222; Beyotime Institute of Biotechnology). All cells
were incubated at 37°C in a 5% CO2 and 95%
air-humidified atmosphere. N-Myc and FSCN1 were overexpressed in
LNCaP and C4-2 cell lines. In addition, FSCN1 was knocked down
using FSCN1/short hairpin RNA (shRNA)s in cell lines with N-Myc
overexpression.
Overexpression with lentiviral
transfection
The CONSITE database was used for transcription
factor binding site analysis (27).
The FSCN1 promoter gene sequence was used as the analyzing
template, and the cutoff value of the transcription factor was set
to 88%, and it was revealed that the N-Myc binding site was indeed
present in the promoter region of FSCN1. Thus, we further explored
the relationship between the two genes. LNcap and C4-2 cell lines
stably expressing N-Myc, FSCN1, no-load control and blank control
were constructed with lentiviral transfection in both LNCap and
C4-2 cell lines. LNCap cells were cultured in a 6-cm dish to 80–90%
confluence, then the cells were diluted to 1×10⁵
cells/ml. Subsequently, 5×10⁴ cells/well were inoculated
into a 96-well plate, mixed and placed at 37°C and 5%
CO2 culture for 24 h. The lentiviral stock solution was
diluted 1:10, the culture solution was discarded in each well, 100
µl of diluted virus solution was added, and a blank control group
was set concurrently, and the culture was continued for 24 h. Then,
the virus solution was removed from each well and 100 µl RPMI-1640
medium was added to continue culturing for 72 or 96 h. The
lentiviral infection efficiency was observed under a microscope
(white light and fluorescence; magnification, ×100).
Design short hairpin RNA to interfere
with FSCN1 expression
Plasmid-encoded short hairpin RNA (shRNA-FSCN1) and
shRNA-control were provided by Shanghai GenePharma Co., Ltd. When
these cells reached 50% confluence in 6-multiwell plates, they were
transfected using a shRNA targeting the FSCN1 (Shanghai GenePharma
Co., Ltd.) and 8 µl Lipofectamine 2000 (Thermo Fisher Scientific,
Inc.) in Opti-MEM medium (Thermo Fisher Scientific, Inc.), and the
serum medium was replaced after 4–6 h. The sequences of shRNA-FSCN1
and shRNA-control were designed as follows:
5′-CTCAGAGCTCTTCCTCATGAA-3′ and 5′-TTCTCCGAACGTGTCACGT-3′. The
efficiency of FSCN1-knockdown was analyzed by RT-qPCR and western
blotting.
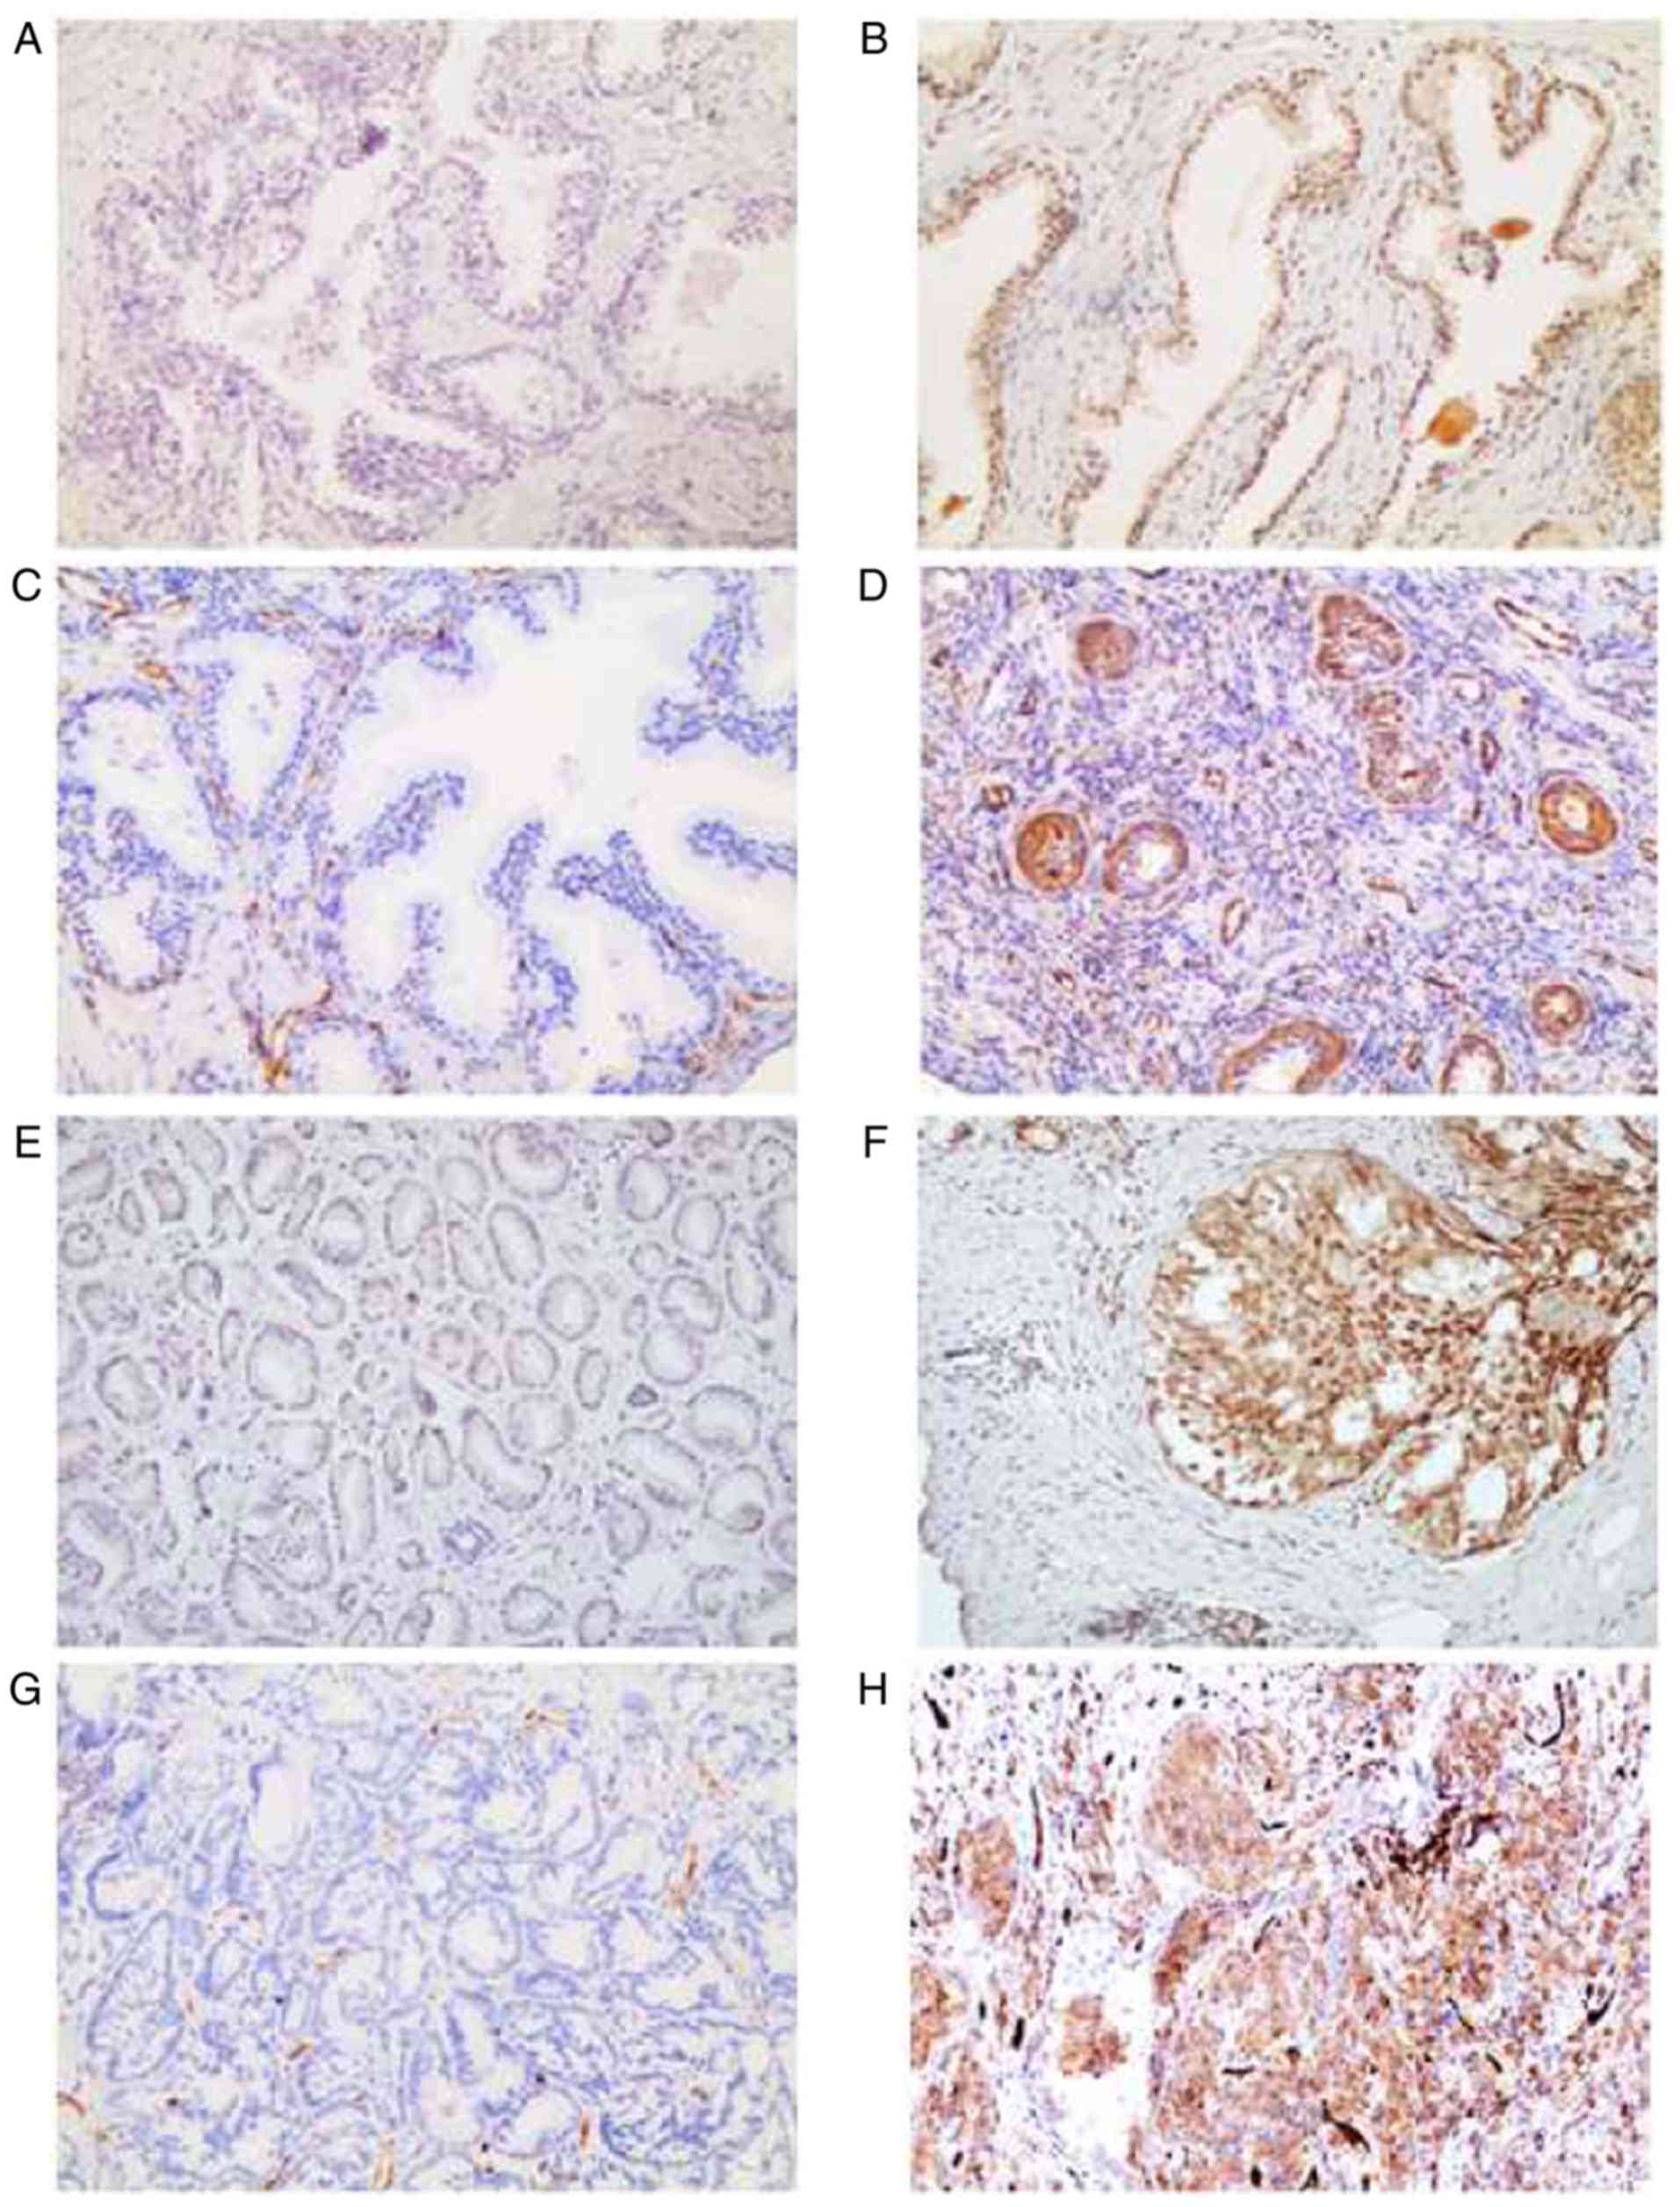
Immunohistochemistry (IHC)
Paraffin tissues from benign prostate hyperplasic
and PCa tissues were processed into 4 µm-thick tissue sections.
Following deparaffinization and rehydration with xylene through
graded ethanol, the sections were boiled in 10 mM citrate buffer
(pH 6.0) for 10 min for heat-induced antigen retrieval and blocked
with 3% H2O2 for 10 min to block endogenous
peroxidase activity. Sections were incubated overnight with
antibodies against the intracellular domain of N-Myc (cat. no.
51705S; 1:640; Cell Signaling Technology, Inc.) or FSCN1 (cat. no.
ab126772; 1:200; Abcam). N-Myc-positive staining was localized to
the nucleus and/or cytoplasm, and FSCN1-positive staining was
localized to the cytoplasm and was positive for pale yellow to tan
particles with diffuse homogeneity. Neuroblastoma tissue was used
as a positive control of N-Myc, Hodgkin lymphoma tissue was used as
a positive control of FSCN1, PBS was used as a negative control
instead of a primary antibody, and tissues were visualized by DAB
staining. The paraffin sections were observed under the microscope
by two pathologists, who have worked at The First Affiliated
Hospital of Anhui Medical University for numerous years, to be
scored and graded. N-Myc staining was located in the nucleus or
nucleus/cytoplasm, and FSCN1 staining was located in the cytoplasm,
which had brown particles. The evaluation of immunohistochemical
staining results was based on the proportion of positive cells in
the total number of cells and the staining intensity score. The
definition of the immunohistochemical positive expression of N-Myc
and FSCN-1 was as follows: i) According to the score of dyeing
intensity, 0 points for no coloring, 1 point for light yellow, 2
points for brown and 3 points for tan; ii) according to the
percentage of positive cells, a score of ≤25% was 1 point, 26–50% 2
points and >50% 3 points; iii) after multiplying the two results
into the final result score, scores of ≤6 were placed into the
low-expression group and scores of >6 into the high-expression
group.
Cell proliferation assay
After C4-2/Vector, C4-2/N-Myc, C4-2/N-Myc/shFSCN1
and C4-2/FSCN1 cells were grown to the logarithmic growth phase,
3,000 cells were isolated and plated into three 96-well plates.
Concurrently, duplicate wells and blank control wells were set, and
culture plates were placed at 37°C and 5% CO2 culture
for 24, 48 and 72 h, and then 10 µl CCK-8 (cat. no. BB-4202-500T;
BestBio) solution was added to each well, and incubation was
continued in the incubator for 1 h. Finally, the absorbance of each
well was measured at a wavelength of 450 nm using a microplate
reader, and the OD value was read. All cell proliferation assays
were repeated in triplicate.
Wound healing assay
In total, 5×10⁵ C4-2/Vector, C4-2/N-Myc
and C4-2/FSCN1 cells were inoculated into 6-well plates, and
cultured to 80–90% fusion in a 37°C incubator. The following day,
two parallel lines were drawn in each cell-containing well with a
10-µl pipette tip. The cells were rinsed with PBS solution to
remove the non-migrated cells, serum-free medium was added, and
incubation continued in a 37°C and 5% CO2 incubator.
Finally, the cells were observed and images were captured with an
inverted microscope (magnification, ×10) at 0, 24, 48 and 72 h.
RT-qPCR
Total RNA was extracted using TRIzol reagent (Thermo
Fisher Scientific, Inc.). Next, RNA concentration and purity were
determined using an ultramicronucleic acid protein detector. The
amount of RNA required in the reverse transcription reaction system
using cDNA Synthesis Kit (Takara Bio, Inc.) was calculated on the
basis of the measured RNA concentration, and RT was performed to
obtain cDNA in a final volume of 20 µl. An aliquot of the resulting
cDNA (1 µl) was diluted at 1:5 and used for qPCR assays performed
in 20-µl reactions containing 10 µl 2X SYBR Premix Ex Taq II
(Takara Bio, Inc.). Assays were performed in triplicate, and
control qPCR reactions with GAPDH as a reference for normalization
were included. Default amplification conditions of the ABI 7500
Fast Real-Time PCR System were used. The comparative Cq method
(2ΔΔCq) method was used for expression analysis
(28). The experiment was repeated
twice (n=2). The RT-qPCR thermocycling conditions were as follows:
Initial denaturation (95°C for 30 sec), 40 cycles of denaturation
(95°C for 5 sec) and annealing (60°C for 34 sec). The primers used
in the present study were as follows: GAPDH forward,
5′-CATGAGAAGTATGACAACAGCCT-3′ and reverse,
5′-AGTCCTTCCACGATACCAAAGT-3′; N-Myc forward,
5′CACGTCCGCTCAAGAGTGTC-3′ and reverse, 5′-GTTTCTGCGACGCTCACTGT-3′;
and FSCN1 forward, 5′-GGGGAGCATGGCTTCATC-3′ and reverse,
5′-TGCCCACCGTCCAGTATTT-3′.
Western blot analysis
Total protein was extracted from PCa cell lines
using RIPA buffer (50 mM Tris, pH 7.4, 150 mM NaCl, 1 mM EDTA) and
1% phenylmethanesulfonyl fluoride, and the protein concentration
was determined by BCA assay (Beyotime Institute of Biotechnology).
Equal amounts of protein lysate (20 µg per lane) were loaded onto
10% polyacrylamide gels and subsequently transferred to
nitrocellulose membranes (GE Healthcare; Cytiva). Then, the
membranes were blocked with 5% skimmed milk powder and sealed at
room temperature for 1 h. Subsequently, the membranes were
incubated with primary antibodies at 4°C overnight and with the
secondary antibodies at room temperature for 1 h. Finally, the
results were visualized using an ECL blot analysis system (Bioshine
ChemiQ series; Bioshine). Immunoblotting was performed using the
following antibodies: Anti-N-Myc (product no. 51705S; 1:1,000) and
anti-AR (product no. 5153S; 1:2,000) from CST Signaling Technology,
Inc., anti-GAPDH (cat. no. 10494-1-AP; 1:1,000) and anti-CgA (cat.
no. 60135-1-Ig; 1:2,000) both from ProteinTech Group Inc., and
anti-FSCN1 (cat. no. ab126772; 1:10,000) from Abcam. Goat
anti-mouse secondary antibody (cat. no. A0216; 1:5,000) and goat
anti-rabbit secondary antibody (cat. no. A0208; 1:5,000) were
purchased from Beyotime Institute of Biotechnology.
Statistical analysis
Data were subjected to statistical analysis using
SPSS 16.0 software (SPSS Inc.). The difference between the two
groups of qualitative data was compared through χ2 test.
Quantitative data were compared using paired t-test. Spearman's
correlation was performed to assess the correlation between N-Myc
and FSCN1 expression in PCa tissues. ANOVA was used to compare
multiple groups. Dunnett's post hoc test was used for variance
analysis when the variance was uneven, and Bonferroni was used for
variance analysis when the variance was uniform. In all cases,
P<0.05 was considered to indicate a statistically significant
difference (*, **, *** and **** symbols indicated the significance
of 0.05, 0.01, 0.001 and 0,0001 levels, respectively, as indicated
in the figures and legends.
Results
N-Myc and FSCN1 expression is
positively correlated and associated with tissue type and cancer
progression
Tissues were divided into benign prostatic
hyperplasia, PCa without bone metastasis and PCa with bone
metastasis, and the differences and clinical significance of the
three groups were analyzed through IHC analysis of the FFPE
sections. For the first time, we focused on the correlation between
N-Myc and FSCN1 in clinical prostate samples. IHC results indicated
that N-Myc and FSCN1 expression levels were higher in PCa than in
benign tissues (Fig. 1, Table I). IHC was used to analyze the
expression of clinical samples in detail. It was found that the
high expression of N-Myc was associated with Gleason score, TNM
stage and bone metastasis. The high expression of FSCN1 was
associated with Gleason score and bone metastasis (Table II).
 | Table I.The expression of N-Myc, FSCN1 in
prostate clinical samples. |
Table I.
The expression of N-Myc, FSCN1 in
prostate clinical samples.
|
|
| N-Myc |
| FSCN1 |
|
|---|
|
|
|
|
|
|
|
|---|
| Group | n | Low, n (%) | High, n (%) | P-value | Low, n (%) | High, n (%) | P-value |
|---|
| Benign
prostate | 64 | 56 (78.5) | 8 (12.5) | 0.035a | 57 (89.06) | 7 (10.94) |
<0.001b |
| PCa | 95 | 70 (73.68) | 25 (26.32) |
| 58 (61.05) | 37 (38.95) |
|
| Table II.Association between the expression of
N-Myc, FSCN1 and the clinicopathological features of prostate
cancer patients. |
Table II.
Association between the expression of
N-Myc, FSCN1 and the clinicopathological features of prostate
cancer patients.
|
|
| N-Myc
expression |
| FSCN1
expression |
|
|---|
|
|
|
|
|
|
|
|---|
|
Characteristics | n | Low, n (%) | High, n (%) | P-value | Low, n (%) | High, n (%) | P-value |
|---|
| Age, years |
|
|
|
|
|
|
|
|
≤69 | 48 | 33 (68.75) | 15 (31.25) | 0.270 | 33 (68.75) | 15 (31.25) | 0.120 |
|
>69 | 47 | 37 (78.72) | 10 (21.28) |
| 25 (53.19) | 22 (46.81) |
|
| PSA at initial
diagnosis (mg/l) |
|
|
|
|
|
|
|
|
<20 | 31 | 23 (74.19) | 8 (25.80) | 0.937 | 20 (64.52) | 11 (35.48) | 0.630 |
|
≥20 | 64 | 47 (73.43) | 17 (26.56) |
| 38 (59.38) | 26 (40.63) |
|
| Gleason score |
|
|
|
|
|
|
|
| ≤7 | 42 | 36 (85.71) | 6 (14.29) | 0.018a | 33 (78.57) | 9 (21.43) | 0.002b |
|
>7 | 53 | 34 (64.15) | 19 (35.85) |
| 25 (47.17) | 28 (52.83) |
|
| TNM stage |
|
|
|
|
|
|
|
|
I–II | 43 | 37 (86.05) | 6 (13.95) | 0.013a | 30 (69.77) | 13 (30.23) | 0.113 |
|
III–IV | 52 | 33 (63.46) | 19 (36.54) |
| 28 (53.85) | 24 (46.15) |
|
| Osseous
metastasis |
|
|
|
|
|
|
|
| No | 74 | 62 (83.78) | 12 (16.22) |
<0.001c | 51 (68.92) | 23 (31.08) | 0.003b |
|
Yes | 21 | 8 (38.10) | 13 (61.90) |
| 7 (33.33) | 14 (66.67) |
|
Notably, the expression of N-Myc and FSCN1 in PCa
has been reported separately, however the link between the two has
not been reported. The present findings suggested that the
expression of N-Myc and FSCN1 were weakly positively correlated
(Table III), and had a mutual
regulation and interact to promote the clinical progression of PCa.
The specific mechanism, however, requires further study. In
addition, we also attempted to study the binding site of N-Myc and
FSCN1, but suitable results were not obtained, and therefore the
data is not shown. In addition, the weak correlation between N-Myc
and FSCN1 may be related to insufficient sample size.
| Table III.Correlation between the expression of
N-Myc and FSCN1 in prostate cancer tissues. |
Table III.
Correlation between the expression of
N-Myc and FSCN1 in prostate cancer tissues.
|
| FSCN1 |
|
|
|
|---|
|
|
|
|
|
|
|---|
| N-Myc | High | Low | n | rs | P-value |
|---|
| High | 16 | 9 | 25 | 0.307 | 0.002a |
| Low | 21 | 49 | 70 |
|
|
| n | 37 | 58 | 95 |
|
|
Expression of AR, CgA, N-Myc and FSCN1
in PCa cell lines
The development of PCa can usually be divided into
three stages: ADPC, CRPC and neuroendocrine PCa NEPC. The LNCaP,
C4-2 and PC3 cells studied herein were from these three stages,
respectively.
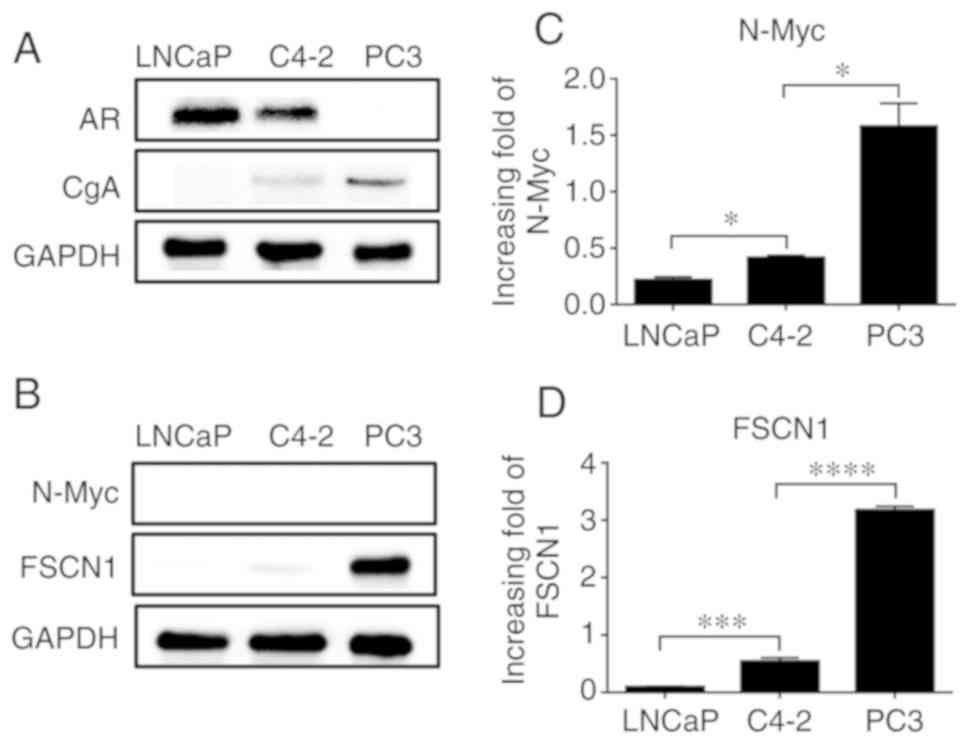
For in vitro studies, the protein expression
of AR and CgA was measured in LNCaP, C4-2 and PC3 cell lines, and
different hormone levels were revealed among them. Western blot
analysis revealed that the expression of AR in LNCaP and C4-2 cells
was significantly higher than that in PC3 cells, whereas the
expression of neuroendocrine marker CgA was lower than that in PC3
cells (Fig. 2A); (the effect on AR
and CgA expression at the mRNA level is not shown). This result
indicated that PC3 cells have higher neuroendocrine characteristics
and a higher malignancy. Next, we assessed the protein expression
of N-Myc, which was not detected, but FSCN1 protein expression was
detected (Fig. 2B). The reason that
N-Myc was not detected may be that the expression of N-Myc in PCa
cells is relatively low. At the mRNA level, the expression of N-Myc
and FSCN1 were detected in all three cell lines, and it was found
to gradually increase with the increase in cell malignancy; the
difference was statistically significant (Fig. 2C and D).
N-Myc overexpression upregulates FSCN1
expression in PCa cells
LNCaP and C4-2 cell lines were selected to construct
4 stable cell lines. Cell lines stably expressing N-Myc, FSCN1 and
no-load control were constructed with lentiviral transfection in
LNCaP, and C4-2 cell lines with green fluorescence accompanied by
western blot analysis (Fig. 3A).
Following N-Myc overexpression in PCa cells, increased expression
of FSCN1 in the overexpressed group was detected at the protein and
mRNA levels (Fig. 3B). The
expression of FSCN1 was knocked down with an interference plasmid,
and the expression of N-Myc was revealed to be increased in C4-2
cells (Fig. 3C). These results
indicated that there was a direct or indirect regulatory
relationship between N-Myc and FSCN1, and the binding site of N-Myc
to FSCN1 was predicted through the NCBI website, and it was
revealed that the N-Myc binding site was indeed present in the
promoter region of FSCN1. These mechanisms require further study
and discussion (the binding site of N-Myc and FSCN1 is not
presented).
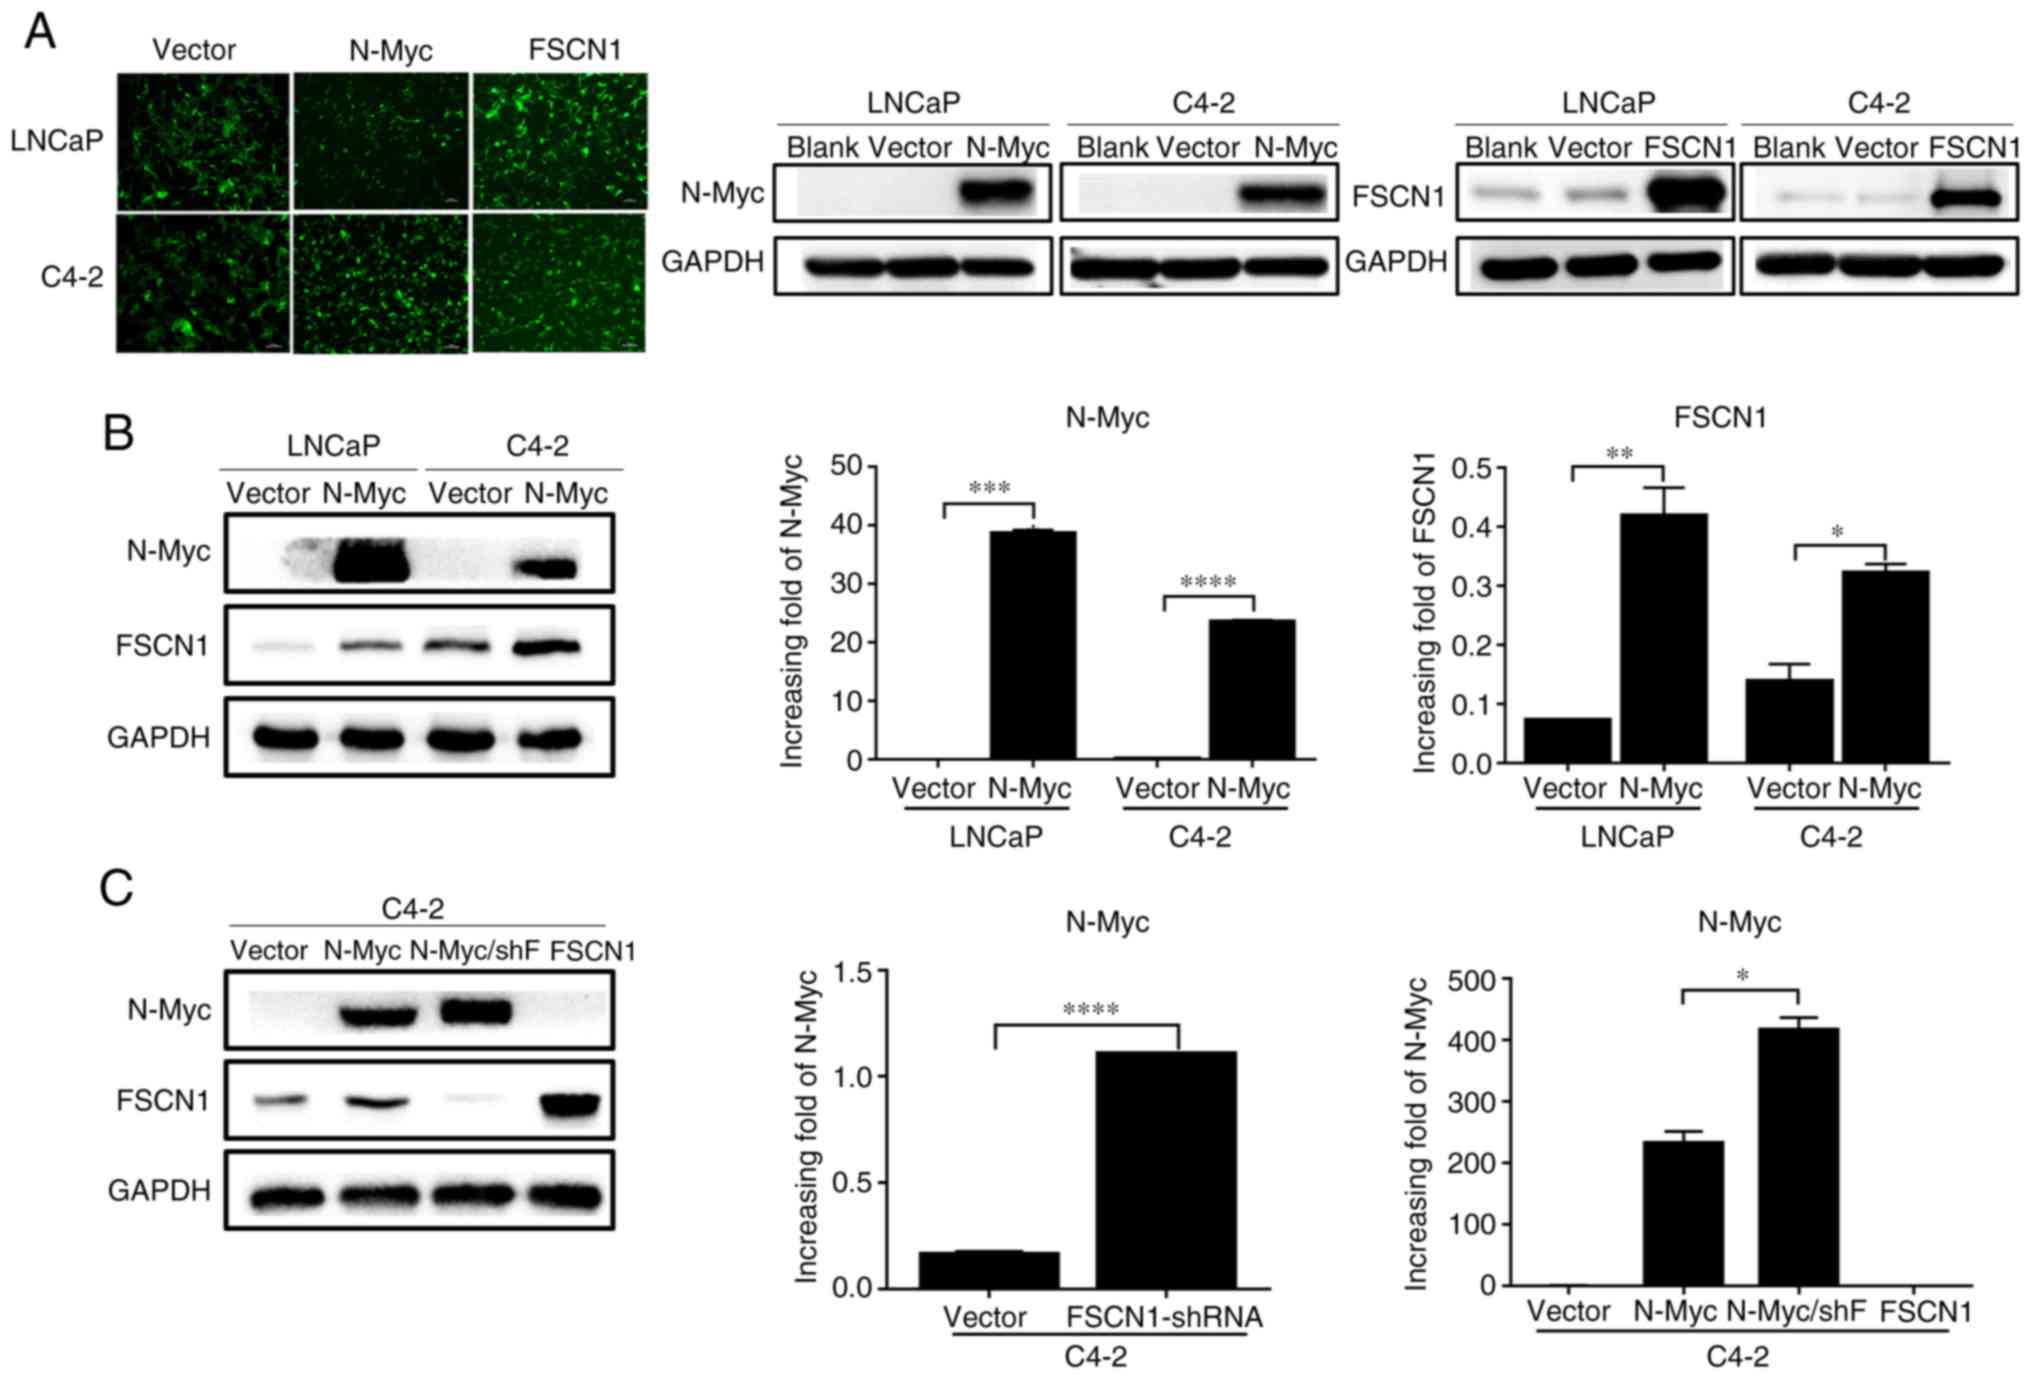 | Figure 3.Detection of PCa cells following
lentivirus overexpression of N-Myc and FSCN1. (A) Images of the
stable LNCaP/Vector, LNCaP/N-Myc, LNCaP/FSCN1, C4-2/Vector,
C4-2/N-Myc and C4-2/FSCN1 cell strains under a fluorescence
microscope (×100), accompanied by western blot analysis. (B)
Protein and mRNA expression of N-Myc and FSCN1 in LNCaP and C4-2
cell lines following N-Myc-overexpression. (C) Protein and mRNA
expression of N-Myc and in stable C4-2 transfectants. All
experiments were repeated in triplicate. *P<0.05, **P<0.01,
***P<0.001 and ****P<0.0001. PCa, prostate cancer; N-Myc
proto-oncogene protein; FSCN1, fascin; shF, short hairpin RNA
FSCN1. |
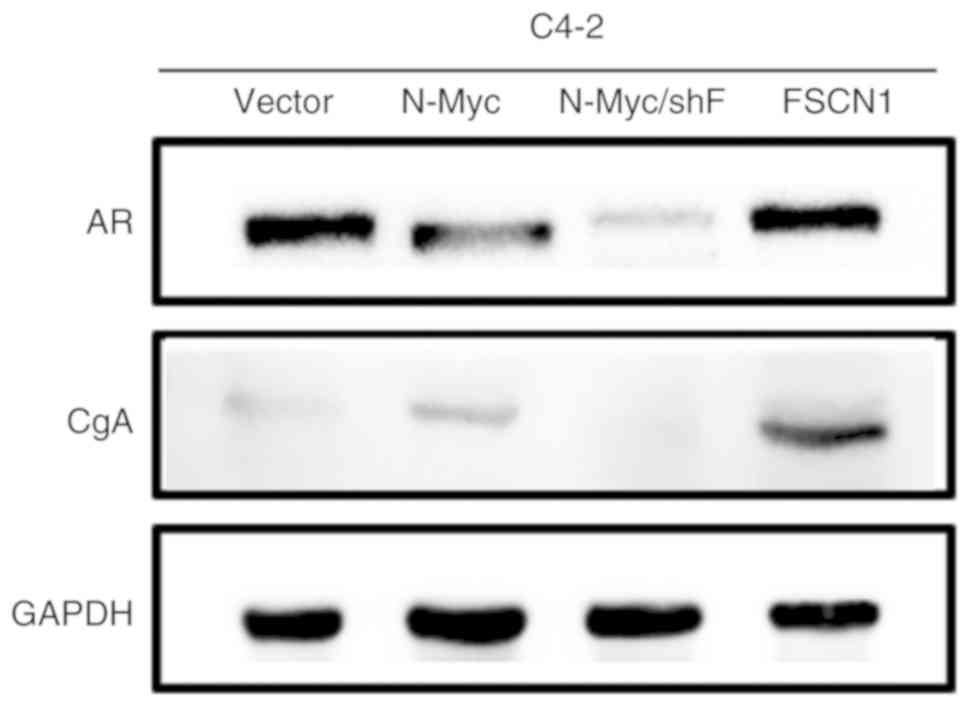
Effects of N-Myc and FSCN1 on
neuroendocrine markers in PCa cells
The overexpression of N-Myc in C4-2 cells could
reduce the expression of AR in PCa cells and promote that of CgA.
The overexpression of FSCN1 could increase the expression of
neuroendocrine marker CgA. The expression of AR and CgA was reduced
following FSCN1 knockdown in C4-2/N-Myc cells (Fig. 4).
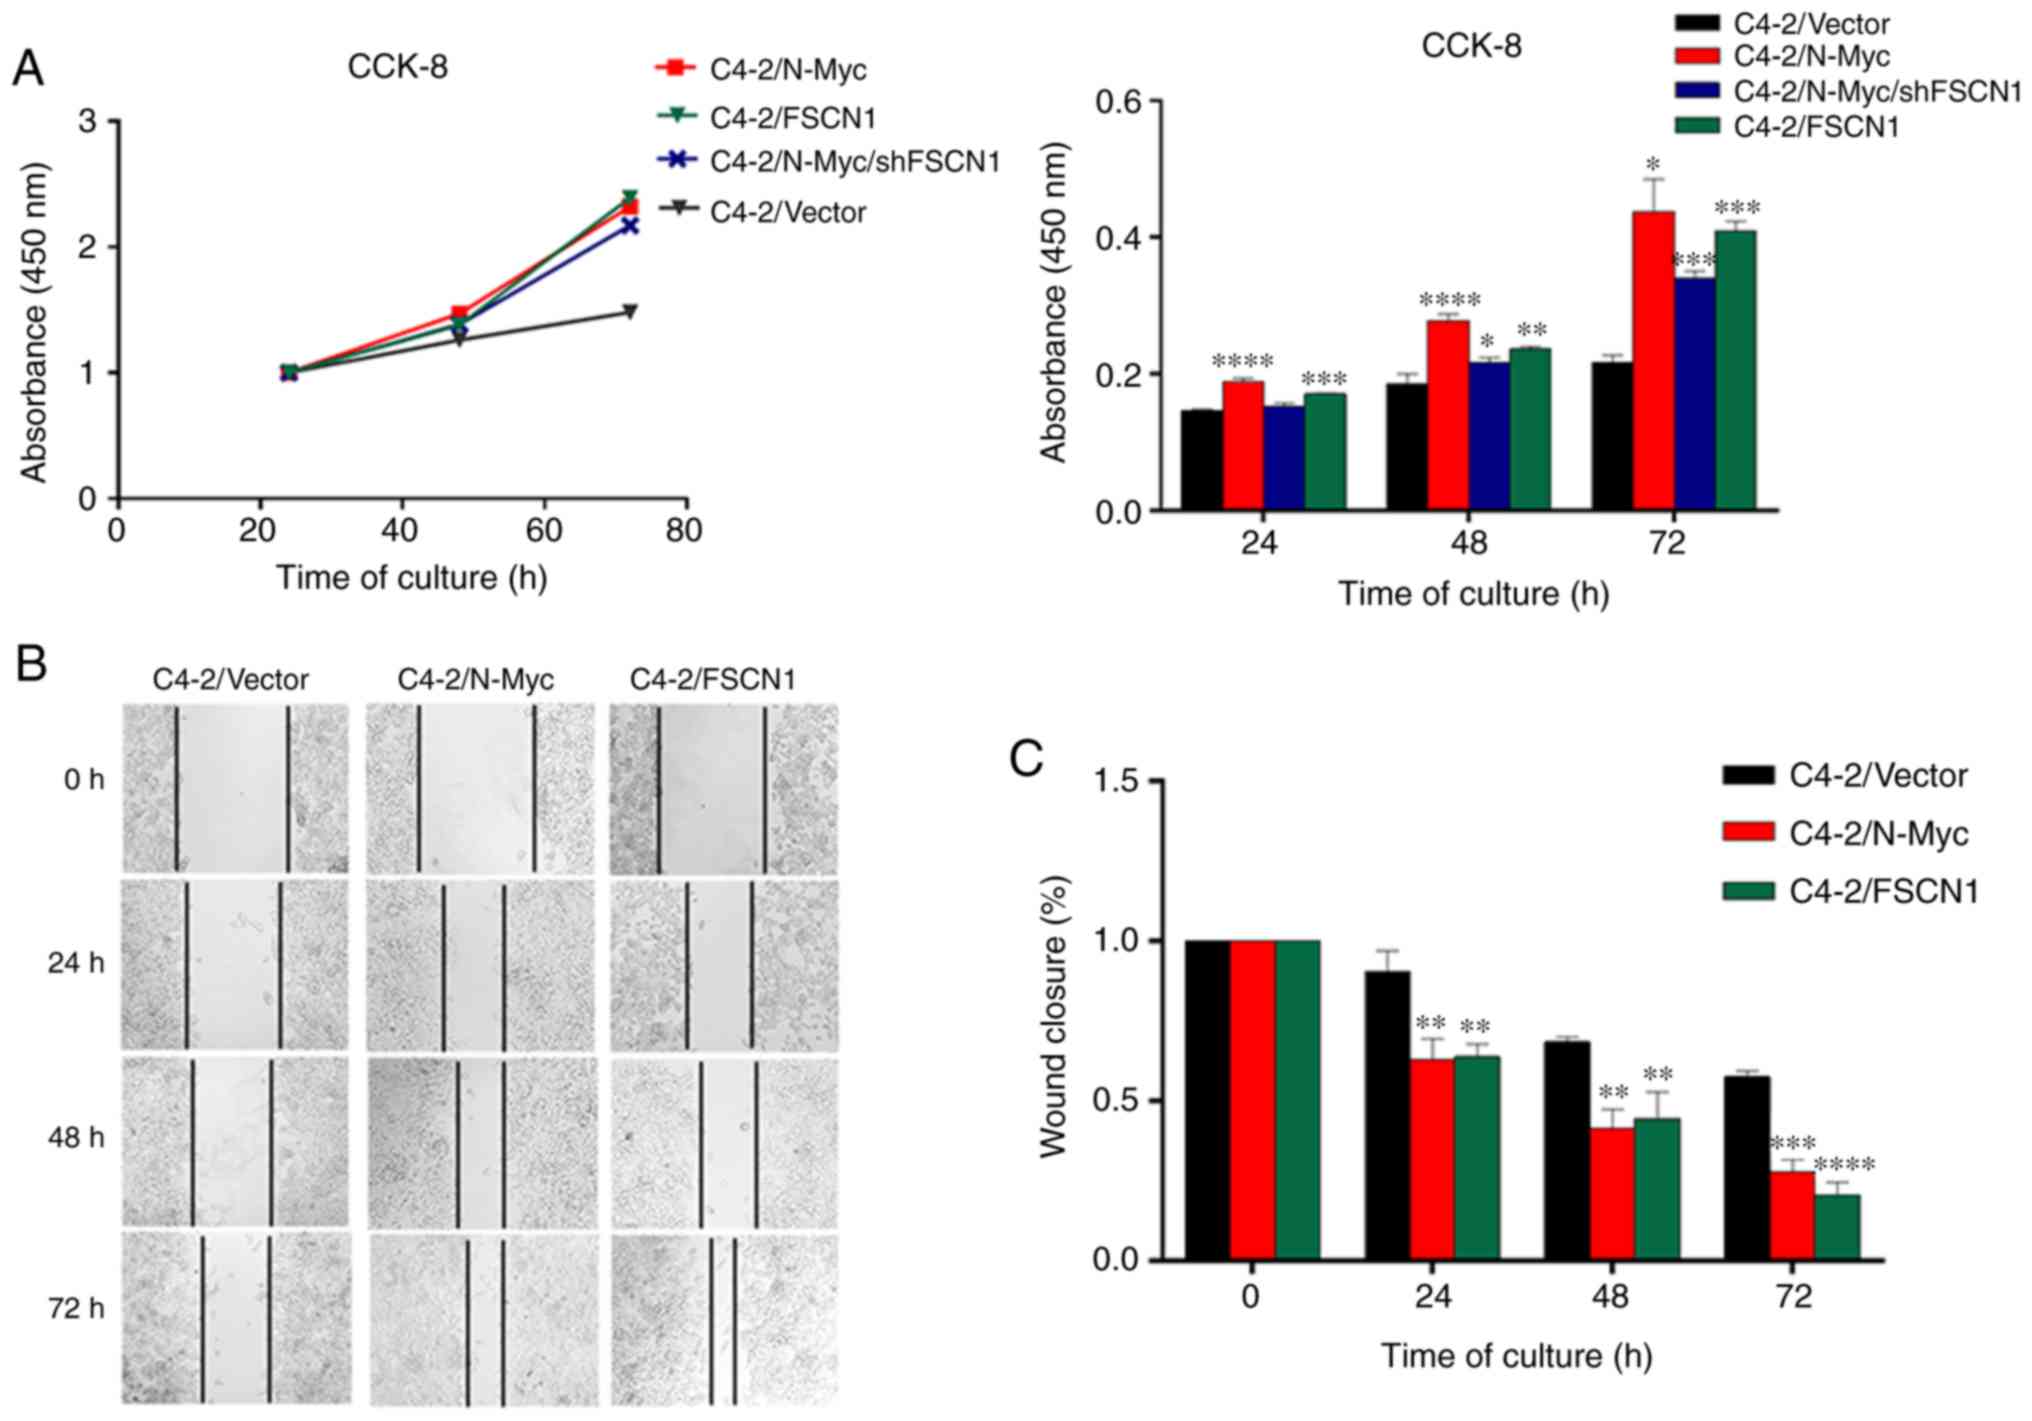
FSCN1 mediates N-Myc-induced
proliferation and migration in C4-2 cells
The present study revealed that, over time, the
proliferation rate of C4-2/N-Myc, C4-2/N-Myc/shFSCN1 and C4-2/FSCN1
was significantly faster than that of the C4-2/Vector control
group, and the statistical results revealed that the difference in
the proliferation rate was statistically significant over time
(Fig. 5A).
Effects of N-Myc and FSCN1 on the
migration ability of PCa cells
C4-2/Vector, C4-2/N-Myc and C4-2/FSCN1 were
inoculated in a 6-well plate to assess the migration ability of the
3 cell lines through a cell scratch test. The results revealed that
the migration ability of C4-2 cells overexpressing N-Myc and FSCN1
was stronger than that of the control group (Fig. 5B), suggesting that N-Myc and FSCN1
can enhance the migration ability of C4-2 cells. Statistical
analysis revealed that the difference in the migration ability was
statistically significant (Fig.
5C). There was a limitation to this experiment. We also
interfered with the expression of FSCN1 in C4-2/N-Myc cells, but
these cells underwent apoptosis during migration and no available
experimental results were obtained.
Discussion
N-Myc is found in ~40% of NEPC (29) and up to 20% of CRPC (30); however, studies on PCa are scarce,
and its specific mechanism of action remains unclear. The results
obtained by Dardenne et al (30) and Lee et al (31) in 2016 suggested that N-Myc is a
driving gene for neuroendocrine PCa. The overexpression of N-Myc
can lead to the neuroendocrine phenotype while lacking AR
expression and castration resistance in PCa. N-Myc may be a
potential therapeutic target for PCa. Yu et al confirmed
that N-Myc promotes the progression of PCa and resistance to
hormone therapy through the N-Myc/miR-421/ATM pathway (18).
Few studies have reported that N-Myc and FSCN1 are
highly expressed in a variety of malignancies (32,33)
and closely associated with the occurrence and development of
tumors. N-Myc is amplified in NEPC (29) and CRPC (30). Lee et al (31) demonstrated that N-Myc can drive
prostate cell carcinogenesis and lead to neuroendocrine
transformation. Therefore, the amplification of N-Myc can affect
the metabolic function of tumor cells and promote tumor cell
proliferation and further tumor development.
Tumor cell movement is an important marker of
invasion and metastasis, and FSCN1 is a factor that promotes tumor
cell adhesion, as well as invasion and migration (19). FSCN1 plays a metabolic role in the
metastatic settlement of non-small cell lung cancer (34).
Dardenne et al (30) revealed that in the PCa LNCaP and
22RV1 cell lines, the upregulation of N-Myc could also promote
FSCN1 upregulation. The mechanism through which N-Myc causes PCa
progression is unclear. The aforementioned studies revealed that
N-Myc has a regulatory effect on FSCN1. The results of testing were
further verified, and it was found that N-Myc may promote the
malignant progression of PCa by regulating FSCN1.
Notably, it was revealed that N-Myc and FSCN1 were
expressed in PCa tissues and cells, and their expression was
associated with tissue type and cancer progression. In particular,
the positive rate of N-Myc and FSCN1 in the tumor tissues of
patients with Gleason scores of >7 was higher than that in
tissues from patients with scores of <7 points. The positive
rate of N-Myc and FSCN1 in the tumor tissues of patients with stage
III–IV disease was higher than that in the tumor tissues of
patients with stage I–II disease. Moreover, the positive rate of
N-Myc and FSCN1 in tumor tissues with bone metastasis was higher
than that in tissues without bone metastasis. The aforementioned
findings indicated that N-Myc expression is a late event in the
history of tumor development. N-Myc and FSCN1 positive rates were
unrelated to age and preoperative PSA levels. The present results
were consistent with current findings, and N-Myc and FSCN1 were
revealed to exist in PCa tissues. Moreover, through correlation
analysis of the expression of N-Myc and FSCN1 in clinical samples
of PCa, a weak positive correlation was identified between the
expression of N-Myc and FSCN1 in PCa tissues. This weak correlation
may be related to the number of tissue samples, but this result was
consistent with the results of Dardenne et al (30) in cell lines. Therefore, it was
surmised that a direct or indirect regulatory pathway or mutual
regulation exists between N-Myc and FSCN1, thus promoting further
tumor development. However, the specific mechanism of action of
N-Myc and FSCN1 in PCa remains unclear and requires further
study.
The binding site of N-Myc to FSCN1 was predicted
through the NCBI website and CONSITE database, and it was
determined that the N-Myc binding site was indeed present in the
promoter region of FSCN1. Next, consistent with the results
reported in the literature, the present results revealed that, at
the cellular level, the expression of N-Myc and FSCN1 increased
gradually at the protein and mRNA levels with the progression of
PCa, indicating that N-Myc and FSCN1 were expressed in PCa cells,
in which they played a crucial role. However, following repeated
assessment of the protein expression level of N-Myc in LNCaP and
C4-2 cells, which was always undetectable, we conclude that N-Myc
is relatively low in protein levels in LNCaP and C4-2 cells.
Following the overexpression of N-Myc in LNCaP and
C4-2 cells, the expression of FSCN1 was significantly higher than
that in the control group, indicating that N-Myc could promote the
expression of FSCN1 in PCa cells. As predicted, a regulatory role
was observed between the two genes. After treating C4-2 and
C4-2/N-Myc cells with FSCN1-shRNA, the expression of N-Myc
increased. This suggested that a bidirectional regulation between
N-Myc and FSCN1 may exist, and that the reduction of FSCN1 may
reversely regulate the expression of N-Myc. In addition, the
results of this experiment revealed that the expression levels of
AR in LNCaP and C4-2 were higher than those in PC3, whereas the
expression of CgA in PC3 was significantly increased and a small
amount of the neuroendocrine marker CgA was expressed in C4-2
cells. These results indicated that C4-2 cells had begun to exhibit
neuroendocrine properties, and that PC3 cells have a high degree of
malignancy.
A number of studies (29,32)
have suggested that N-Myc is a key cancer protein required for the
development of the nervous system and neuroendocrine tumors. A
previous study (35) has also
suggested that FSCN1 is involved in the invasion and metastasis of
PCa. N-Myc was overexpressed in LNCaP and C4-2 cell lines, and the
AR expression was found to be decreased, indicating that N-Myc can
inhibit the expression of AR in the original PCa cells,
consequently rendering ADT ineffective. The expression of CgA was
slightly increased following the overexpression of N-Myc, whereas
that of CgA was significantly increased in the overexpressed FSCN1
group, and was significantly higher than that in the overexpressed
N-Myc group. The expression of AR and CgA was significantly
decreased following FSCN1-knockdown and was even lower than that in
the control group. This result indicated that, although N-Myc is
involved in neuroendocrine transformation, the role of FSCN1 in
neuroendocrine transformation may be prominent, and N-Myc may be a
neuroendocrine transformer promoted by the regulation of FSCN1.
This phenomenon accounts for the increased expression of N-Myc, but
not for the lack of increase in the expression of neuroendocrine
marker CgA following FSCN1-knockdown.
In addition, this experiment also examined the
effect of N-Myc and FSCN1 on the cell proliferation and migration
ability of the C4-2 cell line. The results revealed that the
proliferation rate of the overexpression group was significantly
higher than that of the control group over time, indicating that
N-Myc and FSCN1 can promote C4-2 cell proliferation and migration.
However, following FSCN1 knockdown, the cell proliferation ability
was not significantly affected and may be the same as the
previously detected level. Although FSCN1 was knocked down, the
expression of N-Myc was not decreased; thus, the proliferation
ability was not significantly inhibited.
The present study has several limitations. We
initially designed experiments to study the regulation of N-Myc on
FSCN1. However, we did not expect that FSCN1 would reverse the
regulation of N-Myc. Therefore, we did not study the effect of
FSCN1 silencing on the endogenous expression of N-Myc. In addition,
the present study also lacks investigation of more
phenotypes/stages or neuroendocrine signals. We interfered with the
expression of FSCN1 in C4-2/N-Myc cells, however these cells
underwent apoptosis during migration and no available experimental
results were obtained. Thus, the present experiment of observing
the invasion and migration ability of PCa cells was not rigorous
enough, however future studies may investigate these abilities.
In conclusion, in the present study, N-Myc and FSCN1
were revealed to be expressed in PCa. The positive correlation
between the two may promote the clinical progression of PCa. At the
cellular level, the expression of N-Myc and FSCN1 gradually
increased with the malignant progression of PCa cells, and N-Myc
could promote the expression of FSCN1. Conversely, the reduction of
FSCN1 could reverse the expression of N-Myc, further suggesting a
bidirectional regulation between N-Myc and FSCN1. N-Myc may promote
the expression of FSCN1 to promote the phenotypic changes of PCa
cells and CgA expression. N-Myc may promote the proliferation and
migration of PCa by regulating the expression of FSCN1, leading to
further tumor development. Thus, the role of the N-Myc/FSCN1
pathway in the treatment of PCa should be investigated. However,
N-Myc has numerous downstream regulatory factors, and its
regulatory mechanism is markedly complex, thus the regulation of
N-Myc on FSCN1 may be direct or indirect. These mechanisms require
further study and discussion.
Acknowledgements
Not applicable.
Funding
The present study was supported in part by the
National Natural Science Foundation of China (grant no. 81972414),
the Scientific Research Fund Project of Anhui Academy of
Translational Medicine (Class A; grant no. 2017zhyx02), and the
tenth batch of special funding projects of China Postdoctoral
Science Foundation (grant no. 2017T100441).
Availability of data and materials
The datasets used in this study are available from
the first author upon reasonable request.
Authors' contributions
YY and CL conceived and designed the study and the
experiments. GH, ML, LF, LZ, LY XH and LX performed the
experiments. GH, YC and ML analyzed the data. GH, WM, WL and LY
collected the data. GH wrote the manuscript. YY, YC and WM reviewed
and revised the manuscript. YY acquired funding. All authors have
read and approved the final version of the manuscript.
Ethics approval and consent to
participate
The present study was conducted with the consent of
all participants and was approved by the Biomedical Ethics
Committee of Anhui Medical University (approval no. 20170209).
Patient consent for publication
Not applicable.
Competing interests
The authors declare that they have no competing
interests.
References
|
1
|
Siegel RL, Miller KD and Jemal A: Cancer
statistics, 2019. CA Cancer J Clin. 69:7–34. 2019. View Article : Google Scholar : PubMed/NCBI
|
|
2
|
Chen W, Zheng R, Baade PD, Zhang S, Zeng
H, Bray F, Jemal A, Yu XQ and He J: Cancer Statistics in China,
2015. CA Cancer J Clin. 66:115–132. 2016. View Article : Google Scholar : PubMed/NCBI
|
|
3
|
Chen Y, Sawyers CL and Scher HI: Targeting
the androgen receptor pathway in prostate cancer. Curr Opin
Pharmacol. 8:440–448. 2008. View Article : Google Scholar : PubMed/NCBI
|
|
4
|
Taylor BS, Schultz N, Hieronymus H,
Gopalan A, Xiao Y, Carver BS, Arora VK, Kaushik P, Cerami E, Reva
B, et al: Integrative genomic profiling of human prostate cancer.
Cancer Cell. 18:11–22. 2010. View Article : Google Scholar : PubMed/NCBI
|
|
5
|
Zarour L and Alumkal J: Emerging therapies
in Castrate-resistant prostate cancer. Curr Urol Rep. 11:152–158.
2010. View Article : Google Scholar : PubMed/NCBI
|
|
6
|
Wang HT, Yao YH, Li BG, Tang Y, Chang JW
and Zhang J: Neuroendocrine prostate cancer (NEPC) progressing from
conventional prostatic adenocarcinoma: Factors associated with time
to development of NEPC and survival from NEPC diagnosis-a
systematic review and pooled analysis. J Clin Oncol. 32:3383–3390.
2014. View Article : Google Scholar : PubMed/NCBI
|
|
7
|
Lotan TL, Gupta NS, Wang W, Toubaji A,
Haffner MC, Chaux A, Hicks JL, Meeker AK, Bieberich CJ, De Marzo
AM, et al: ERG gene rearrangements are common in prostatic small
cell carcinomas. Mod Pathol. 24:820–828. 2011. View Article : Google Scholar : PubMed/NCBI
|
|
8
|
Tan HL, Sood A, Rahimi HA, Wang W, Gupta
N, Hicks J, Mosier S, Gocke CD, Epstein JI, Netto GJ, et al: Rb
loss is characteristic of prostatic small cell neuroendocrine
carcinoma. Clin Cancer Res. 20:890–903. 2014. View Article : Google Scholar : PubMed/NCBI
|
|
9
|
Robinson D, Van Allen EM, Wu YM, Schultz
N, Lonigro RJ, Mosquera JM, Montgomery B, Taplin ME, Pritchard CC,
Attard G, et al: Integrative clinical genomics of advanced prostate
cancer. Cell. 161:1215–1228. 2015. View Article : Google Scholar : PubMed/NCBI
|
|
10
|
Beltran H, Prandi D, Mosquera JM, Benelli
M, Puca L, Cyrta J, Marotz C, Giannopoulou E, Chakravarthi BV,
Varambally S, et al: Divergent clonal evolution of
castration-resistant neuroendocrine prostate cancer. Nat Med.
22:298–305. 2016. View
Article : Google Scholar : PubMed/NCBI
|
|
11
|
Dang CV: MYC on the path to cancer. Cell.
149:22–35. 2012. View Article : Google Scholar : PubMed/NCBI
|
|
12
|
Schneiderman J, London WB, Brodeur GM,
Castleberry RP, Look AT and Cohn SL: Clinical significance of MYCN
amplification and ploidy in favorable-stage neuroblastoma: A report
from the Children's Oncology Group. J Clin Oncol. 26:913–918. 2008.
View Article : Google Scholar : PubMed/NCBI
|
|
13
|
Massimino M, Biassoni V, Gandola L, Garrè
ML, Gatta G, Giangaspero F, Poggi G and Rutkowski S: Childhood
medulloblastoma. Crit Rev Oncol Hematol. 105:35–51. 2016.
View Article : Google Scholar : PubMed/NCBI
|
|
14
|
Northcott PA, Jones DT, Kool M, Robinson
GW, Gilbertson RJ, Cho YJ, Pomeroy SL, Korshunov A, Lichter P,
Taylor MD and Pfister SM: Medulloblastomics: The end of the
beginning. Nat Rev Cancer. 12:818–834. 2012. View Article : Google Scholar : PubMed/NCBI
|
|
15
|
Bjerke L, Mackay A, Nandhabalan M, Burford
A, Jury A, Popov S, Bax DA, Carvalho D, Taylor KR, Vinci M, et al:
Histone H3.3. Mutations drive pediatric glioblastoma through
upregulation of MYCN. Cancer Discov. 3:512–519. 2013. View Article : Google Scholar : PubMed/NCBI
|
|
16
|
Swartling FJ, Savov V, Persson AI, Chen J,
Hackett CS, Northcott PA, Grimmer MR, Lau J, Chesler L, Perry A, et
al: Distinct neural stem cell populations give rise to disparate
brain tumors in response to N-MYC. Cancer Cell. 21:601–613. 2012.
View Article : Google Scholar : PubMed/NCBI
|
|
17
|
Fielitz K, Althoff K, De Preter K,
Nonnekens J, Ohli J, Elges S, Hartmann W, Klöppel G, Knösel T,
Schulte M, et al: Characterization of pancreatic glucagon-producing
tumors and pituitary gland tumors in transgenic mice overexpressing
MYCN in hGFAP-positive cells. Oncotarget. 7:74415–74426. 2016.
View Article : Google Scholar : PubMed/NCBI
|
|
18
|
Yu Y, Xu L, Chang Y, Zeng T, Chen X, Wang
A, Groth J, Foo WC, Liang C, Hu H and Huang J: N-Myc promotes
therapeutic resistance development of neuroendocrine prostate
cancer by differentially regulating miR-421/ATM pathway. Mol
Cancer. 18:112019. View Article : Google Scholar : PubMed/NCBI
|
|
19
|
Hanker LC, Karn T, Holtrich U, Graeser M,
Becker S, Reinhard J, Ruckhäberle E, Gevensleben H and Rody A:
Prognostic impact of fascin-1 (FSCN1) in epithelial ovarian cancer.
Anticancer Res. 33:371–377. 2013.PubMed/NCBI
|
|
20
|
Hashimoto Y, Skacel M and Adams JC: Roles
of fascin in human carcinoma motility and signaling: Prospects for
a novel biomarker? Int J Biochem Cell Biol. 37:1787–1804. 2005.
View Article : Google Scholar : PubMed/NCBI
|
|
21
|
Scott KL, Nogueira C, Heffernan TP, van
Doorn R, Dhakal S, Hanna JA, Min C, Jaskelioff M, Xiao Y, Wu CJ, et
al: Proinvasion metastasis drivers in Early-stage melanoma are
oncogenes. Cancer Cell. 20:92–103. 2011. View Article : Google Scholar : PubMed/NCBI
|
|
22
|
Li A, Morton JP, Ma Y, Karim SA, Zhou Y,
Faller WJ, Woodham EF, Morris HT, Stevenson RP, Juin A, et al:
Fascin is regulated by slug, promotes progression of pancreatic
cancer in mice, and is associated with patient outcomes.
Gastroenterology. 146:1386–1396.e17. 2014. View Article : Google Scholar : PubMed/NCBI
|
|
23
|
Barnawi R, Al-Khaldi S, Majed Sleiman G,
Sarkar A, Al-Dhfyan A, Al-Mohanna F, Ghebeh H and Al-Alwan M:
Fascin is critical for the maintenance of breast cancer stem cell
pool predominantly via the activation of the notch Self-renewal
pathway. Stem Cells. 34:2799–2813. 2016. View Article : Google Scholar : PubMed/NCBI
|
|
24
|
Sun J, He H, Xiong Y, Lu S, Shen J, Cheng
A, Chang WC, Hou MF, Lancaster JM, Kim M and Yang S: Fascin protein
is critical for transforming growth factor β Protein-induced
invasion and filopodia formation in Spindle-shaped tumor cells. J
Biol Chem. 286:38865–38875. 2011. View Article : Google Scholar : PubMed/NCBI
|
|
25
|
Snyder M, Huang XY and Zhang JJ: Signal
transducers and activators of transcription 3 (STAT3) directly
regulates cytokine-induced fascin expression and is required for
breast cancer cell migration. J Biol Chem. 286:38886–38893. 2011.
View Article : Google Scholar : PubMed/NCBI
|
|
26
|
Zhao X, Gao S, Ren H, Sun W, Zhang H, Sun
J, Yang S and Hao J: Hypoxia-inducible factor-1 promotes pancreatic
ductal adenocarcinoma invasion and metastasis by activating
transcription of the actin-bundling protein fascin. Cancer Res.
74:2455–2464. 2014. View Article : Google Scholar : PubMed/NCBI
|
|
27
|
Sandelin A, Wasserman WW and Lenhard B:
ConSite: Web-based prediction of regulatory elements using
cross-species comparison. Nucleic Acids Res. 32:W249–W252. 2004.
View Article : Google Scholar : PubMed/NCBI
|
|
28
|
Livak KJ and Schmittgen TD: Analysis of
relative gene expression data using real-time quantitative PCR and
the 2-(-Delta Delta C(T)) method. Methods. 25:402–408. 2001.
View Article : Google Scholar : PubMed/NCBI
|
|
29
|
Beltran H, Rickman DS, Park K, Chae SS,
Sboner A, MacDonald TY, Wang Y, Sheikh KL, Terry S, Tagawa ST, et
al: Molecular characterization of neuroendocrine prostate cancer
and identification of new drug targets. Cancer Discov. 1:487–495.
2011. View Article : Google Scholar : PubMed/NCBI
|
|
30
|
Dardenne E, Beltran H, Benelli M, Gayvert
K, Berger A, Puca L, Cyrta J, Sboner A, Noorzad Z, MacDonald T, et
al: N-Myc induces an EZH2-mediated transcriptional program driving
neuroendocrine prostate cancer. Cancer Cell. 30:563–577. 2016.
View Article : Google Scholar : PubMed/NCBI
|
|
31
|
Lee JK, Phillips JW, Smith BA, Park JW,
Stoyanova T, McCaffrey EF, Baertsch R, Sokolov A, Meyerowitz JG,
Mathis C, et al: N-myc drives neuroendocrine prostate cancer
initiated from human prostate epithelial cells. Cancer Cell.
29:536–547. 2016. View Article : Google Scholar : PubMed/NCBI
|
|
32
|
Beltran H: The N-myc Oncogene: Maximizing
its targets, regulation, and therapeutic potential. Mol Cancer Res.
12:815–822. 2014. View Article : Google Scholar : PubMed/NCBI
|
|
33
|
Adams JC: Roles of fascin in cell adhesion
and motility. Curr Opin Cell Biol. 16:590–596. 2004. View Article : Google Scholar : PubMed/NCBI
|
|
34
|
Lin S, Huang C, Gunda V, Sun J, Chellappan
SP, Li Z, Izumi V, Fang B, Koomen J, Singh PK, et al: Fascin
controls metastatic colonization and mitochondrial oxidative
phosphorylation by remodeling mitochondrial actin filaments. Cell
Rep. 28:2824–2836.e8. 2019. View Article : Google Scholar : PubMed/NCBI
|
|
35
|
Darnel AD, Behmoaram E, Vollmer RT, Corcos
J, Bijian K, Sircar K, Su J, Jiao J, Alaoui-Jamali MA and Bismar
TA: Fascin regulates prostate cancer cell invasionand is associated
with metastasis and biochemical failurein prostate cancer. Cin
Cancer Res. 15:1376–1383. 2009. View Article : Google Scholar
|