Introduction
Glioblastoma (GBM) is one of the most common
malignant central nervous tumors. GBM is a high-grade glioma (grade
IV) that accounts for ~3% of all tumors, with ~90,000 patients
dying from GBM each year (1–3). In
addition, the 2-year survival rate of patients with GBM is ≤35%
(4). GBM originates from brain
glial cells. In the 2016 World Health Organization classification,
glioma is divided into four different grades and two classes as
follows: Grades I and II (low-grade gliomas); and grades III and IV
(high-grade gliomas) (5). Despite
the progress in therapeutic and new diagnostic approaches, current
treatments are not considered to be effective (6,7).
Although surgical procedures are the recommend treatment strategies
at present, total resection of glioma is difficult to complete
(~10%) (8). However, the underlying
molecular mechanisms of glioma progression remains unknown
(9,10). It is therefore essential to
determine novel molecular biomarkers that could be used to predict
prognosis and develop new therapeutic approaches for patients with
glioma.
Long non-coding RNAs (lncRNAs) are a class of
non-coding RNAs of >200 nucleotides in length that have limited
protein coding capacity (11).
lncRNAs regulate the expression level of genes on epigenetic,
transcriptional and post-transcriptional levels (12,13).
The modes of regulation by lncRNAs include chromosome modification
and transcriptional activation or interference (14). Previously, these long non-coding
transcripts were regarded as transcriptional ‘noise’ or cloning
artifacts (15). However,
increasing evidence revealed that lncRNAs serve crucial roles in
various cellular processes, including transcriptional regulation,
cell proliferation and nuclear import (16). These findings suggest that lncRNAs
might be considered as promising therapeutic targets in cancer.
Previous studies have demonstrated the biological functions of
lncRNAs in various types of human cancer, including glioma
(17–20).
The lncRNA Kinectin 1-Antisense RNA 1 (KTN1-AS1) is
located on chromosome 14 and was demonstrated to be upregulated in
non-small cell lung cancer, hepatocellular carcinoma and head and
neck squamous cell carcinoma, where it was confirmed to act as an
independent prognostic factor (21–24).
Previous studies reported that KTN1-AS1 promotes the development of
hepatocellular carcinoma and non-small cell lung cancer (21,22).
Jiang et al (23) also
demonstrated that KTN1-AS1 can suppress the epithelial-mesenchymal
transition in head and neck squamous cell carcinoma. Furthermore,
analyzing RNA-sequencing data derived from the TANRIC database
revealed that KTN1-AS1 might be considered as a novel biomarker for
patients with head and neck squamous cell carcinoma (24). The present study aimed to determine
the biological function and underlying mechanisms of KTN1-AS1 in
glioma.
Materials and methods
Tissues and cell lines
The human glioma (LN229, U251, A172 and T98G) and
Normal Human Astrocyte (NHA) cell lines were obtained from The Cell
Bank of Type Culture Collection of the Chinese Academy of Sciences.
Cells were incubated in DMEM (Gibco; Thermo Fisher Scientific,
Inc.; cat. no. 670087) supplemented with 10% FBS (Gibco; Thermo
Fisher Scientific, Inc.; cat. no. 16140071) and maintained at 37°C
in an atmosphere containing 5% CO2.
Human GBM specimens and adjacent normal brain
tissues (located 0.5–1 cm away from the tumor) were obtained from
35 patients with histologically confirmed GBM who underwent surgery
at the Second Affiliated Hospital of Harbin Medical University
between May 2018 and December 2019 (Harbin, Heilongjiang, China).
All GBM samples and adjacent normal brain tissues (17 women and 18
men; age range, 22–74 years; median age, 47.31 years) were
confirmed by two senior pathologists. None of the patients had
received any preoperative treatment. The specimens were immediately
snap-frozen in liquid nitrogen for further research. Written
informed consent was obtained from each patient. All procedures
were performed in agreement with the Declaration of Helsinki
(25). The study was approved by
the Institutional Review Board of the Second Affiliated Hospital of
Harbin Medical University (No.2018HMUIRB0113, Harbin, China). The
clinical characteristics of the patients are summarized in Table I.
 | Table I.Clinical characteristics of patients
with glioblastoma according to long non-coding RNA KTN-AS1 level in
tissues (n=35). |
Table I.
Clinical characteristics of patients
with glioblastoma according to long non-coding RNA KTN-AS1 level in
tissues (n=35).
|
|
| KTN1-AS1
expression |
|
|---|
|
|
|
|
|
|---|
| Variables | n | Low | High | P-value |
|---|
| Age, years |
|
|
|
|
|
<60 | 14 | 9 | 5 | 0.129 |
|
≥60 | 21 | 8 | 13 |
|
| Sex |
|
|
|
|
|
Male | 18 | 4 | 14 | 0.001a |
|
Female | 17 | 13 | 4 |
|
| Karnofsky
performance scale score |
|
|
|
|
|
<60 | 18 | 8 | 10 | 0.615 |
|
≥60 | 17 | 9 | 8 |
|
| Mean tumor
diameter, cm |
|
|
|
|
|
<5 | 21 | 6 | 15 | 0.004a |
| ≥5 | 14 | 11 | 3 |
|
| Necrosis on
MRI |
|
|
|
|
|
Yes | 14 | 7 | 7 | 0.89 |
| No | 21 | 10 | 11 |
|
| Seizure |
|
|
|
|
|
Yes | 17 | 9 | 8 | 0.615 |
| No | 18 | 8 | 10 |
|
Gene expression profiles with KTN1-AS1
expression
The high-throughput sequencing data of nine glioma
tissues and three normal samples were acquired from the Gene
Expression Omnibus (GEO) database (no. GSE4290 and GSE104267;
http://www.ncbi.nlm.nih.gov/geo/query/acc.cgi?acc)
(26). The overall survival data
were obtained from GBM patients in The Cancer Genome Atlas (TCGA)
GBM database (http://cancergenome.nih.gov) (27). Gene Ontology (GO) term analysis was
performed using the Database for Annotation, Visualization and
Integrated Discovery (DAVID) v6.8 (https://david.ncifcrf.gov/). The edgeR package was
conducted to explore significantly abnormally expressed lncRNAs for
the normalized gene expression profile data. The DEseq2 package was
used to analyze the differentially expressed lncRNA with the
threshold set as log2 fold-change (FC) level >2 and
false-discovery rate (FDR) <0.01. Furthermore, the Venn diagram
was generated by FunRich to visualize the overlapping lncRNAs among
TCGA database, GSE4290 and GSE104267 datasets.
Isolation of cytoplasmic and nuclear
RNA
Glioma cell cytoplasmic and nuclear RNA were
harvested and purified by using the PARIS Kit (cat. no. AM1921;
Thermo Fisher Scientific, Inc.) according to the manufacturers'
instructions.
Reverse transcription quantitative
(RT-q) PCR
Total RNA was collected from clinical specimens and
T98G and U251 cells using TRIzol Reagent (Beijing Transgen Biotech
Co., Ltd.; cat. no. R1021) and reversely transcribed into cDNA
using the PrimeScript™ RT Kit (Takara Biotechnology Co., Ltd.; cat.
no. RR014A) according to the manufacturers' protocol. RT-qPCR was
conducted three times on an ABI 7500HT Real-Time PCR instrument
(Applied Biosystems; Thermo Fisher Scientific, Inc.) according to
the manufacturers' protocols. The thermocycling conditions were as
follows: Initial denaturing step (94°C, 10 min), followed by 40
cycles of denaturing (94°C, 5 sec), annealing (60°C, 30 sec) and
extending (72°C, 45 sec). The sequences of the primers used were as
follows: KTN1-AS1, forward 5′-ATGCACACTTCTCGGCTAAGAGTC-3′, reverse,
5′-CTACAATGCCACAAGTGATTCCAG-3′; miR-505-3p, forward
5′-CGCGGATCCCAGACTCCCAGCAATCAC-3′, reverse
5′-CCGGAATTCGCAGTATTCCCACCATTT-3′; MMP-9, forward
5′-AGACCTGGGCAGATTCCAAAC-3′, reverse 5′-CGGCAAGTCTTCCGAGTAGT-3′;
U6, forward 5′-GGATATTGTTGCCATCAATGACC-3′, reverse
5′-AGCCTTCTCCATGGTGGTGAAGA-3′; and GAPDH, forward
5′-AAGAAGGTGGTGAAGCAGGC-3′ and reverse 5′-GTCAAAGGTGGAGGAGTGGG-3′.
U6 served as the endogenous control for miRNA, and GAPDH served as
the endogenous control for lncRNA and MMP-9. To verify the
expression of KTN1-AS1 and miR-505-3p, endogenous mRNA was
synthesized using a SYBR Green PCR Master Mix Kit (Invitrogen;
Thermo Fisher Scientific, Inc.; cat. no. 4309155). Relative gene
expression levels were normalized to endogenous controls and were
expressed as 2−ΔΔCt (28).
Plasmids, oligonucleotides and cell
transfection
KTN1-AS1 siRNA, pcDNA3.1-KTN1-AS1 (OE), negative
control-siRNA (si-NC), miR-505-3p mimics, miR-505-3p inhibitor and
negative control-miRNA (miR-NC) were obtained from Shanghai
GenePharma Co., Ltd. T98G and U251 cells were seeded at the density
of 5×10⁵ cells per well in 6-well plates and cultured in
DMEM containing 10% FBS at 37°C. When the cell confluence reached
70–80%, cells were transfected with 20 µM of each construct using
Lipofectamine® 2000 (Invitrogen; Thermo Fisher
Scientific, Inc.; cat. no. 11668030) according to the
manufacturers' protocol and maintained at 37°C for 6 h. The culture
medium was then replaced by fresh DMEM containing 10% FBS, and
subsequent experiments were conducted at 24 h post-transfection.
The sequences of the constructs were as follows: KTN1-AS1 siRNA,
forward 5′-GACUGUGGAUAGAGAUAGAAA-3′, reverse
5′-UCUAUCUCUAUCCACAGUCUG-3′; si-NC, forward
5′-GGUAAGCAGUGGCUCCUCUAA-3′, reverse 5′-ACGUGACACGUUCGGAGAAUU-3′;
miR-505-3p mimics, forward 5′-GGGAGCCAGGAAGUAUUGAUGU-3′, reverse
5′-ACAUCAAUACUUCCUGGCUCUU-3′; miR-505-3p inhibitor, forward
5′-GGGAGCCAGGAAGUAUUGAUGU-3′, reverse 5′-CAGUACUUUUGUGUAGUACAA-3′;
and miR-NC, forward 5′-CAGUACUUUUGUGUAGUACAA-3′ and reverse
5′-CAGUACUUUUGUGUAGUACAA-3′.
Dual-luciferase reporter assay
DIANA tools (http://carolina.imis.athena-innovation.gr/diana_tools)
and StarBase V2.0 (http://starbase.sysu.edu.cn/) database were used to
identify the potential target miRNAs of KTN1-AS1. Among all the
statistically relevant miRNAs, miR-23b-3p, miR-23c-3p and
miR-505-3p were obtained from two databases, and were therefore
selected for further experiments. The human KTN1-AS1 Luc-reporter
was used in the ligation of the KTN1-AS1 3′-untranslated region
(UTR) PCR product. The psiCHECK2 vector (GeneChem, Inc.) was
conducted to construct KTN1-AS1 3′-UTR containing reporter. T98G
cells were seeded in 6-well plates at the density of
1×10⁵ cells per well and the miRNA mimics were
co-transfected with psiCHECK2-KTN1-AS1-wild type (WT) or mutant
(MUT) (20 µl) and miR-505-3p mimics or miR-NC (20 µM) by
Lipofectamine® 2000 (Invitrogen; Thermo Fisher
Scientific, Inc.; cat. no. 11668030). The medium was changed at 4 h
post-transfection. After 48 h, the intensity of Firefly luciferase
was measured using a Dual-Luciferase Reporter Assay System (cat.
no. BA0180; BioVision Inc.) according to the manufacturers'
instructions. Renilla luciferase intensity was used as an
internal control.
Cell viability assay
The viability of glioma cells was evaluated using
Cell Counting Kit-8 (CCK-8; cat. no. CK04; Dojindo Molecular
Technologies, Inc.). T98G and U251 cells were seeded in 96-well
plates (100 µl containing 3,000 cells/well). Cells were cultured in
DMEM at 37°C under 5% CO2 conditions for 24, 48 or 72 h.
CCK-8 solution (10 µl) was then added to the cells for 4 h and the
optical density was detected at 490 nm using a Tecan microplate
reader (Infinite F50; Tecan Group, Ltd.).
Transwell assays
Transfected T98G and U251 cells (5×10⁴)
were seeded into the upper chamber of a Transwell on a
Matrigel-coated membrane (cat. no. 3495; Costar; Corning, Inc.) and
cultured in serum-free medium for 24 h. DMEM containing 20% FBS was
placed in the lower chamber. Subsequently, the upper chamber medium
was changed and cells on the upper side of the filter were removed.
Then, cells that have invaded the lower side were fixed with 4%
paraformaldehyde at room temperature for 10 min and stained with
0.1% crystal violet (cat. no. IC0600; Beijing Solarbio Science
& Technology Co., Ltd.) at room temperature for 10 min. Stained
cells were counted in five randomly selected fields under a light
microscope (Nikon Corporation) at ×100 magnification.
Immunofluorescence staining
Cell slides were precoated with 0.1% poly-L-lysine
at 4°C for 24 h and placed into 24-well plates. Subsequently, T98G
and U251 cells (1×10⁵) were transfected with
si-KTN1-AS1/si-NC in culture dish. After 24 h, cells were collected
and cultured on the cell slides in 24-well plates for 24 h. Then
the medium was removed and cell slides were incubated with 4%
paraformaldehyde in 24-well plates at room temperature for 20 min
and 0.1% Triton X-100 for 5 min. The cell slides were washed in
24-well plates and fixed with 5% BSA (cat. no. 9048-46-8; Sigma
Aldrich; Merck KGaA) dissolved in PBS at room temperature for 1 h,
incubated with primary antibodies targeting MMP-9 (rabbit
polyclonal antibody; cat. no. 13667; 1:50; Cell Signaling
Technology, Inc.) at 4°C overnight, and with fluorescence-labeled
rabbit secondary antibody [tetramethylrhodamine (TRITC)-conjugated
goat anti-rabbit IgG; cat. no. SA00007-2; 1:100; ProteinTech Group,
Inc.)] for 1 h at room temperature. Nuclei were stained with DAPI
(1 µg/ml; cat. no. 4083s; Cell Signaling Technology, Inc.) for 10
min. Cell slides were subsequently collected and placed on glass
slides. The cells were observed under a fluorescence microscope
(Nikon Corporation) at ×400 magnification.
In vivo xenograft tumor models
Four-week-old female BALB/c nude mice (weight, 15–20
g; n=16) were obtained from Beijing Vital River Laboratory Animal
Technology, Co., Ltd. The vehicle of the luciferase lentivirus
(GV260-purinomycin) and the corresponding transfection reagent
(HitransG Infection enhancer fluid) were purchased from GeneChem
and transfection was conducted according to the manufacturers'
protocol. Then T98G cells were stable transfected with luciferase
lentivirus and transfection reagent for 4 h. Then purinomycin was
fixed and incubated for 15 day. The mice were assigned to two
groups (si-NC and si-KTN1-AS1; n=8 per group) and placed in an
anesthesia induction box. Mice were anesthetized with isoflurane
(induced concentration, 3–4%) for 2–3 min and maintained
anesthetized using at 1–1.5% isoflurane. Subsequently, si-KTN1-AS1
or si-NC-Luc T98G cells (1×10⁶ cells/mouse in 5 µl) were
intracranially injected using a stereotactic instrument. Tumor
growth was evaluated by bioluminescence imaging
(photons/s/cm2) using a Bruker In-Vivo FX PRO Imaging
System (Bruker Corporation). Mice were anesthetized using
isoflurane and D-luciferin sodium salt injected into the abdomen of
mice. Tumor size in the head of mice was evaluated by
bioluminescence imaging (BLI). The fluorescence value is associated
with the tumor size. After 40 days, the remaining mice were then
sacrificed using CO2 (28% volume displacement per min)
and the overall survival time was recorded. All applicable
international, national and/or institutional guidelines for the
care and use of animals were followed. The study was approved by
the Institutional Review Board of the Second Affiliated Hospital of
Harbin Medical University (approval no. 2018HMUIRB0113, Harbin,
China).
Statistical analysis
The data were presented as the means ± standard
deviation of the mean of three independent experiments. Statistical
analyses were conducted using the statistical software SPSS version
19.0 (IBM Corp.). Pearson's rank correlation test was used to
determine the correlation between KTN1-AS1 and miR-505-3p or MMP-9
expression. Comparisons between groups were performed using
two-tailed Student's t-test or ANOVA followed by Tukey's post hoc
test. The association between KTN1-AS1 level and
clinicopathological characteristics of the patients was analyzed
using χ2 test or Fisher's exact test. Kaplan-Meier curve
and log-rank test were conducted for survival analysis using
GraphPad Prism v.5.0 (GraphPad Software, Inc.). The aberrantly
expressed lncRNAs were explored according to Benjamini-Hochberg
method (29). P<0.05 was
considered to indicate a statistically significant difference.
Results
KTN1-AS1 expression is increased in
GBM tissues
To identify whether KTN1-AS1 was involved in the
development of glioma, KTN1-AS1 expression was evaluated using
microarray data downloaded from GEO (GSE104267). The top 50
aberrantly expressed lncRNAs were identified with cut-off values of
log2FC>2 and FDR<0.01, and it was observed that KTN1-AS1
level was overexpressed in GBM tissues compared with normal brain
tissues (Fig. 1A and B). In total,
five intersecting lncRNAs were identified and investigated
according to their log2FC level, as displayed in Fig. 1C. The data from TCGA database
indicated that patients with glioma and higher KTN1-AS1 expression
had a shorter overall survival (Fig.
1D; n=162, P<0.01). To further elucidate the function of
KTN1-AS1, the associated gene expression profiles were detected
using Co-lncRNA program from the GO database. The results
demonstrated that KTN1-AS1 was associated with cell invasion, focal
adhesion and zinc ion binding (Fig.
1E). Since GBM is the most malignant and common primary nervous
system tumor worldwide (1,2), it is crucial to identify the clinical
characteristics of patients with GBM (grade IV in glioma) according
to tissue expression of KTN1-AS1. The results demonstrated that
expression level of KTN1-AS1 was significantly associated with sex
and mean tumor diameter in the clinical GBM samples (n=35; grade
IV; P=0.001 and P=0.004, respectively; Table I). Subsequently, KTN1-AS1 expression
level was examined in 35 GBM tissues and adjacent normal brain
tissues by RT-qPCR. The results demonstrated that KTN1-AS1
expression level was significantly increased in GBM tissues
(P<0.001; Fig. 2A) compared with
adjacent normal tissues. These findings suggested that KTN1-AS1 may
function as an oncogene in glioma progression.
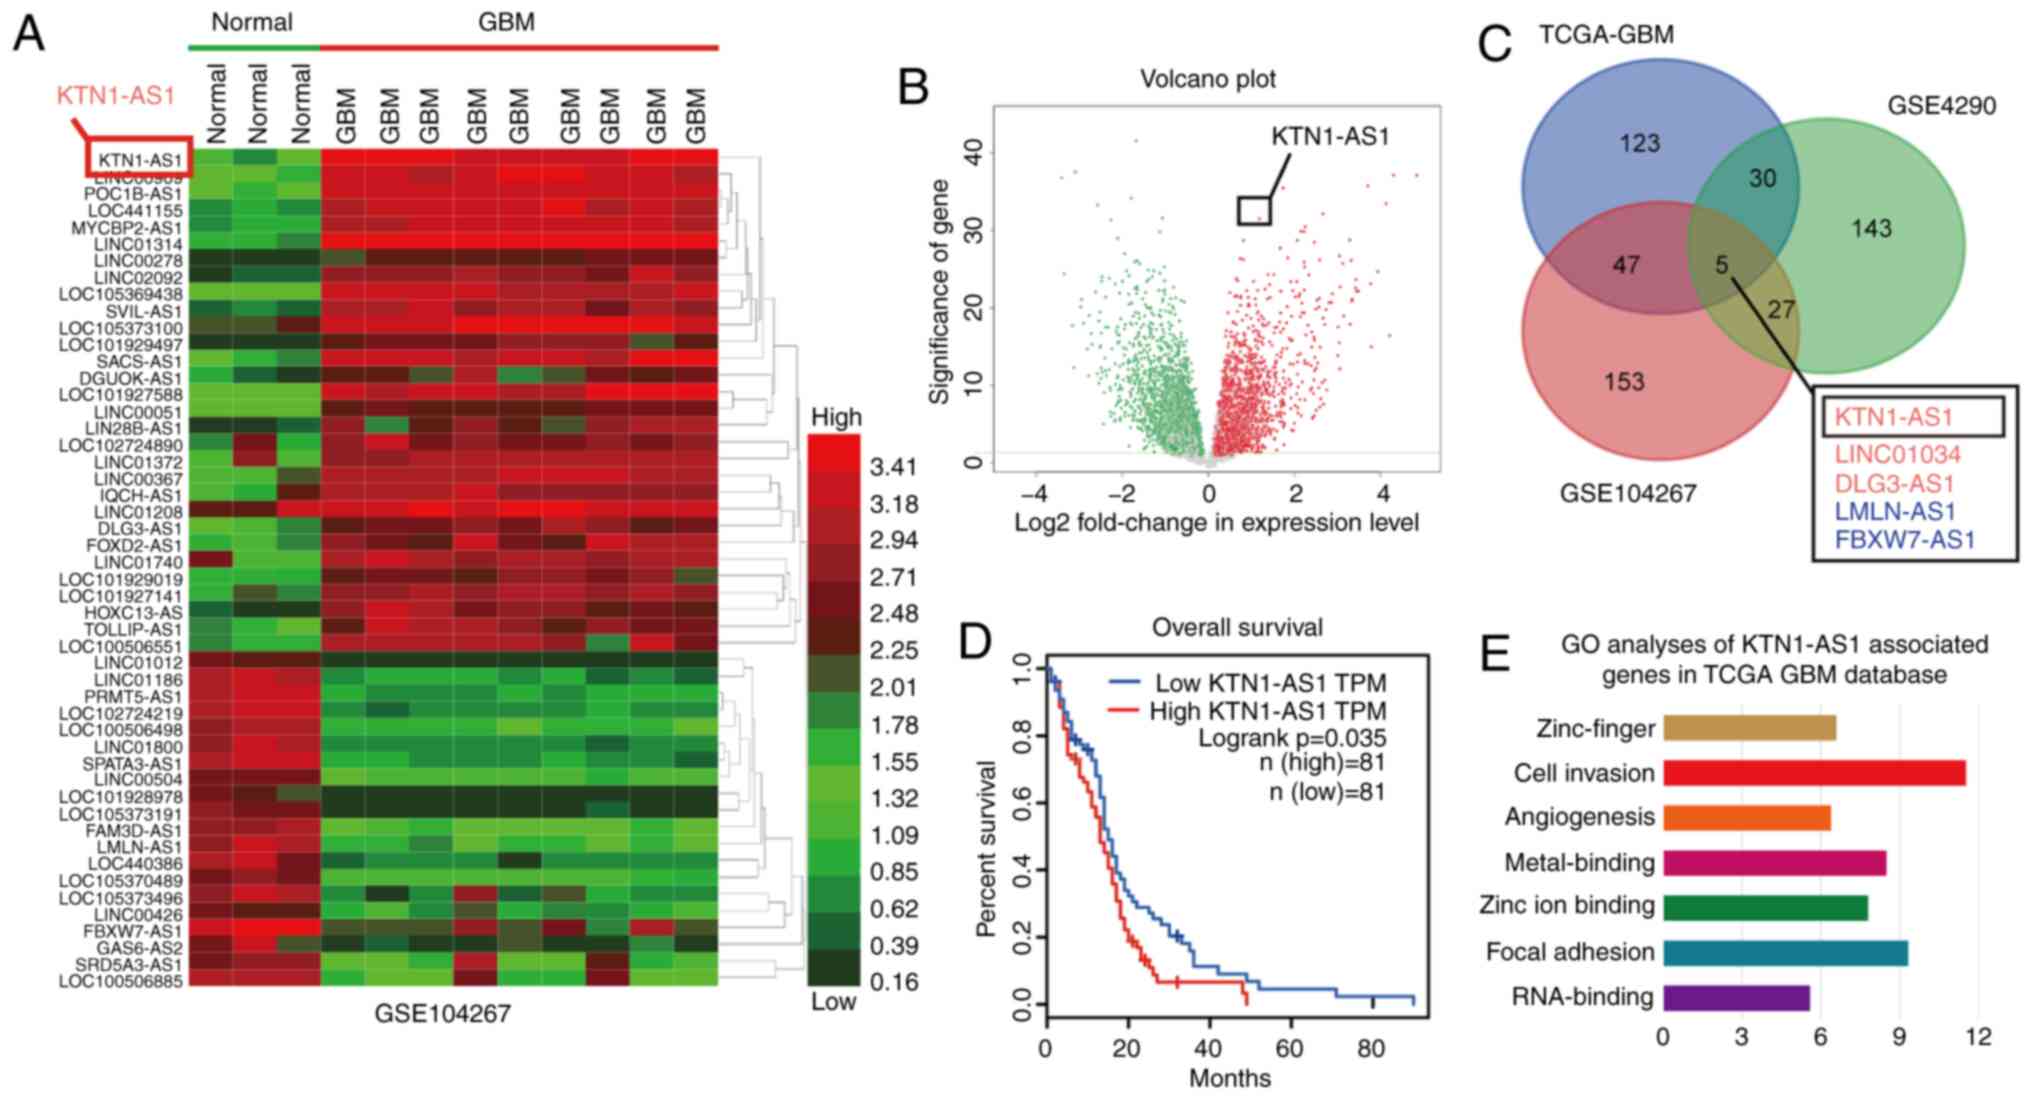 | Figure 1.KTN1-AS1 was overexpressed in GBM
tissues. (A) Hierarchical clustering analysis showing lncRNAs that
are differentially expressed in the GEO dataset (GSE104267; glioma
tissues, n=3; normal tissues, n=9; FC>2.0; P<0.01). (B)
Volcano plot suggested that KTN1-AS1 was upregulated in the two
groups of lncRNA from GEO database. (C) Five significantly
differentially expressed lncRNAs were determined in TCGA, GSE104267
and GSE4290 datasets. (D) Kaplan-Meier survival curve of GBM
patients (TCGA) based on the levels of KTN1-AS1 (log-rank test;
P=0.0053). (E) Top-ranked genes in GO term analysis using DAVID,
indicating that genes associated with cell invasion were enriched
among those affected by KTN1-AS1. lncRNA, long non-coding RNA;
KTN1-AS1, Kinectin 1 Antisense RNA 1; GBM, glioblastoma; GO, Gene
Ontology; TCGA, The Cancer Genome Atlas; GEO, the Gene Expression
Omnibus; TPM, Trans per kilobase of exon model per million. FC,
fold change; FDR, false discovery rate. |
Effect of miR-505-3p on glioma cell viability and
invasion. KTN1-AS1 expression was also investigated in glioma cells
compared with NHA cells, and the results demonstrated that KTN1-AS1
was most highly expressed in T98G and U251 cells among the glioma
cell lines (P<0.01 and P<0.001). These two cell lines were
therefore chosen for subsequent experiments (Fig. 2B). To identify the biological
function of KTN1-AS1 in the progression of glioma, T98G and U251
cells were transfected with si-KTN1-AS1/si-NC or
pcDNA3.1-KTN1-AS1/NC, and the cell proliferation and invasive
ability were determined. The transfection efficiencies were
confirmed by RT-qPCR, where KTN1-AS1 expression level was
significantly increased or increased compared with corresponding NC
groups (Fig. 2C). The results from
CCK-8 assay indicated that KTN1-AS1 knockdown significantly
decreased T98G and U251 cell proliferation after 24 h (Fig. 2D; P<0.05). Furthermore, silencing
KTN1-AS1 could significantly decrease glioma cell invasive ability
in vitro (Fig. 2E; T98G
cells, P<0.01; U251 cells, P<0.05).
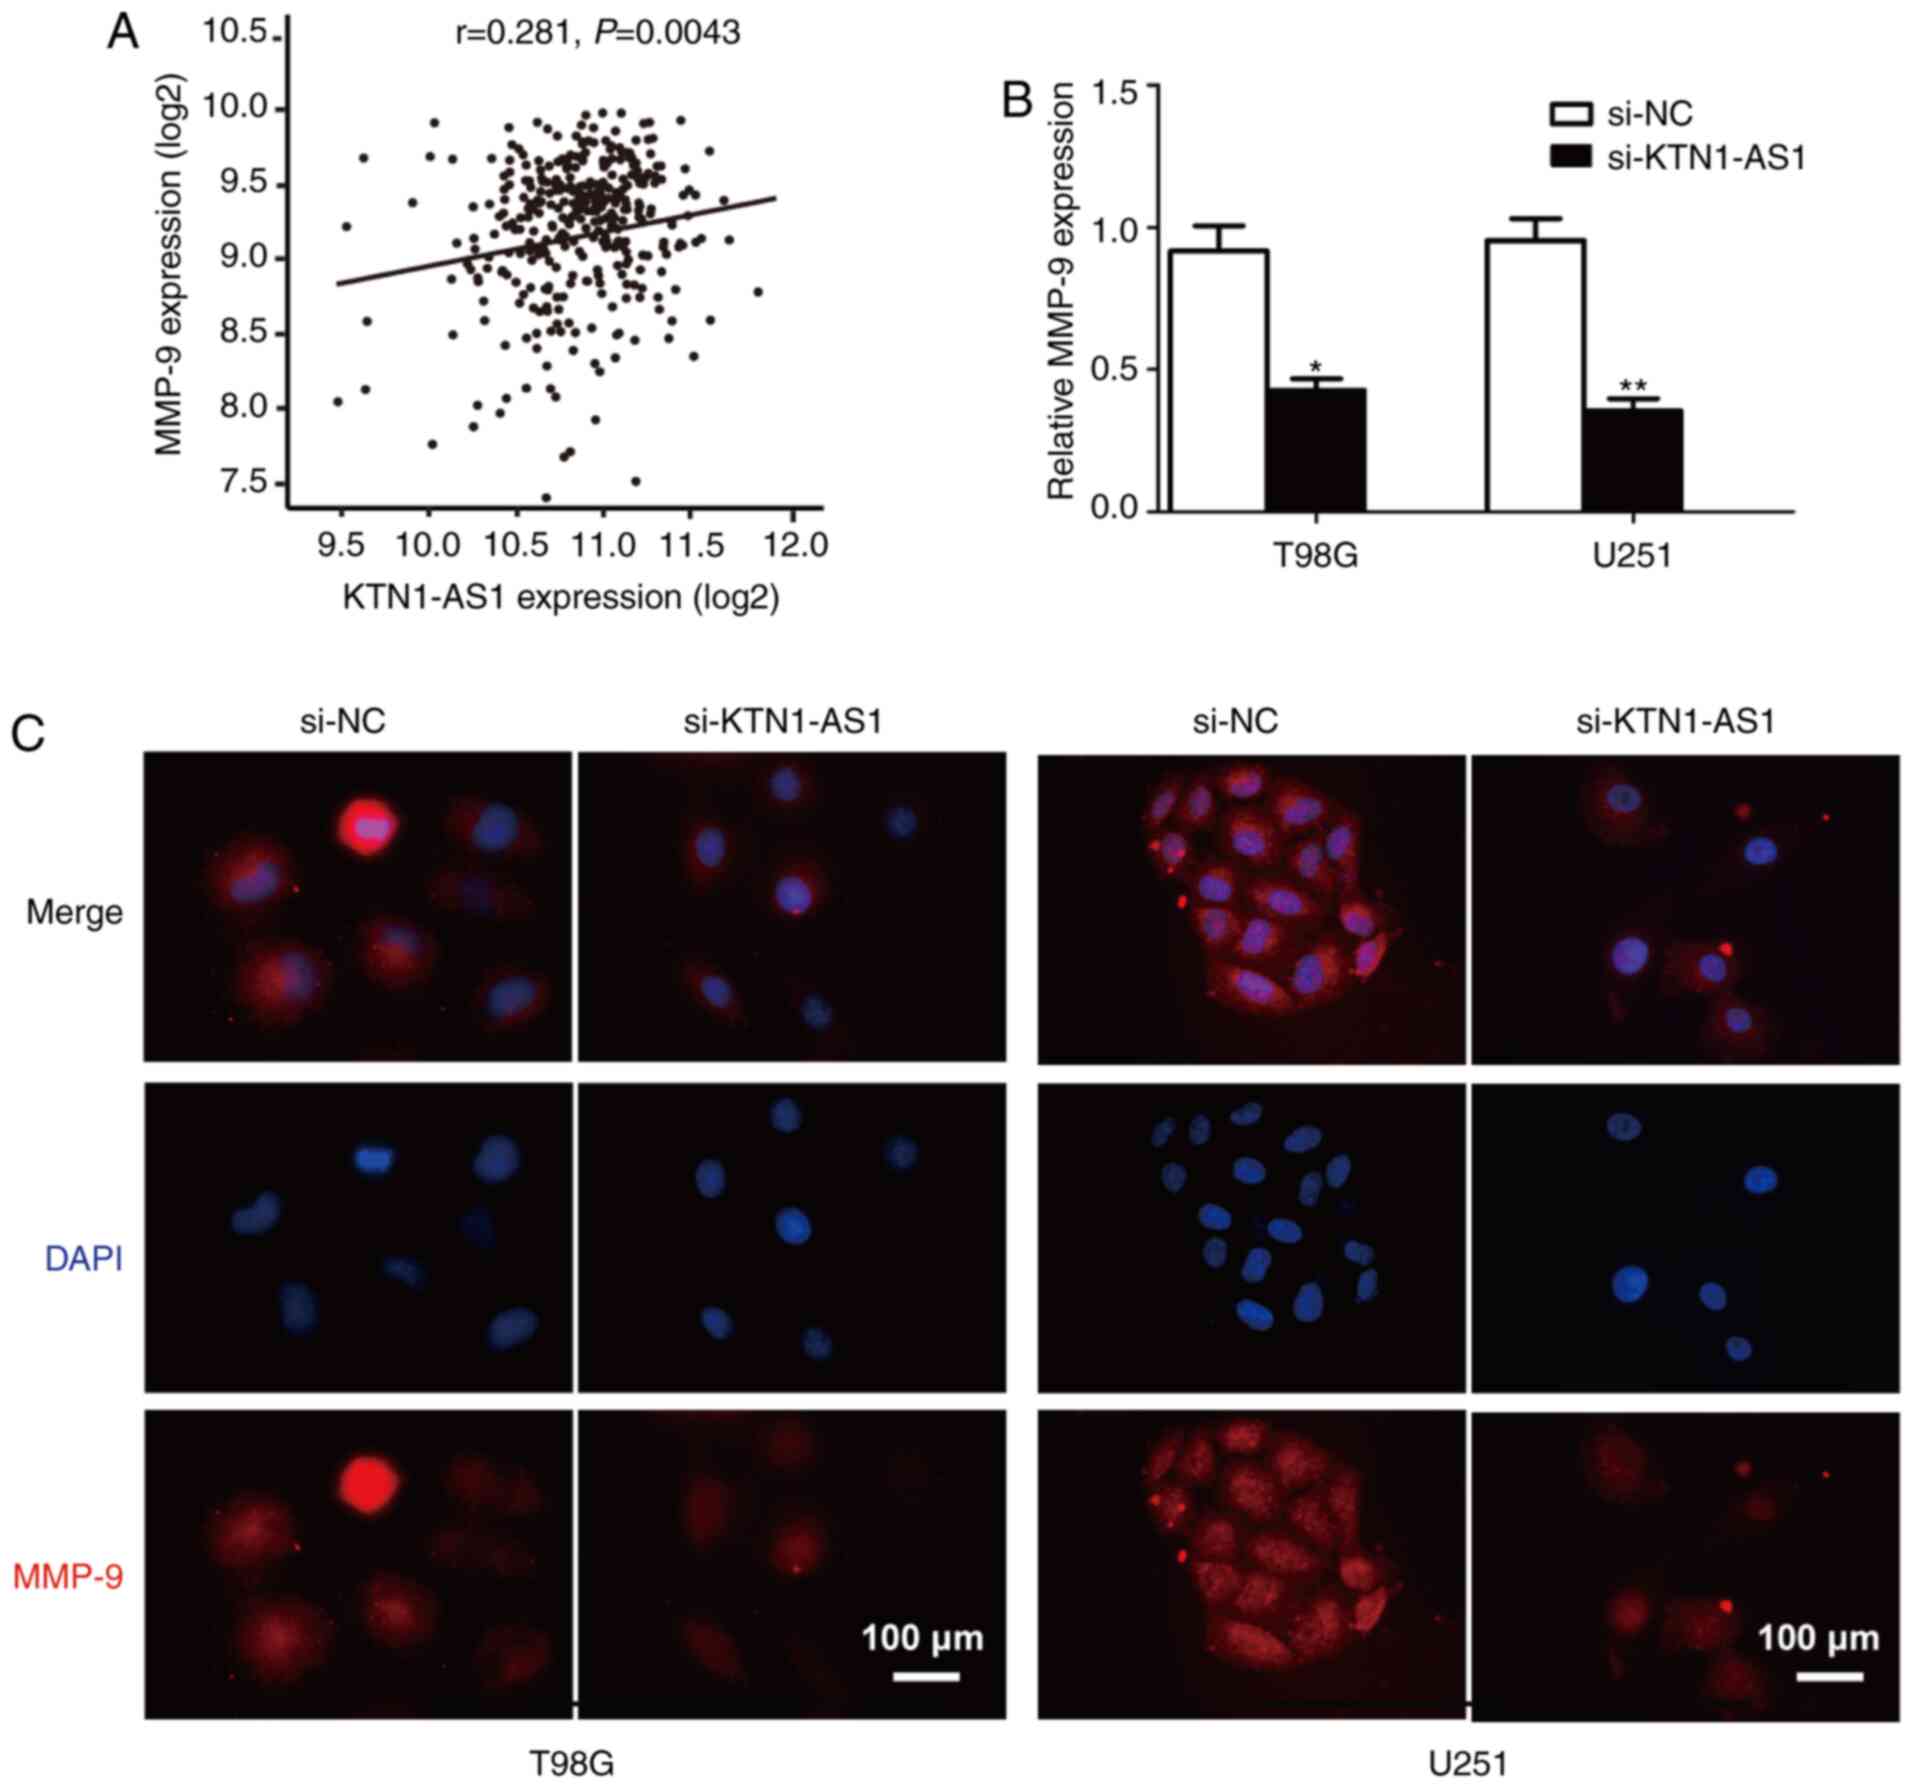
Invasion and metastasis serve crucial roles in
tumorigenesis. To further determine the underlying mechanism by
which KTN1-AS1 could affect the invasive ability of glioma cells,
analysis of the TCGA-GBM database was performed. The results
demonstrated that KTN1-AS1 expression was positively correlated
with expression of matrix metalloproteinase-9 (MMP-9; r=0.281;
P=0.0043; Fig. 3A), which is a
marker of cell invasion (30).
Then, the expression level and cellular location of MMP-9 were
determined in glioma cells following KTN1-AS silencing. The results
demonstrated that KTN1-AS1 knockdown significantly decreased the
expression of MMP-9 in glioma cells (Fig. 3B and C). Taken together, these
findings suggested that KTN1-AS1 knockdown may inhibit
proliferation and invasive ability of glioma cells.
Correlation between KTN1-AS1 and
miR-505-3p
To investigate the subcellular localization of
KTN1-AS1, the nuclear and cytoplasmic fractions of T98G glioma
cells were explored. As presented in Fig. 4A, KTN1-AS1 was predominantly
localized in the cytoplasm, indicating that KTN1-AS1 may exert both
transcriptional and post-transcriptional regulatory functions on
glioma cell lines. By using DIANA tools and starBase V2.0 database
blast prediction, it was reported that KTN1-AS1 contained a
putative targeting site for miR-23b-3p, miR-23c-3p and miR-505-3p.
Subsequently, following overexpression or silencing of KTN1-AS1 in
T98G cells, it was observed that miR-505-3p could be downregulated
or upregulated at the mRNA level (Fig.
4B and C). In addition, miR-505-3p expression level was
significantly decreased in GMB tissues compared with adjacent
normal tissues (P<0.001; Fig.
4D). Analysis of TCGA-GBM database indicated that low level of
miR-505-3p in patients with GBM was associated with better
prognosis (n=162; P<0.05; Fig.
4E). Furthermore, miR-505-3p and KTN1-AS1 expression levels in
clinical GBM tissues from patients were negatively correlated
(n=35; R=−0.3552; P=0.0363; Fig.
4F). Decreased miR-505-3p expression was also observed in
glioma cells compared with NHA cells (P<0.05; F=35.37; Fig. 4G). Subsequently, T98G and U251 cells
were transfected with miR-505-3p mimics, miR-505-3p inhibitor and
miR-NC. The results demonstrated that miR-505-3p was significantly
increased or decreased in transfected cells compared with NC group
(Fig. 4H). The luciferase reporter
assay was then conducted to confirm the putative miR-505-3p target
site. In addition, luciferase reporters carrying either the
predicted miR-505-3p WT (KTN1-AS1-WT) or its mutated fragment
(KTN1-AS1-MUT) were constructed (Fig.
4I). The results indicated that miR-505-3p significantly
inhibited the luciferase activity in cells transfected with
KTN1-AS1-WT but not in cells transfected with KTN1-AS1-MUT 3′-UTR
(Fig. 4J). These data suggested
that KTN1-AS1 may interact with miR-505-3p in glioma cells.
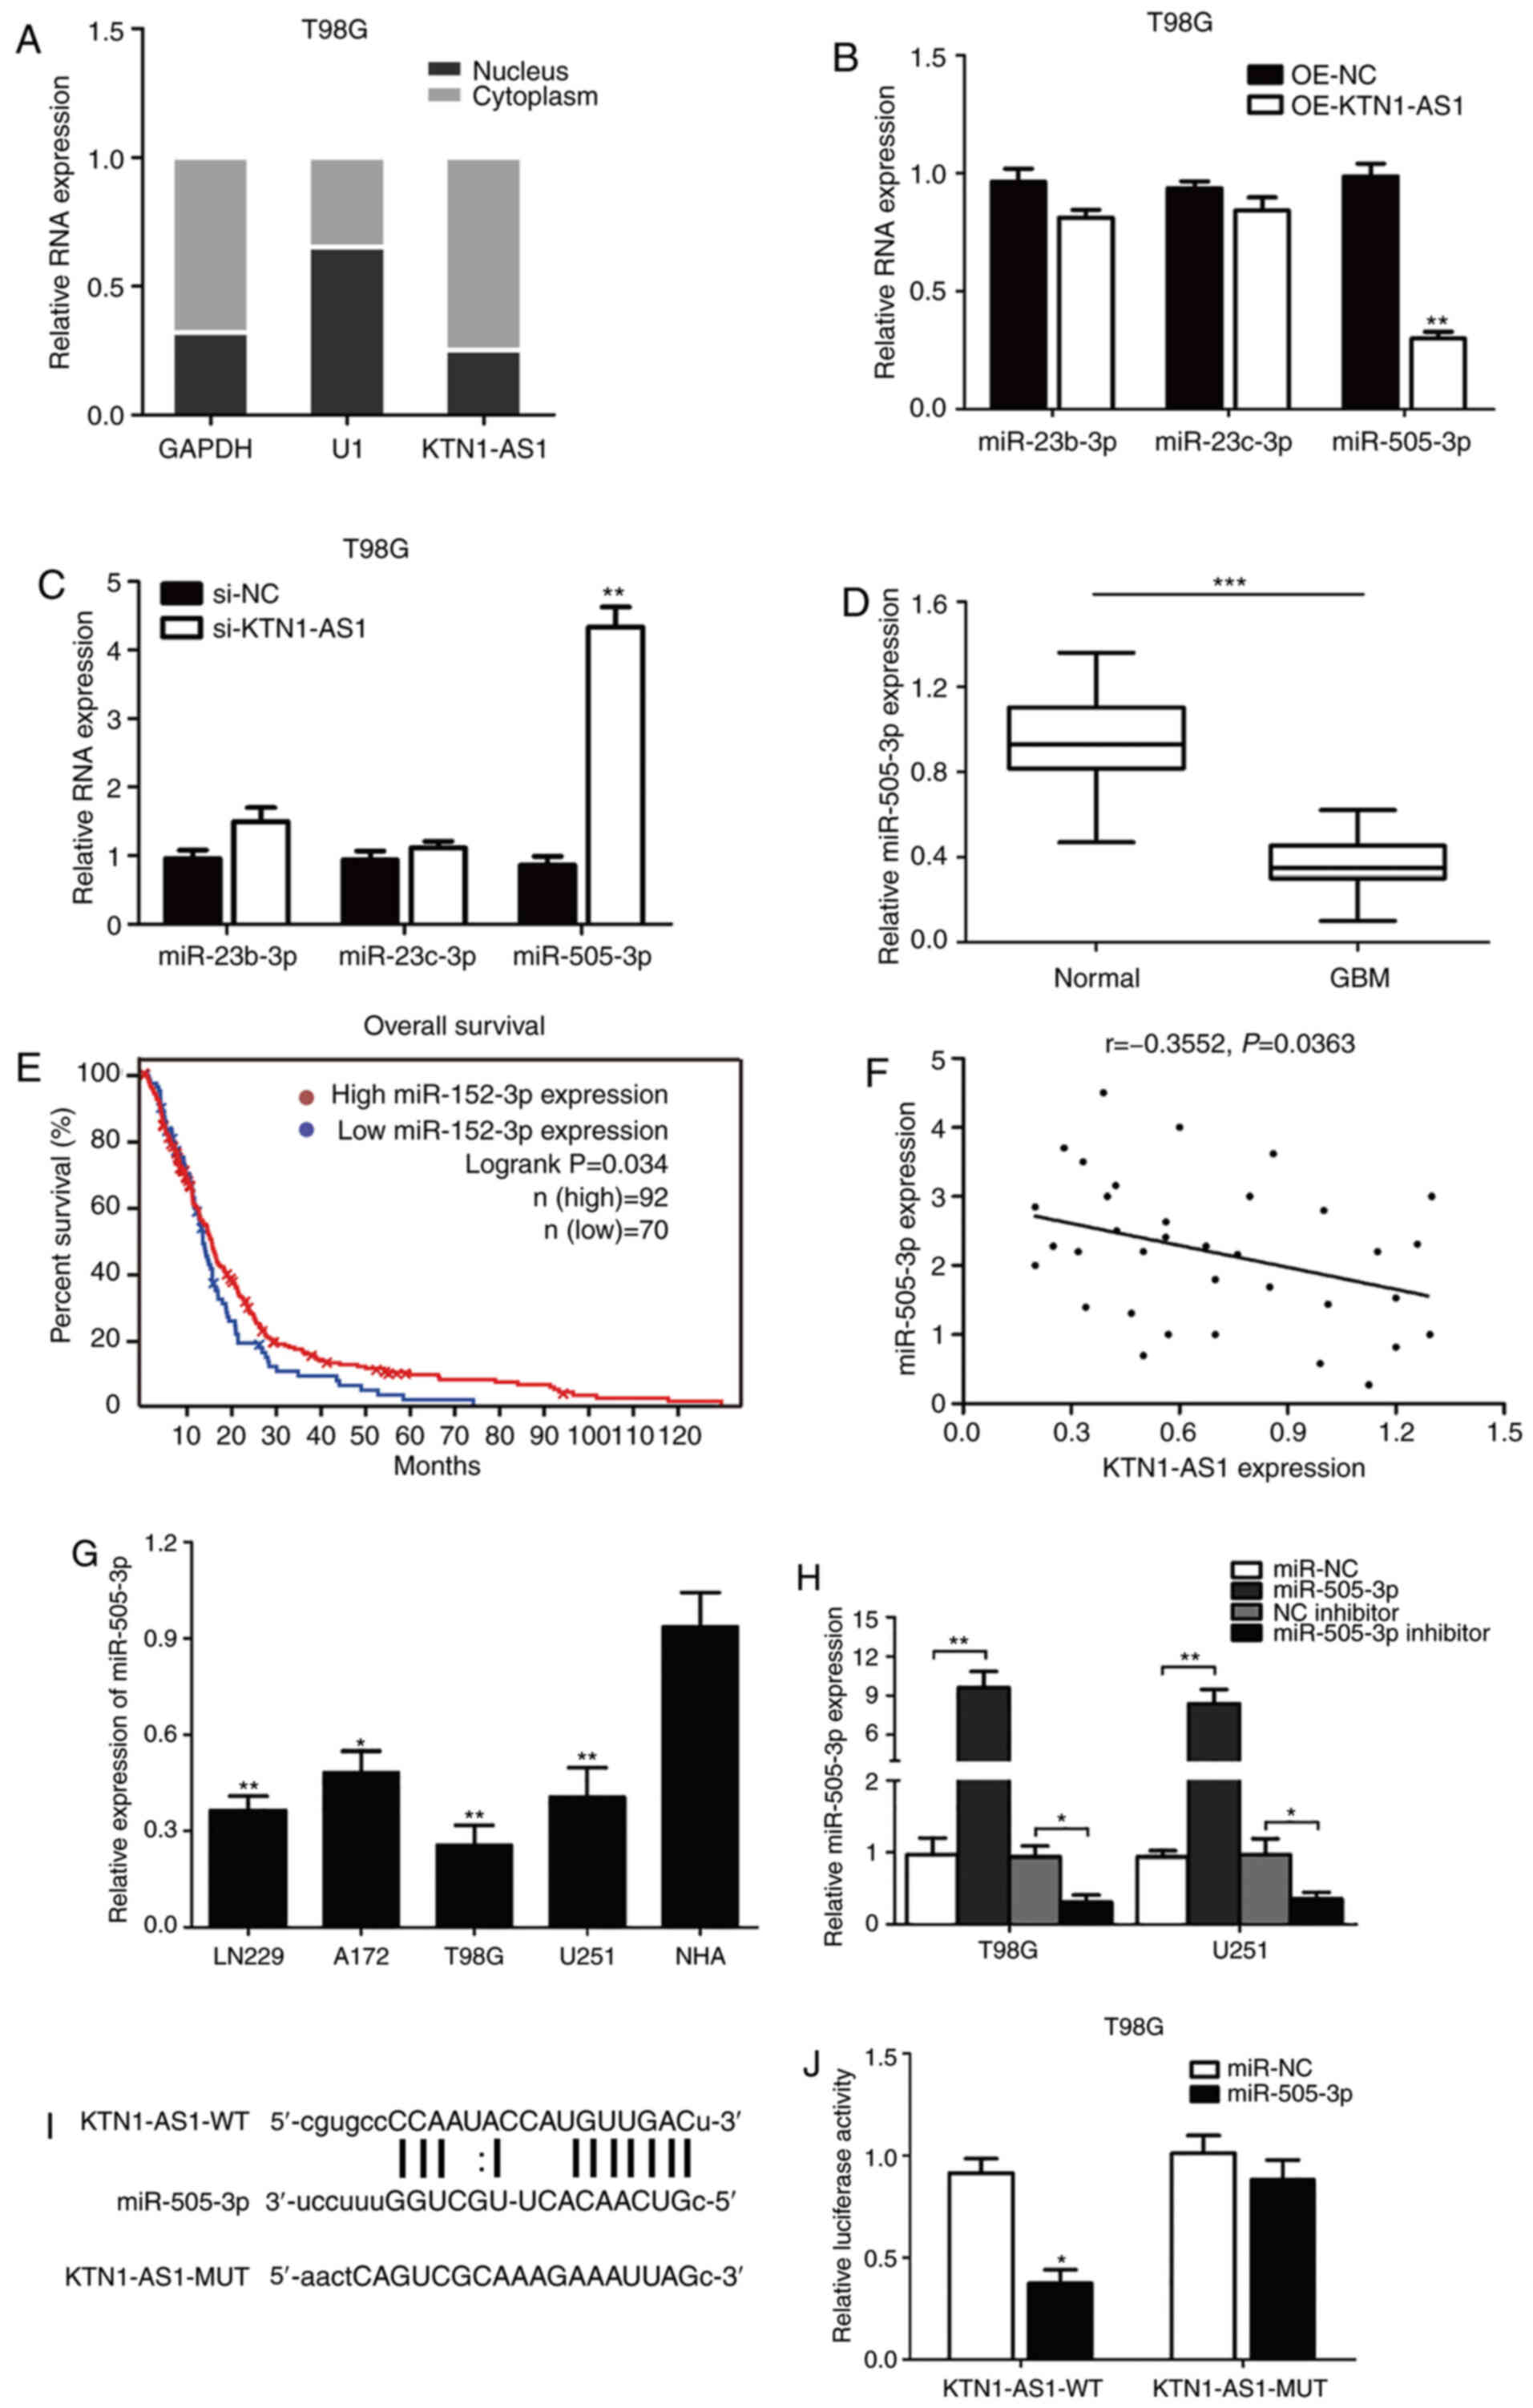 | Figure 4.KTN1-AS1 was targeted by miR-505-3p
at 3′-UTR. (A) Expression of KTN1-AS1 in subcellular fractions was
examined by RT-qPCR in T98G cells. Black range indicates nuclear
fraction and gray range indicates cytoplasmic fraction. (B and C)
Expression of the predicted binding miRNAs (miR-23b-3p, miR-23c-3p
and miR-505-3p) was measured by RT-qPCR following transfection with
si-KTN1-AS1 or OE-KTN1-AS1. (D) Decreased expression of miR-505-3p
was identified in glioma tissues compared with normal tissues
(P<0.001). (E) Patients with low level of miR-505-3p had better
prognosis compared with patients with high miR-505-3p level in TCGA
database (log-rank test; P=0.034). (F) Correlation between KTN1-AS1
and miR-505-3p levels was detected. (G) miR-505-3p level in glioma
cell lines was analyzed by RT-qPCR. (H) miR-505-3p level was
determined in T98G and U251 cells transfected with miRNA
mimics/miR-NC or inhibitor/NC inhibitor by RT-qPCR. (I) Predicting
binding sites of miR-505-3p on KTN1-AS1. Relative luciferase
activity was measured after co-transfection with miR-505-3p mimics
and psiCHECK2-KTN1-AS1-WT in T98G cells. (J) Luciferase activity
was determined 24 h after transfection using a dual luciferase
assay. Data were presented as the means ± standard error of the
mean of at least three independent experiments. *P<0.05,
**P<0.01 and ***P<0.001. KTN1-AS1, Kinectin 1 Antisense RNA
1; miR, microRNA; UTR, untranslated region; GBM, glioblastoma;
RT-qPCR, reverse transcription-quantitative PCR; NC, negative
control; si, small interfering; WT, wild-type; MUT, mutant; OE,
overexpressing. |
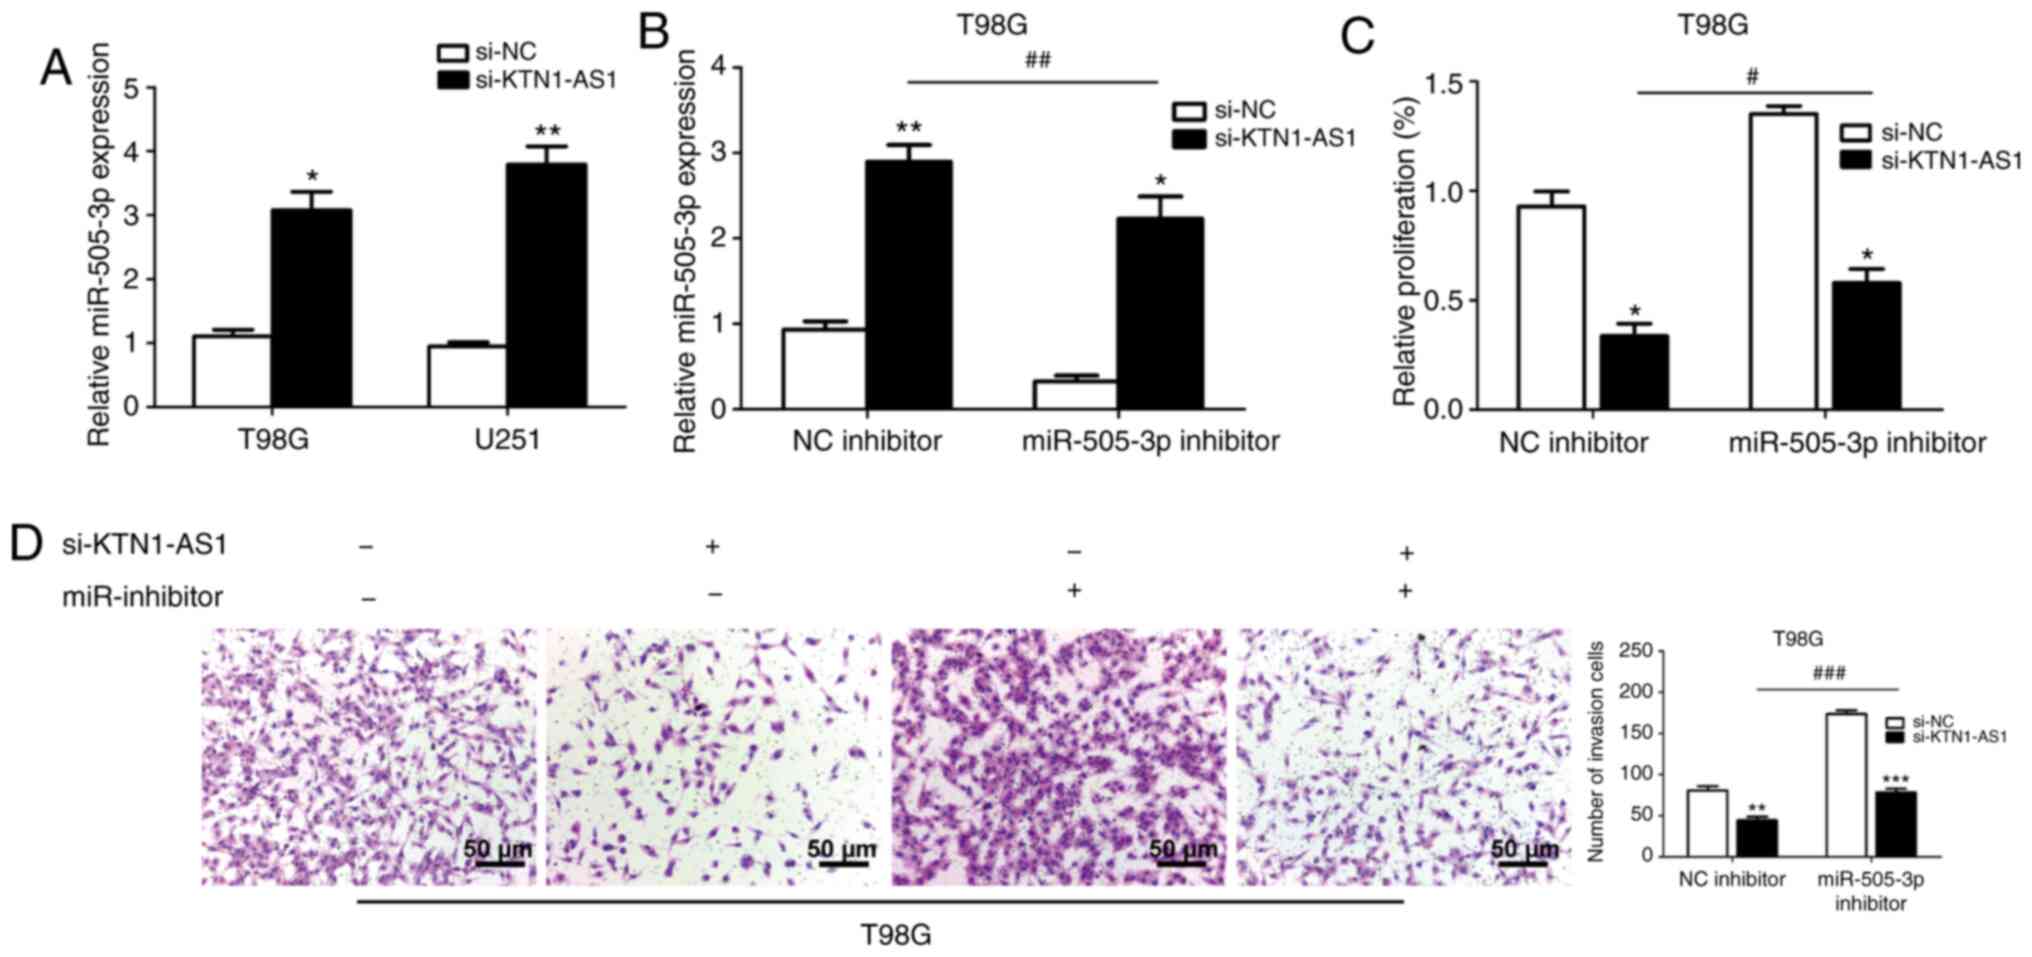
miR-505-3p abrogates the effect of
KTN1-AS1 in glioma cells
miR-505-3p was determined to be negatively
associated with KTN1-AS1 in glioma tissues. The expression of
miR-505-3p was significantly elevated in KTN1-AS1-silenced cells
compared with si-NC cells (Fig.
5A). Subsequently, rescue experiments were performed in T98G
cells. Co-transfection of miR-505-3p inhibitor and si-KTN1-AS1 led
to a decreased level of miR-505-3p expression compared with
miR-inhibitor NC + si-KTN1-AS1 group (Fig. 5B). In addition, the expression of
miR-505-3p was increased when cells were co-transfected with
si-KTN1-AS1 and miR-505-3p inhibitor compared with si-NC +
miR-505-3p inhibitor group. The results from CCK-8 assay
demonstrated that miR-505-3p inhibitor could decrease the
proliferation induced by silencing KTN1-AS1 (Fig. 5C). Transwell assay results showed
that miR-505-3p inhibitor could inhibit the invasive ability
induced by silencing KTN1-AS1 (Fig.
5D). These findings suggested that miR-505-3p may be considered
as an essential mediator of KTN1-AS1-regulated proliferation and
invasion.
KTN1-AS1-silencing significantly
suppresses tumor growth in vivo
To further determine the effect of KTN1-AS1
silencing in vivo, BALB/c nude mice were intracranially
inoculated with T98G-luc cells with si-NC or si-KTN1-AS1. BLI of
mice was conducted to identify the role of si-KTN1-AS1 on glioma
tumor growth. The data demonstrated that tumor formation in
KTN1-AS1 silencing group was significantly lower compared si-NC
group (P<0.05; Fig. 6A and B).
To further determine the inhibitory role of si-KTN1-AS1 on glioma
progression in nude mice, the overall survival of mice (n=8 per
group) was determined by Kaplan-Meier analysis. The
si-KTN1-AS1-treated group displayed a significant improvement in
survival compared with the si-NC group (P=0.0008; Fig. 6C). These findings suggested that
KTN1-AS1 may promote the tumorigenicity in vivo.
Discussion
Glioblastoma is a highly invasive type of cancer
(1,2). Despite the optimization of current
treatments, the clinical outcome of patients remains poor (4). Previous studies demonstrated that
aberrantly expressed molecules in tumors play an important role in
tumorigenesis and predict patient survival outcomes (11–14).
Cancer-specific lncRNAs have been reported to contribute to tumor
progression in various types of cancer, including oesophageal
cancer, pancreatic cancer, nasopharyngeal carcinoma, hepatocellular
carcinoma, cervical cancer, colorectal cancer and gastric cancer
(31). However, the association
between lncRNAs and glioma tumorigenesis remains unclear. To the
best of our knowledge, the present study was the first to
investigate the expression of KTN1-AS1 in GBM. The results from
this study demonstrated a higher KTN1-AS1 expression level and
lower miR-505-3p expression level in GBM tissues and cell lines
compared with normal tissues and cells.
The results from the present study suggested that
increased KTN1-AS1 expression may predict poor outcome in patients
with glioma. It was found that decreased expression of KTN1-AS1
could suppress glioma cell proliferation and invasive ability in
vitro. The data demonstrated that KTN1-AS1 may exert its role
mainly by directly targeting miR-505-3p. To support that theory,
the tumor suppressor role of miR-505-3p was further investigated.
The results demonstrated that transfection with miR-inhibitor could
impede the si-KTN1-AS1 tumor-suppressive effect on glioma cell
proliferation and invasive ability. These findings confirmed the
negative correlation between KTN1-AS1 and miR-505-3p in glioma
progression.
The competing endogenous RNA (ceRNA) theory is the
most important theory for lncRNAs, which have been shown to act as
sponges for regulating the expression and function of miRNAs
(32). The lncRNA
metastasis-associated lung adenocarcinoma transcript 1 was
identified as an oncogene in lung cancer development (33). Furthermore, the lncRNA myocardial
infarction associated transcript (MIAT) can regulate the biological
functions via the MIAT/miR-29a-3p/HDAC4 axis, suggesting its vital
role in the diagnosis of gastric cancer (34). Li et al (35) reported that the lncRNA linc00645 can
promote glioma progression by modulating the miR-205-3p/ZEB1
axis.
It was concluded that KTN1-AS1 may function as a
ceRNA of miR-505-3p. Numerous studies have revealed that the
aberrant expression of miRNAs serves a vital functional regulator
in the development and progression of certain cancers, including
lung, gastric, breast and prostate cancers (36–40).
Want et al (41) reported
that downregulation of miR-505 can promote malignant biological
behavior in breast cancer. Shi et al (42) observed that the expression of
miR-505-3p is decreased in glioma and can suppress cell migration
and invasion. The expression of KTN1-AS1 has been reported to be
upregulated in hepatocellular carcinoma and head and neck squamous
cell carcinoma (22,23), leading therefore to patients' poor
survival rate. Taken together, the findings from the present
results highlighted the essential role of the KTN1-AS1/miR-505-3p
axis on the regulation of glioma progression.
In conclusion, this study demonstrated that KTN1-AS1
may function as an oncogene by sponging miR-505-3p or acting as its
ceRNA. The present study focused on KTN1-AS1 modulated signaling
via miRNAs, which was relatively novel. The data demonstrated the
vital roles of KTN1-AS1 and revealed novel mechanisms underlying
the proliferation and invasive ability of glioma cells. These
findings suggest that KTN1-AS1 may be considered as a potential
prognostic biomarker for glioma.
Acknowledgements
Not applicable.
Funding
The present study was supported by Heilongjiang
Postdoctoral Grant (grant no. LBH-Z14205) and the Scientific
Research Project of Health and Family planning commission of
Heilongjiang Province (grant no. 2017-069).
Availability of data and materials
All data generated or analyzed during this study are
included in this published article.
Authors' contributions
YM and QT designed the study, performed experiments,
analyzed the data and wrote the manuscript. YM performed the in
vitro experiments. HF and LZ analyzed the data and drafted the
manuscript. YW designed and supervised the study and edited the
manuscript. All authors read and approved the final manuscript.
Ethics approval and consent to
participate
The present study was approved by the Ethics
Committee of The Institutional Review Board of Harbin Medical
University (Harbin, China; approval no. 2018HMUIRB0113) and all
procedures were performed in accordance with national (D.L.n.26,
March 4th, 2014) and international laws and policies (directive
2010/63/EU). Written informed consent was provided by all patients
prior to the study start.
Patient consent for publication
Not applicable.
Competing interests
The authors declare that they have no competing
interests.
References
|
1
|
Bray F, Ferlay J, Soerjomataram I, Siegel
RL, Torre LA and Jemal A: Global cancer statistics 2018: GLOBOCAN
estimates of incidence and mortality worldwide for 36 cancers in
185 countries. CA Cancer J Clin. 68:394–424. 2018. View Article : Google Scholar : PubMed/NCBI
|
|
2
|
Le Rhun E, Preusser M, Roth P, Reardon DA,
van den Bent M, Wen P, Reifenberger G and Weller M: Molecular
targeted therapy of glioblastoma. Cancer Treat Rev. 80:1018962019.
View Article : Google Scholar : PubMed/NCBI
|
|
3
|
Bernstock JD, Mooney JH, Ilyas A, Chagoya
G, Estevez-Ordonez D, Ibrahim A and Nakano I: Molecular and
cellular intratumoral heterogeneity in primary glioblastoma:
Clinical and translational implications. J Neurosurg. 23:1–9.
2019.
|
|
4
|
Aldape K, Zadeh G, Mansouri S,
Reifenberger G and von Deimling A: Glioblastoma: Pathology,
molecular mechanisms and markers. Acta Neuropathol. 129:829–848.
2015. View Article : Google Scholar : PubMed/NCBI
|
|
5
|
Delgado-Martín B and Medina MÁ: Advances
in the knowledge of the molecular biology of glioblastoma and its
impact in patient diagnosis, stratification, and treatment. Adv
Sci. 7:19029712020. View Article : Google Scholar
|
|
6
|
Hara A, Kanayama T, Noguchi K, Niwa A,
Miyai M, Kawaguchi M, Ishida K, Hatano Y, Niwa M and Tomita H:
Treatment strategies based on histological targets against invasive
and resistant glioblastoma. J Oncol. 2019:29647832019. View Article : Google Scholar : PubMed/NCBI
|
|
7
|
Garton ALA, Kinslow CJ, Rae AI, Mehta A,
Pannullo SC, Magge RS, Ramakrishna R, McKhann GM, Sisti MB, Bruce
JN, et al: Extent of resection, molecular signature, and survival
in 1p19q-codeleted gliomas. J Neurosurg. 8:1–11. 2020. View Article : Google Scholar
|
|
8
|
Zhang X, Zhang W, Mao XG, Cao WD, Zhen HN
and Hu SJ: Malignant intracranial high grade glioma and current
treatment strategy. Curr Cancer Drug Targets. 19:101–108. 2019.
View Article : Google Scholar : PubMed/NCBI
|
|
9
|
Li C, Jing H, Ma G and Liang P: Allicin
induces apoptosis through activation of both intrinsic and
extrinsic pathways in glioma cells. Mol Med Rep. 17:5976–5981.
2018.PubMed/NCBI
|
|
10
|
Tamura R, Tanaka T, Miyake K, Yoshida K
and Sasaki H: Bevacizumab for malignant gliomas: Current
indications, mechanisms of action and resistance, and markers of
response. Brain Tumor Pathol. 34:62–77. 2017. View Article : Google Scholar : PubMed/NCBI
|
|
11
|
Sanchez Calle A, Kawamura Y, Yamamoto Y,
Takeshita F and Ochiya T: Emerging roles of long non-coding RNA in
cancer. Cancer Sci. 109:2093–2100. 2018. View Article : Google Scholar : PubMed/NCBI
|
|
12
|
Wei JW, Huang K, Yang C and Kang CS:
Non-coding RNAs as regulators in epigenetics. Oncol Rep. 37:3–9.
2017. View Article : Google Scholar : PubMed/NCBI
|
|
13
|
Derrien T, Johnson R, Bussotti G, Tanzer
A, Djebali S, Tilgner H, Guernec G, Martin D, Merkel A, Knowles DG,
et al: The GENCODE v7 catalog of human long noncoding RNAs:
Analysis of their gene structure, evolution, and expression. Genome
Res. 22:1775–1789. 2012. View Article : Google Scholar : PubMed/NCBI
|
|
14
|
Gaballa JM, Braga Neto MB, Ramos GP,
Bamidele AO, Gonzalez MM, Sagstetter MR, Sarmento OF and Faubion WA
Jr: The role of histone methyltransferases and long non-coding RNAs
in the regulation of T cell fate decisions. Front Immunol.
9:29552018. View Article : Google Scholar : PubMed/NCBI
|
|
15
|
Spizzo R, Almeida MI, Colombatti A and
Calin GA: Long non-coding RNAs and cancer: A new frontier of
translational research. Oncogene. 31:4577–4587. 2012. View Article : Google Scholar : PubMed/NCBI
|
|
16
|
Li CY, Zhang WW, Xiang JL, Wang XH, Wang
JL and Li J: Integrated analysis highlights multiple long
non-coding RNAs and their potential roles in the progression of
human esophageal squamous cell carcinoma. Oncol Rep. 42:2583–2599.
2019.PubMed/NCBI
|
|
17
|
DeOcesano-Pereira C, Machado RAC,
Chudzinski-Tavassi AM and Sogayar MC: Emerging roles and potential
applications of non-coding RNAs in glioblastoma. Int J Mol Sci.
21:E26112020. View Article : Google Scholar : PubMed/NCBI
|
|
18
|
Connerty P, Lock RB and de Bock CE: Long
non-coding RNAs: Major regulators of cell stress in cancer. Front
Oncol. 10:2852020. View Article : Google Scholar : PubMed/NCBI
|
|
19
|
Renganathan A and Felley-Bosco E: Long
noncoding RNAs in cancer and therapeutic potential. Adv Exp Med
Biol. 1008:199–222. 2017. View Article : Google Scholar : PubMed/NCBI
|
|
20
|
Yang G, Lu X and Yuan L: lncRNA: A link
between RNA and cancer. Biochim Biophys Acta. 1839:1097–1109. 2014.
View Article : Google Scholar : PubMed/NCBI
|
|
21
|
Liu C, Li X, Hao Y, Wang F, Cheng Z, Geng
H and Geng D: STAT1-induced upregulation of lncRNA KTN1-AS1
predicts poor prognosis and facilitate non-small cell lung cancer
progression via miR-23b/DEPDC1 axis. Aging (Albany NY).
12:8680–8701. 2020. View Article : Google Scholar : PubMed/NCBI
|
|
22
|
Zhang L, Wang L, Wang Y, Chen T, Liu R,
Yang W, Liu Q and Tu K: lncRNA KTN1-AS1 promotes tumor growth of
hepatocellular carcinoma by targeting miR-23c/ERBB2IP axis. Biomed
Pharmacother. 109:1140–1147. 2019. View Article : Google Scholar : PubMed/NCBI
|
|
23
|
Jiang Y, Wu K, Cao W, Xu Q, Wang X, Qin X,
Wang X, Li Y, Zhang J and Chen W: Long noncoding RNA KTN1-AS1
promotes head and neck squamous cell carcinoma cell
epithelial-mesenchymal transition by targeting miR-153-3p.
Epigenomics. 12:487–505. 2020. View Article : Google Scholar : PubMed/NCBI
|
|
24
|
Cao W, Liu JN, Liu Z, Wang X, Han ZG, Ji
T, Chen WT and Zou X: A three-lncRNA signature derived from the
Atlas of ncRNA in cancer (TANRIC) database predicts the survival of
patients with head and neck squamous cell carcinoma. Oral Oncol.
65:94–101. 2017. View Article : Google Scholar : PubMed/NCBI
|
|
25
|
General Assembly of the World Medical
Association, . World medical association declaration of Helsinki:
Ethical principles for medical research involving human subjects. J
Am Coll Dent. 81:14–18. 2014.PubMed/NCBI
|
|
26
|
Barrett T, Wilhite SE, Ledoux P,
Evangelista C, Kim IF, Tomashevsky M, Marshall KA, Phillippy KH,
Sherman PM, Holko M, et al: NCBI GEO: Archive for functional
genomics data sets-update. Nucleic Acids Res. 41:D991–D995. 2013.
View Article : Google Scholar : PubMed/NCBI
|
|
27
|
Kong B, Yang T, Chen L, Kuang YQ, Gu JW,
Xia X, Cheng L and Zhang JH: Protein-protein interaction network
analysis and gene set enrichment analysis in epilepsy patients with
brain cancer. J Clin Neurosci. 21:316–319. 2014. View Article : Google Scholar : PubMed/NCBI
|
|
28
|
Hawkins SF and Guest PC: Multiplex
analyses using real-time quantitative PCR. Methods Mol Biol.
1546:125–133. 2017. View Article : Google Scholar : PubMed/NCBI
|
|
29
|
Chen X, Robinson DG and Storey JD: The
functional false discovery rate with applications to genomics.
Biostatistics. 28:kxz0102019. View Article : Google Scholar
|
|
30
|
Zhang JF, Wang P, Yan YJ, Li Y, Guan MW,
Yu JJ and Wang XD: IL-33 enhances glioma cell migration and
invasion by upregulation of MMP2 and MMP9 via the ST2-NF-κB
pathway. Oncol Rep. 38:2033–2042. 2017. View Article : Google Scholar : PubMed/NCBI
|
|
31
|
Yao Z, Zhang Y, Xu D, Zhou X, Peng P, Pan
Z, Xiao N, Yao J and Li Z: Research progress on long non-coding RNA
and radiotherapy. Med Sci Monit. 25:5757–5770. 2019. View Article : Google Scholar : PubMed/NCBI
|
|
32
|
Jalali S, Bhartiya D, Lalwani MK,
Sivasubbu S and Scaria V: Systematic transcriptome wide analysis of
lncRNA-miRNA interactions. PLoS One. 8:e538232013. View Article : Google Scholar : PubMed/NCBI
|
|
33
|
Gutschner T, Hämmerle M, Eissmann M, Hsu
J, Kim Y, Hung G, Revenko A, Arun G, Stentrup M, Gross M, et al:
The noncoding RNA MALAT1 is a critical regulator of the metastasis
phenotype of lung cancer cells. Cancer Res. 73:1180–1189. 2013.
View Article : Google Scholar : PubMed/NCBI
|
|
34
|
Li Y, Wang K, Wei Y, Yao Q, Zhang Q, Qu H
and Zhu G: lncRNA-MIAT regulates cell biological behaviors in
gastric cancer through a mechanism involving the miR-29a-3p/HDAC4
axis. Oncol Rep. 6:3465–3472. 2017.
|
|
35
|
Li C, Zheng H, Hou W, Bao H, Xiong J, Che
W, Gu Y, Sun H and Liang P: Long non-coding RNA linc00645 promotes
TGF-β-induced epithelial-mesenchymal transition by regulating
miR-205-3p-ZEB1 axis in glioma. Cell Death Dis. 10:7172019.
View Article : Google Scholar : PubMed/NCBI
|
|
36
|
Rupaimoole R and Slack FJ: MicroRNA
therapeutics: Towards a new era for the management of cancer and
other diseases. Nat Rev Drug Discov. 16:203–222. 2017. View Article : Google Scholar : PubMed/NCBI
|
|
37
|
Wu M, Wang G, Tian W, Deng Y and Xu Y:
miRNA-based therapeutics for lung cancer. Curr Pharm Des.
23:5989–5996. 2018. View Article : Google Scholar : PubMed/NCBI
|
|
38
|
Shin VY and Chu KM: miRNA as potential
biomarkers and therapeutic targets for gastric cancer. World J
Gastroenterol. 20:10432–10439. 2014. View Article : Google Scholar : PubMed/NCBI
|
|
39
|
Fridrichova I and Zmetakova I: MicroRNAs
contribute to breast cancer invasiveness. Cells. 8:13612019.
View Article : Google Scholar
|
|
40
|
Deng JH, Deng Q, Kuo CH, Delaney SW and
Ying SY: miRNA targets of prostate cancer. Methods Mol Biol.
936:357–369. 2013. View Article : Google Scholar : PubMed/NCBI
|
|
41
|
Wang J, Liu H and Li M: Downregulation of
miR-505 promotes cell proliferation, migration and invasion, and
predicts poor prognosis in breast cancer. Oncol Lett. 18:247–254.
2019.PubMed/NCBI
|
|
42
|
Shi H, Yang H, Xu S, Zhao Y and Liu J:
miR-505 functions as a tumor suppressor in glioma by targeting
insulin like growth factor 1 receptor expression. Int J Clin Exp
Pathol. 11:4405–4413. 2018.PubMed/NCBI
|