Introduction
Tumor progression depends on the influence of not
only tumor cells but also surrounding stromal tissue (1), where adipocytes are the main cellular
component and thus constitute the main part of the breast cancer
microenvironment. After interacting with breast cancer cells,
adipocytes are converted into cancer-associated adipocytes (CAAs)
and, as such, promote tumor progression (2–4). There
is emerging evidence indicating that adipocytes enhance tumor
progression by mutual and dynamic cross-communication with tumor
cells (5). Adipocytes, as
well-known endocrine cells, produce several inflammatory factors,
growth factors and cytokines which, in turn, stimulate receptor
tyrosine kinase downstream signaling and programs for epithelial
mesenchymal transition (EMT) (6,7).
Specifically, tumors may turn a normal stroma into an advantageous
microenvironment by different means, such as promoting a wound
healing response or the metabolic reprogramming of adipocytes
(8,9).
From a histological and functional point of view,
two types of adipose tissue have been distinguished, white and
brown (10). White adipose tissue
(WAT) is composed of cells specialized to store excess energy, as
evidenced by the presence of one large lipid droplet (LD)
(unilocular adipocyte) filled up with triglycerides (TGs), and
characterized by an extremely low oxidative capacity, as a
consequence of a small number of thin and elongated mitochondria
(11). In contrast, brown adipose
tissue (BAT) converts excess energy into heat through uncoupled
respiration depending, in part, on the expression of uncoupling
protein 1 (UCP1) (10,12). WAT does not normally express UCP1;
nevertheless, clusters of UCP1-expressing adipocytes (named beige
or ‘brite’, as in brown in white) with thermogenic capacity develop
within WAT in response to various stimuli (13). Beige adipocytes within WAT are
defined by the morphology of the multilocular and small lipid
droplets, a high mitochondrial content and the expression of a set
of brown fat-specific genes [for example, Ucp1, Cidea (cell
death-inducing DFFA-like effector A) and Pgc1α (peroxisome
proliferator activated receptor-γ coactivator 1-α)].
In the breast, WAT is present continuously from
birth to adulthood, whereas BAT often has a temporary appearance
(14,15). Knowledge of the contribution of
brown/beige adipose cells to mammary gland physiology and how its
temporary appearance is regulated is rather limited.
Recent studies have associated brown adipocytes with
breast cancer (16–19). BAT secretes diverse soluble factors,
(‘batokines’), expresses high levels of glucose transporter 4
(GLUT4) and consumes higher levels of glucose (20). Using 18F-labeled
fluorodeoxyglucose positron emission tomography/computerized
tomography (PET/CT), a high prevalence of BAT activity was found in
breast cancer patients when compared to a weight-matched cohort of
patients with other solid tumor malignancies (16). Additionally, a persistent deposition
of brown adipose cells has been observed in the mammary glands of
BRCA1-mutant mice (17) and a
higher browning of mammary fat has been reported close to malignant
tumors compared to the vicinity of benign breast lesions (19,21).
Wu et al postulated that the preliminary step towards a
tumor-adipocyte crosstalk is the ability of tumor cells to induce
beige/brown differentiation as well as a lipolytic process in
adipocytes (19). In this context,
the question arises as to whether beige adipocytes could be new and
key actors in breast cancer development and maintenance of a
cancerous phenotype. In other words, can beige adipocytes indeed
modify the behavior of epithelial breast cancer cells?
Herein, we attempted to determine the effects of
brown/beige adipose cells on adhesion and migration, key processes
in tumor progression. For this purpose, 3T3-L1 adipocytes
differentiated in the presence of rosiglitazone, a strong inducer
of white to brown fat conversion, were used as a model of murine
beige adipocytes. Soluble and non-soluble components present in
beige adipocytes (BAs), were identified and compared with those
present in white adipocytes (WAs) by indirect immunofluorescence,
RT-qPCR and western blot analysis. The effect of soluble factors
released by WAs and BAs on adhesion and migration of NMuMG
(non-tumor) and LM3, 4T1 and MC4-L1 (tumor) mouse mammary
epithelial cell lines was studied using WA- or BA-conditioned media
(CM). Factors whose levels are modified in mammary cell lines
(non-tumor and tumor) following incubation with BA- or WA-CM for 24
h were evaluated; particularly leptin receptor (ObR), CD44,
vimentin and matrix metalloprotease (MMP)-9 (tumor progression
markers in epithelial cells) and monocarboxylate transporter (MCT)1
and lactate dehydrogenase (LDH) (metabolic markers).
The present study provides significant evidence that
BAs could promote breast cancer progression in a murine in
vitro model. However, the physiological importance of beige
adipose cells in tumor microenvironment and the regulation of
breast cancer cell behavior, remain open questions.
Materials and methods
Reagents
Culture medium Dulbecco's modified Eagle's
medium/Nutrient Mixture F12 D-MEM/F-12 (cat. no. 12400-024),
trypsin-EDTA (cat. no. 25200-072) were purchased from Gibco (Thermo
Fisher Scientific, Inc.); phenol red-free D-MEM/F-12 (cat. no.
90-090-PBR) was obtained from Corning (Mediatech, Inc.);
heat-inactivated fetal bovine serum (FBS) from Natocor;
3-isobutyl-1-methylxanthine (IBMX, cat. no. I7018), bovine serum
albumin (BSA, cat. no. 10735086001) and dexamethasone (cat. no.
D1756) were purchased from Sigma-Aldrich/Merck KGaA and
rosiglitazone (cat. no. ab120762) was from Abcam.
Culture of tumor and non-tumor mammary
cancer cells
Immortalized epithelial cell lines, derived from
tumor (4T1, LM3 and MC4-L1) and non-tumor (NMuMG) mammary cells
were used. Mouse metastatic mammary cancer cells 4T1
(ER−, PR−, HER2−) and NMuMG were
obtained from the American Type Culture Collection (ATCC). LM3 is
an immortalized mouse metastatic mammary cell line obtained from a
primary tumor (ER−, PR−, HER2+) by
Urtreger et al (22). MC4-L1
is an immortalized mouse metastatic mammary line obtained from a
primary tumor (ER+, PR+) by Lanari et
al (23). All cells were
cultured in D-MEM/F-12 medium (cat. no. 12400-024; Gibco; Thermo
Fisher Scientific, Inc.) containing 10% FBS (complete D-MEM/F-12
medium) in a humidified 5% CO2 atmosphere at 37°C. Every
2–3 days, cell culture medium was removed and replaced by complete
D-MEM/F-12 medium. All cells used were mycoplasma-free.
Culture and differentiation of
preadipocytes 3T3-L1
Murine 3T3-L1 preadipocyte cells (obtained from
ATCC) were grown in complete D-MEM/F-12 medium in a humidified 5%
CO2 atmosphere at 37°C. Cells were used between passages
12-22; adipocyte differentiation was induced as previously
described (24). Briefly, 3T3-L1
preadipocytes were seeded in 12-well plates and grown until
confluence (day 0). Two days later, an adipogenic cocktail
containing 0.5 mM IBMX, 0.1 µM dexamethasone and 0.1 µM
rosiglitazone was added and cells were cultured further for 2 days.
Subsequently, culture medium was replaced by complete D-MEM/F-12
containing 2 µM insulin until the end of the culture period,
changing the medium every other day. After 9–10 days, 90–100% cells
had differentiated into WAs, with increasing TG content and
formation of LDs, which were visualized under light microscopy
either directly or following Oil Red O staining. To obtain BAs,
3T3-L1 preadipocytes were differentiated in the presence of 1 µM
rosiglitazone for the entire culture period, following the same
protocol.
Preparation of conditioned media
(CM)
To prepare the conditioned media of mature WAs and
BAs, serum-free D-MEM/F-12 medium with 1% BSA was added to 12-well
plates containing WAs or BAs and cells were incubated for an
additional 24 h at 37°C in 5% CO2 (24). Subsequently, cells were removed by
centrifugation, supernatants collected, aliquoted and immediately
stored at −80°C. Control conditioned media (Ctrol-CM) were obtained
by incubating empty 12-well culture plates with serum-free
D-MEM/F-12 medium with 1% BSA for 24 h at 37°C in 5%
CO2. Cell-free CM were used undiluted in the
experiments.
Indirect immunofluorescence (IIF)
Preadipocyte 3T3-L1 cells were grown on coverslips
and differentiated into WAs or BAs following the protocol described
above. On day 10, coverslips were washed with phosphate-buffered
saline (PBS) and adipocytes were fixed in 4%
paraformaldehyde-sucrose (15 min), washed with PBS, permeabilized
with 0.5% Triton X-100 in PBS (10 min) and blocked with high ionic
strength buffer (20 mM Tris-HCl pH 8.0, 0.63 M NaCl, 1% BSA, 0.05%
Tween-20 and 0.02% sodium azide) at room temperature (RT) for 1 h.
Cells were incubated overnight (ON) at 4°C with polyclonal rabbit
anti-UCP1 (dilution 1:500; cat. no. U6382; Sigma-Aldrich; Merck
KGaA) or monoclonal mouse anti-GLUT4 (dilution 1:50; cat. no.
sc-53566; Santa Cruz Biotechnology, Inc.), washed with PBS and
blocked with 1% BSA in PBS (1 h at RT). Subsequently, coverslips
were incubated with FITC (dilution 1:100; cat. no. F0382;
Sigma-Aldrich; Merck KGaA) or Alexa Fluor 647 nm (dilution 1:100;
Thermo Fisher Scientific, Inc.) conjugated secondary antibody for 1
h at RT. Nuclei were counterstained with Hoechst (cat. no. 33342;
Thermo Fisher Scientific, Inc.) for 10 min. For the staining of
LDs, coverslips were inverted onto 25 µl of Lipid-TOX (dilution
1:300; HCS Lipid-TOX™ Neutral lipid Stains, Invitrogen; Thermo
Fisher Scientific, Inc.) following Hoechst staining, incubated 30
min at RT and mounted with Vectashield. Mitochondria were stained
using MitoTracker™ Green FM (cat. no. M7514; Thermo Fisher
Scientific, Inc.). Images were acquired with a Spinning
Disk-TIRF-Olympus DSU-IX83 microscope (60× objective) and analyzed
using ImageJ software (version 1.52p; NIH). A total of 200–300
cells were analyzed per condition and per experiment by two
independent observers.
Gene expression by RT-qPCR
analysis
Total RNA was extracted using Tri Reagent (cat. no.
TR118; Molecular Research Center) according to the manufacturer's
instructions. RNA quantity and quality were assessed
spectrophotometrically (NanoDrop 2000; Thermo Fisher Scientific,
Inc.). Following reverse transcription with EasyScript Reverse
Transcriptase (TransGen Biotech), 1 µl cDNA transcripts were
amplified by real-time qPCR in a StepOne Real-Time PCR System in a
25 µl reaction mixture containing 12.5 µl SYBR-Green PCR Master Mix
(both from Applied Biosystems; Thermo Fisher Scientific, Inc.) and
the appropriate primer concentration. Primers used were: UCP1
forward, 5′-GTACCAAGCTGTGCGATGTC-3′ and reverse,
5′-ACATGATGACGTTCCAGGAC-3′; CIDEA forward,
5′-TCAAACCATGACCGAAGTAGC-3′ and reverse, 5′-TCCAGCACCAGCGTAACC-3′;
GLUT4 forward, 5′-TCAACCAGCATCTTCGAGTC-3′ and reverse,
5′-AGATGGAGTGTCCGTCGTC-3′; β-actin forward,
5′-TGGCACCACACTTTCTACAAT-3′ and reverse,
5′-GGTACGACCAGAGGCATACA-3′. The amplification program used was as
follows: Initial denaturation step at 95°C for 10 min, 40
denaturation cycles at 95°C for 15 sec and annealing and extension
steps at 60°C for 1 min. The expression of selected genes was
normalized to that of b-actin gene and the comparative ΔΔCq method
(2−ΔΔCq) (25) was used
to calculate relative gene expression.
Western blotting (WB)
WB was performed to evaluate protein expression
levels in cell lysates and conditioned media. Cells were lysed in
lysis buffer (60 mM Tris-HCl, 1% SDS, pH 6.8). Sample protein
content was determined by the Bradford method. Proteins (50–80 µg)
were resolved in an SDS-PAGE 12% gel, and electrotransferred to
polyvinylidene fluoride membranes (PVDF) (Bio-Rad Laboratories,
Inc.). After blocking in 1% BSA for 1 h, the membranes were
incubated with the different primary antibodies ON at 4°C as
follows. Polyclonal rabbit anti-UCP1 (dilution 1:1,000; cat. no.
U6382; Sigma-Aldrich; Merck KGaA), polyclonal rabbit anti-leptin
(dilution 1:1,000; cat. no. ab117751; Abcam), polyclonal rabbit
anti-caveolin 1 (dilution 1:2,000; cat. no. 610060; BD Transduction
Laboratories), polyclonal goat anti-vimentin (dilution 1:50; cat.
no. V4630; Sigma-Aldrich; Merck KGaA), polyclonal rabbit
anti-perilipin 1 (dilution 1:2,000; cat. no. ab3526; Abcam),
polyclonal rabbit anti-HSL (dilution 1:1,000; cat. no. ab45422;
Abcam), monoclonal rabbit anti-FABP4 (dilution 1:1,000; cat. no.
ab219595; Abcam) and monoclonal mouse anti-adiponectin (dilution
1:1,000; cat. no. sc-136131; Santa Cruz Biotechnology, Inc.)
antibodies were used to measure protein expression in mature WAs
and BAs on day 10 and in WA-CM and BA-CM. Polyclonal rabbit
anti-MCT4 (dilution 1:500; cat. no. sc-50329 H90; Santa Cruz
Biotechnology, Inc.) antibody was used to measure protein
expression in adipocyte lysates. Vimentin, polyclonal rabbit
anti-CD44 (dilution 1:2,000; cat. no. ab157107; Abcam), polyclonal
rabbit anti-ObR (dilution 1:500; cat. no. sc-8325; Santa Cruz
Biotechnology, Inc.), polyclonal mouse anti-MCT1 (dilution 1:500;
cat. no. ab90582; Abcam), polyclonal goat anti-MMP-9 (1:500; cat.
no. AF909; R&D Systems) and polyclonal rabbit anti-LDH
(dilution 1:1,000; cat. no. ab47010; Abcam) antibodies were used to
measure protein expression after treatment of non-tumor or tumor
epithelial cells with CM. Following incubation in the primary
antibody, membranes were washed and incubated with the
corresponding HRP-conjugated secondary antibody: anti-rabbit
(dilution 1:6,000; cat. no. A0545; Sigma-Aldrich; Merck KGaA),
anti-goat (dilution 1:7,500; cat. no. A5420; Sigma-Aldrich; Merck
KGaA) or anti-mouse (dilution 1:4,000; cat. no. sc-2005; Santa Cruz
Biotechnology, Inc.). Antibody complexes were visualized by
chemiluminescence [ECL solution containing luminol (cat. no.
123072; Sigma-Aldrich; Merck KGaA), p-coumaric acid (cat.
no. C9008; Sigma-Aldrich; Merck KGaA) and
H2O2]. Bands were quantified by densitometry
using ImageJ software. Actin (dilution 1:1,000; cat. no. sc-1616;
Santa Cruz Biotechnology, Inc.) levels were used as loading
control.
Oil Red O staining and analysis of
triglyceride content
Oil Red O staining and quantification of TG content
were performed as previously described (26) using a 0.2% Oil Red O solution in 40%
2-propanol. After staining, cell images were captured in an
inverted phase-contrast microscope (Olympus CKX-41; objective 20×)
and the average number of LDs per cell recorded in WAs and BAs
using ImageJ software. TG content was quantified by incubating
culture plates in 100% 2-propanol for 10 min at RT on an orbital
shaker to elute the Oil Red O dye. The eluted dye was transferred
to a 96-well plate and the absorbance was measured at 510 nm using
a multimodal microplate reader (Synergy HTX S1LFA S/N 18062619;
BioTek Instruments). Assay was performed in quadruplicate.
Measurement of lactate in conditioned
media
To quantify extracellular lactate released by mature
WAs and BAs on day 10, CM were obtained from adipocytes incubated
with D-MEM/F-12, 1% BSA for 24 h. Supernatants were recovered, and
cell debris was removed by centrifugation. Lactate was measured by
a standard method involving the conversion of NAD+ to
NADH and subsequent spectrophotometric determination of NADH at 340
nm. A commercial kit (Sigma-Aldrich; Merck KGaA) was used to carry
out the determination as indicated by the manufacturer. Results are
expressed as µg of lactate/100 µl.
Cell adhesion assay
The adhesion capacity of cell lines was analyzed
following treatment with WA-CM or BA-CM. For this purpose,
1×10⁵ cells/well of non-tumor mammary epithelial cell
lines (NMuMG) or tumor cells (LM3, 4T1 and MC4-L1) were seeded in
12-well plates in D-MEM/F-12 supplemented with 10% FBS. Twenty-four
hours later, the cells were washed with PBS and incubated for
another 24 h with WA-CM, BA-CM or Ctrol-CM. Cells were then
harvested and re-seeded in duplicate or triplicate in a 96-well
plate (5×10⁴ cells/well). After 1 h, medium containing
the unattached cells was aspirated, adhered cells washed with PBS
and, 3 h later, adhesion was assessed by the MTS assay measuring
absorbance at 490 nm in a multimodal microplate reader (Synergy HTX
S1LFA S/N 18062619; BioTek Instruments).
Cell migration assays
Wound healing assay
The effect of WA-CM or BA-CM on the motility of
tumor and non-tumor mammary epithelial cell lines was evaluated by
wound healing assays. NMuMG, LM3, 4T1 and MC4-L1 cells were grown
on 96-well plates with supplemented D-MEM/F-12 until cells reached
100% confluence. Afterwards, cell monolayers were scratched with a
200-µl pipette tip, washed twice with PBS and WA-CM, BA-CM or
Ctrol-CM were added to the wells. CM were obtained as previously
described in a serum-free D-MEM/F-12 medium with 1% BSA and used
undiluted. Images at time zero (0 h) were obtained to record the
initial width of the wounds, and the recovery of the wounded area
was evaluated at 6 and 12 h. Images of the wound closure were
captured using an inverted microscope (Olympus CKX-41; objective
4×), quantitative analysis of wounds was performed by ImageJ
software and the relative wound closure was calculated with respect
to 0 h.
Transwell migration assay
The effect of WAs or BAs on the motility of tumor
and non-tumor mammary epithelial cells was analyzed by Transwell
migration assay. NMuMG, LM3, 4T1 and MC4-L1 mammary cell lines
(1.5×10⁴ cells/well) were placed into Transwells [8-µm
pore membrane (top); Jet BIOFIL cat. no. TCS-013-024] containing
serum-free D-MEM/F-12 1% BSA medium. The inserts were immediately
transferred to 24-well plates with mature WAs or BAs at the bottom
of the well. Given that LM3 and 4T1 epithelial cells have a high
basal migration rate whereas NMuMG and MC4-L1 cell lines present a
very low basal migration rate, Transwell migration assays were
performed for 6, 12 and 24 h in all mouse mammary cells studied.
After tumor and non-tumor mammary epithelial cells were allowed to
migrate across the membrane, the inserts were removed, washed with
PBS, and the mammary cells were fixed with cold methanol for 30
min, washed with PBS and stained with Hoechst (cat. no. 33342;
Thermo Fisher Scientific, Inc.) 1 µg/ml for 10 min and
non-migrating cells were removed with a wet cotton. Air-dried
membranes were imaged at ×40 magnification under an inverted
microscope (Olympus CK-41) and migrated cells were counted in 10
randomly chosen fields per membrane with ImageJ software.
Statistical analysis
Experiments were repeated at least twice with
similar results. Data are presented as mean ±SEM. Student's t-test,
the Mann-Whitney test or one-way analysis of variance (ANOVA)
followed by Tukey's multiple comparison test was performed as
needed. Differences were considered significant at P<0.05.
Results
Characteristics of the WAs and BAs
differentiated from 3T3-L1 preadipocytes
Indirect immunofluorescence was performed in 3T3-L1
adipose cells to assess the expression and localization of beige
markers. As expected, the presence of 1 µM rosiglitazone (Rosi), a
specific agonist of peroxisome proliferator-activated receptor γ
(PPARγ), in the differentiation cocktail significantly increased
the expression of UCP1 (Fig. 1A,
bottom panels). UCP1 showed a punctate staining pattern like the
one observed with Mitotracker (Fig.
1A vs. B, bottom panels). Interestingly, BAs displayed
round-shaped mitochondria, suggesting sustained fission activity
(Fig. 1B, white arrow head in
bottom panels), while WAs showed a mix of tubular (white arrow in
top panels, Fig. 1B) and partially
fragmented mitochondria (white arrow head in top panels Fig. 1B). Fragmented mitochondria with
round-shaped morphology were not found in undifferentiated 3T3-L1
preadipocytes treated with rosiglitazone (Fig. 1B, bottom panels, a fibroblast
adjacent to an adipocyte occupies the bottom right in first panel
and can be seen at higher magnification in third panel), excluding
an effect of PPARγ activation on fission events.
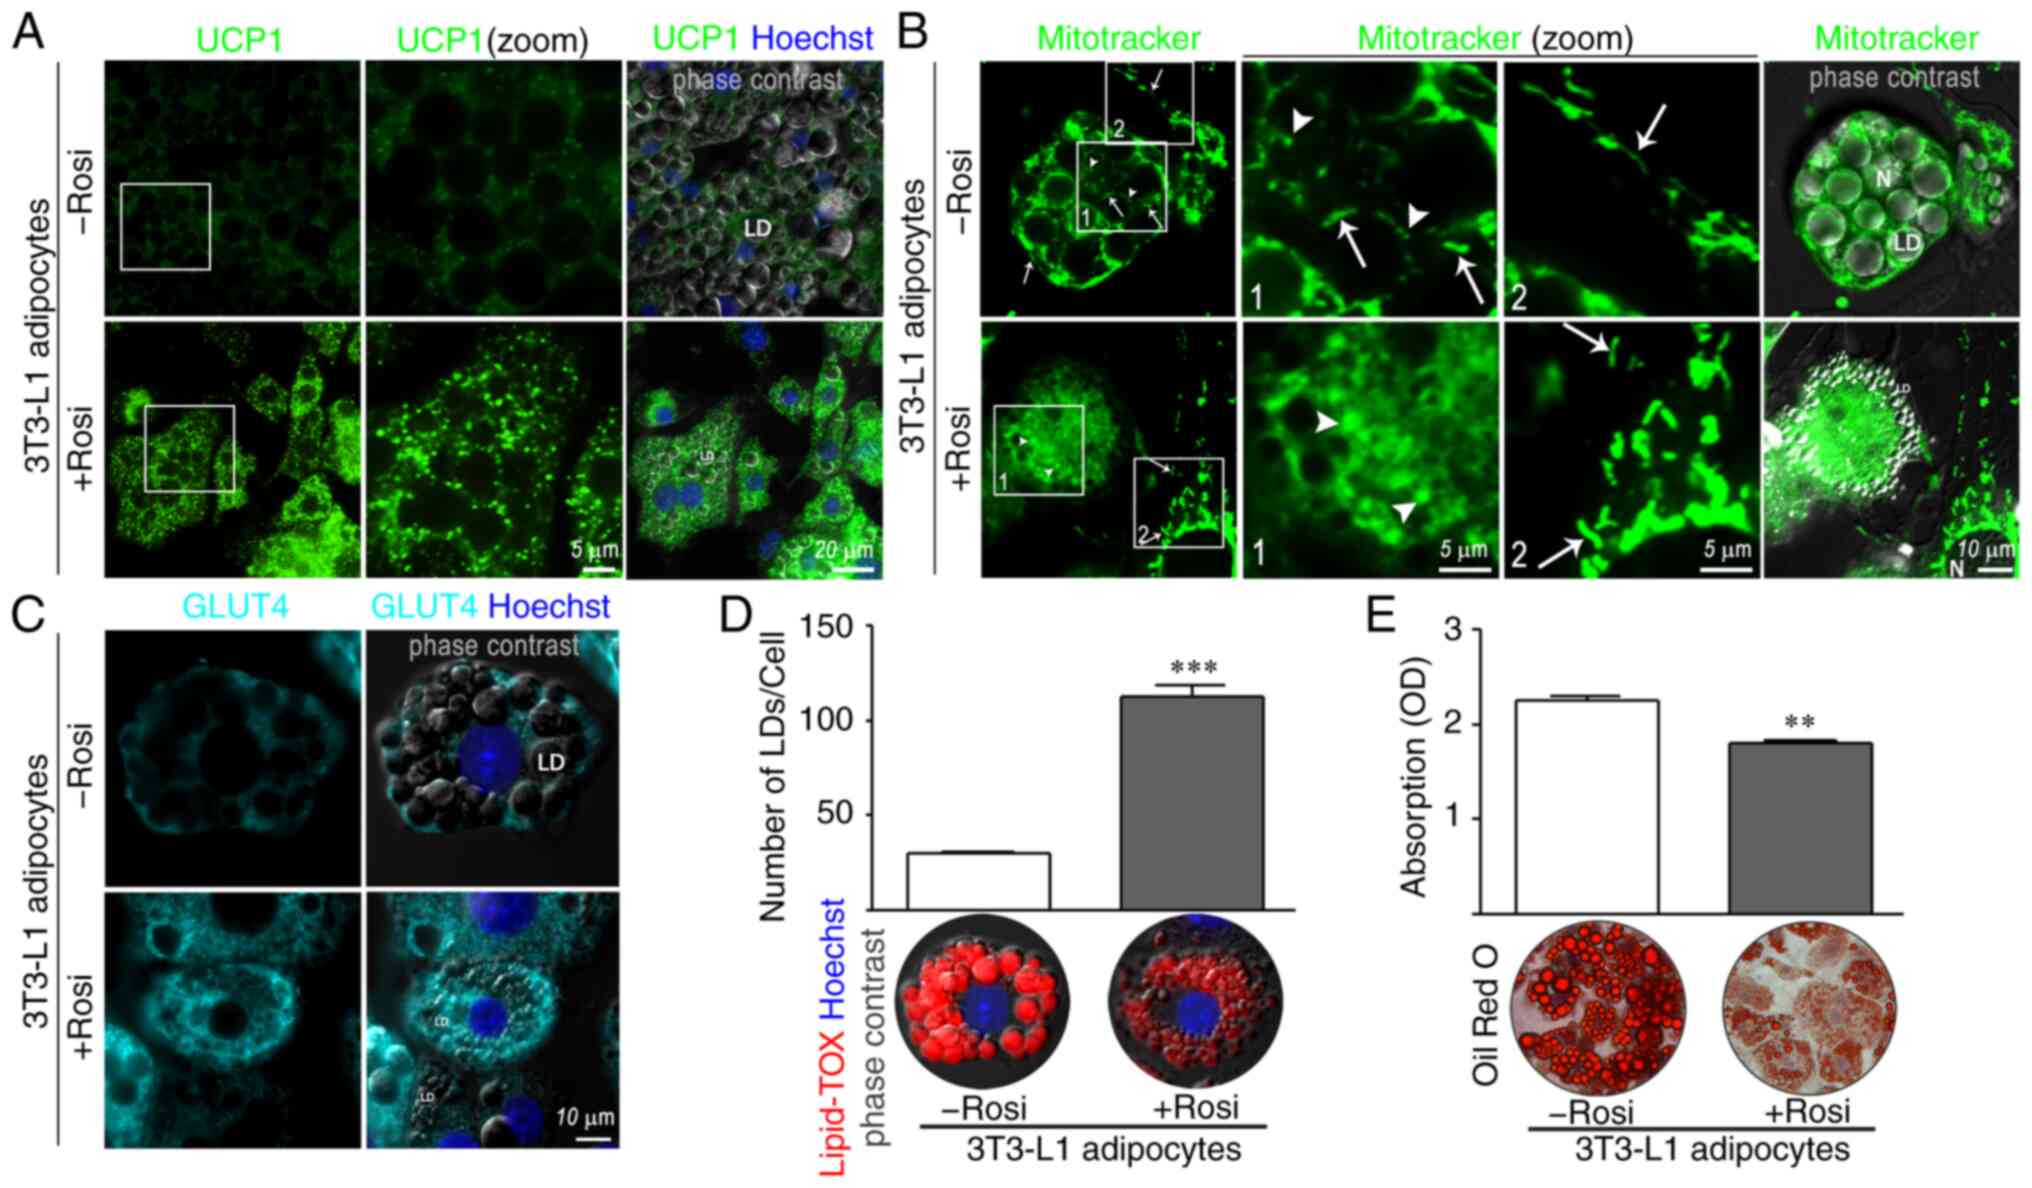 | Figure 1.Characteristics of WAs and BAs
differentiated from 3T3-L1 preadipocytes. (A and C) Expression and
localization of UCP1 and GLUT4, and localization of lipid droplets
(LDs) were evaluated by IIF. 3T3-L1 preadipocytes were grown on
coverslips and induced to differentiate into WAs (3T3-L1
adipocytes-Rosi) or BAs (3T3-L1 adipocytes +Rosi) using 1 µM
rosiglitazone (Rosi). On day 10, adipocytes were fixed and
incubated with the indicated antibodies. Nuclei were counterstained
with Hoechst. Images were analyzed by confocal microscopy
(magnification, ×600). (B) WAs or BAs were incubated with 200 nM
MitoTracker Green for 15 min followed by wash-out before imaging.
White arrow heads show examples of round-shaped mitochondria and
white arrows show examples of tubular mitochondria. Boxed areas are
shown as zoomed images on right (zoom). LD, lipid droplet; N,
nuclei. (D) LDs in WAs or BAs were stained with Lipid-TOX. The
average number of LD per cell was quantified in WAs and BAs using
ImageJ software (version 1.52p; NIH). Representative confocal
microscopy images are shown. (E) 3T3-L1 cells differentiated into
WAs or BAs, were stained with Oil Red O and images were acquired in
a phase contrast microscope. Representative light microscopy images
(magnification, ×200) are shown. TG content in WAs and BAs was
quantified by measuring the absorbance of extracted lipid stain at
510 nm. (n=4–5 experiments in triplicate). Mann-Whitney test was
performed; **P<0.01 and ***P<0.001, compared with the -Rosi
group. Rosi, rosiglitazone; WAs, white adipocytes; BAs, beige
adipocytes; TG, triglyceride; UCP1, uncoupled protein 1; GLUT4,
glucose transporter 4; IIF, indirect immunofluorescence. |
There is evidence that brown/beige adipocytes
express high levels of GLUT4, and consume glucose at significantly
higher levels (20,27). An increase in GLUT4 fluorescence
intensity was observed in BAs in comparison to WAs (Fig. 1C, bottom vs. top panels), and BAs
showed an increase in the number of micro-LDs (Fig. 1D, +Rosi) but a decrease in TG
accumulation compared to WAs (Fig.
1E +Rosi vs. -Rosi).
Expression levels of beige markers and
GLUT4, leptin and MCT4 were measured in WAs and BAs differentiated
from 3T3-L1 preadipocytes
The increased fluorescence intensity of UCP1 and
GLUT4 previously observed in BAs was confirmed by RT-qPCR (Fig. 2A). The expression of Ucp1,
Cidea (another classic beige/brown marker), and Glut4
was significantly higher in 3T3-L1 adipose cells after PPARγ
activation. Expression levels of UCP1, HSL, perilipin 1,
adiponectin, leptin, FABP4, caveolin 1, vimentin and the metabolic
markers MCT4 and LDH were evaluated in WAs and BAs (Fig. 2B). Perilipin 1, the main protein
coat for LDs in mature adipocytes, and HSL are two proteins
involved in the lipolytic process.
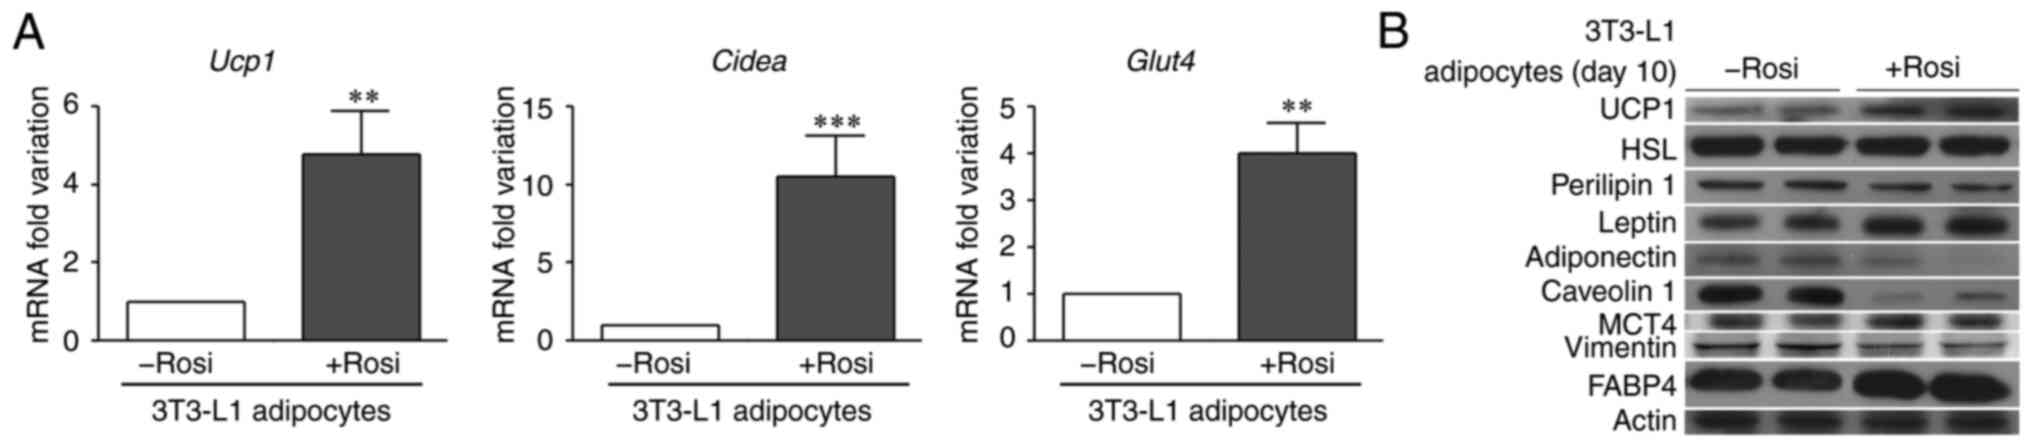 | Figure 2.Expression levels of different
brown/beige/white adipocyte markers. (A) 3T3-L1 preadipocytes were
differentiated into WAs or BAs (3T3-L1 adipocytes -Rosi or +Rosi,
respectively). On day 10, mRNA was extracted for the RT-qPCR
analysis of Ucp1, Cidea and Glut4, and (B) protein
was extracted for immunoblot analysis of the expression of UCP1,
HSL, perilipin 1, leptin, adiponectin, caveolin 1, MCT4, vimentin,
and FABP4. Actin was used as a loading control. (n=3–4 experiments
in triplicate). Mann-Whitney test was performed; **P<0.01 and
***P<0.001, compared with the -Rosi group. WAs, white
adipocytes; BAs, beige adipocytes; UCP1, uncoupled protein 1;
Cidea, cell death-inducing DFFA-like effector A; GLUT4,
glucose transporter 4; FABP4, fatty acid binding protein 4; MCT4,
monocarboxylate transporter 4; HSL, hormone-sensitive lipase. |
Perilipin 1 expression was slightly decreased in the
BAs compared to the WAs; HSL levels were not affected by
rosiglitazone treatment. Adiponectin and leptin are the main
adipokines released by adipocytes; worthy of note, there was a
higher leptin expression but significantly lower adiponectin
expression in BAs when compared to the WAs (Fig. 2B). Caveolin-1 is an important
protein, necessary for LD formation (28), and a marked decrease in caveolin 1
expression was observed in the BAs (Fig. 2B), in agreement with a decrease in
lipid accumulation (Fig. 1E). The
expression of FABP4, actively secreted and essential to modulate
lipid fluxes, trafficking, signaling and metabolism in adipocytes,
was increased in BAs, while a decrease in vimentin expression was
observed in BAs when compared to WAs (Fig. 2B). The expression of MCT4, a
mediator of lactate export, was increased in BAs relative to WAs
(Fig. 2B); expression levels of
LDH, enzyme catalyzing the conversion of pyruvate to lactate, were
similar to those of MCT4 (data not shown).
Expression of leptin, FABP4, UCP1,
adiponectin, caveolin 1 and vimentin and lactate efflux in WA-CM
and BA-CM
To characterize soluble factors present in WA-CM and
BA-CM, the expression levels of different proteins were determined
by WB. According to Fig. 3A and B,
the results showed significantly increased expression of leptin in
BA-CM compared to WA-CM, while adiponectin and caveolin 1
expression was significantly decreased. Vimentin was present in
both WA- and BA-CM, but the expression levels were not
significantly different. Increased expression of FABP4 and UCP1 was
found in BA-CM in comparison to WA-CM. Worthy of note, changes in
expression levels of leptin, adiponectin, caveolin 1, UCP1 and
FABP4 in CM (Fig. 3A and B) agree
with those observed in the cellular extracts (Fig. 2B). Expression levels of HSL
(Fig. 3A) and perilipin 1 (data not
shown) were insignificant in both CM.
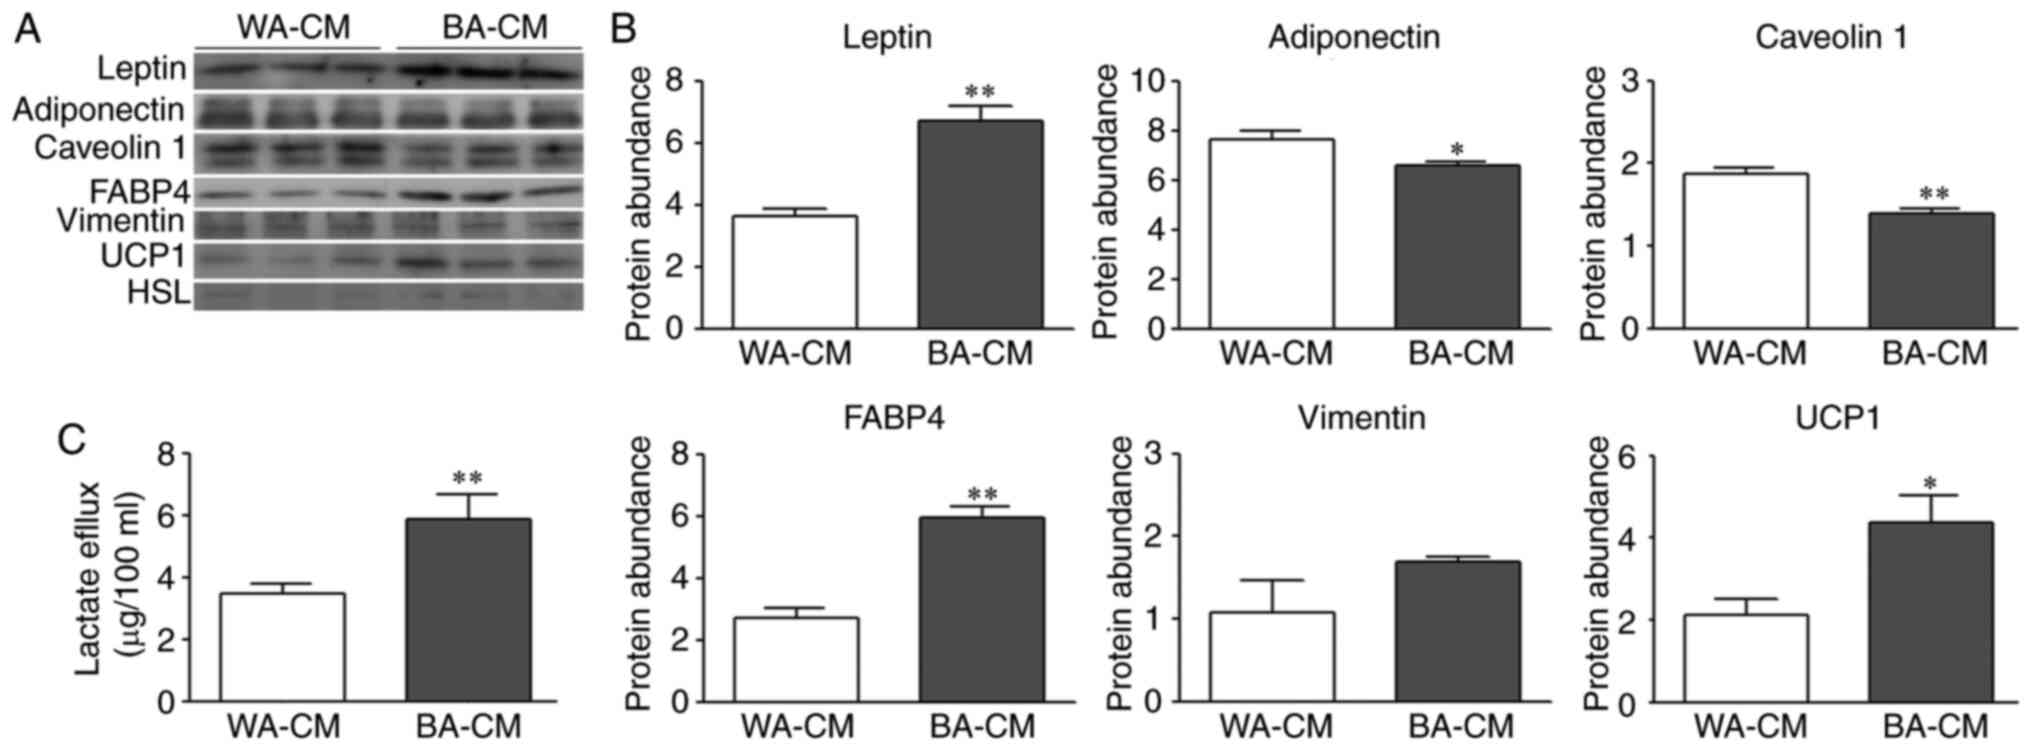 | Figure 3.Expression levels of a different set
of proteins in WA-CM and BA-CM. (A and B) Leptin, adiponectin,
caveolin 1, FABP4, vimentin, UCP1 and HSL expression was analyzed
by WB and images were analyzed by densitometry. (C) The levels of
lactate secreted by WAs or BAs were determined by colorimetric
assay (WA-CM and BA-CM collected after 24 h of incubation) (n=3
experiments in triplicate). Mann-Whitney test was performed;
*P<0.05 and **P<0.01, compared with WA-CM. WB, western
blotting; WA, white adipocyte; BA, beige adipocyte; CM, conditioned
media; UCP1, uncoupled protein 1; FABP4, fatty acid binding protein
4; HSL, hormone-sensitive lipase. |
We investigated whether the upregulation of MCT4 and
LDH upon differentiation into BAs translated into an increased
lactate flux. Lactate efflux from WAs and BAs, evaluated in WA- and
BA-CM using a colorimetric assay, showed that lactate transporter
capacity was increased in 3T3-L1 differentiated into a beige
phenotype (Fig. 3C).
Effect of BA-CM on cellular adhesion
of mammary epithelial cells
To compare the presence of soluble factors in WA-CM
and BA-CM, that could affect tumor cell adhesion, NMuMG, LM3, 4T1
and MC4-L1 epithelial cells were exposed to different CM (WA-, BA-
or Ctrol-CM) and cell adhesion was determined as described in
Materials and methods. WA-CM and BA-CM significantly decreased
adhesion of LM3, 4T1 and MC4-L1 cells with respect to Ctrol-CM
(Fig. 4). On the other hand, NMuMG
cell adhesion was decreased significantly after incubation with
BA-CM vs. both WA-CM and Ctrol-CM.
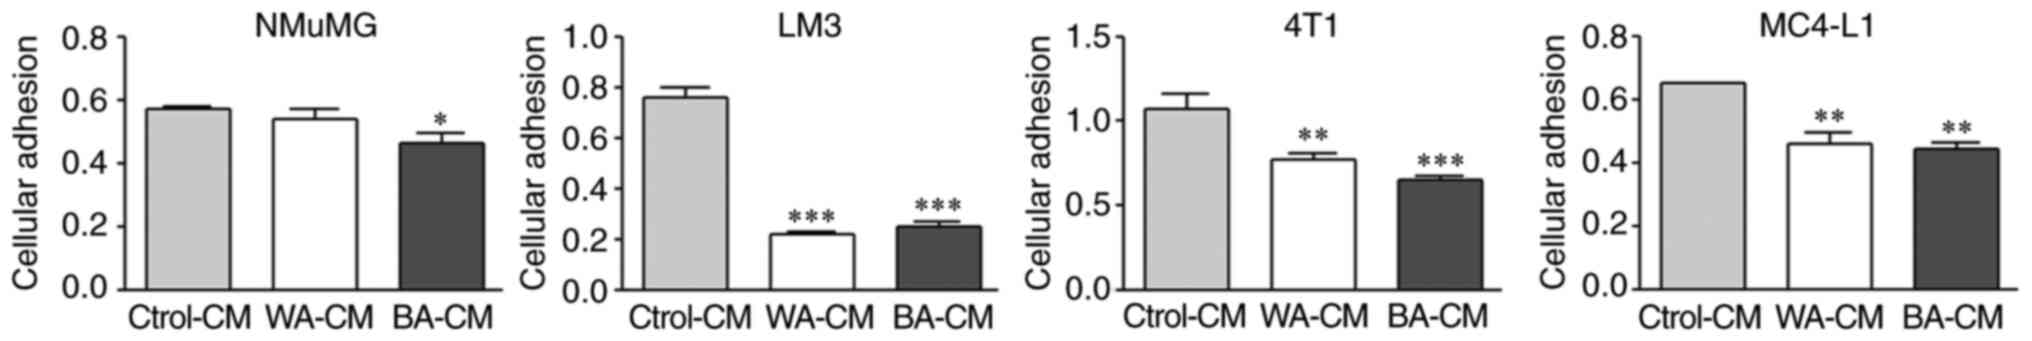 | Figure 4.Effect of CM from WAs and BAs on the
attachment of NMuMG, LM3, 4T1 and MC4-L1 cells. Non-tumor (NMuMG)
and tumor (LM3, 4T1 and MC4-L1) epithelial cells were treated with
WA-CM, BA-CM or Ctrol-CM for 24 h. After treatment, the cells were
plated at a density of 5×10⁴ cells/well in 96-well
plates and adherent cells were quantified by MTS after 1 h (n=2
experiments in triplicate). Tukey's multiple comparison test was
performed; *P<0.05, **P<0.01 and ***P<0.001, compared with
the Ctrol-CM group. WA, white adipocyte; BA, beige adipocyte; CM,
conditioned media. |
Effect of BA-CM on tumor and non-tumor
mammary epithelial cell migration
To evaluate the effect of WA-CM and BA-CM on the
migratory capacity of tumor and non-tumor mammary epithelial cells,
we performed wound healing assays. WA-CM and BA-CM significantly
increased migration of LM3 and 4T1 (tumor) cells after incubating
for 6 h, and of MC4-L1 (tumor) and NMuMG (non-tumor) after
incubating for 12 h vs. the Ctrol-CM (Fig. 5). These results suggest that BA-CM
increase the migration capacity of both tumor and non-tumor mammary
epithelial cells in agreement with results found in the cell
adhesion assays (Fig. 4).
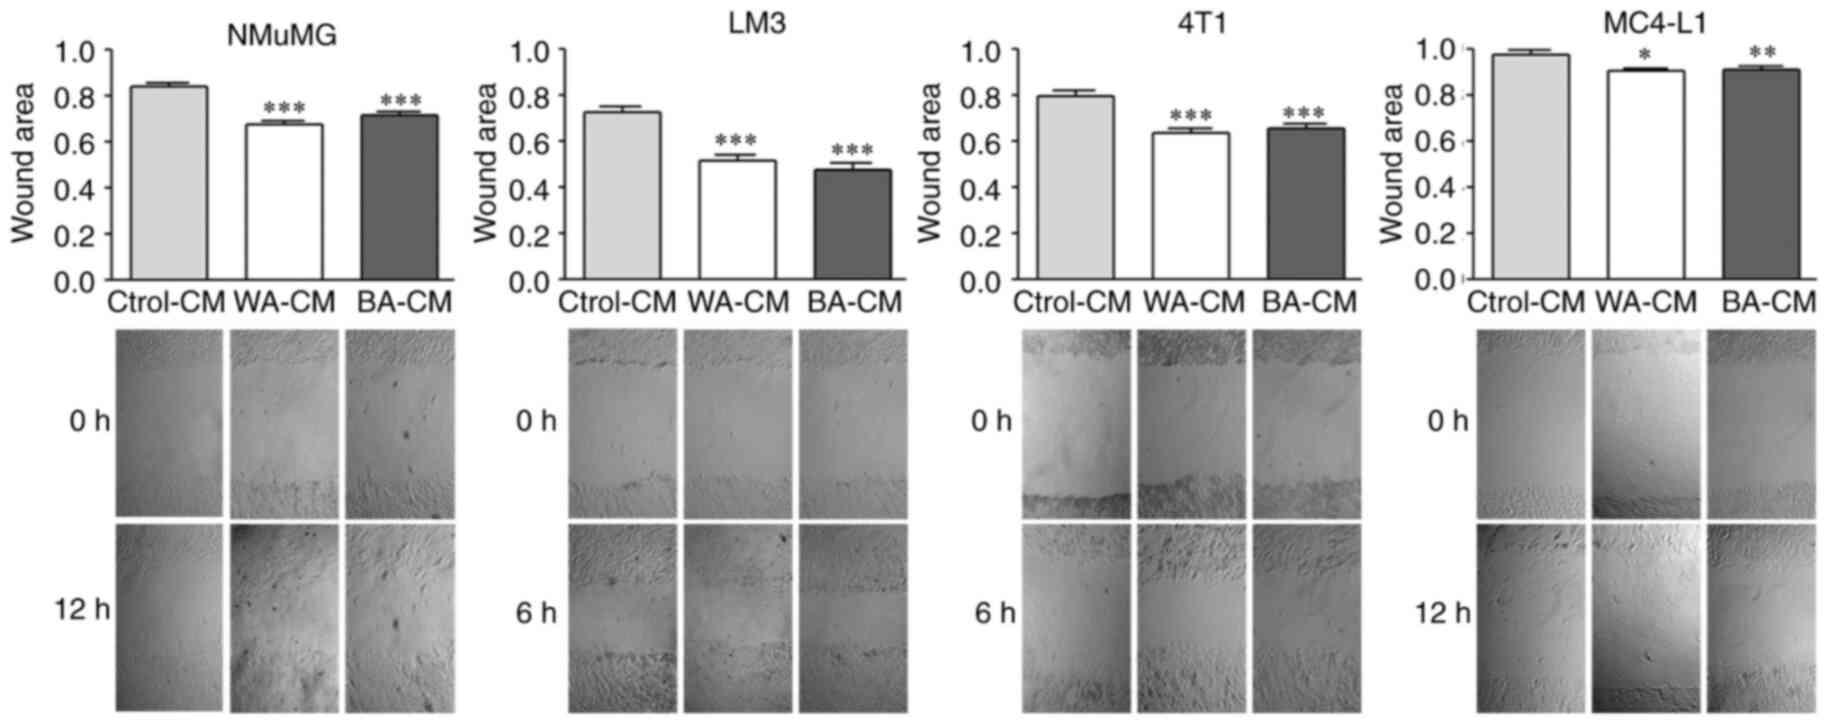 | Figure 5.Effect of CM from WAs and BAs on the
migration of NMuMG, LM3, 4T1 and MC4-L1 cells. Non-tumor (NMuMG)
and tumor (LM3, 4T1 and MC4-L1) epithelial cells were grown to
confluence on 96-well plates in the presence of complete D-MEM/F-12
medium. Wounds were formed, and WA-CM, BA-CM or Ctrol-CM were
added. Images of the wound closure were acquired immediately after
the wound was made (0 h), and after 6 and 12 h. Representative
zoomed areas from light microscopy images (magnification, ×40) are
shown. Graph shows the ratio of 12/0 h (NMuMG and MC4-L1) or 6/0 h
(LM3 and 4T1) wounded areas (n=3 experiments in duplicate). Tukey's
multiple comparison test was performed; *P<0.05, **P<0.01 and
***P<0.001, compared with the Ctrol-CM group. WA, white
adipocyte; BA, beige adipocyte; CM, conditioned media. |
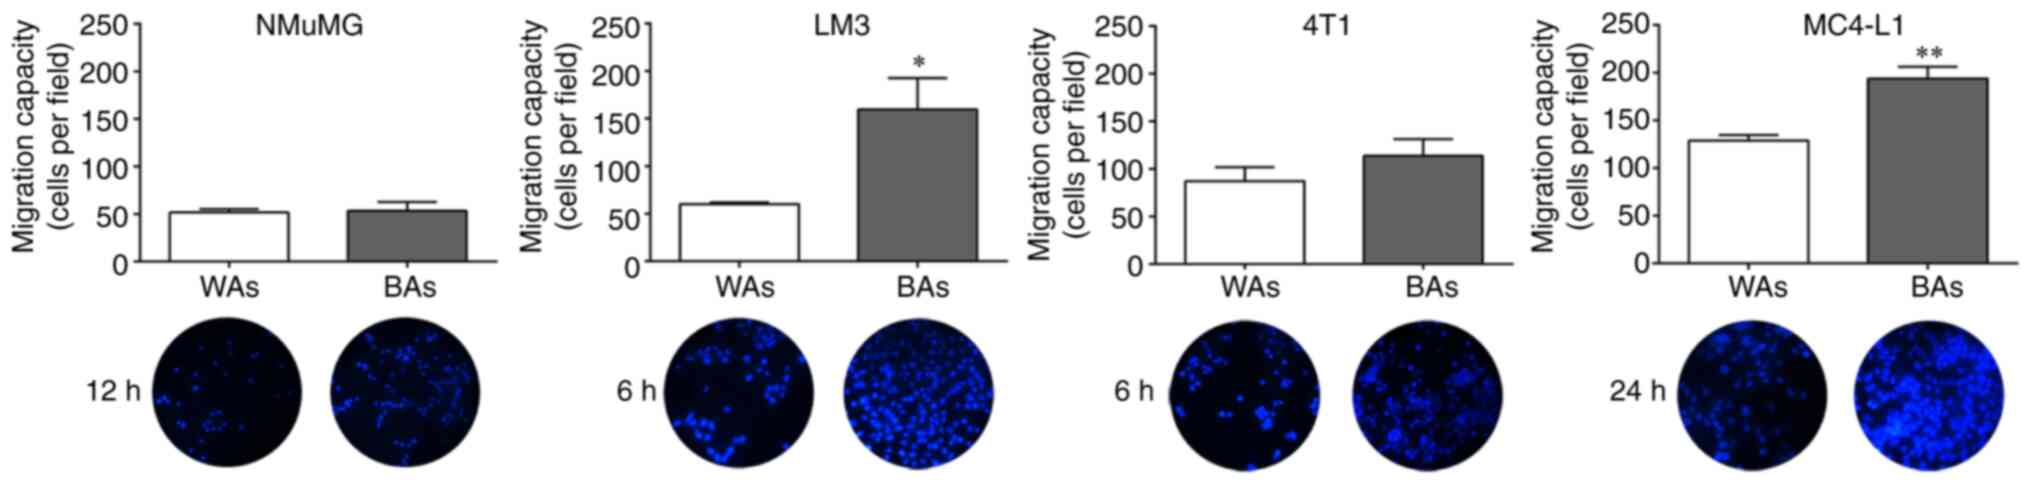
Transwell migration of tumor cells in
the presence of BAs
To compare the chemotactic capacity of BAs and WAs
on tumor and non-tumor epithelial cell migration, Transwell
migration assays were performed as described in Materials and
methods. BAs significantly increased cell migration of LM3 and
MC4-L1 cells vs. the WAs, following incubation for 6 and 24 h,
respectively (Fig. 6). BAs also
increased 4T1 cell migration after incubation for 6 h though to a
lesser extent, but there was no significant chemotactic effect of
BAs or WAs on NMuMG migration at any time tested.
Taken together, these results suggest that crosstalk
takes place between tumor cells and BAs and that this cell-cell
communication may be necessary to modulate adipocyte action on
epithelial cell migration, beyond the effect of soluble
factors.
Effect of soluble factors from WAs and
BAs on ObR, CD44, vimentin, MMP-9, MCT1 and LDH expression level in
NMuMG, 4T1, LM3 and MC4-L1 cell lines
The effect of soluble factors released by WAs and
BAs on the expression level of several tumor progression markers,
was evaluated by WB in tumor and non-tumor epithelial cells
incubated with WA-CM, BA-CM or Ctrol-CM for 24 h. ObR and MMP-9
expression in MC4-L1 cells was significantly higher when incubated
with BA-CM compared to WA-CM or Ctrol-CM (Fig. 7, MC4-L1). CD44 expression showed an
increasing trend in MC4-L1 cells incubated with BA-CM (Fig. 7, MC4-L1), but differences were not
significant. By contrast, MMP-9 expression was significantly lower
when NMuMG (non-tumor) cells were treated with BA-CM and WA-CM vs.
Ctrol-CM and, interestingly, CD44 and ObR expression levels were
significantly decreased in LM3 and 4T1, respectively, after
treatment with WA-CM. Vimentin expression level was not affected by
different CM treatments and, surprisingly, neither were MCT1 and
LDH expression levels (Fig. 7).
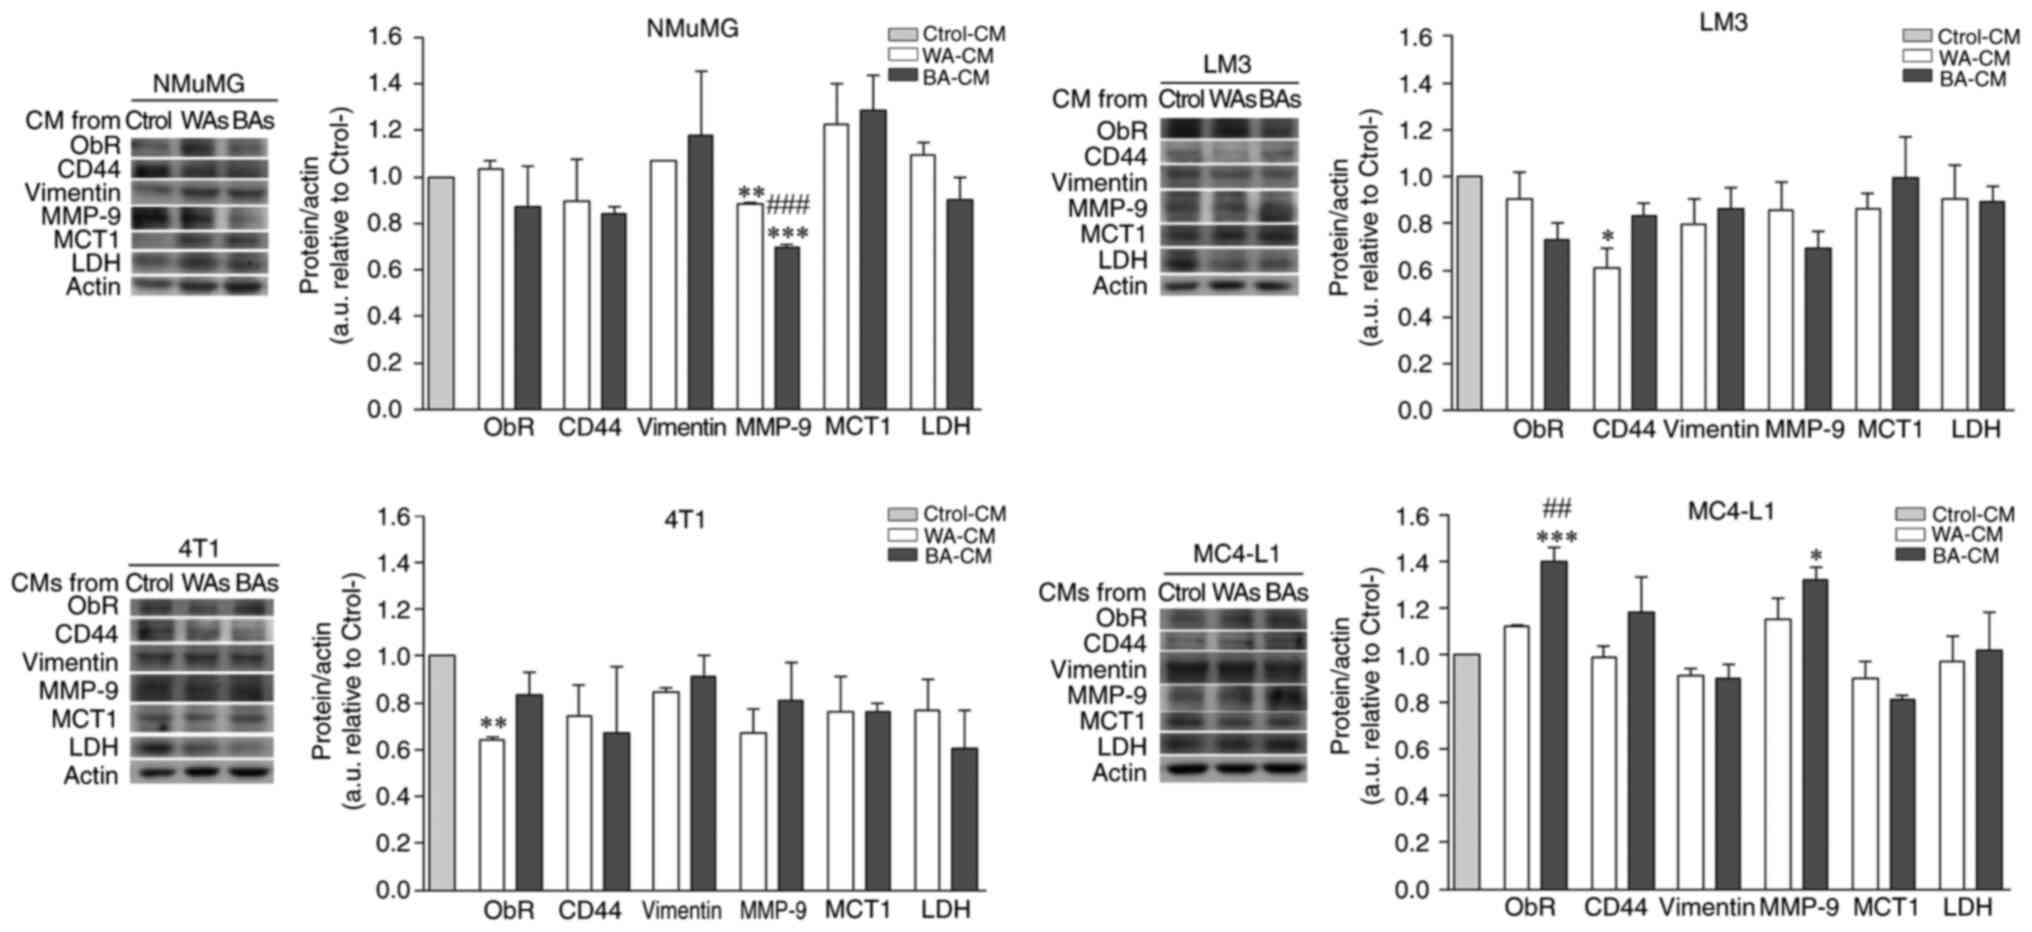 | Figure 7.Effect of CM from WAs and BAs on the
expression levels of several tumor progression and metabolic
markers was evaluated in mammary epithelial cells. Non-tumor and
tumor cells were grown on 6-well plates, incubated for 24 h with
the different CM and, then, lysed. The expression of ObR, CD44,
vimentin, MMP-9, MCT1 and LDH was analyzed by WB. Actin was used as
a loading control. Images were analyzed by densitometry (n=2
experiments in triplicate). Tukey's multiple comparison test was
performed; *P<0.05, **P<0.01 and ***P<0.001, cells
incubated with WA-CM or BA-CM vs. Ctrol-CM; ##P<0.01
and ###P<0.001, cells incubated with BA-CM vs. WA-CM.
WA, white adipocyte; BA, beige adipocyte; CM, conditioned media;
MCT1, monocarboxylate transporter 1; ObR, leptin receptor; MMP-9,
matrix metalloprotease 9; LDH, lactate dehydrogenase. |
Discussion
Bidirectional communication between epithelial cells
and cells from the stromal compartment is essential for tumor
development and maintenance of a cancerous phenotype, whether
invasive or not (2,29). This crosstalk can either trigger
cancerous behavior and support it or, eventually, lead to
involution to a non-tumor form. Invading cancer cells can
dramatically impact the surrounding adipose cells that exhibit an
altered phenotype and specific biological features (e.g. lipid loss
and overexpression of inflammatory cytokines) suggesting that
adipose cells in the tumor environment present a less
differentiated state than adipocytes in a normal microenvironment
(3,30–32).
Multiple lines of evidence obtained in vitro and in
vivo have demonstrated that an increased expression of
beige/brown adipose tissue key markers occurs during breast tumor
development (16,18,21)
and this, is in turn, promotes tumor progression (19,33).
In the present study, we evaluated the possible role of beige
adipocytes (BAs) in the control of mammary epithelial cell
pathophysiology.
We characterized the cell phenotype of mouse BAs
obtained in vitro after treatment of 3T3-L1 preadipocytes
with rosiglitazone, a known peroxisome proliferator-activated
receptor γ (PPARγ) activator which has been described as acting
in vivo in mouse white fat depots (34). Our results showed that upon PPARγ
activation, 3T3-L1 adipocytes displayed multilocular micro-lipid
droplet (LD) morphology and expressed brown fat-specific genes such
as Ucp1 and Cidea. The shift in adipocyte phenotype
(white to beige) involves marked changes in the metabolic state of
mitochondria (35). Accordingly,
our results showed UCP1-positive mitochondria preferentially
displaying a round shape (mitochondrial fission), whereas
UCP1-negative mitochondria appeared tubular and elongated, in
agreement with previous findings in mice and human brown/beige
adipocytes (36–38). Thus, mitochondrial fission in 3T3-L1
BAs may be considered a physiological adaptation rather than a
purely deleterious mechanism (36).
The pathways mainly regulated by rosiglitazone in
3T3-L1 adipocytes are fatty acid oxidation, the TCA cycle and
oxidative phosphorylation. Rosiglitazone induces adipocytes to
utilize fatty acids for energy production, increasing lipolysis and
reducing lipogenesis, and spare glucose and amino acids by
enhancing glycogen synthesis and inhibiting amino acid catabolic
pathways. This is in line with the upregulation of UCP1 and
downregulation of perilipin 1 observed in this study, which thus
act as gatekeepers of lipolysis regulation. Increased levels of
UCP1 correlate with a shift in substrate utilization, favoring
lipids as the dominant metabolic fuel (10,39).
Metabolic reprogramming is an emerging hallmark of
cancer (40,41). There is evidence that suggests that
the expression of monocarboxylate transporters (MCTs), mediators of
lactate flux, is modified when metabolic demands of the tissue are
being altered (42), and that MCT
upregulation is important for the normal physiological function of
mature adipose cells (43). Our
results showed that both MCT4 expression and lactate flux capacity
were increased in BAs. MCT1 and MCT4 have now been confirmed as
prominent facilitators of lactate exchange between cancer and
stromal cells (44,45). In fact, it is likely that an
elevated expression of MCT4 in stromal adipose tissue concomitantly
with MCT1 overexpression in malignant tissue, may be an important
clinical biomarker for poor prognosis in breast cancer patients
(19,45).
Cancer cells take up free fatty acids and glycerol,
besides glucose, as a source of energy from adjacent adipocytes.
Thus, BAs could pose as an important energy storage providing tumor
cells with high energy metabolites such as lactate, a situation
known as the reverse Warburg effect (46,47).
Our results showed no significant differences in the expression
levels of MCT1, a key transporter for the uptake of lactate into
cells, when tumor or non-tumor epithelial cells were incubated with
beige adipocyte-conditioned media (BA-CM). However, the possibility
that lack of response in our study was due to the experimental
setup cannot be ruled out. Additional studies examining the effect
of white adipocyte (WA)-CM and BA-CM and adipocyte-epithelial cell
co-culture on intracellular signaling pathways of non-tumor and
tumor epithelial cells are currently in progress.
Adipokines, secreted in large amounts by adipose
tissue, can act in an autocrine, paracrine, and/or endocrine manner
to control various cellular processes, including those involved in
the aggressive biological behavior of breast cancers (48). Adiponectin and leptin are the two
main adipokines secreted by adipocytes. Plasma leptin levels are
increased in breast cancer patients, correlating with higher grade,
advanced tumor stage and aggressive subtypes (49) and leptin expression is increased in
breast cancer peritumoral stroma (50). Leptin, by binding to the leptin
receptor (ObR), promotes proliferation and development of breast
cancer cells (49). Serum
adiponectin levels seem to be significantly decreased in breast
cancer patients, while antiproliferative effects of adiponectin,
cell cycle inhibition and apoptosis activation have been verified
(49). We previously reported a
decrease in adiponectin expression in peritumoral adipose tissue
compared to adipose tissue distant from the tumor (3). The present results revealed that
leptin synthesis and secretion were increased in BAs, while
adiponectin was decreased, further supporting the contention that
the presence of BAs within breast cancer peritumoral adipose tissue
could contribute to adipokine imbalance observed in the tumor
microenvironment.
Fatty acid binding protein 4 (FABP4), a fatty acid
transport protein, is another important adipokine that can regulate
systemic metabolism (51,52) and could be involved in cancer cell
growth and metastasis (29,52). Guaita-Esteruelas et al
proposed that exogenous FABP4, which is responsive to signals that
induce lipolysis, facilitates the uptake of fatty acids into breast
cancer cells, playing a key role in tumor progression (53,54).
On the other hand, Witkiewicz et al showed that a reduction
or loss of stromal caveolin 1 expression is usually associated with
increased risk of early tumor recurrence, metastasis and decreased
overall survival (55). Our results
showed increased FABP4 expression and decreased caveolin 1 in BAs
which, taken together with an increased mobility of fatty acids
induced by UCP1 activation (56),
suggest that BA tissue could promote tumor cell progression. Worthy
of note, upregulation of UCP1 is considered a hallmark of metabolic
stress associated with poor survival in breast cancer (19,57,58).
The ability of WA-CM to modify breast tumor
progression has been reported in several studies (19,24).
Interestingly, in this study, incubation of LM3, 4T1 and MC4-L1
(tumor) cells with both BA-CM or WA-CM produced a significant
decrease in cell adhesion and increase in cell migration vs.
Ctrol-CM. However, when chemotactic capacity of BAs and WAs on
tumor and non-tumor epithelial cell migration was evaluated, BAs
significantly increased cell migration in LM3 and MC4-L1 cell lines
vs. WAs, suggesting that the presence of BAs modified the
microenvironment promoting migration of epithelial cells. Adipose
cells are known to affect tumor properties through various
signaling processes, a crosstalk that can only happen when both
cell types are in close contact during tumor progression and
metastasis formation (2,59). Supporting our results, Wu et
al proposed that the preliminary step in this close interaction
could be the capacity of tumor cells to induce this beige/brown
differentiation and lipolysis in adipose cells (19). The effect of BA-CM on cell adhesion
of NMuMG (non-tumor) cells was significantly higher than WA-CM,
suggesting that soluble factors of WA-CM and BA-CM had a
differential effect on non-tumor epithelial cells.
Despite the fact that there were no significant
differences between BA-CM and WA-CM effects on cell adhesion and
migration in tumor cells, MC4-L1 cells showed higher ObR and MMP-9
expression levels after incubation with BA-CM compared to WA-CM or
Ctrol-CM. The invasion of tumor cells into healthy tissues is
promoted by a necessary local proteolysis of the extracellular
matrix (ECM), which involves the activity of metalloproteases
(MMPs) (60). MMP-2 and MMP-9 play
a fundamental role in proteolytic matrix degradation during
invasion and metastasis, and an increase in MMP-2 and MMP-9 in
human breast tumors has been associated with poor patient prognosis
(60). Increased expression of
MMP-9 in MC4-L1 cells could thus favor degradation of the basement
membrane, an essential early step in tumor invasion. In agreement
with this result, BA-CM also increased the expression of CD44 in
the MC4-L1 cell line, a membrane glycoprotein involved in tumor
cell migration and invasion processes (61,62).
We have recently shown that incubation of MCF7 and IBH-7 cells with
CM from human breast cancer adipose tissue explants, stimulates the
expression of CD44 (3). Taken
together, our results indicate that one or more soluble factors
present in CM from BAs could increase the subpopulation of MC4-L1
cells with high levels of CD44 and MMP-9, promoting cellular
migration and consequently inducing cancer cell invasion. This
evidence is clinically significant given that MC4-L1 cells are a
luminal breast cancer model and luminal type accounts for more than
30–45% of breast cancers. Further studies are necessary to
determine whether there is crosstalk signaling between BAs and
molecular subtypes of breast cancer cells. Knockdown of CD44 and
ObR genes in LM3 and MC4-L1 epithelial cells would lead us to
achieve a more detailed comprehension of BA function in breast
cancer progression. We are trying to solve this experimental
limitation in a current study, trying to understand whether BAs are
key actors in breast cancer development and maintenance of a
cancerous phenotype.
Taken together, the results obtained in this study
encourage us to speculate that breast cancer cells could increase
BA recruitment or induce beige/brown differentiation in surrounding
white fat, as a strategy to reduce energy storage in adipocytes
which would then be acting as a metabolic fuel source.
Additionally, given the ability of brown adipocytes to secrete
soluble factors, which can promote angiogenesis (63) and rearrangement of the extracellular
environment (64), BAs in the
invasive front of breast tumors could enhance tumor growth
indirectly by stimulating angiogenesis/remodeling of ECM as a
consequence of promoting tumor cell invasion.
The main challenge for future studies will be to
identify the pathway through which BAs regulate breast cancer
development. Since tumor cells co-cultured with BAs exhibit an
aggressive phenotype, we propose to evaluate the effect of BA-CM
and BA-epithelial cells, in direct co-culture, on both
morphological and metabolic changes, and activation of cancer stem
cell signaling.
In conclusion, this study demonstrates that there
are profound changes in protein expression and mitochondrial
modifications during differentiation of 3T3-L1 preadipocytes into
BAs, and that mitochondrial fission, which has been described in
human brown adipose cells, also occurs in a mouse model (11). We propose that PPARγ activation of
3T3-L1 adipocytes could be an interesting model to study
bidirectional communication between epithelial cells and BAs and
how the latter participate in the development and progression of
breast cancer.
Understanding the key signaling pathways in
beige/brown adipose cells that might contribute to breast tumor
progression will most certainly contribute to the development of
novel therapeutic strategies to control breast tumor growth.
Acknowledgements
We acknowledge the technical assistance and support
of Pablo Pomata for confocal microscopy observation. We thank Dr
Lucrecia Piñeiro for her invaluable help in the correction of this
manuscript.
Funding
We are gratefully thankful to Fundación Williams
(Argentina) and Fundación Rene Barón (Argentina) for their support
to IBYME (CONICET). This work was supported by CONICET grant BID
PICT 2012–2489 and by a generous donation from Fundación Honorio
Bigand, Buenos Aires, Argentina. PP, CL and GR are doctoral
fellows, CONICET, Argentina.
Availability of data and materials
The datasets used during the present study are
available from the corresponding author upon reasonable
request.
Authors' contributions
MG designed and performed the experiments, analyzed
the data and helped design the figures and write the manuscript. PP
performed cell adhesion assays and Oil Red O staining and
contributed to the data analyses. CL performed the western blot
analysis and data analysis. GMR and MFR performed the RT-qPCR
experiments and lactate measurement and data analysis. JCC
contributed to the experimental design, helped edit and rewrite the
manuscript and secured funding. JT conceived the hypothesis,
designed, performed the experiments, and wrote the manuscript. All
authors have read and approved the final version of the manuscript
and agreed to be accountable for all aspects of the research,
ensuring that the accuracy and integrity of any part of the work
were suitably investigated and resolved.
Ethics approval and consent to
participate
Not applicable.
Patient consent for publication
Not applicable.
Competing interests
The authors declare that they have no competing
interests.
Glossary
Abbreviations
Abbreviations:
|
ATP
|
adenosine triphosphate
|
|
BA
|
beige adipocyte
|
|
BAT
|
brown adipose tissue
|
|
BSA
|
bovine serum albumin
|
|
CAAs
|
cancer-associated adipocytes
|
|
CM
|
conditioned media
|
|
CIDEA
|
cell death-inducing DFFA-like effector
A
|
|
Ctrol
|
control
|
|
DEPSGs
|
differentially expressed predicted
secreted genes
|
|
D-MEM/F-12
|
Dulbecco's modified Eagle's
medium/Nutrient Mixture F12
|
|
ECM
|
extracellular matrix
|
|
EMT
|
epithelial mesenchymal transition
|
|
ER
|
estrogen receptor
|
|
FABP4
|
fatty acid binding protein 4
|
|
FBS
|
fetal bovine serum
|
|
GLUT4
|
glucose transporter 4
|
|
HER2
|
human epidermal growth factor receptor
2
|
|
HSL
|
hormone-sensitive lipase
|
|
HRP
|
horseradish peroxidase
|
|
IBMX
|
3-isobutyl-1-methylxanthine
|
|
IIF
|
indirect immunofluorescence
|
|
LD
|
lipid droplet
|
|
LDH
|
lactate dehydrogenase
|
|
MCTs
|
monocarboxylate transporters
|
|
MMPs
|
matrix metalloproteases
|
|
N
|
nuclei
|
|
ObR
|
leptin receptor
|
|
ON
|
overnight
|
|
PBS
|
phosphate-buffered saline
|
|
PET/CT
|
positron emission
tomography/computerized tomography
|
|
Pgc1α
|
peroxisome proliferator activated
receptor-γ coactivator 1-α
|
|
PPARγ
|
peroxisome proliferator-activated
receptor gamma
|
|
PR
|
progesterone receptor
|
|
PVDF
|
polyvinylidene fluoride
|
|
RT
|
room temperature
|
|
TCA
|
tricarboxylic acid
|
|
TGs
|
triglycerides
|
|
TZDs
|
thiazolidinediones
|
|
UCP1
|
uncoupled protein 1
|
|
WA
|
white adipocyte
|
|
WAT
|
white adipose tissue
|
References
|
1
|
Peinado H, Zhang H, Matei IR, Costa-Silva
B, Hoshino A, Rodrigues G, Psaila B, Kaplan RN, Bromberg JF, Kang
Y, et al: Pre-metastatic niches: Organ-specific homes for
metastases. Nat Rev Cancer. 17:302–317. 2017. View Article : Google Scholar
|
|
2
|
Dirat B, Bochet L, Dabek M, Daviaud D,
Dauvillier S, Majed B, Wang YY, Meulle A, Salles B, Le Gonidec S,
et al: Cancer-associated adipocytes exhibit an activated phenotype
and contribute to breast cancer invasion. Cancer Res. 71:2455–2465.
2011. View Article : Google Scholar
|
|
3
|
Fletcher SJ, Sacca PA, Pistone-Creydt M,
Coló FA, Serra MF, Santino FE, Sasso CV, Lopez-Fontana CM, Carón
RW, Calvo JC and Pistone-Creydt V: Human breast adipose tissue:
Characterization of factors that change during tumor progression in
human breast cancer. J Exp Clin Cancer Res. 36:1–13. 2017.
View Article : Google Scholar
|
|
4
|
Pistone Creydt V, Fletcher SJ, Giudice J,
Bruzzone A, Chasseing NA, Gonzalez EG, Sacca PA and Calvo JC: Human
adipose tissue from normal and tumoral breast regulates the
behavior of mammary epithelial cells. Clin Transl Oncol.
15:124–131. 2013. View Article : Google Scholar
|
|
5
|
Wu Q, Li B, Li Z, Li J and Sun S and Sun
S: Cancer-associated adipocytes: Key players in breast cancer
progression. J Hematol Oncol. 12:952019. View Article : Google Scholar
|
|
6
|
Pope BD, Warren CR, Parker KK and Cowan
CA: Microenvironmental control of adipocyte fate and function.
Trends Cell Biol. 26:745–755. 2016. View Article : Google Scholar
|
|
7
|
Park A: Distinction of white, beige and
brown adipocytes derived from mesenchymal stem cells. World J Stem
Cells. 6:33–42. 2014. View Article : Google Scholar
|
|
8
|
Wang YY, Attané C, Milhas D, Dirat B,
Dauvillier S, Guerard A, Gilhodes J, Lazar I, Alet N, Laurent V, et
al: Mammary adipocytes stimulate breast cancer invasion through
metabolic remodeling of tumor cells. JCI Insight. 2:e874892017.
View Article : Google Scholar
|
|
9
|
Bussard KM, Mutkus L, Stumpf K,
Gomez-Manzano C and Marini FC: Tumor-associated stromal cells as
key contributors to the tumor microenvironment. Breast Cancer Res.
18:842016. View Article : Google Scholar
|
|
10
|
Cannon B and Nedergaard J: Brown adipose
tissue: Function and physiological significance. Physiol Rev.
84:277–359. 2004. View Article : Google Scholar
|
|
11
|
Sepa-Kishi DM and Ceddia RB: White and
beige adipocytes: Are they metabolically distinct? Horm Mol Biol
Clin Investig. 332018.doi: 10.1515/hmbci-2018-0003.
|
|
12
|
Harms M and Seale P: Brown and beige fat:
Development, function and therapeutic potential. Nat Med.
19:1252–1263. 2013. View Article : Google Scholar
|
|
13
|
Vitali A, Murano I, Zingaretti MC,
Frontini A, Ricquier D and Cinti S: The adipose organ of
obesity-prone C57BL/6J mice is composed of mixed white and brown
adipocytes. J Lipid Res. 53:619–629. 2012. View Article : Google Scholar
|
|
14
|
Master SR, Hartman JL, D'Cruz CM, Moody
SE, Keiper EA, Ha SI, Cox JD, Belka GK and Chodosh LA: Functional
microarray analysis of mammary organogenesis reveals a
developmental role in adaptive thermogenesis. Mol Endocrinol.
16:1185–1203. 2002. View Article : Google Scholar
|
|
15
|
Gouon-Evans V and Pollard JW: Unexpected
deposition of brown fat in mammary gland during postnatal
development. Mol Endocrinol. 16:2618–2627. 2002. View Article : Google Scholar
|
|
16
|
Cao Q, Hersl J, La H, Smith M, Jenkins J,
Goloubeva O, Dilsizian V, Tkaczuk K, Chen W and Jones L: A pilot
study of FDG PET/CT detects a link between brown adipose tissue and
breast cancer. BMC Cancer. 14:1262014. View Article : Google Scholar
|
|
17
|
Jones LP, Buelto D, Tago E and
Owusu-Boaitey KE: Abnormal mammary adipose tissue environment of
Brca1 mutant mice show a persistent deposition of highly
vascularized multilocular adipocytes. J Cancer Sci Ther. 8 (Suppl
2):S42011.
|
|
18
|
Singh R, Parveen M, Basgen JM, Fazel S,
Meshesha MF, Thames EC, Moore B, Martinez L, Howard CB, Vergnes L,
et al: Increased expression of beige/brown adipose markers from
host and breast cancer cells influence xenograft formation in mice.
Mol Cancer Res. 14:78–92. 2016. View Article : Google Scholar
|
|
19
|
Wu Q, Li J, Li Z, Sun S, Zhu S, Wang L, Wu
J, Yuan J, Zhang Y, Sun S and Wang C: Exosomes from the
tumour-adipocyte interplay stimulate beige/brown differentiation
and reprogram metabolism in stromal adipocytes to promote tumour
progression. J Exp Clin Cancer Res. 38:2232019. View Article : Google Scholar
|
|
20
|
Orava J, Nuutila P, Lidell ME, Oikonen V,
Noponen T, Viljanen T, Scheinin M, Taittonen M, Niemi T, Enerbäck S
and Virtanen KA: Different metabolic responses of human brown
adipose tissue to activation by cold and insulin. Cell Metab.
14:272–279. 2011. View Article : Google Scholar
|
|
21
|
Wang F, Gao S, Chen F, Fu Z, Yin H, Lu X,
Yu J and Lu C: Mammary fat of breast cancer: Gene expression
profiling and functional characterization. PLoS One. 9:e1097422014.
View Article : Google Scholar
|
|
22
|
Urtreger A, Ladeda V, Puricelli L, Rivelli
A, Vidal M, Delustig E and Joffe E: Modulation of fibronectin
expression and proteolytic activity associated with the invasive
and metastatic phenotype in two new murine mammary tumor cell
lines. Int J Oncol. 11:489–496. 1997.
|
|
23
|
Lanari C, Lüthy I, Lamb CA, Fabris V,
Pagano E, Helguero LA, Sanjuan N, Merani S and Molinolo AA: Five
novel hormone-responsive cell lines derived from murine mammary
ductal carcinomas: In vivo and in vitro effects of estrogens and
progestins 1. Cancer Res. 61:293–302. 2001.
|
|
24
|
Creydt VP, Sacca PA, Tesone AJ, Vidal L
and Calvo JC: Adipocyte differentiation influences the
proliferation and migration of normal and tumoral breast epithelial
cells. Mol Med Rep. 3:433–439. 2010.
|
|
25
|
Schmittgen TD and Livak KJ: Analyzing
real-time PCR data by the comparative C(T) method. Nat Protoc.
3:1101–1108. 2008. View Article : Google Scholar
|
|
26
|
Kraus NA, Ehebauer F, Zapp B, Rudolphi B,
Kraus BJ and Kraus D: Quantitative assessment of adipocyte
differentiation in cell culture. Adipocyte. 5:351–358. 2016.
View Article : Google Scholar
|
|
27
|
Wu J, Boström P, Sparks LM, Ye L, Choi JH,
Giang AH, Khandekar M, Virtanen KA, Nuutila P, Schaart G, et al:
Beige Adipocytes are a distinct type of thermogenic fat cell in
mouse and human. Cell. 150:366–376. 2012. View Article : Google Scholar
|
|
28
|
Cohen AW, Razani B, Schubert W, Williams
TM, Wang XB, Iyengar P, Brasaemle DL, Scherer PE and Lisanti MP:
Role of caveolin-1 in the modulation of lipolysis and lipid droplet
formation. Diabetes. 53:1261–1270. 2004. View Article : Google Scholar
|
|
29
|
Nieman KM, Kenny HA, Penicka CV, Ladanyi
A, Buell-Gutbrod R, Zillhardt MR, Romero IL, Carey MS, Mills GB,
Hotamisligil GS, et al: Adipocytes promote ovarian cancer
metastasis and provide energy for rapid tumor growth. Nat Med.
17:1498–1503. 2011. View Article : Google Scholar
|
|
30
|
Bochet L, Lehuédé C, Dauvillier S, Wang
YY, Dirat B, Laurent V, Dray C, Guiet R, Maridonneau-Parini I, Le
Gonidec S, et al: Adipocyte-derived fibroblasts promote tumor
progression and contribute to the desmoplastic reaction in breast
cancer. Cancer Res. 73:5657–5668. 2013. View Article : Google Scholar
|
|
31
|
Lee J, Hong BS, Ryu HS, Lee HB, Lee M,
Park IA, Kim J, Han W, Noh DY and Moon HG: Transition into
inflammatory cancer associated adipocytes in breast cancer
microenvironment requires microRNA regulatory mechanism. PLoS One.
12:e01741262017. View Article : Google Scholar
|
|
32
|
Muller C: Tumour-surrounding adipocytes
are active players in breast cancer progression. Ann Endocrinol
(Paris). 74:108–110. 2013. View Article : Google Scholar
|
|
33
|
Cai J, Li B, Wang J, Liu K, Zhang Y, Liao
Y and Lu F: Tamoxifen-prefabricated beige adipose tissue improves
fat graft survival in mice. Plast Reconstr Surg. 141:930–940. 2018.
View Article : Google Scholar
|
|
34
|
Petrovic N, Walden TB, Shabalina IG,
Timmons JA, Cannon B and Nedergaard J: Chronic peroxisome
proliferator-activated receptor gamma (PPARgamma) activation of
epididymally derived white adipocyte cultures reveals a population
of thermogenically competent, UCP1-containing adipocytes
molecularly distinct from classic brown adipocytes. J Biol Chem.
285:7153–7164. 2010. View Article : Google Scholar
|
|
35
|
Cedikova M, Kripnerová M, Dvorakova J,
Pitule P, Grundmanova M, Babuska V, Mullerova D and Kuncova J:
Mitochondria in white, brown, and beige adipocytes. Stem Cells Int.
2016:60673492016. View Article : Google Scholar
|
|
36
|
Pisani DF, Barquissau V, Chambard JC,
Beuzelin D, Ghandour RA, Giroud M, Mairal A, Pagnotta S, Cinti S,
Langin D and Amri EZ: Mitochondrial fission is associated with UCP1
activity in human brite/beige adipocytes. Mol Metab. 7:35–44. 2018.
View Article : Google Scholar
|
|
37
|
Wikstrom JD, Mahdaviani K, Liesa M, Sereda
SB, Si Y, Las G, Twig G, Petrovic N, Zingaretti C, Graham A, et al:
Hormone-induced mitochondrial fission is utilized by brown
adipocytes as an amplification pathway for energy expenditure. EMBO
J. 33:418–436. 2014.
|
|
38
|
Wilson-Fritch L, Burkart A, Bell G,
Mendelson K, Leszyk J, Nicoloro S, Czech M and Corvera S:
Mitochondrial biogenesis and remodeling during adipogenesis and in
response to the insulin sensitizer rosiglitazone. Mol Cell Biol.
23:1085–1094. 2003. View Article : Google Scholar
|
|
39
|
Castro É, Silva TEO and Festuccia T:
Critical review of beige adipocyte thermogenic activation and
contribution to whole-body energy expenditure. Horm Mol Biol Clin
Investig. 31:2017.doi: 10.1515/hmbci-2017-0042.
|
|
40
|
Ward PS and Thompson CB: Metabolic
reprogramming: A cancer hallmark even warburg did not anticipate.
Cancer Cell. 21:297–308. 2012. View Article : Google Scholar
|
|
41
|
Beloribi-Djefaflia S, Vasseur S and
Guillaumond F: Lipid metabolic reprogramming in cancer cells.
Oncogenesis. 5:e1892016. View Article : Google Scholar
|
|
42
|
Wang Y, Tonouchi M, Miskovic D, Hatta H
and Bonen A: T3 increases lactate transport and the expression of
MCT4, but not MCT1, in rat skeletal muscle. Am J Physiol Endocrinol
Metab. 285:E622–E628. 2003. View Article : Google Scholar
|
|
43
|
Petersen C, Nielsen MD, Andersen ES, Basse
AL, Isidor MS, Markussen LK, Viuff BM, Lambert IH, Hansen JB and
Pedersen SF: MCT1 and MCT4 expression and lactate flux activity
increase during white and brown adipogenesis and impact adipocyte
metabolism. Sci Rep. 7:131012017. View Article : Google Scholar
|
|
44
|
Whitaker-Menezes D, Martinez-Outschoorn
UE, Lin Z, Ertel A, Flomenberg N, Witkiewicz AK, Birbe RC, Howell
A, Pavlides S, Gandara R, et al: Evidence for a stromal-epithelial
‘Lactate Shuttle’ in human tumors: MCT4 is a marker of oxidative
stress in cancer-associated fibroblasts. Cell Cycle. 10:1772–1783.
2011. View Article : Google Scholar
|
|
45
|
Li Z, Wu Q and Sun S, Wu J, Li J, Zhang Y,
Wang C, Yuan J and Sun S: Monocarboxylate transporters in breast
cancer and adipose tissue are novel biomarkers and potential
therapeutic targets. Biochem Biophys Res Commun. 501:962–967. 2018.
View Article : Google Scholar
|
|
46
|
Liberti MV and Locasale JW: The warburg
effect: How does it benefit cancer cells? Trends Biochem Sci.
41:211–218. 2016. View Article : Google Scholar
|
|
47
|
Pavlides S, Whitaker-Menezes D,
Castello-Cros R, Flomenberg N, Witkiewicz AK, Frank PG, Casimiro
MC, Wang C, Fortina P, Addya S, et al: The reverse warburg effect:
Aerobic glycolysis in cancer associated fibroblasts and the tumor
stroma. Cell Cycle. 8:3984–4001. 2009. View Article : Google Scholar
|
|
48
|
Schäffler A, Schölmerich J and Buechler C:
Mechanisms of disease: Adipokines and breast cancer-endocrine and
paracrine mechanisms that connect adiposity and breast cancer. Nat
Clin Pract Endocrinol Metab. 3:345–354. 2007. View Article : Google Scholar
|
|
49
|
Choi J, Cha YJ and Koo JS: Adipocyte
biology in breast cancer: From silent bystander to active
facilitator. Prog Lipid Res. 69:11–20. 2018. View Article : Google Scholar
|
|
50
|
Gnerlich JL, Yao KA, Fitchev PS,
Goldschmidt RA, Bond MC, Cornwell M and Crawford SE: Peritumoral
expression of adipokines and fatty acids in breast cancer. Ann Surg
Oncol. 20 (Suppl 3):S731–S738. 2013. View Article : Google Scholar
|
|
51
|
Ertunc ME, Sikkeland J, Fenaroli F,
Griffiths G, Daniels MP, Cao H, Saatcioglu F and Hotamisligil GS:
Secretion of fatty acid binding protein aP2 from adipocytes through
a nonclassical pathway in response to adipocyte lipase activity. J
Lipid Res. 56:423–434. 2015. View Article : Google Scholar
|
|
52
|
Hotamisligil GS and Bernlohr DA: Metabolic
functions of FABPs-mechanisms and therapeutic implications. Nat Rev
Endocrinol. 11:592–605. 2015. View Article : Google Scholar
|
|
53
|
Guaita-Esteruelas S, Bosquet A, Saavedra
P, Gumà J, Girona J, Lam EW, Amillano K, Borràs J and Masana L:
Exogenous FABP4 increases breast cancer cell proliferation and
activates the expression of fatty acid transport proteins. Mol
Carcinog. 56:208–217. 2017. View Article : Google Scholar
|
|
54
|
Guaita-Esteruelas S, Saavedra-García P,
Bosquet A, Borràs J, Girona J, Amiliano K, Rodríguez-Balada M,
Heras M, Masana L and Gumà J: Adipose-derived fatty acid-binding
proteins plasma concentrations are increased in breast cancer
patients. Oncologist. 22:1309–1315. 2017. View Article : Google Scholar
|
|
55
|
Witkiewicz AK, Kline J, Queenan M, Brody
JR, Tsirigos A, Bilal E, Pavlides S, Ertel A, Sotgia F and Lisanti
MP: Molecular profiling of a lethal tumor microenvironment, as
defined by stromal caveolin-1 status in breast cancers. Cell Cycle.
10:1794–1809. 2011. View Article : Google Scholar
|
|
56
|
Wang P, Renes J, Bouwman F, Bunschoten A,
Mariman E and Keijer J: Absence of an adipogenic effect of
rosiglitazone on mature 3T3-L1 adipocytes: Increase of lipid
catabolism and reduction of adipokine expression. Diabetologia.
50:654–665. 2007. View Article : Google Scholar
|
|
57
|
Sanchez-Alvarez R, Martinez-Outschoorn UE,
Lamb R, Hulit J, Howell A, Gandara R, Sartini M, Rubin E, Lisanti
MP and Sotgia F: Mitochondrial dysfunction in breast cancer cells
prevents tumor growth: Understanding chemoprevention with
metformin. Cell Cycle. 12:172–182. 2013. View Article : Google Scholar
|
|
58
|
Martinez-Outschoorn U, Sotgia F and
Lisanti MP: Tumor microenvironment and metabolic synergy in breast
cancers: Critical importance of mitochondrial fuels and function.
Semin Oncol. 41:195–216. 2014. View Article : Google Scholar
|
|
59
|
Huang CK, Chang PH, Kuo WH, Chen CL, Jeng
YM, Chang KJ, Shew JY, Hu CM and Lee WH: Adipocytes promote
malignant growth of breast tumours with monocarboxylate transporter
2 expression via β-hydroxybutyrate. Nat Commun. 8:147062017.
View Article : Google Scholar
|
|
60
|
Köhrmann A, Kammerer U, Kapp M, Dietl J
and Anacker J: Expression of matrix metalloproteinases (MMPs) in
primary human breast cancer and breast cancer cell lines: New
findings and review of the literature. BMC Cancer. 9:1882009.
View Article : Google Scholar
|
|
61
|
Iida J, Clancy R, Dorchak J, Somiari RI,
Somiari S, Cutler ML, Mural RJ and Shriver CD: DNA aptamers against
exon v10 of CD44 inhibit breast cancer cell migration. PLoS One.
9:e887122014. View Article : Google Scholar
|
|
62
|
Nam KS, Oh S, Lee KM, Yoo SA and Shin I:
CD44 regulates cell proliferation, migration, and invasion via
modulation of c-Src transcription in human breast cancer cells.
Cell Signal. 27:1882–1894. 2015. View Article : Google Scholar
|
|
63
|
Villarroya F, Cereijo R, Villarroya J and
Giralt M: Brown adipose tissue as a secretory organ. Nat Rev
Endocrinol. 13:26–35. 2017. View Article : Google Scholar
|
|
64
|
Chen SQ, Niu Q, Ju LP, Alimujiang M, Yan
H, Bai NN, Xu J, Fang QC, Han JF, Yang Y and Jia WP: Predicted
secreted protein analysis reveals synaptogenic function of Clstn3
during WAT browning and BAT activation in mice. Acta Pharmacol Sin.
40:999–1009. 2019. View Article : Google Scholar
|