Introduction
Intrahepatic cholangiocarcinoma (ICC) is the second
most common type of primary liver cancer. The incidence of ICC
accounts for 10–15% of primary liver cancer (1,2). Data
from the WHO database indicated the global morbidity and mortality
rates of ICC have demonstrated a clear upward trend in recent years
(2). Globally, morbidity rates
increased from approximately 0.14–1.47 per 100,000 people in 1993
to 0.29–2.19 per 100,000 people in 2012 (3). Mortality rates were consistently below
1/100,000 people before 2000, and in the 2010–2014 period, the
mortality rates were between 2–3/100,000 people in most countries
(4). Compared with hepatocellular
carcinoma (HCC), ICC is more difficult to treat. Surgical resection
is currently the main treatment option for ICC, but a considerable
number of patients are unable to receive surgery due to the cancer
having progressed to the middle and late stages at the time of
diagnosis. For patients, conservative treatment based on
radiotherapy and chemotherapy is the main treatment method
(5–7). In recent years, chemotherapy-based
comprehensive treatment has become key to improve the overall
efficacy of ICC. Chemotherapy resistance of ICC cells has become a
bottleneck restricting the therapeutic effect of ICC (8). Therefore, an in-depth study of the
causes and mechanisms underlying ICC chemotherapy resistance is
important for cancer research.
Previously, research on tumor chemotherapy
resistance has focused on the role of the tumor cell multi-drug
resistance gene, protein kinase C, ABC membrane transporter and
deacetylase in tumor cell chemotherapy resistance (9–11). In
recent years, more studies have confirmed the role that the tumor
microenvironment plays in chemotherapy-resistance of tumors
(12,13).
The tumor microenvironment mainly includes immune
and inflammatory cells, interstitial cells and a large number of
cytokines, chemokines and matrix-degrading enzymes produced around
the tumor (14). Mesenchymal stem
cells (MSCs) are important components of the tumor microenvironment
and can specifically migrate to primary tumors and metastatic
tumors, and proliferate and differentiate into components of the
tumor stroma (15,16). There are numerous studies that have
demonstrated that MSCs play an important role in chemoresistance in
various types of cancer, including gastric cancer, ovarian cancer
and leukemia (17–19). Our previous study revealed that MSCs
treated with a combination of inflammatory factors TNF-α and IFN-γ
significantly increased the chemoresistance of liver cancer cells
(20). In subsequent studies, it
was revealed that there was also a large number of MSCs
infiltrating in ICC (21,22). To the best of our knowledge, it is
currently unknown whether MSCs in the inflammatory microenvironment
of ICC can affect the chemotherapy resistance of cholangiocarcinoma
cells. Therefore, the present study investigated whether MSCs in
the tumor microenvironment affect chemoresistance of ICC, as well
as the underlying mechanism.
Materials and methods
Ethics statement
The present study was approved by the Institutional
Ethics Committee of the Eastern Hepatobiliary Surgery Hospital in
Shanghai, China, and was performed in compliance with the
Declaration of Helsinki (1975) and its amendments. Patients whose
ICC tumor tissues were used in the present study, provided written
informed consent. A total of 80 cases of ICC patients diagnosed by
surgery at the Eastern Hepatobiliary Surgery Hospital between
January 2012 and January 2013 were enrolled. Their tumor tissues
and clinical information were collected for data analysis.
Cell culture
The UC-MSCs were purchased from Cyagen Biotechnology
Co., Ltd. (cat. no. HUXUC-03011-440). MSCs were cultured in
Dulbecco's modified Eagle's medium (DMEM) nutrient mix F12 (cat.
no. 10565018; Thermo Fisher Scientific, Inc.) with 10% fetal bovine
serum (FBS; cat. no. 16140071; Gibco™; Thermo Fisher Scientific,
Inc.). ICC cell line RBE (cat. no. TCHu179; Cell Bank of Chinese
Academy of Sciences) was cultured in RPMI-1640 medium (item no.
31800; Solarbio Life Sciences) containing 10% FBS and ICC cell line
QBC939 (Tongpai Biotechnology Co., Ltd.) was cultured in DMEM
containing 10% FBS. All cells were cultured at 37°C in a humidified
atmosphere containing 5% CO2.
Reagents
Herpesvirus entry mediator (HVEM)-overexpressing
adenovirus was synthesized by Obio Technology Corporation
(http://www.obiosh.cn/). Enhanced Green
Fluorescent Protein (EGFP)-overexpressing adenovirus (OBiO
Technology Corp., Ltd.) was used as the control. IL-6 cytokine
(cat. no. 206-IL-010/CF) was purchased from R&D Systems, Inc.
Chloroquine (CQ) was purchased from Sigma-Aldrich; Merck KGaA. In
order to determine whether autophagy was involved in IL-6-induced
chemoresistance in cholangiocarcinoma cells, the inhibitor of
autophagy CQ was added to the medium of cholangiocarcinoma cells at
a concentration of 10 µM. Compound C was purchased from Selleck
Chemicals. To determine the role of the AMPK pathway in
IL-6-induced autophagy, the AMPK inhibitor, compound C, was used to
suppress AMPK signaling at a concentration of 5 µM.
Isolation of MSCs from tissues of
patients with ICC by flow cytometry
ICC tissues were minced and digested at 37°C with
2.5 mg/ml collagenase IV (Sigma Aldrich; Merck KGaA) and 0.1 mg/ml
DNase (Sigma Aldrich; Merck KGaA). Digestion was performed for 30
min-1 h and stopped once no pieces of tissue were left. Then, the
suspension was filtered through a 100-µm nylon cell strainer and
spun 5 min at 300–400 × g, at 4°C to obtain single-cell suspension.
The suspension was then incubated with FITC-conjugated SSEA-4 (cat.
no. 330409; BioLegend, lnc.) for 30 min at 4°C. Cells were washed 3
times with PBS, and then FITC-positive cells were assessed via flow
cytometry. Flow cytometry was carried out with MoFlo™ XDP Cell
Sorter (Beckman Coulter, Inc.) and the data analysis was performed
using FlowJo software v.7.6.5 (BD Biosciences).
Apoptosis detection by flow
cytometry
RBE human cholangiocarcinoma cells
(1×10⁶) and QBC939 human cholangiocarcinoma cells
(1×10⁶) were plated into 6-well plates, 50% conditioned
medium of control MSCs and HVEM-overexpressing MSCs were added. In
addition, chemotherapeutic drugs, 5-FU (25 µg/ml) (cat. no.
HY-90006; MedChemExpress) and cisplatin (5 µg/ml) (cat. no.
HY-17394; MedChemExpress) were added to the culture system for 48
h. Cells were stained by Annexin V Alexa Fluor 647 (cat. no.
R37175; Invitrogen; Thermo Fisher Scientific, Inc.) and propidium
iodide (PI; cat. no. P3566; Invitrogen; Thermo Fisher Scientific,
Inc.) at 4°C for 30 min, and then the cells were washed with PBS.
Annexin V- and PI-positive cells were analyzed by flow cytometry.
Flow cytometry was carried out with MoFlo™ XDP Cell Sorter and the
data analysis was performed using FlowJo software v.7.6.5.
Chemoresistance experiment
RBE human cholangiocarcinoma cells
(1×10⁶) were plated into 6-well plates, and treated with
various IL-6 concentrations (0.1, 1, 5, 10, 20 and 50 ng/ml) for
6–8 h. Then, chemotherapeutic drugs, 5-FU (25 µg/ml) and cisplatin
(5 µg/ml) were added to the culture system for 48 h. Western
blotting was used to detect the level of autophagy, and CCK-8 and
apoptosis assays were employed to examine cell viability and cell
death. The lowest concentration of IL-6 (10 ng/ml) which could
effectively promote autophagy and chemoresistance was used for
subsequent experiments.
Cell Counting Kit-8 (CCK-8) assay
Cholangiocarcinoma cells (3,000 cells/well) were
plated into 96-well plates, and 50% conditioned medium of control
MSCs and HVEM-overexpressing MSCs were added. In addition,
chemotherapeutic drugs, 5-FU and cisplatin were added to the
culture system at 25 µg/ml and 5 µg/ml, respectively. After 48 h, a
CCK-8 assay (cat. no. ab228554; Abcam) was used to assess the cell
viability. CCK-8 reagent was added into each well at a ratio of
1:10 with medium. After incubation for 1 h at 37°C, the absorbance
was detected using a microplate reader at a wavelength of 450
nm.
Gene overexpression mediated by
recombinant adenovirus
A recombinant adenovirus of HVEM overexpression was
purchased from Genechem Biotech, Inc. This adenovirus was amplified
directly from the original adenovirus strain. The original
adenovirus strain was constructed by co-transfecting plasmid and
packaging plasmid to adenovirus. The plasmid vector was
pADV-mCMV-HA-P2A and pADV-mCMV-HA-P2A-EGFP was used as a control.
Plasmid (1 µg/µl) was transfected with Lipofectamine 3000
transfection reagent (cat. no. L3000015; Invitrogen; Thermo Fisher
Scientific, Inc.) into the adenovirus at 37°C for 24 h. 293 cells
(1×10⁶; cat. no. GNHu18; Cell Bank of Chinese Academy of
Sciences) were transfected to amplify the adenovirus. Adenovirus
particles were collected and the concentration was detected. MSCs
were transfected by this adenovirus at MOI 20 for 12 h with
serum-free medium. Then, 48 h later, HVEM expression was verified
by western blotting.
Western blotting
Total protein was extracted from cells using RIPA
buffer (Beyotime Institute of Biotechnology), and the protein
concentration was detected using a BCA assay. A total of 20 µg
protein per lane was separated via 12% SDS-PAGE (Zhao Rui Biotech
Co., Ltd.). The proteins were then transferred onto nitrocellulose
membranes. Next, 5% non-fat milk was used to block non-specific
sites for 2 h at room temperature. The membranes were incubated
with primary antibodies against: HVEM (product code ab47677;
Abcam), LC-3 (product no. 12741), p62 (product no. 88588) and GAPDH
(product no. 5174) (all 1:1,000; from Cell Signaling Technology,
Inc) at 4°C overnight. The membranes were then washed with TBST
[TBS + 0.1% (v/v) Tween-20) 3 times, and then incubated with
corresponding secondary antibodies goat anti-rabbit or goat
anti-mouse IgG H&L (HRP) (cat. nos. ab205718 or ab205719,
respectively; 1:5,000; Abcam) at room temperature for 2 h and
washed with TBST another 3 times. ECL (Cell Signaling Technology,
Inc.) was used for visualization.
Reverse transcription-quantitative
(RT-q)PCR
Total RNA was extracted from cells using
TRIzol® (cat. no. 15596-026; Invitrogen; Thermo Fisher
Scientific, Inc.) and reverse-transcribed into cDNA using a Bestar
qPCR RT kit (cat. no. DBI-2220; Shanghai Xinghan Sci&Tech Co.,
Ltd.) according to the manufacturer's protocol. The PCR cycle was
performed according to manufacturer's instructions with initial
denaturation at 37°C for 15 min, 95°C for 2 min followed by 11
cycles at 95°C for 30 sec, 65°C for 30 sec and 72°C for 1 min and a
final extension at 72°C for 5 min. mRNA expression of HVEM was
detected by RT-PCR using a Bestar real-time SYBR Green PCR master
mix (DBI-2043; Shanghai Xinghan Sci&Tech Co., Ltd.) with an ABI
PRISM 7300 system. GAPDH was used as the internal control and data
analysis was performed using the 2−ΔΔCq method (23). The primers used were as follows:
HVEM forward, 5′-TCATCGTCATTGTTTGCTCCA-3′ and reverse,
5′-ACCTTGACTACATCACCCCTT-3′; GAPDH forward,
5′-GGAGCGAGATCCCTCCAAAAT-3′ and reverse,
5′-GGCTGTTGTCATACTTCTCATGG-3′.
Bioplex assay
Conditioned medium of control MSCs and HVEM-MSCs
were collected following culture with serum-free medium for 24 h.
Cytokines in the medium were detected by a Bio-Plex Pro™ Human
Cytokine 27-plex assay (cat. no. M500KCAF0Y). Briefly, serially
diluted standards and undiluted conditioned media (50 µl) were
added to a microfilter plate containing antibody-coupled beads for
each of the 27 analytes and incubated for 60 min with continuous
shaking at room temperature between 20°C and 30°C. After washing,
the biotinylated detection antibodies were added for 30 min with
shaking. The microfilter plate was washed again, and
Streptavidin-PE (50 µl) was added and incubation continued at room
temperature with shaking (90 × g for 1 min followed by 10 × g for
15 min). Assay buffer (125 µl) was added to each well of the
microfilter plate before being read on a Bio-Plex 200 machine
(Bio-Rad Laboratories, Inc.).
Immunohistochemical and
immunofluorescence staining
Patient tissues were fixed with 10% formalin at room
temperature for 24 h, embedded in paraffin, and sliced into 5-µm
thick sections for the immunohistochemistry assay. Sections were
de-paraffinised with xylene and rehydrated with three successive
changes in ethanol, and 1% bovine serum albumin (Gibco; Thermo
Fisher Scientific, Inc.) was used to block non-specific sites at
37°C for 30 min. The sections were then incubated with primary
antibodies against: HVEM (1:100), LC-3 (1:200) and p62 (1:200), at
4°C overnight. PBS was used to wash the sections 3 times, and then
sections were incubated with corresponding secondary antibodies
goat anti-rabbit and goat anti-mouse IgG H&L (HRP) at 37°C for
30 min. After washing with PBS 3 times, DAB (1 mg/ml; cat. no.
D8417; Sigma-Aldrich; Merck KGaA) was used at room temperature
between 20°C and 30°C for 3 min for color development. Hematoxylin
was used to stain nucleic acid at room temperature. A light field
microscope (magnification, ×200) was used to observe and quantify
positive cells per mm2 (Leica Microsystems, Inc.). We
used immunohistochemical scoring standards to define high or low
IL-6 levels. The intensity was scored as follows: 0, negative; 1,
weak; 2, moderate; and 3, strong. The frequency of positive cells
was defined as follows: 0, <5%; 1, 5–25%; 2, 26–50%; 3, 51–75%;
and 4, >75%. The staining index (values, 0–12) was determined by
multiplying the score for staining intensity with the score for
positive area. For statistical analysis, scores of 0 to 7 were
considered low expression and scores of 8 to 12 were considered
high expression) (24).
For immunofluorescence staining, the sections were
boiled with citrate (pH 6.0), permeabilized in PBS supplemented
with 0.2% Triton X-100 (PBST) and blocked with 2% normal donkey
serum (cat. no. ab7475; Abcam) for 1 h at room temperature. Primary
antibodies: HVEM (1:200) and SSEA-4 (1:500; cat. no. ab16287;
Abcam, Inc.) were then incubated at 4°C overnight. Subsequently,
after washing with PBS, the sections were incubated with
corresponding secondary antibodies goat anti-rabbit or goat
anti-mouse IgG H&L (Alexa Fluor® 488) (cat. no.
ab150077 or ab150113, respectively; 1:1,000; Abcam), stained with
DAPI (5 µg/ml; cat. no. D8417; Sigma-Aldrich; Merck KGaA) for 15
min at room temperature and then embedded using
Vectashield® (Vector Laboratories, Inc.). Images were
captured on SP8 confocal microscope (magnification, ×200) (Leica
Microsystems, Inc.).
Statistical analysis
Statistical analyses were performed using the SPSS
20.0 (IBM Corp.). Categorical variables were compared using the
χ2 test. Continuous variables were compared using the
Mann-Whitney U test as appropriate. Pearson's correlation
coefficient was used to determine correlations between continuous
normally distributed variables. The overall survival curve was
drawn by the Kaplan-Meier method. Log-rank test was used to compare
the survival time of patients between each group. Data sets were
analyzed by analysis of variance (ANOVA) with a posteriori contrast
by least significant difference (for comparisons among multiple
groups) or by paired Student's t-test (for comparison between two
groups). Immunohistochemical images were analyzed by
Image-Pro® Plus 6.0 (IPP; Media Cybernetics, Inc.). Each
experiment was performed in triplicate. P<0.05 was considered to
indicate a statistically significant difference.
Results
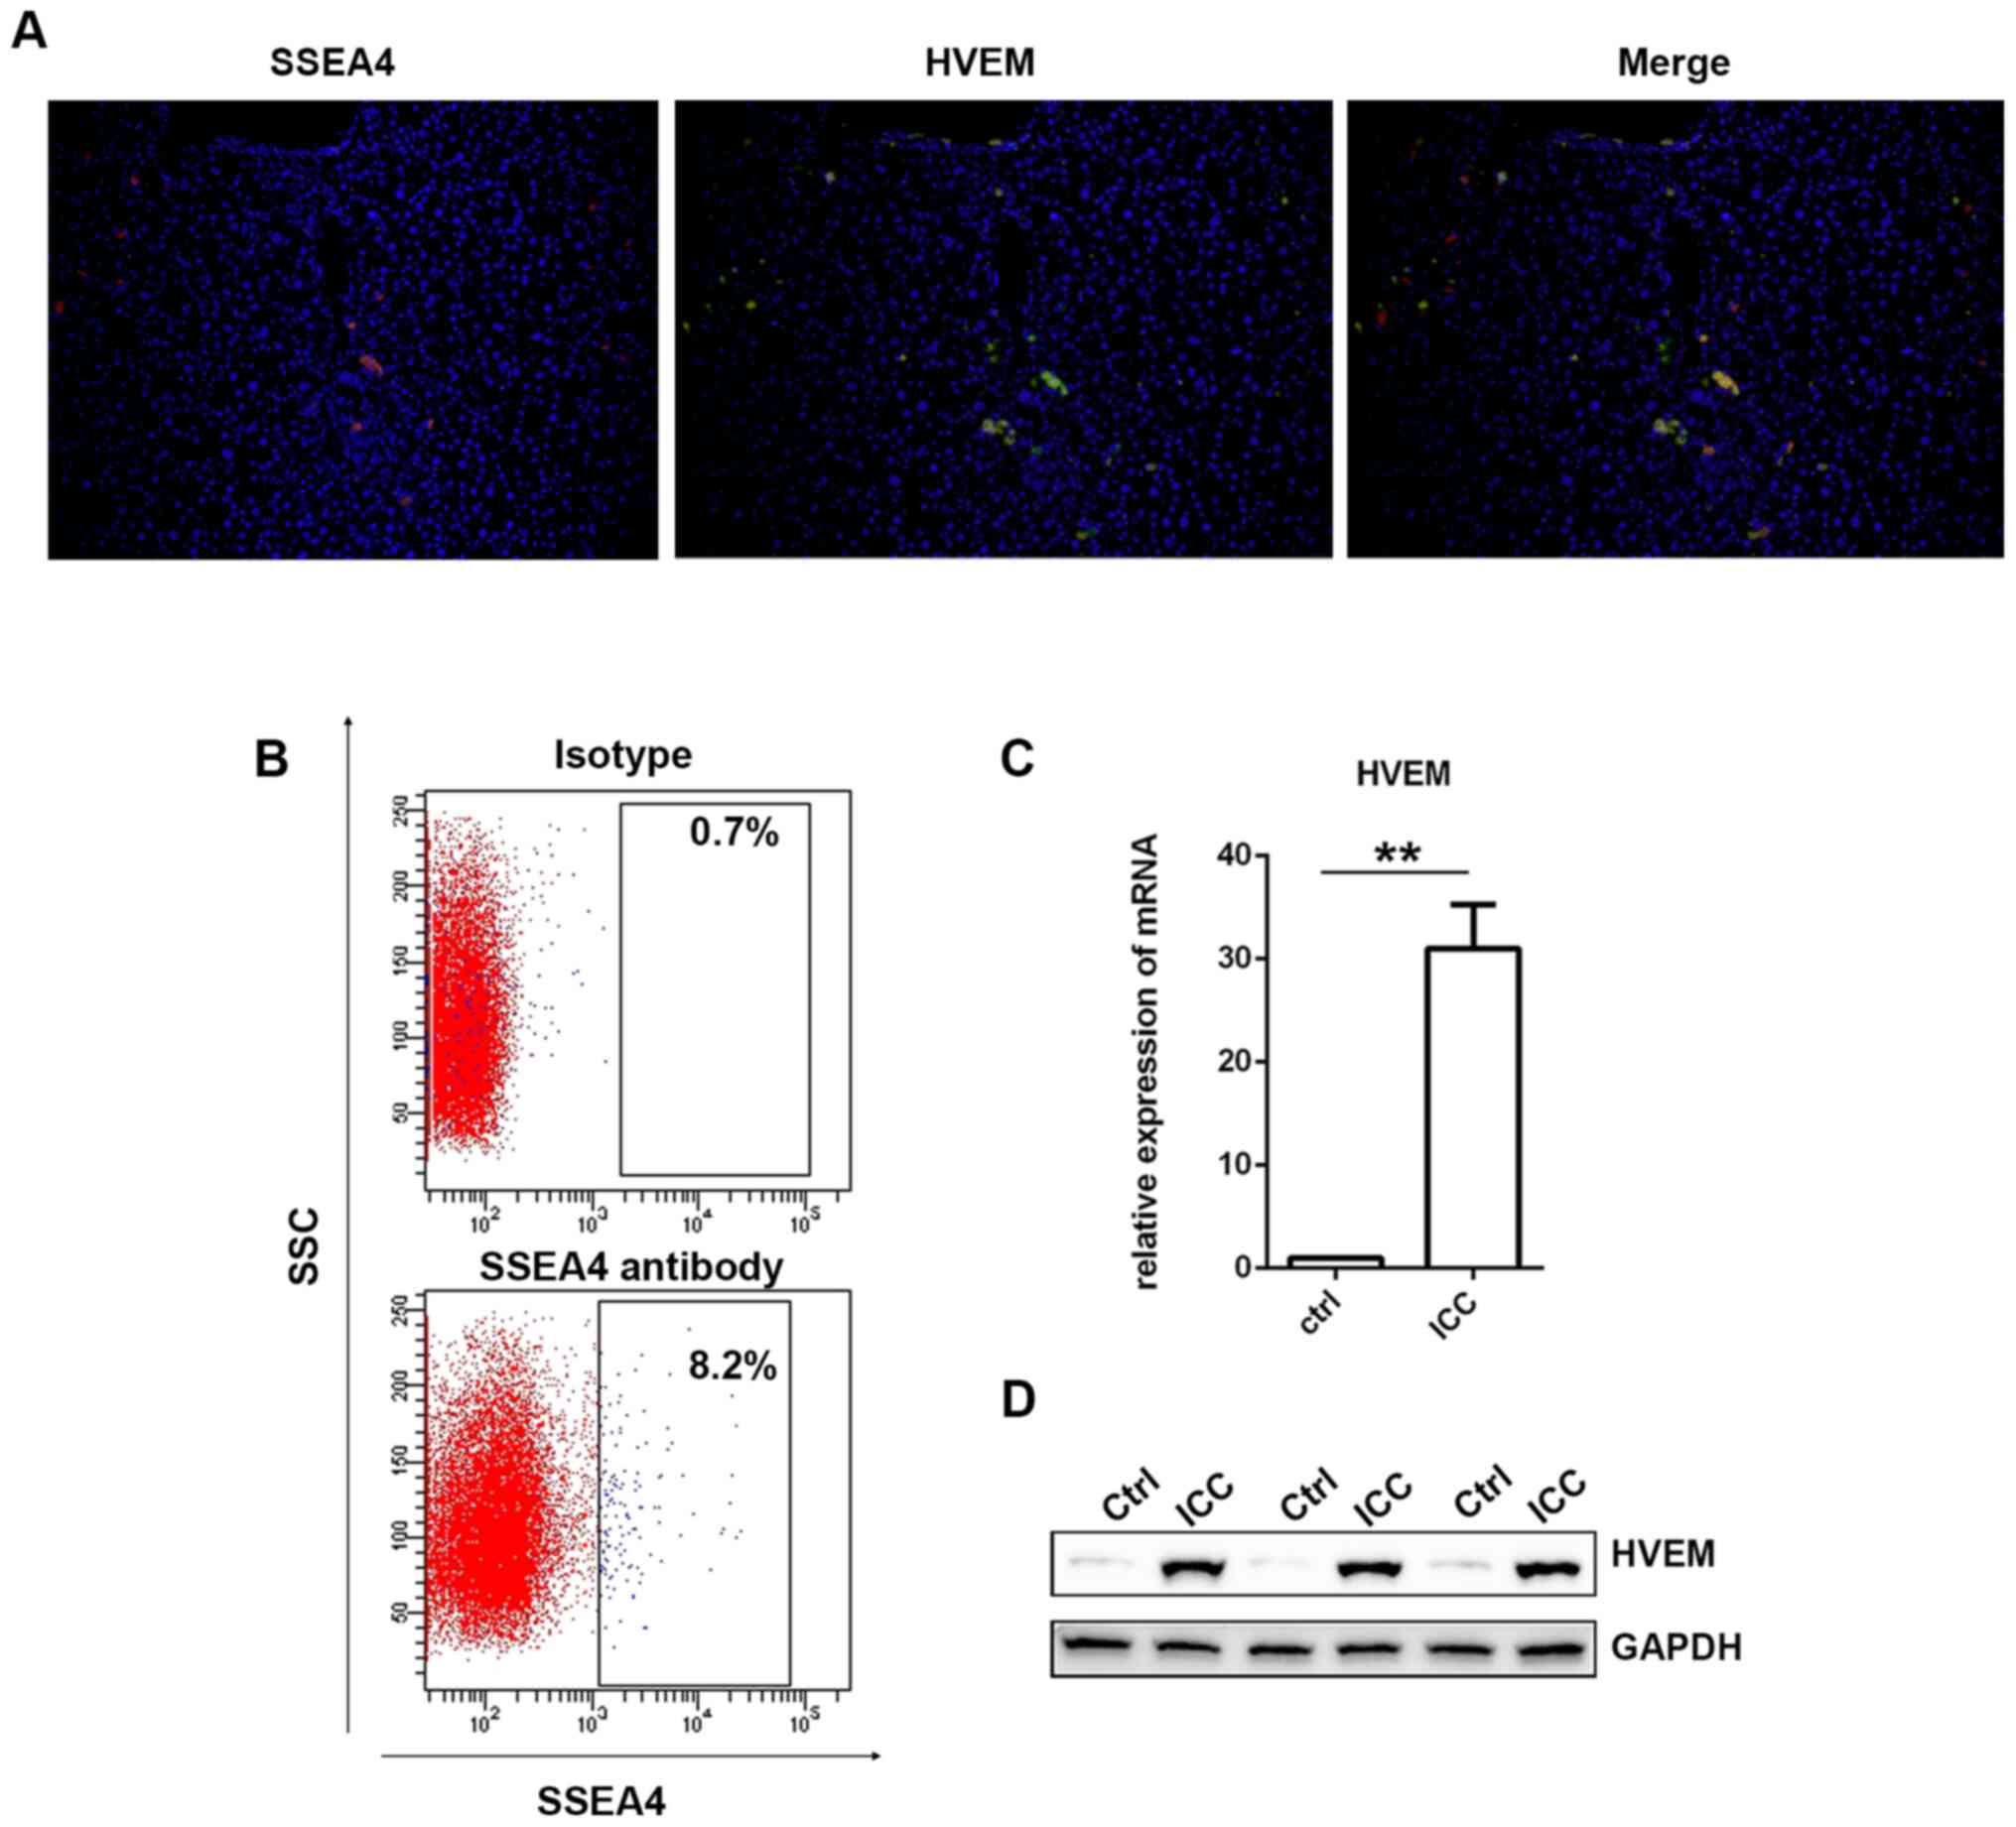
HVEM is upregulated in MSCs isolated
from ICC
At first, immunofluorescence staining of SSEA4 and
HVEM was performed in the liver specimens from several ICC
patients. As revealed in Fig. 1A,
the expression of the SSEA4 (red) and the HVEM (green) exhibited
high overlap. Then, using the fresh liver specimens collected from
the patients with ICC, MSCs were isolated via
fluorescence-activated cell sorting (FACS). SSEA4 antibody was used
to identify MSCs (25,26). As presented in Fig. 1B, there were ~7.5% SSEA-positive
cells detected. Then, SSEA4-positive cells were collected and HVEM
was detected in ICC-MSCs via western blotting and RT-qPCR.
Cholangiocarcinoma originates from abnormal cell differentiation
caused by chronic inflammation. Thus, there is chronic inflammation
in the para-carcinoma tissue. Since the function of MSCs is easily
affected by inflammatory factors, MSCs in para-carcinoma tissue
cannot be used as a normal control (27,28).
Umbilical cord-derived MSCs are derived from normal tissues and are
currently the most commonly used MSCs in research and applications
(29). Therefore, UC-MSCs were used
as a normal control in this study. As presented in Fig. 1D, it was revealed that HVEM
expression in ICC-MSCs was significantly higher than that in
UC-MSCs. The results of the RT-qPCR demonstrated the same trend
(Fig. 1C).
In addition, the level of HVEM between the primary
MSCs sorted by FACS and HVEM-overexpressed MSCs by adenovirus were
detected by western blotting. As revealed in Fig. S1, there was no significant
difference between the expression of HVEM between the primary MSCs
sorted by FACS and the HVEM-overexpressed MSCs by adenovirus.
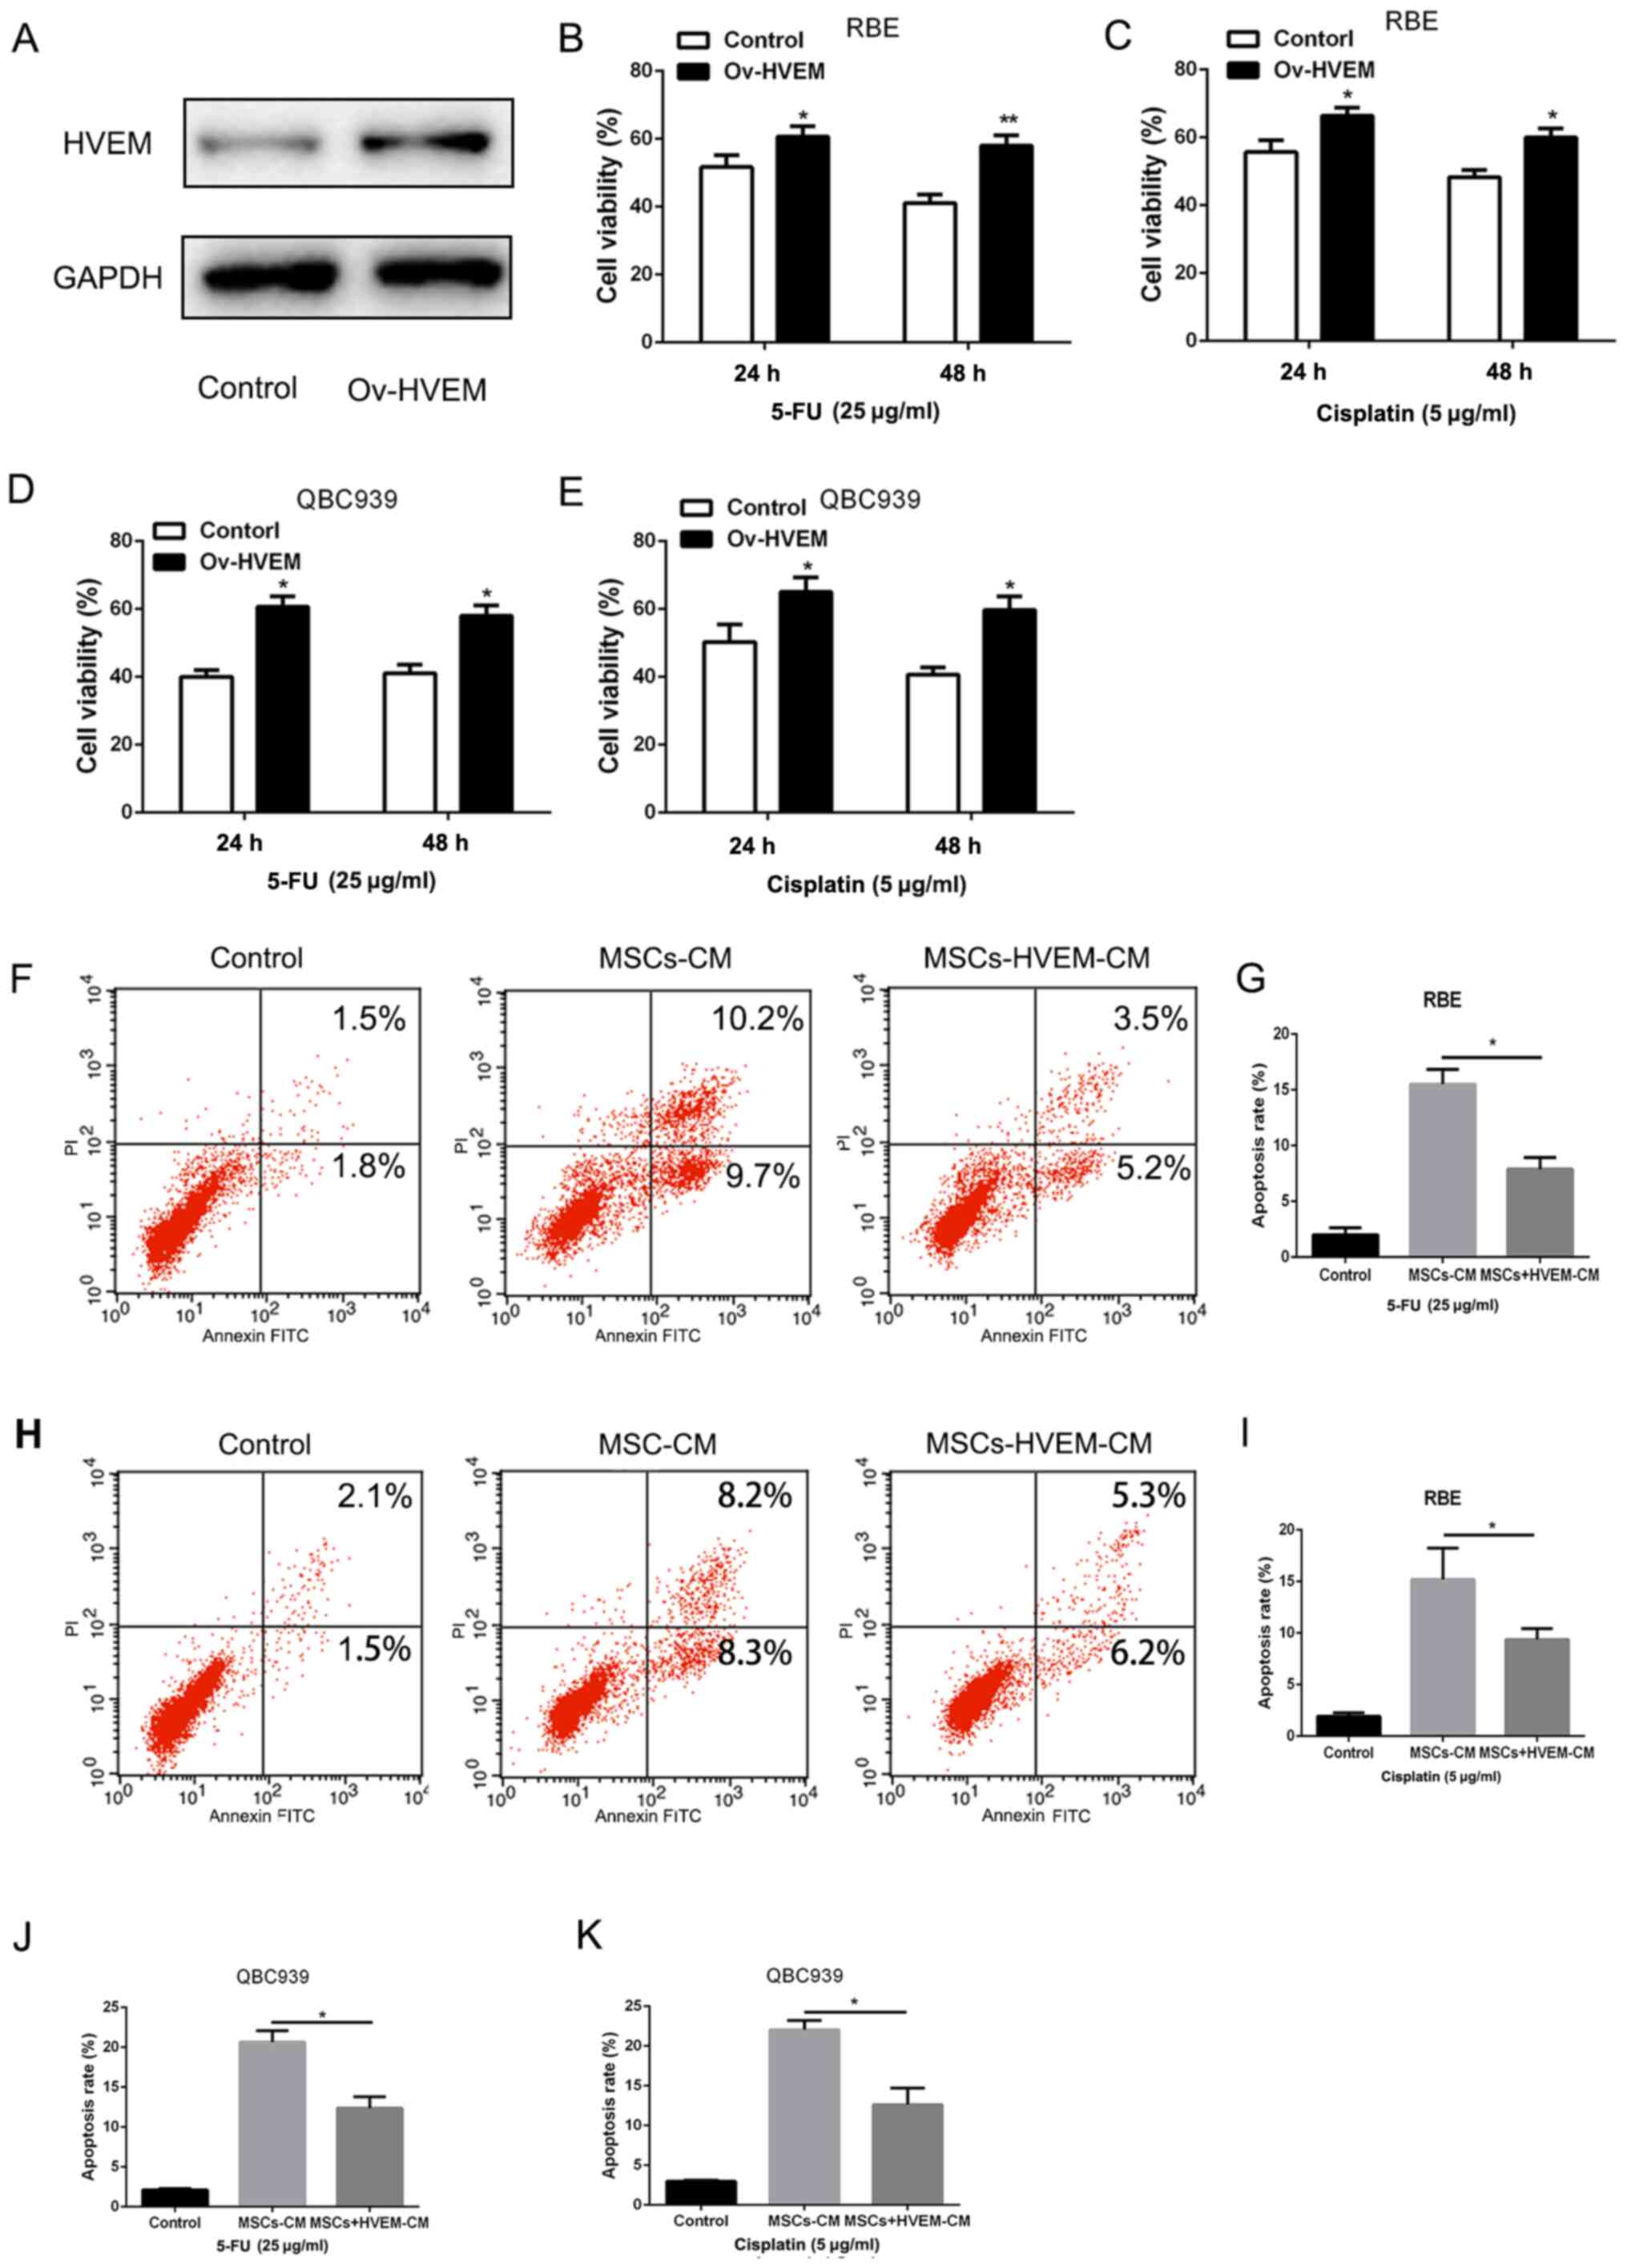
HVEM-overexpressing MSCs promote the
capacity of chemoresistance in cholangiocarcinoma cells
Since HVEM was expressed at high levels in MSCs in
cholangiocarcinoma, in order to detect the role of
HVEM-overexpressed MSCs in the chemoresistance of
cholangiocarcinoma, the present study constructed an
HVEM-overexpressing adenovirus, transfected with normal MSCs, which
were isolated from healthy individuals. As presented in Fig. 2A, the adenovirus effectively induced
HVEM expression in MSCs. Then, the supernatant liquid of
HVEM-overexpressing MSCs was added to the RBE and QBC939 cell
culture medium. The chemotherapeutic drugs, 5-FU and cisplatin (25
and 5 µg/ml) were added to the culture system for 48 h. A CCK-8
assay was used to examine the cell viability. Compared with the
control group, HVEM-overexpressing MSCs demonstrated a
significantly higher cell viability (Fig. 2B-E). Consistent with this, the
apoptosis assay also demonstrated that HVEM-overexpressing MSCs
could significantly enhance the resistance to chemotherapeutic
drugs (Fig. 2F-K). The
aforementioned data indicated that HVEM-overexpressing MSCs
promoted the capacity of chemoresistance in cholangiocarcinoma
cells.
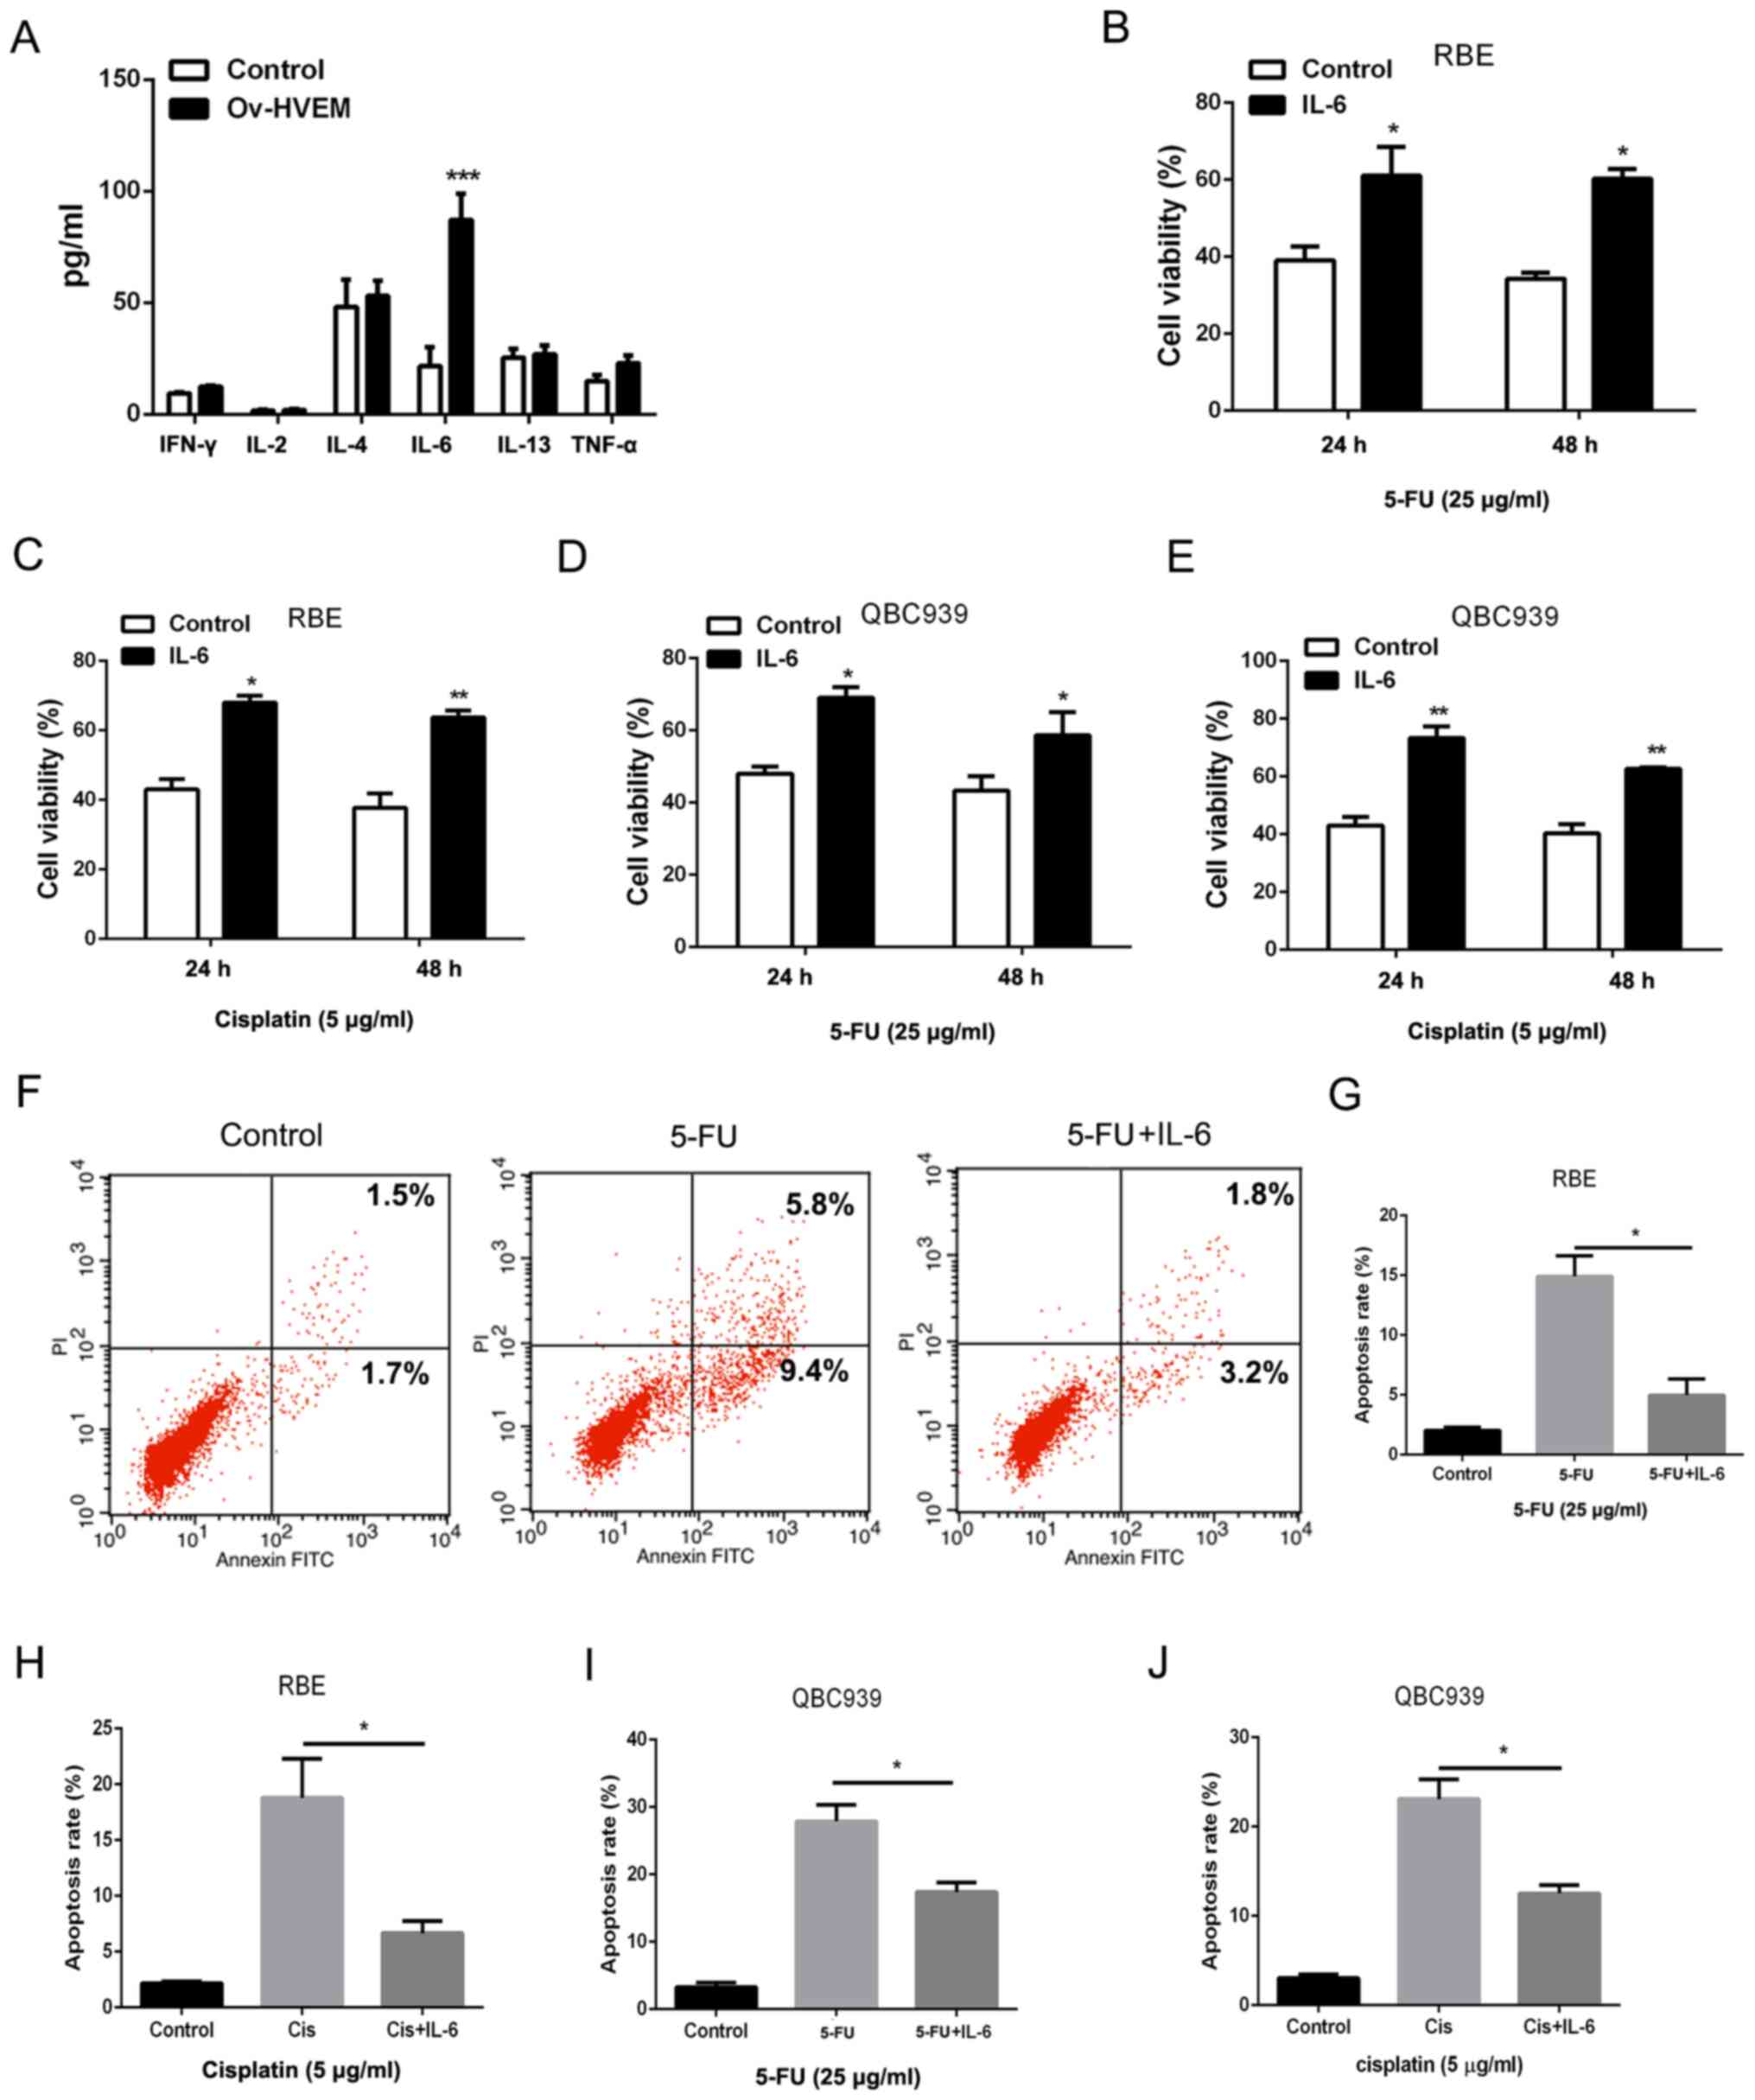
HVEM-overexpressing MSCs increase
chemoresistance in cholangiocarcinoma cells by secreting IL-6
To determine the underlying mechanism by which
HVEM-overexpressing MSCs promoted chemoresistance in
cholangiocarcinoma cells, a bioplex assay was performed to detect
the cytokines in HVEM-overexpressing MSCs. As presented in Fig. 3A, compared with the control group,
the HVEM-overexpressing group exhibited a significantly higher
level of IL-6 in MSCs. In order to confirm the role of IL-6 in the
chemoresistance of cholangiocarcinoma cells, IL-6 was used to treat
cholangiocarcinoma cells directly at a concentration of 10 ng/ml.
The cell viability and death were detected to evaluate the
chemoresistance in cholangiocarcinoma cells. Following treatment
with 5-FU and cisplatin, IL-6 increased the cell viability in RBE
and QBC939 cell lines (Fig. 3B-E).
A decreased amount of 5-FU or cisplatin-induced cell death was
observed in IL-6-pretreated cholangiocarcinoma cells (Fig. 3F-J). These results indicated that
HVEM-overexpressing MSCs promoted chemoresistance in
cholangiocarcinoma cells through IL-6.
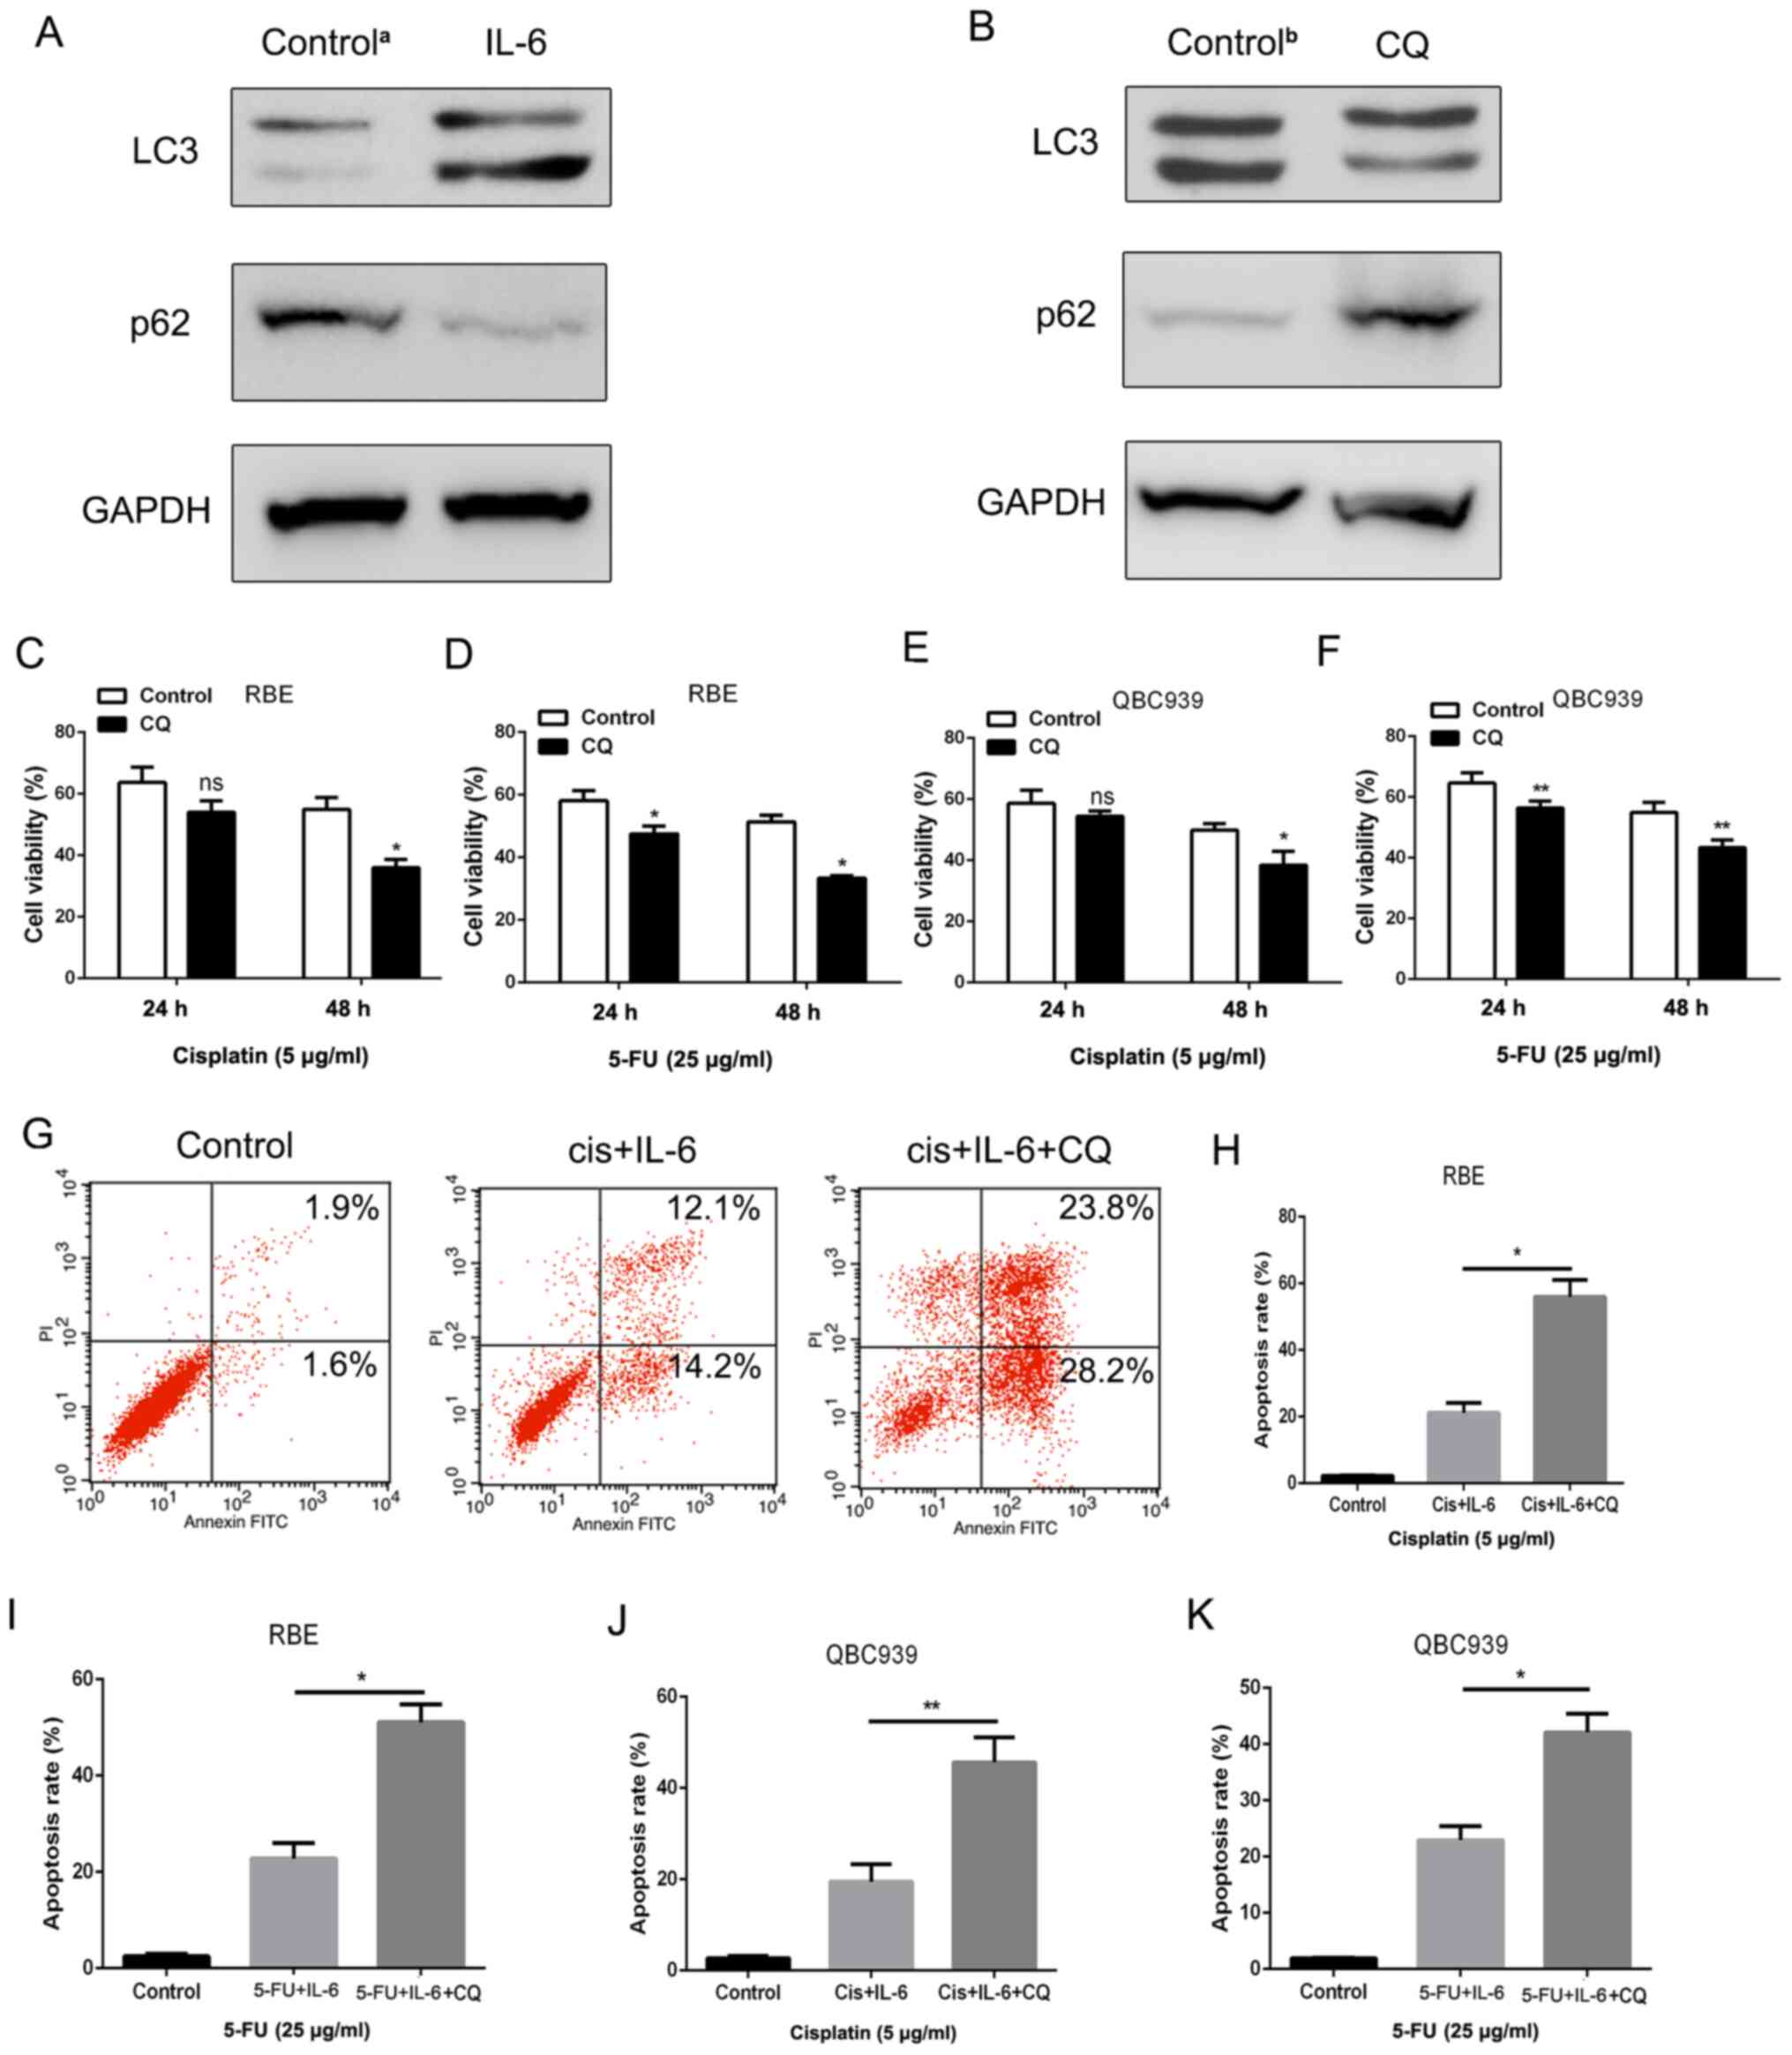
IL-6 promotes the chemoresistance of
cholangiocarcinoma cells through activation of autophagy
The present study then examined the mechanism
underlying IL-6-induced chemoresistance in cholangiocarcinoma
cells. Autophagy has been reported to play an important role in
tumor cell chemosensitivity (30,31).
Therefore, the level of autophagy was detected in IL-6-treated RBE
cells via western blotting. The results indicated that LC-3
expression was upregulated, whereas p62 expression was
downregulated, which are two of the most important markers of
autophagy (32) (Fig. 4A). In order to determine whether
autophagy was involved in IL-6-induced chemoresistance in
cholangiocarcinoma cells, the inhibitor of autophagy CQ was added
to the medium of cholangiocarcinoma cells at a concentration of 10
µM. As revealed in Fig. 4B, CQ
could effectively suppress LC3 expression and increase p62
expression in RBE cells. The CCK-8 and apoptosis assays were also
employed to examine cell viability and cell death in RBE cells
treated with 5-FU and cisplatin. As anticipated, the enhancement of
IL-6-induced survival in RBE cells was diminished when autophagy
was inhibited by CQ (Fig. 4C-F).
Consistent with this, a significantly higher rate of cell apoptosis
was detected in RBE cells in the CQ treatment group compared with
that in the control group (Fig.
4G-K), thus indicating that apoptosis can be inhibited by
autophagy. Therefore, it was established that IL-6 promoted
chemoresistance via activating autophagy in cholangiocarcinoma
cells.
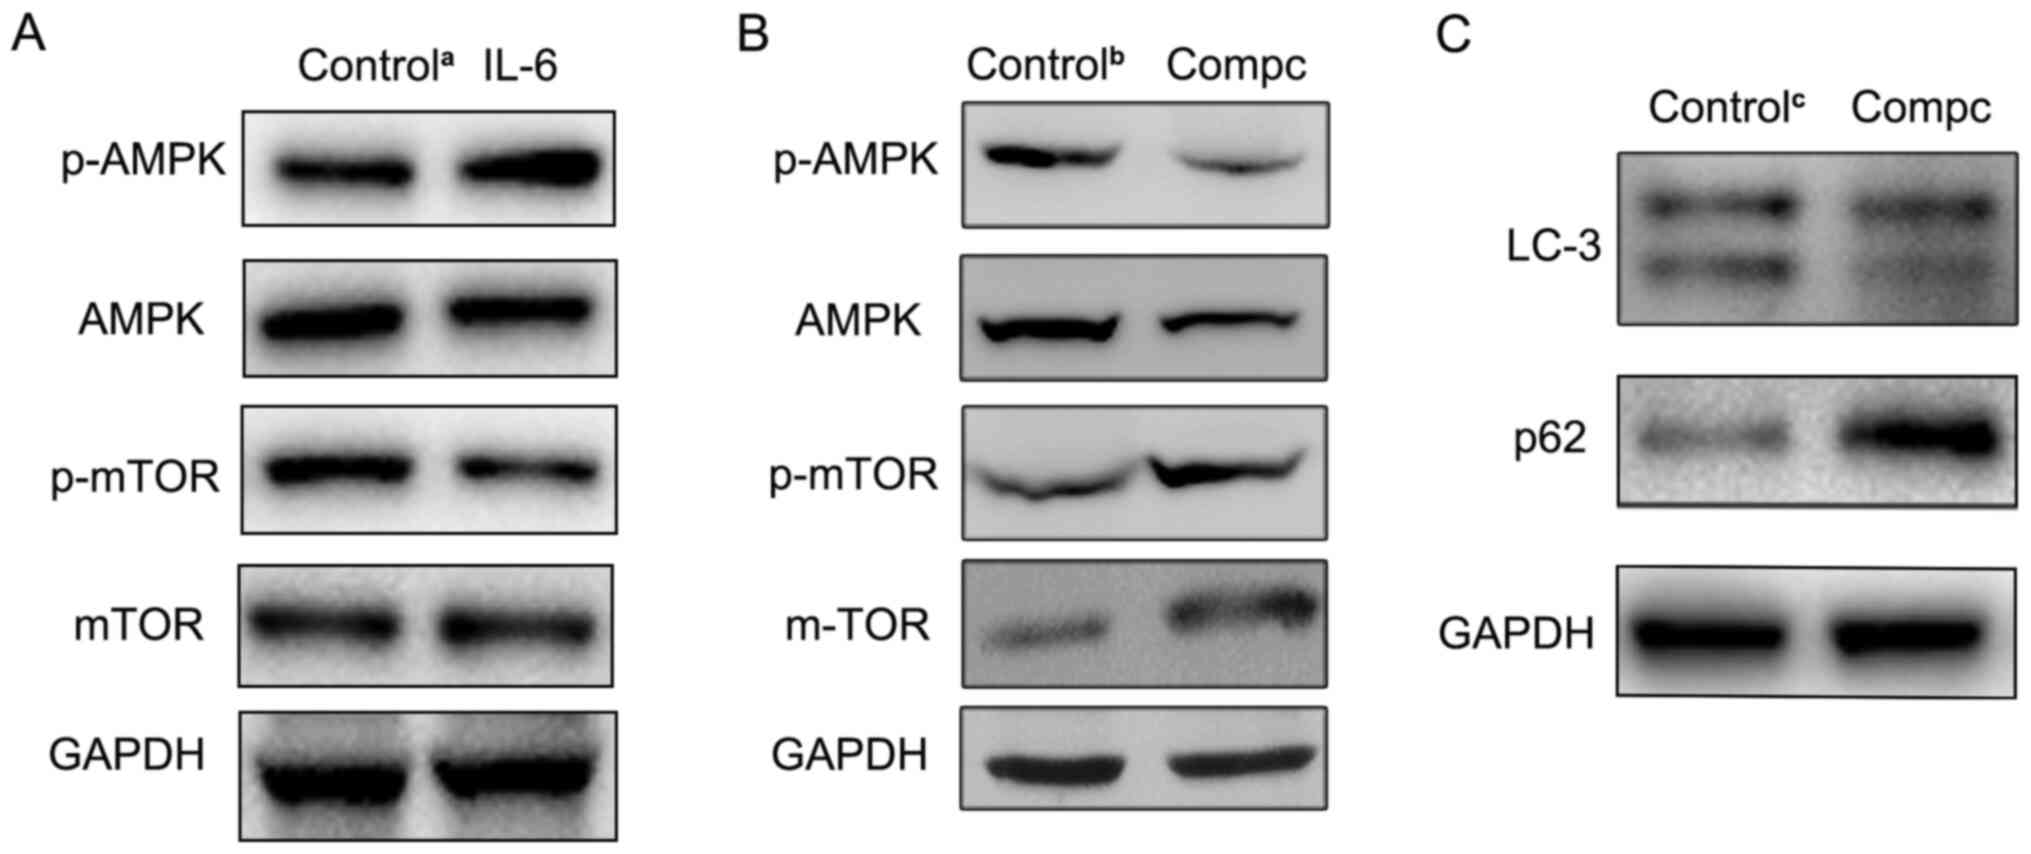
IL-6 activates autophagy by
upregulating the AMPK/mTOR signaling pathway
The present study then investigated the mechanism
underlying IL-6-mediated autophagy activation. Previous studies
have reported that the AMPK/mTOR signaling pathway mediates cell
autophagy activation (33,34), and that activated AMPK negatively
regulated mTOR and thereby enhanced autophagy flux. Therefore,
phosphorylated (p)-AMPK, AMPK, p-mTOR and mTOR levels were detected
in cholangiocarcinoma cells following IL-6 treatment using western
blotting in the present study. As presented in Fig. 5A, compared with the control group,
the level of p-AMPK was increased, while the p-mTOR protein level
was decreased in IL-6-disposed RBE cells. Furthermore, to determine
the role of the AMPK pathway in IL-6-induced autophagy, the AMPK
inhibitor, compound C, was used to suppress AMPK signaling. The
western blotting results revealed that compound C effectively
inhibited p-AMPK expression (Fig.
5B). Then, LC3 and p62 expression levels were also detected in
RBE cells treated with both IL-6 and compound C. Compared with
IL-6-treated alone group, autophagic activity was significantly
decreased in both the IL-6 and compound C-treated group (Fig. 5C). These findings indicated that the
AMPK/mTOR pathway was involved in IL-6-induced autophagy in
cholangiocarcinoma cells.
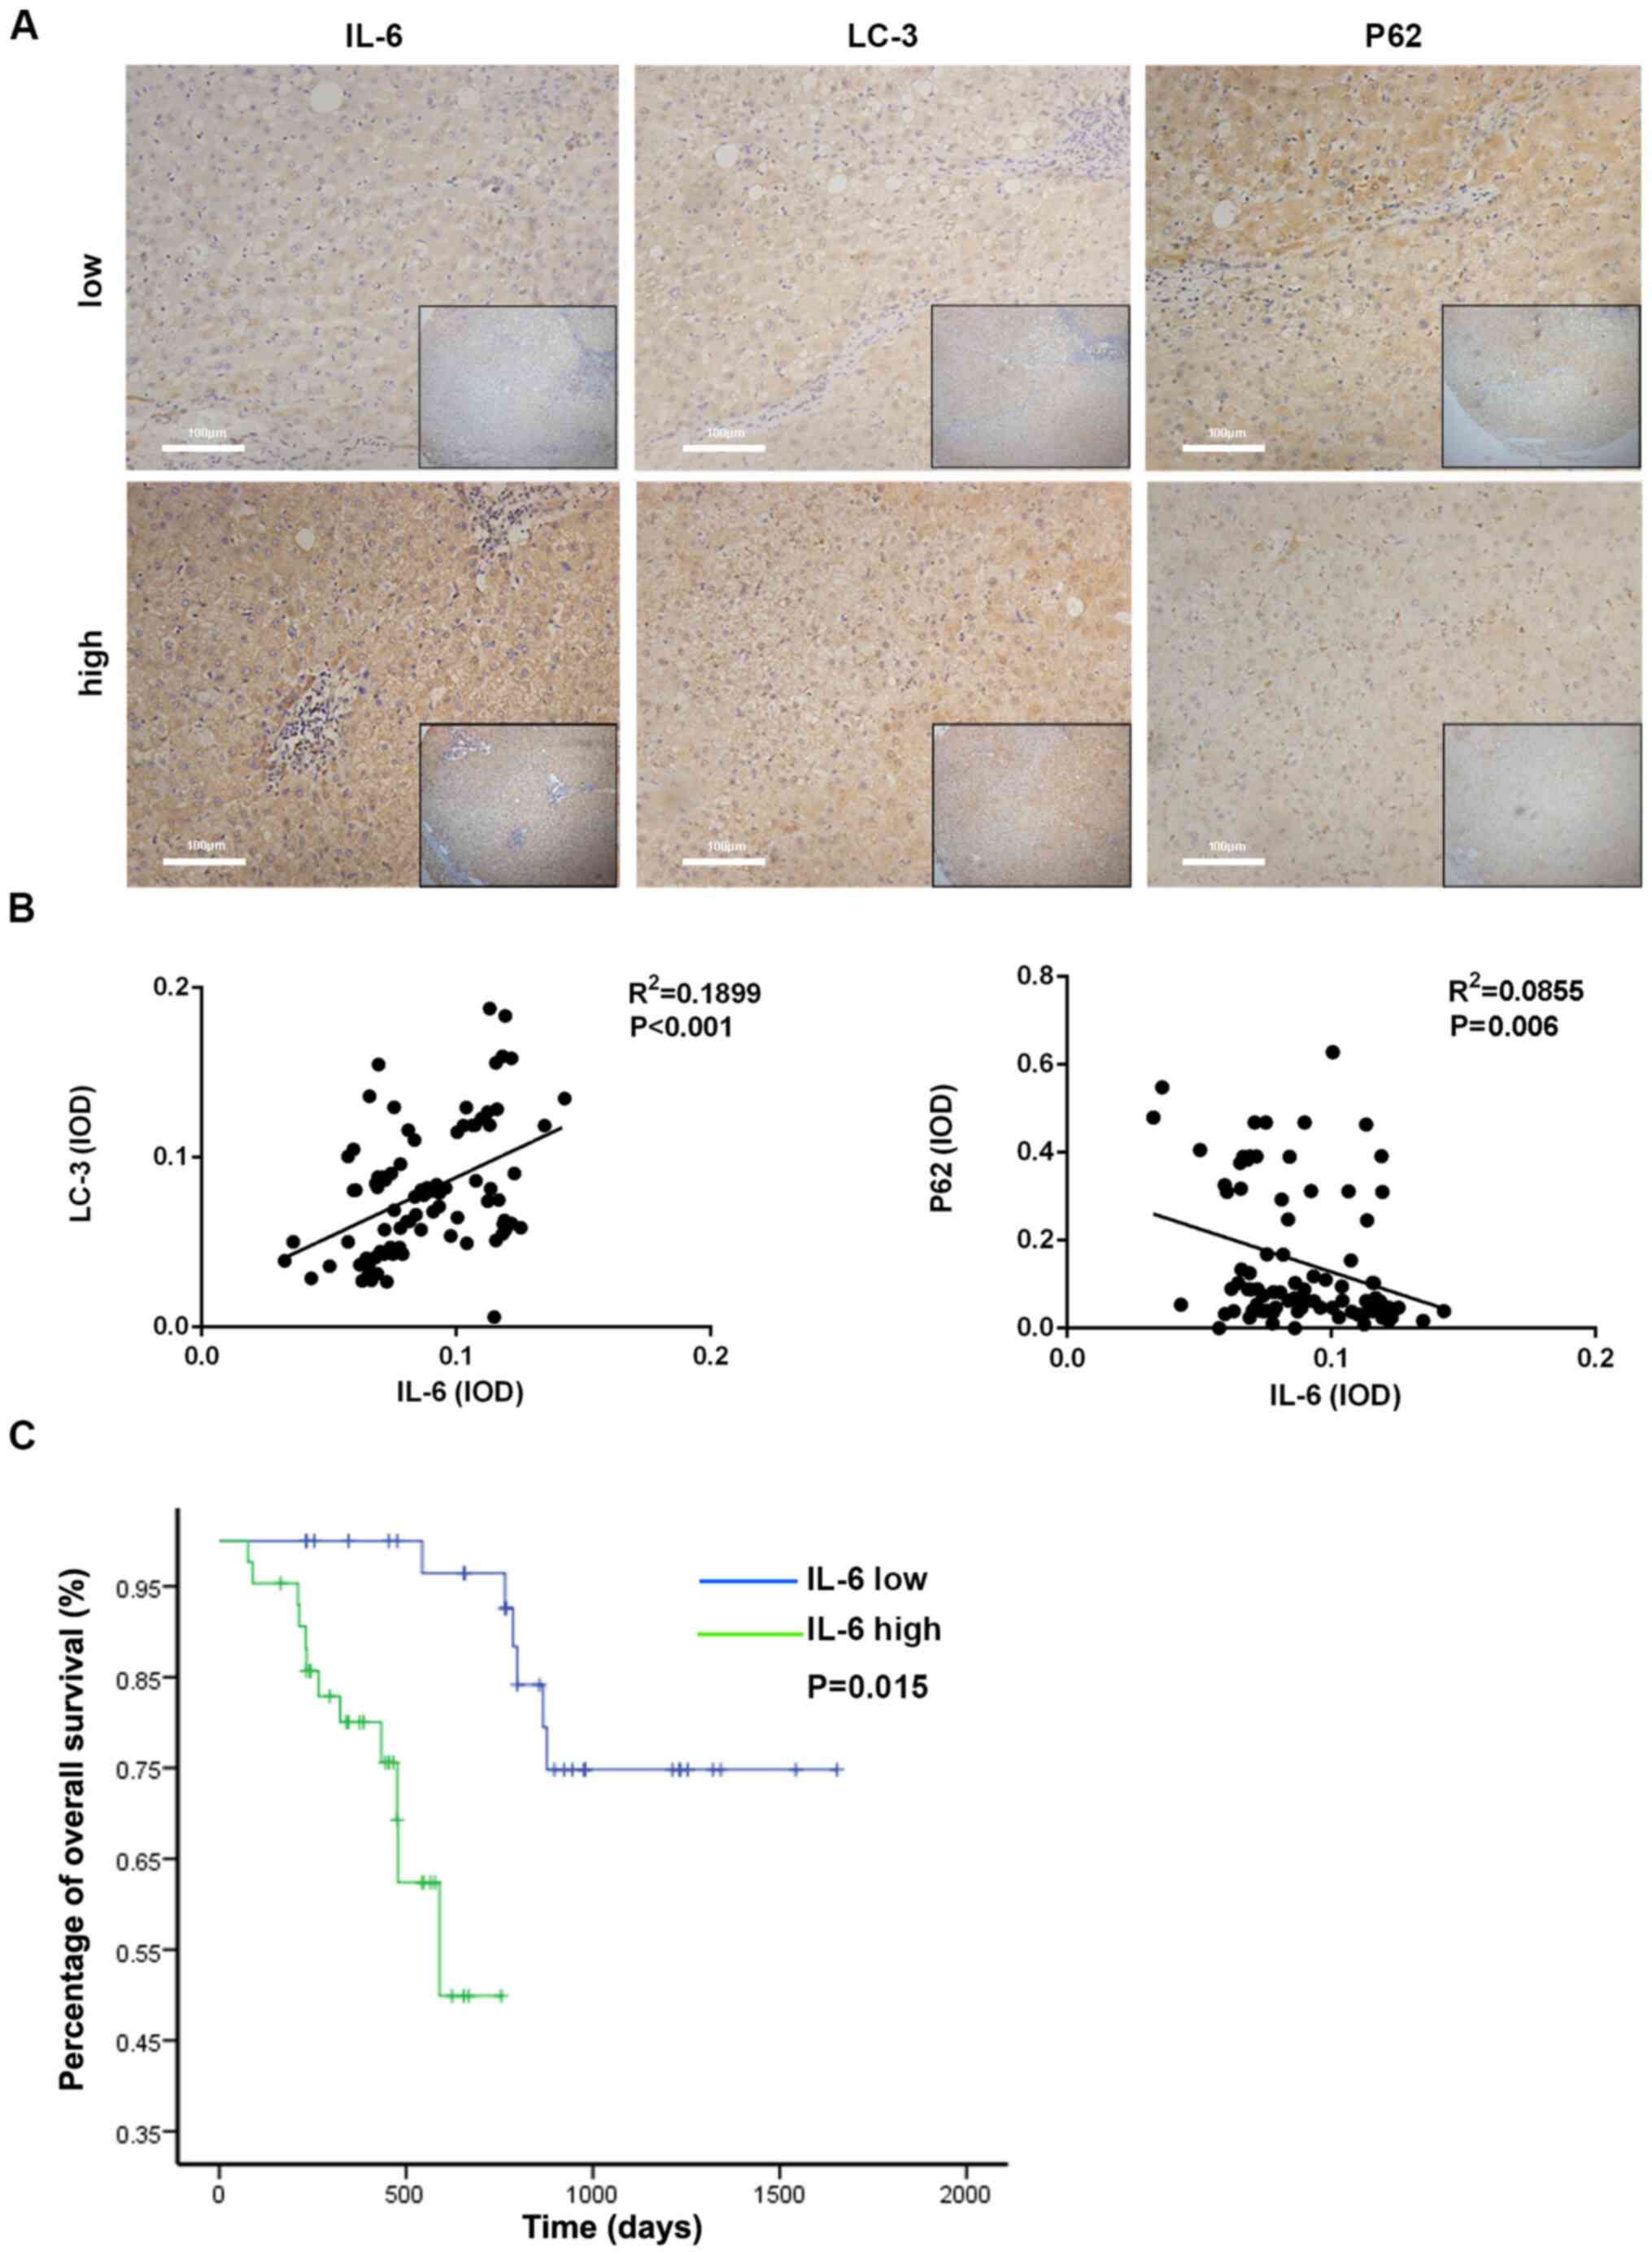
IL-6 level is associated with
autophagy and poor prognosis in clinical specimens of ICC
In order to evaluate the prognostic value of IL-6 in
ICC, 80 patients with ICC were recruited and tumor tissues were
collected. According to the immunohistochemical scoring standard
(scores of 0–7 were considered low expression and scores of 8–12
were considered high expression) (24); the patients were divided into two
groups: The high-IL-6 level group (n=44) and the low-IL-6 level
(n=36) group; It was observed that the expression of LC3 in the
high-IL-6 group was increased compared with the low-IL-6 group and
the expression of p62 in the high-IL-6 group was decreased compared
with the low-IL-6 group (Fig. 6A).
The baseline features between these patients in the two groups were
well-balanced (Table I).
Furthermore, the integrated optical density (IOD) of LC3 and p62
expression was calculated by IPP analysis following
immunohistochemistry in the IL-6-high and IL-6-low expression
groups. Then, the association between the expression levels of IL-6
and autophagy-associated markers was identified. As presented in
Fig. 6B, the IL-6 level was
significantly associated with LC3 and p62 in ICC tissues.
Furthermore, the survival rate of ICC patients was evaluated using
the Kaplan-Meier survival analysis. Patients with high IL-6 levels
were likely to have significantly poorer survival rate than those
with low IL-6 levels (Fig. 6C). The
aforementioned results demonstrated that high IL-6 levels could be
a risk factor in the prognosis of patients with HCC.
 | Table I.Baseline characteristics of
patients. |
Table I.
Baseline characteristics of
patients.
|
| Number (%)/median
(IQR) |
|
|---|
|
|
|
|
|---|
| Variable | High-expression
IL-6 group (n=44) | Low-expression IL-6
group (n=36) | P-value |
|---|
| Age (years) | 53.7
(46.5–57.5) | 50.6
(44.5–55.1) | 0.440 |
| Sex, n (%) |
|
| 0.339 |
|
Male | 30.0 (68.1) | 28.0 (77.8) |
|
|
Female | 14.0 (31.8) | 8.0 (22.2) |
|
| TBIL (mmol/l) | 13.1
(10.3,16.3) | 16.2
(13.6,19.2) | 0.179 |
| ALB (g/l) | 42.0
(40.0,44.9) | 42.5
(40.3,43.5) | 0.446 |
| ALT (IU/l) | 41 (25.9,51.8) | 37.7
(28.6,60.0) | 0.969 |
| AST (IU/l) | 35.6
(27.0,58.5) | 32.8
(24.4,41.5) | 0.206 |
| PLT
(×109/l) | 151.0
(119.0–182.0) | 143.0
(104.5–193.5) | 0.670 |
| PT (S) | 12.0
(11.3,12.5) | 12.0
(11.5,12.9) | 0.236 |
| AFP (µg/l) | 93.5
(64.3,115.0) | 87.5
(58.7,120.3) | 0.811 |
| CEA (µg/l) | 1.6 (1.0,2.1) | 2.50 (1.2,2.6) | 0.074 |
| CA19-9 (IU/ml) | 45.6
(30.5,73.5.0) | 43.5
(32.8,60.3) | 0.655 |
| Tumor diameter
(cm) | 4.0 (3.0,7.0) | 4.6 (2.4,6.0) | 0.721 |
| Tumor number, n
(%) |
|
| 0.604 |
|
Multiple | 10.0 (22.7) | 10.0 (27.8) |
|
|
Solitary | 34.0 (77.3) | 26.0 (72.2) |
|
Discussion
Chemoresistance is a bottleneck of almost all types
of tumor treatments, particularly for those patients who cannot
receive surgery. Numerous factors have previously been demonstrated
to be associated with chemoresistance, including cancer stem cell
survival, multidrug resistance gene activation and protein kinase C
(9,10,35).
In the present study, it was revealed that MSCs in patients with
ICC exhibited high expression levels of HVEM, and
HVEM-overexpressing MSCs induced chemoresistance in
cholangiocarcinoma cells through production of IL-6, which promoted
the activation of autophagy by regulating the AMPK/mTOR signaling
pathway.
HVEM is a member of the tumor necrosis factor
receptor superfamily and is also a co-stimulatory molecule that
mediates the invasion of herpes simplex virus 1 into Chinese
hamster ovary cells (36). HVEM is
mostly expressed in primary T cells, NK cells, B cells and
monocytes, and also in non-immune cells such as hepatocytes,
intestinal epithelial cells and smooth muscle cells (37,38).
Other studies have demonstrated that HVEM is also expressed on the
surface of stromal cells and dendritic cells (39,40).
However, to the best of our knowledge, there is currently little
research that focuses on the effect of HVEM on MSCs. In the present
study, HVEM was revealed to be expressed at a high level in MSCs
that were isolated from patients with ICC. Furthermore, HVEM-MSCs
could support cholangiocarcinoma cell survival and inhibited
apoptosis following treatment with chemotherapy drugs. Further
investigation revealed that HVEM could promote IL-6 secretion,
which is the key cytokine involved in promoting cholangiocarcinoma
cell chemoresistance (41).
Previous studies have suggested that the expression level of IL-6
is increased in numerous different types of cancer, including ICC,
and serum IL-6 levels are associated with poor prognosis in ICC
cases (41–43).
Autophagy is an adaptive response of cells to
exogenous stimuli. Autophagy acts as a housekeeping mechanism for
cells to maintain a stable state, regulating longevity proteins and
renewing peroxide enzymes, mitochondria and the endoplasmic
reticulum (44). Autophagy can also
act as a defense mechanism to remove damaged organelles and
metabolites in the cytoplasm, reconstitute balance of the cytoplasm
at the subcellular level, and protect damaged cells (45). In the present study, it was revealed
that IL-6 at 10 ng/ml could effectively promote autophagy and then
induce chemotherapy resistance; this concentration of IL-6 was
consistent with other studies (46–48).
The present study revealed that, following IL-6 treatment,
autophagy was activated and played a key role in the
chemoresistance of cholangiocarcinoma cells. It was also
demonstrated that the AMPK/mTOR signaling pathway was activated.
Autophagy and chemoresistance of cholangiocarcinoma cells induced
by IL-6 was weakened when the AMPK/mTOR signaling pathway was
blocked. Thus, the AMPK/mTOR signaling pathway contributed to the
activation of autophagy. Finally, the present study also verified
the association between autophagy and poor prognosis of patients
with ICC. Therefore, it can be concluded that MSCs in ICC could
overexpress HVEM and secrete high levels of IL-6. Then,
IL-6-induced AMPK/mTOR signaling pathway-dependent autophagy
supported cholangiocarcinoma cell survival and antitoxic ability.
The data attained in the present study can provide new indicators
for predicting the prognosis of patients with ICC, and provide
potential new targets for treatment.
The present study has some limitations. First, in
vitro experiments are insufficient to fully confirm the
findings of this study, and it is necessary to further design in
vivo experiments to verify the findings. Second, in mesenchymal
stem cells, the mechanism of how HVEM induces the increase of IL-6
expression requires further study. Finally, due to the small number
of clinical samples included in this study, selection bias may
exist in the study design, and the sample size requires further
expansion.
Supplementary Material
Supporting Data
Acknowledgements
Not applicable.
Funding
The present study was supported by the Foundation of
Shanghai Municipal Health Commission (grant no. 2018BR34), the
Natural Science Foundation of Shanghai (grant no. 16ZR1400100) and
the Medical Guidance Foundation of Shanghai (grant no.
16411966200).
Availability of data and materials
The datasets used and analyzed during the current
study are available from the corresponding author on reasonable
request.
Authors' contributions
LG, HS and XL performed the research, analyzed data,
and participated in the writing of the study. ZH, YJ and XY
analyzed the data and also wrote this study. YX conceived this
study, provided funding. MW provided many valuable suggestions and
helped the authors to complete the supplementary experiments. All
authors read and approved the manuscript and agree to be
accountable for all aspects of the research in ensuring that the
accuracy or integrity of any part of the work are appropriately
investigated and resolved.
Ethics approval and consent to
participate
Ethics approval was obtained from Institutional
Ethics Committee of the Eastern Hepatobiliary Surgery Hospital
(Shanghai, China), and written informed consent was obtained from
each patient.
Patient consent for publication
Not applicable.
Competing interests
The authors declare that they have no competing
interests.
References
|
1
|
Aljiffry M, Abdulelah A, Walsh M,
Peltekian K, Alwayn I and Molinari M: Evidence-based approach to
cholangiocarcinoma: A systematic review of the current literature.
J Am Coll Surg. 208:134–147. 2009. View Article : Google Scholar
|
|
2
|
Shaib YH, Davila JA, McGlynn K and
El-Serag HB: Rising incidence of intrahepatic cholangiocarcinoma in
the United States: A true increase? J Hepatol. 40:472–477. 2004.
View Article : Google Scholar
|
|
3
|
Florio AA, Ferlay J, Znaor A, Ruggieri D,
Alvarez CS, Laversanne M, Bray F, McGlynn KA and Petrick JL: Global
trends in intrahepatic and extrahepatic cholangiocarcinoma
incidence from 1993 to 2012. Cancer. 126:2666–2678. 2020.
View Article : Google Scholar
|
|
4
|
Bertuccio P, Malvezzi M, Carioli G, Hashim
D, Boffetta P, El-Serag HB, La Vecchia C and Negri E: Global trends
in mortality from intrahepatic and extrahepatic cholangiocarcinoma.
J Hepatol. 71:104–114. 2019. View Article : Google Scholar
|
|
5
|
Roayaie S, Guarrera JV, Ye MQ, Thung SN,
Emre S, Fishbein TM, Guy SR, Sheiner PA, Miller CM and Schwartz ME:
Aggressive surgical treatment of intrahepatic cholangiocarcinoma:
Predictors of outcomes. J Am Coll Surg. 187:365–372. 1998.
View Article : Google Scholar
|
|
6
|
Endo I, Gonen M, Yopp AC, Dalal KM, Zhou
Q, Klimstra D, D'Angelica M, DeMatteo RP, Fong Y, Schwartz L, et
al: Intrahepatic cholangiocarcinoma: Rising frequency, improved
survival, and determinants of outcome after resection. Ann Surg.
248:84–96. 2008. View Article : Google Scholar
|
|
7
|
Massani M, Nistri C, Ruffolo C, Bonariol
R, Pauletti B, Bonariol L, Caratozzolo E, Morana G and Bassi N:
Intrahepatic chemotherapy for unresectable cholangiocarcinoma:
Review of literature and personal experience. Updates Surg.
67:389–400. 2015. View Article : Google Scholar
|
|
8
|
Bridgewater J, Galle PR, Khan SA, Llovet
JM, Park JW, Patel T, Pawlik TM and Gores GJ: Guidelines for the
diagnosis and management of intrahepatic cholangiocarcinoma. J
Hepatol. 60:1268–1289. 2014. View Article : Google Scholar
|
|
9
|
Ho CT, Shang HS, Chang JB, Liu JJ and Liu
TZ: Folate deficiency-triggered redox pathways confer drug
resistance in hepatocellular carcinoma. Oncotarget. 6:26104–26118.
2015. View Article : Google Scholar
|
|
10
|
Zhao LJ, Xu H, Qu JW, Zhao WZ, Zhao YB and
Wang JH: Modulation of drug resistance in ovarian cancer cells by
inhibition of protein kinase C-alpha (PKC-α) with small
interference RNA (siRNA) agents. Asian Pac J Cancer Prev.
13:3631–3636. 2012. View Article : Google Scholar
|
|
11
|
Balko JM, Cook RS, Vaught DB, Kuba MG,
Miller TW, Bhola NE, Sanders ME, Granja-Ingram NM, Smith JJ,
Meszoely IM, et al: Profiling of residual breast cancers after
neoadjuvant chemotherapy identifies DUSP4 deficiency as a mechanism
of drug resistance. Nat Med. 18:1052–1059. 2012. View Article : Google Scholar
|
|
12
|
Jia Q, Dong Q and Qin L: CCN: Core
regulatory proteins in the microenvironment that affect the
metastasis of hepatocellular carcinoma? Oncotarget. 7:1203–1214.
2016. View Article : Google Scholar
|
|
13
|
Wu SD, Ma YS, Fang Y, Liu LL, Fu D and
Shen XZ: Role of the microenvironment in hepatocellular carcinoma
development and progression. Cancer Treat Rev. 38:218–225. 2012.
View Article : Google Scholar
|
|
14
|
Hinshaw DC and Shevde LA: The tumor
microenvironment innately modulates cancer progression. Cancer Res.
79:4557–4566. 2019. View Article : Google Scholar
|
|
15
|
Uchibori R, Tsukahara T, Mizuguchi H, Saga
Y, Urabe M, Mizukami H, Kume A and Ozawa K: NF-κB activity
regulates mesenchymal stem cell accumulation at tumor sites. Cancer
Res. 73:364–372. 2013. View Article : Google Scholar
|
|
16
|
Ljujic B, Milovanovic M, Volarevic V,
Murray B, Bugarski D, Przyborski S, Arsenijevic N, Lukic ML and
Stojkovic M: Human mesenchymal stem cells creating an
immunosuppressive environment and promote breast cancer in mice.
Sci Rep. 3:22982013. View Article : Google Scholar
|
|
17
|
Kim JA, Shim JS, Lee GY, Yim HW, Kim TM,
Kim M, Leem SH, Lee JW, Min CK and Oh IH: Microenvironmental
remodeling as a parameter and prognostic factor of heterogeneous
leukemogenesis in acute myelogenous leukemia. Cancer Res.
75:2222–2231. 2015. View Article : Google Scholar
|
|
18
|
He W, Liang B, Wang C, Li S, Zhao Y, Huang
Q, Liu Z, Yao Z, Wu Q, Liao W, et al: MSC-regulated lncRNA
MACC1-AS1 promotes stemness and chemoresistance through fatty acid
oxidation in gastric cancer. Oncogene. 38:4637–4654. 2019.
View Article : Google Scholar
|
|
19
|
Gu ZW, He YF, Wang WJ, Tian Q and Di W:
miR-1180 from bone marrow-derived mesenchymal stem cells induces
glycolysis and chemoresistance in ovarian cancer cells by
upregulating the Wnt signaling pathway. J Zhejiang Univ Sci B.
20:219–237. 2019. View Article : Google Scholar
|
|
20
|
Han Z, Jing Y, Xia Y, Zhang S, Hou J, Meng
Y, Yu F, Liu X, Wu M, Zhang P, et al: Mesenchymal stem cells
contribute to the chemoresistance of hepatocellular carcinoma cells
in inflammatory environment by inducing autophagy. Cell Biosci.
4:222014. View Article : Google Scholar
|
|
21
|
Haga H, Yan IK, Takahashi K, Wood J,
Zubair A and Patel T: Tumour cell-derived extracellular vesicles
interact with mesenchymal stem cells to modulate the
microenvironment and enhance cholangiocarcinoma growth. J Extracell
Vesicles. 4:249002015. View Article : Google Scholar
|
|
22
|
Liu J, Han G, Liu H and Qin C: Suppression
of cholangiocarcinoma cell growth by human umbilical cord
mesenchymal stem cells: A possible role of Wnt and Akt signaling.
PLoS One. 8:e628442013. View Article : Google Scholar
|
|
23
|
Livak KJ and Schmittgen TD: Analysis of
relative gene expression data using real-time quantitative PCR and
the 2(-Delta Delta C(T)) Method. Methods. 25:402–408. 2001.
View Article : Google Scholar
|
|
24
|
Konno R, Yamakawa H, Utsunomiya H, Ito K,
Sato S and Yajima A: Expression of survivin and Bcl-2 in the normal
human endometrium. Mol Hum Reprod. 6:529–534. 2000. View Article : Google Scholar
|
|
25
|
Gang EJ, Bosnakovski D, Figueiredo CA,
Visser JW and Perlingeiro RC: SSEA-4 identifies mesenchymal stem
cells from bone marrow. Blood. 109:1743–1751. 2007. View Article : Google Scholar
|
|
26
|
Rasini V, Dominici M, Kluba T, Siegel G,
Lusenti G, Northoff H, Horwitz EM and Schäfer R: Mesenchymal
stromal/stem cells markers in the human bone marrow. Cytotherapy.
15:292–306. 2013. View Article : Google Scholar
|
|
27
|
Tang Q, Wang Q, Zhang Q, Lin SY, Zhu Y,
Yang X and Guo AY: Gene expression, regulation of DEN and HBx
induced HCC mice models and comparisons of tumor, para-tumor and
normal tissues. BMC Cancer. 17:8622017. View Article : Google Scholar
|
|
28
|
Critelli R, Milosa F, Faillaci F, Condello
R, Turola E, Marzi L, Lei B, Dituri F, Andreani S, Sighinolfi P, et
al: Microenvironment inflammatory infiltrate drives growth speed
and outcome of hepatocellular carcinoma: A prospective clinical
study. Cell Death Dis. 8:e30172017. View Article : Google Scholar
|
|
29
|
Alshareeda AT, Sakaguchi K, Abumaree M,
Mohd Zin NK, Shimizu T and Zoran IJPO: The potential of cell sheet
technique on the development of hepatocellular carcinoma in rat
models. PLoS One. 12:e01840042017. View Article : Google Scholar
|
|
30
|
Jiang S, Chang H, Deng S and Fan D:
Icariin enhances the chemosensitivity of cisplatin resistant
ovarian cancer cells by suppressing autophagy via activation of the
AKT/mTOR/ATG5 pathway. Int J Oncol. 54:1933–1942. 2019.
|
|
31
|
Huang S, Qi P, Zhang T, Li F and He X: The
HIF- 1α/miR-224-3p/ATG5 axis affects cell mobility and
chemosensitivity by regulating hypoxia induced protective autophagy
in glioblastoma and astrocytoma. Oncol Rep. 41:1759–1768. 2019.
|
|
32
|
White E, Mehnert JM and Chan CS:
Autophagy, Metabolism, and Cancer. Clin Cancer Res. 21:5037–5046.
2015. View Article : Google Scholar
|
|
33
|
He J, Ding J, Lai Q, Wang X, Li A and Liu
S: Irbesartan ameliorates lipid deposition by enhancing autophagy
via PKC/AMPK/ULK1 axis in free fatty acid induced hepatocytes.
Front Physiol. 10:6812019. View Article : Google Scholar
|
|
34
|
Chen X, Li C, Chen Y, Ni C, Chen X, Zhang
L, Xu X, Chen M, Ma X, Zhan H, et al: Aflatoxin B1 impairs leydig
cells through inhibiting AMPK/mTOR-mediated autophagy flux pathway.
Chemosphere. 233:261–272. 2019. View Article : Google Scholar
|
|
35
|
Zhang J, Yuan B, Zhang H and Li H: Human
epithelial ovarian cancer cells expressing CD105, CD44 and CD106
surface markers exhibit increased invasive capacity and drug
resistance. Oncol Lett. 17:5351–5360. 2019.
|
|
36
|
Nicola AV, Ponce de Leon M, Xu R, Hou W,
Whitbeck JC, Krummenacher C, Montgomery RI, Spear PG, Eisenberg RJ
and Cohen GH: Monoclonal antibodies to distinct sites on herpes
simplex virus (HSV) glycoprotein D block HSV binding to HVEM. J
Virol. 72:3595–3601. 1998. View Article : Google Scholar
|
|
37
|
Wahl C, Wegenka UM, Leithäuser F,
Schirmbeck R and Reimann J: IL-22-dependent attenuation of T
cell-dependent (ConA) hepatitis in herpes virus entry mediator
deficiency. J Immunol. 182:4521–4528. 2009. View Article : Google Scholar
|
|
38
|
Xu H, Cao D, Guo G, Ruan Z, Wu Y and Chen
Y: The intrahepatic expression and distribution of BTLA and its
ligand HVEM in patients with HBV-related acute-on-chronic liver
failure. Diagn Pathol. 7:1422012. View Article : Google Scholar
|
|
39
|
Yu P and Fu YX: Targeting tumors with
LIGHT to generate metastasis-clearing immunity. Cytokine Growth
Factor Rev. 19:285–294. 2008. View Article : Google Scholar
|
|
40
|
Klionsky DJ and Ohsumi Y: Vacuolar import
of proteins and organelles from the cytoplasm. Annu Rev Cell Dev
Biol. 15:1–32. 1999. View Article : Google Scholar
|
|
41
|
Isomoto H, Mott JL, Kobayashi S, Werneburg
NW, Bronk SF, Haan S and Gores GJ: Sustained IL-6/STAT-3 signaling
in cholangiocarcinoma cells due to SOCS-3 epigenetic silencing.
Gastroenterology. 132:384–396. 2007. View Article : Google Scholar
|
|
42
|
Meng F, Yamagiwa Y, Ueno Y and Patel T:
Over-expression of interleukin-6 enhances cell survival and
transformed cell growth in human malignant cholangiocytes. J
Hepatol. 44:1055–1065. 2006. View Article : Google Scholar
|
|
43
|
Asukai K, Kawamoto K, Eguchi H, Konno M,
Nishida N, Koseki J, Noguchi K, Hasegawa S, Ogawa H, Yamada D, et
al: Prognostic impact of peritumoral IL-17-positive cells and IL-17
axis in patients with intrahepatic cholangiocarcinoma. Ann Surg
Oncol. 22 (Suppl 3):S1524–S1531. 2015. View Article : Google Scholar
|
|
44
|
Burman C and Ktistakis NT: Autophagosome
formation in mammalian cells. Semin Immunopathol. 32:397–413. 2010.
View Article : Google Scholar
|
|
45
|
Komatsu M and Ichimura Y: Selective
autophagy regulates various cellular functions. Genes Cells.
15:923–933. 2010. View Article : Google Scholar
|
|
46
|
Pei X, Li Y, Zhu L and Zhou Z:
Astrocyte-derived exosomes suppress autophagy and ameliorate
neuronal damage in experimental ischemic stroke. Exp Cell Res.
382:1114742019. View Article : Google Scholar
|
|
47
|
Shi W, Ma H, Liu T, Yan D, Luo P, Zhai M,
Tao J, Huo S, Guo J, Li C, et al: Inhibition of
Interleukin-6/glycoprotein 130 signalling by Bazedoxifene
ameliorates cardiac remodelling in pressure overload mice. J Cell
Mol Med. 24:4748–4761. 2020. View Article : Google Scholar
|
|
48
|
Lu H, Han M, Yuan X, Tursun K, Zhang Y, Li
Y, Li Z, Feng S, Zhou L, Pan Z, et al: Role of IL-6-mediated
expression of NS5ATP9 in autophagy of liver cancer cells. J Cell
Physiol. 233:9312–9319. 2018. View Article : Google Scholar
|