Introduction
Gastric cancer (GC) is one of the most common types
of malignancy, more than one million cases are diagnosed each year
worldwide and survival rate decreases as cancer progresses
(1,2).
Many patients with GC are diagnosed at an advanced stage because GC
is initially asymptomatic and biomarkers are lacking (2). Therefore, the identification of
biomarkers for early-stage detection and prediction of prognosis
may improve the efficacy of GC treatment strategies (3).
Gastric carcinogenesis is a multistep process that
arises from superficial gastritis and progresses to chronic
atrophic gastritis, intestinal metaplasia (IM), dysplasia and
carcinoma (4). Similar to other types
of cancer, gastric carcinogenesis exhibits a multifactorial
etiology involving environmental, genetic and epigenetic
components. Among epigenetic alterations, there has been interest
in hypermethylation/repression of tumor-suppressor genes (5). Moreover, it is hypothesized that DNA
hypomethylation promotes cancer development via activation of
proto-oncogenes (6), although
examples of this are lacking. However, advances in global
methylation profiling suggest that aberrant promoter
hypomethylation is a frequent event in hematological malignancies,
such as chronic lymphocytic leukemia (7).
Our previous study (8)
used genome-wide reduced representation bisulfite sequencing (RRBS)
and methyl-CpG binding domain sequencing of GC specimens and found
that gastrointestinal hormone receptor genes in a neuroactive
ligand-receptor interaction pathway are predominantly
hypermethylated in GC. STK31 serves a role in
spermatogenesis in human testes (9–12).
STK31 expression is normally restricted to the testis, yet
it is frequently overexpressed not only in colorectal and
esophageal cancer but also in GC; it is therefore referred to as a
cancer/testis antigen gene (13),
which include MAGE-A1 and MAGE-A3. Moreover, a
previous study (14) suggested that
aberrant expression of STK31 contributes to tumorigenicity
in somatic cancer cells, and thus STK31 and STK31 may be
potential therapeutic targets in human somatic cancer. In
colorectal cancer, for example, STK31 expression can be
reactivated by treating diseased tissue with 5-aza-2-deoxycytidine
(5-aza-dC) (13). The kinase domain
of STK31 regulates tumorigenicity via control of differentiation
state, suggesting that STK31 may be regulated by an
epigenetic mechanism (15). However,
the role of STK31 in GC and the mechanism by which
STK31 transcription is controlled in GC is not clear.
The aim of the present study was to determine
whether the regulation of STK31 expression is associated
with chromatin remodeling, including DNA methylation and histone
modification at the promoter region, and to elucidate the role of
STK3 in gastric carcinogenesis. In order to reveal the
epigenetic alteration in IM and/or GC, methylome data of the RRBS
and 450K HumanMethylation BeadChip data and publicly available
genome-wide histone modification data were used. In order to
identify the role of STK31 in GC cells, in vitro
experiments, such as proliferation, colony forming and migration
assays in stable GC cells, and in vivo experiments with
xenograft mice were performed. Moreover, patients for which
STK31 was upregulated were investigated for survival times
in a combined cohort. These results may provide insight into the
role of for STK31 in the development of GC and as a
potential therapeutic and prognostic target for patients with
GC.
Materials and methods
Cell lines and tissue samples
A total of 16 GC cell lines, namely SNU001, SNU005,
SNU016, SNU216, SNU484, SNU520, SNU601, SNU620, SNU638, SNU668,
SNU719, AGS, KATOIII, MKN01, MKN45 and MKN74, were obtained from
the Korean Cell Line Bank (cellbank.snu.ac.kr/main/index.html) and cultured in
RPMI-1640 medium (Welgene, Inc.) supplemented with 10% fetal bovine
serum and 1% antibiotic-antimycotic solution (Invitrogen; Thermo
Fisher Scientific, Inc.) at 37°C in a humidified 5% CO2
incubator. All experiments were performed with mycoplasma-free
cells and all GC cell lines were authenticated using short tandem
repeat profiling within the past 3 years. A total of 145 frozen
tumor and paired adjacent non-tumor tissue samples were obtained
from the Chungnam National University Hospital (CNUH; Daejeon,
South Korea), a member of the Korea Biobank Network. The samples
included 31 stage I, 30 stage II, 46 stage III and 38 stage IV
tumors from 50 females and 95 males, aged 23–83 years (average age,
59 years). All samples were obtained with informed consent and
their use was approved by the Internal Review Board of CNUH
(approval no. CNUH 2018-01-056).
Bisulfite sequencing
Bisulfite sequencing was performed on two different
regions proximal to the STK31 promoter. Two sets of PCR
primer were designed using Methprimer (urogene.org/cgi-bin/methprimer/methprimer.cgi):
Region 1, forward, 5′-TCTAGAAAATGCAAACTAATATATGGTGAC-3′ and
reverse, 5′-GAAAGGAACTGGCCCTAGACCCCAC-3′ to yield a 581-bp product
containing 9 CpG sites and Region 2, forward,
5′-GAAAGGAATTGGTTTTAGATTTTAT-3′ and reverse,
5′-TCTAACACCCCTCTAAAATAAC-3′ to yield a 468-bp product containing
36 CpG sites. Genomic DNA (2 µg) from GC cells or tissue was
modified by sodium bisulfite using an EZ DNA methylation kit (Zymo
Research Corp.). Bisulfite-modified DNA (1 µl) was amplified in a
20 µl volume using 2X Dye Mix polymerase (Enzynomics Co., Ltd.) and
the aforementioned primers. Samples were heated to 95°C for 10 min
and amplified for 40 cycles of 95°C for 45 sec, 60°C for 45 sec and
72°C for 60 sec, then incubated at 72°C for 10 min and cooled to
4°C. The PCR products were visualized on a 1% agarose gel by
ethidium bromide staining, purified from the gel using a Qiagen Gel
Extraction kit (Qiagen, Inc.) and cloned using the pGEM-T Easy
Vector (Promega Corporation). A total of ten clones were randomly
chosen for sequencing. Complete bisulfite conversion was assured
when <0.01% of cytosines in non-CG dinucleotides in the final
sequence had not converted.
Reverse transcription-quantitative
(RT-q)PCR
Total RNA was extracted from GC cells or tissue
using the RNeasy plus mini kit (Qiagen), treated with DNase I
(Promega Corporation), and reverse-transcribed with Superscript II
reverse transcriptase (Invitrogen; Thermo Fisher Scientific, Inc.).
RT-qPCR for STK31 was performed with a CFX96 Real-Time PCR
Detection system (Bio-Rad Laboratories, Inc.) using the following
thermocycling conditions: 94°C for 5 min, followed by 35 cycles of
94°C for 30 sec, 64°C for 30 sec and 72°C for 30 sec, with a final
step of 72°C for 7 min. β-actin served as the PCR control.
The PCR products were analyzed on 1.5% agarose gels stained with
ethidium bromide. The primer sequences for RT-qPCR were as follows:
STK31 forward, 5′-AACCTGCTTCTCCAGGTTCA-3′ and reverse,
5′-ATTGCTCCTTTGGCATCAAG-3′ to yield a 228-bp product and
β-actin forward, 5′-CAAGAGATGGCCACGGCTGCT-3′ and reverse,
5′-TCCTTCTGCATCCTGTCGGCA-3′ to yield a 275-bp product. RT-qPCR for
STK31 was performed using a C1000 Thermal Cycler (Bio-Rad
Laboratories, Inc.). cDNA (100 ng) was amplified as aforementioned
for 45 cycles with 2X SYBR-Green Supermix (Bio-Rad Laboratories,
Inc.). β-actin was used as a control. The relative amount of
target mRNA was quantified using comparative threshold cycle (Cq)
method (16).
Pyrosequencing
Two CpG sites, namely CpG#23 and #24, in Region 2
were selected for quantification of the extent of methylation.
Bisulfite-modified DNA (100 ng) was amplified by PCR in a 20 µl
reaction using 2X Dye Mix polymerase (Enzynomics Co., Ltd.) to
yield a 221-bp product using the following primers: Forward,
5′-TGTTTGGGGGTAGGTAGTAGTTAG-3 and reverse,
5′-CCCTAAACCCACATACTAAACTTTC-3′. PCR was performed using an initial
melting step of 94°C for 5 min, followed by 40 cycles of 94°C for
30 sec, 59°C for 30 sec and 72°C for 30 sec, with a final
incubation at 72°C for 7 min. Pyrosequencing was performed as
previously described (17) using a
sequencing primer (5′-AGGAGTAGTGTGGGGTTT-3′) and PSQ HS 96A system
(Biotage AB).
Treatment with 5-aza-dC and
trichostatin A (TSA)
SNU638, SNU719 and MKN74 cells were maintained as
aforementioned. Cells were seeded in 100-mm dishes at a density of
1×10⁶ cells per dish, then treated with 10 µM DNA
methylation inhibitor 5-aza-dC (Sigma-Aldrich; Merck KGaA) every 24
h for 3 days and harvested. Another group of these cells at the
same cell density was treated with 0.5 µM histone deacetylase
inhibitor TSA (Sigma-Aldrich; Merck KGaA) for 3 days and harvested.
In order to test the combined effect of 5-aza-dC and TSA, cells
were treated with 10 µM 5-aza-dC every 24 h for 3 days and then
with 0.5 µM TSA for 1 day. After 2–5 days, cells were washed with
phosphate-buffered saline, and total RNA was extracted using an
RNeasy Mini kit (Qiagen, Inc.). All experiments were performed at
37°C. RT-qPCR for STK31 was performed as aforementioned. A
total of three independent experiments was performed.
Establishment of stable cell
lines
STK31-knockdown (KD) cells were established using
TRCN0000368917 and TRCN0000003276 (STK31_sh#1 and STK31_sh#4,
respectively; Sigma-Aldrich; Merck KGaA) targeting STK31 mRNA;
pLKO.1-puro (Sigma-Aldrich; Merck KGaA) was used as a control. For
lentivirus construction, 293T cells were obtained from Koram
Biotech Corp. and co-transfected with 2 µg MISSION Lentiviral
Packaging Mix and 2 µg control or STK31 short hairpin (sh) RNA
using a 2nd Generation lentiviral system and
Lipofectamine® 2000 (Invitrogen; Thermo Fisher
Scientific, Inc.). In order to establish STK31-expressing cell
lines, 2 µg full-length STK31 cDNA was cloned into vector
pCDH-CMV-MCS-EF1-Puro (System Biosciences, LLC). For lentivirus
construction, 293T cells were co-transfected using a 2nd generation
lentiviral system with 2 µg MISSION Lentiviral Packaging Mix plus
empty vector or STK31-expressing vector using Lipofectamine 2000.
After 48 and 72 h incubation at 37°C, 5% CO2,
supernatant containing the lentivirus was collected from 293T cells
and centrifuged at 250 × g for 2 min at room temperature, then
filtered and applied to target cells. For lentiviral infection,
cells (3×10⁵) for KD experiments or ectopic expression
were seeded onto 6-well culture plates before addition of viral
supernatant. After 72 h, the medium was changed to RPMI-1640 medium
containing 1 µg/ml puromycin (Sigma-Aldrich; Merck KGaA). After 2
weeks of puromycin selection, the change in expression levels was
confirmed by RT-qPCR (as aforementioned) and western blotting.
Western blotting
For protein extraction from GC cell lines, RIPA
lysis buffer (Invitrogen; Thermo Fisher Scientific, Inc.) with
protease inhibitor cocktail (Sigma-Aldrich; Merck KGaA) was used
and then concentration was quantified via Bradford Protein Assay
(Bio-Rad Laboratories, Inc.) Protein samples (50 µg/lane) were
loaded onto 10% acrylamide gel. Electrophoresis was performed using
a Bio-Rad Western Blotting system. (Bio-Rad Laboratories, Inc.)
Proteins were transferred to a polyvinylidene fluoride membrane
(Sigma-Aldrich; Merck KGaA) and blocked in 5% skimmed milk in
Tris-buffered saline (0.1% Tween-20) for 30 min at room
temperature. The membranes were incubated with primary antibodies
(1:1,000) at 4°C overnight. The antibodies were as follows:
Anti-STK31 (cat. no. ab155172; Abcam), anti-Caspase3 (cat. no.
9662; Cell Signaling Technology, Inc.), anti-PARP (cat. no. 9542;
Cell Signaling Technology, Inc.) and anti-Tubulin (cat. no. T5168;
Sigma-Aldrich; Merck KGaA), then Probed with mouse anti-rabbit IgG
conjugated with horseradish peroxidase (1:5,000; cat. no. sc-2357;
Santa Cruz Biotechnology, Inc.). Immunopositive bands were
visualized using an enhanced luminescence image analyzer LAS-4000
(FUJIFILM Wako Pure Chemical Corporation) and the intensity for
each band was estimated by Image J version 1 software (National
Institutes of Health).
Cell proliferation assay
For cell proliferation assays, 1×10³
cells were plated in a 96-well plate and proliferation was measured
with the EZ-Cytox Cell Viability Assay kit (Itsbio) using a
microplate reader (Molecular Devices, LLC) at 450 nm. For
colony-forming assays, 1×10³ cells were plated in a
6-well plate. RPMI-1640 Media (Welgene Inc.) were replaced every 3
days then cells were incubated at 37°C. After 2 weeks, colonies
were stained with crystal violet solution (0.5 crystal violet, 3.7
formaldehyde, 30.0% ethanol) for 2 h at room temperature, and the
number of viable cells was manually counted in each well. All
assays were performed in triplicate.
Cell migration assay
Transwell migration assays were performed in a
24-well Transwell chamber (Corning, Inc.) fitted with a
polycarbonate membrane (pore size, 8 mm). Cells were suspended in
100 µl serum-free RPMI-1640 medium (Welgene, Inc.), and
2×10⁴ cells were seeded in the upper chamber. The lower
chamber was filled with RPMI-1640 medium containing 10% fetal
bovine serum. After 16–24 h incubated at 37°C, migrated cells were
stained for 2 h at room temperature with 0.5% crystal violet
solution. A total of three independent fields of view were observed
using a fluorescence microscope (magnification, ×10) for each
membrane, and migrated cells were manually counted in each
field.
Cell cycle analysis
MKN1 cells were treated 0.05% trypsin for 3 min at
37°C and then harvested at a density of 2×10⁶ per ml.
Cells were washed with ice-cold PBS and fixed with 70% ethanol for
24 h at 4°C. Prior to analysis, cells were stained with 50 µg/ml
propidium iodide solution for 2 min at room temperature. Cell cycle
analysis was performed using a flow cytometer (FacsCalibur; BD
Biosciences) with blue laser 488 nm and FlowJo 10.7.1 and Cell
Quest Software (BD BioSciences).
Gap closure assay
Mobility of STK31-expressing MKN74 cells was
measured using gap closure assay (Ibidi Gmbh). Cell suspension at a
density of 1×10⁶ per ml in 70 µl volume were seeded in
Cultured-Inserts 2-well (diameter, 35 mm). Following incubation at
37°C for 24 h, the Culture-Insert was detached from the well using
forceps and filled with serum-free RPMI-1640 medium. Cell images
were captured after 24, 48, 72 and 96 h under a fluorescence
microscope (magnification, ×10). The area of gap closure in three
fields of view was calculated with ImageJ software (v.1.8.0;
National Institutes of Health).
Xenograft assay
A total of 10 female BALB/C nude mice (age, 4 weeks;
weight, 20±2 g) were purchased from Central Animal Laboratory
(Shizuoka, Japan) and maintained with regular mouse chow and water
at a constant temperature of 22±1°C and 50–60% humidity under a
12-h light/dark cycle and specific pathogen-free conditions for the
xenograft assay. Mice were anesthetized before injection using
isoflurane (3–4% oxygen) to minimize pain. After 1 week, parental
or STK31-expressing MKN74 cells (5×10⁶ cells per
mouse) were subcutaneously injected into nude mice. Mice were
monitored daily to check sickness and feed daily and to determine
weight loss >20% twice a week. Once palpable tumors devloped,
tumor size was measured using Vernier calipers and tumor volume was
calculated according to the following formula: Volume
(mm3)=width2 × length/2. All mice were
euthanized using 30–70% volume/min CO2 in chamber at day
53. The humane endpoints were when the largest tumor size exceeded
20 mm or feed intake or drinking water were affected due to
necrosis, infection or ulcer. None of the mice died before
endpoints of the study. Experiments using mouse were conducted
under the Institutional Animal Care and Use Committee-approved
protocols at KRIBB in accordance with institutional guidelines
(approval no. KRIBB-AEC-15102).
Public data
The 450K HumanMethylation BeadChip data (accession
number GSE103186) for 39 gastric mucosae and 76 IM tissue samples
from GC-free patients (18) were
downloaded to compare methylation status in the STK31
promoter. Gene expression and 450K HumanMethylation BeadChip data
for 230 primary GCs and 450K HumanMethylation BeadChip data for two
normal tissue samples (19) were
downloaded from The Cancer Genome Atlas (TCGA) portal (portal.gdc.cancer.gov/) and the National Center for
Biotechnology Information Gene Expression Omnibus (ncbi.nlm.nih.gov/geo/). Because methylation data for
normal tissue are limited in the TCGA database, additional data for
10 gastric mucosa samples were obtained public data [accession nos.
GSE50192 (n=4) and GSE31848 (n=6)] (20,21)
produced by the same platform. In order to assess the activation
status of the STK31 promoter in primary GCs, public data
(accession no. GSE51776) for histone modifications produced by
nano-scale chromatin immunoprecipitation-sequencing (Nano-ChIP-seq)
of paired GC and non-tumor tissue was downloaded (22). The downloaded sequence reads were
quality controlled using cut-adapt (v1.1) on a public site
(github.com/marcelm/cutadapt/).
Quality-control parameters were read for quality >30 (Phred
score), read length >20 bp and replicated level <40%. The
sequence reads were mapped with bowtie2 (v2.2.2) using default
parameters (m=1). Duplicate reads were removed using the picard
(v.2.18.14) markduplicates function. Unique reads were identified
by peak calling using macs2 (v.2.0.5) with default parameters. For
predicting patient outcomes, gene expression data (accession no.
GSE26253) for GC (n=432) in the Samsung Medical Center cohort (SMC)
(23) was downloaded from the Gene
Expression Omnibus database. The samples included 68 stage I, 167
stage II, 130 stage III and 66 stage IV tumors and one
non-information tumor, taken from 152 females and 280 males
(average age, 52 years). All samples were obtained with written
informed consent, and their use was approved by the Internal Review
Board of the SMC, Seoul, South Korea (approval no. SMC
2010-10-025).
Statistical analysis
A paired t-test was used to examine differences in
mRNA levels and methylation between paired gastric tumor and
adjacent non-tumor tissues. Values are expressed as the mean ± SD
of ≥3 independent repeats.. Correlations between SKT31
expression levels and CpG methylation was determined using
Pearson's correlation coefficient. For the comparison of multiple
groups of GC type from TCGA data, pairwise P-values were calculated
using the Wilcoxon rank-sum the Student's t-test, respectively, and
were corrected for multiple comparison by Bonferroni method (n=3).
For comparison of of STK31 mRNA levels in GC cells following
drug treatment, pairwise P-values were calculated using paired
Student's t-test and was corrected for multiple comparison by
Bonferroni method (n=3). For in vitro assays of STK31
expression levels in STK31-KD cells, pairwise P-values were
calculated using paired Student's t-test and were corrected for
multiple comparison by Bonferroni method (n=2). Kaplan-Meier
survival analysis with log-rank test was used to estimate the
difference in overall survival between STK31 high and low
expression groups in combined cohorts of CNUH and SMC. All
statistical analysis was performed using the R statistical
programming language (Version 4.0.2; r-project.org/).
Results
STK31 is an early-onset target for
hypomethylation in GC development
Our previous study (8)
identified 174 hypomethylated promoters in GC cells (91 GC-specific
and 83 early-onset) via methylome analysis with laser-capture
microdissected cells of a single patient with intestinal-type GC
(IGC). Early-onset hypomethylation was defined as a methylation
difference >2-fold in IM and GC compared with gastric mucosa
cells. STK31 was an early-onset hypomethylated targets
(Fig. 1B). RRBS data from the UCSC
Genome Browser (hg19) revealed that CpG methylation signatures
(purple vertical lines) at the STK31 promoter were
predominant in GM cells but mostly absent in IM and completely
absent in GC (Fig. 1B).
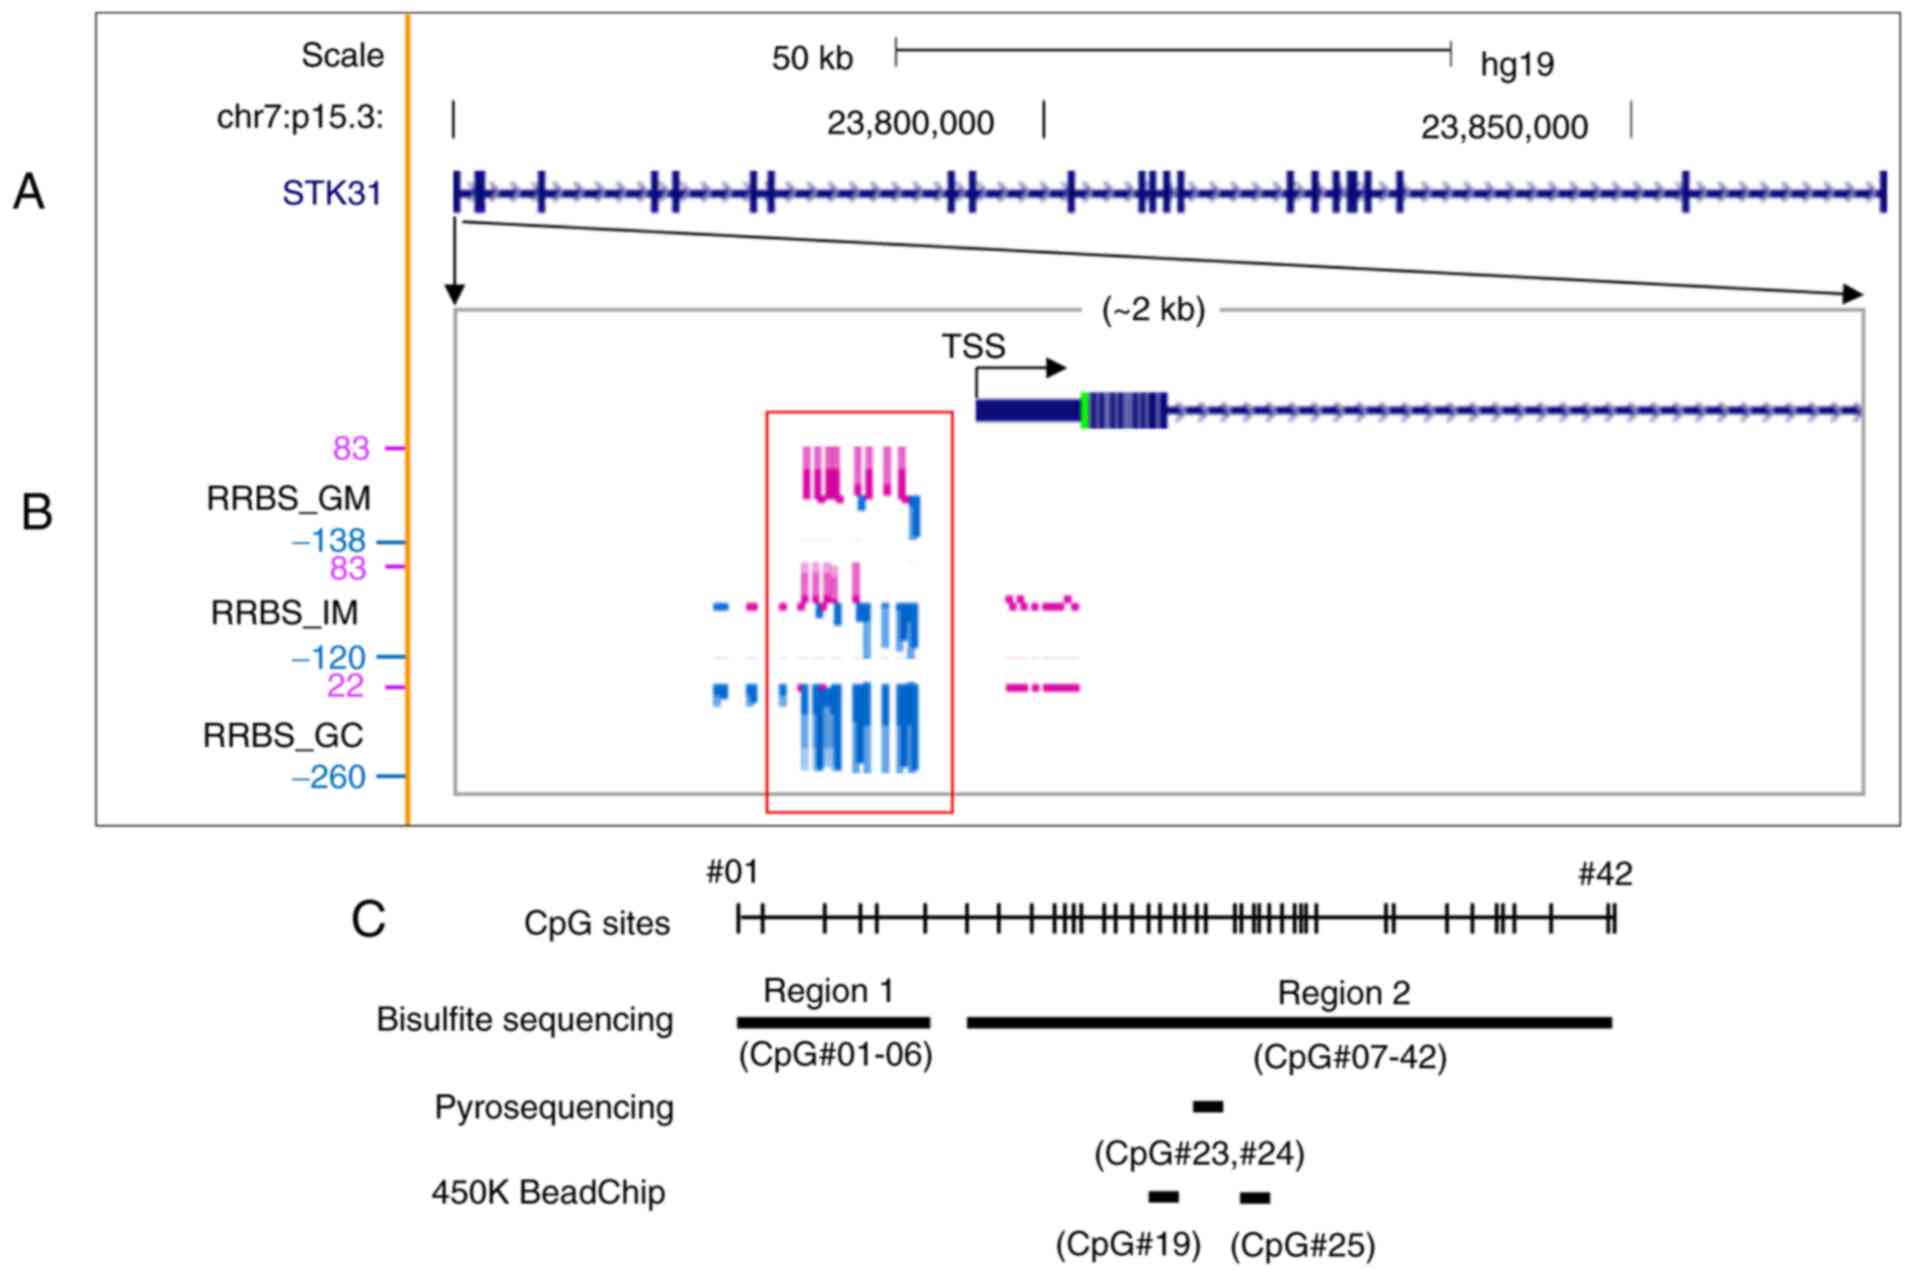 | Figure 1.Methylation profile of the
STK31 promoter in cells of a clinical tissue isolated by
laser capture microdissection. (A) Gene structure of STK31
on human chromosome 7p15.3. The map was modified from the UCSC
Genome Browser (hg19, genome.ucsc.edu). The distance from TSS to
transcription end site is ~122.4 kb. Thick black bars denote exons.
(B) RRBS methylome profiles in an enlargement of the STK31
promoter region (~2 kb) in paired GM, IM and GC cells by mirroring
the UCSC Genome Browser. The height of each vertical line indicates
methylation score for individual CpGs. Methylation and
non-methylation scores are displayed as purple and blue bars,
respectively. The red rectangle highlights differentially
methylated region in GM compared with IM or GC. (C) Strategy for
analysis. Bisulfite sequencing was performed for Regions 1 (6 CpGs,
−386 to −198 nucleotides from TSS) and 2 (39 CpGs, −171 to 249
nucleotides). Pyrosequencing was performed for CpG#23 (+54
nucleotidea from TSS) and #24 (+58 from TSS). Positions of CpG
probes CpG#19 (cg05000488, −46 from TSS) and CpG#25 (cg11755819,
+67 from TSS) are shown, proximal to the STK31 TSS from 450K
HumanMethylation BeadChip. STK, serine/threonine kinase; TSS,
transcription start site; RRBS, reduced representation bisulfite
sequencing; GM, gastric mucosa; IM, intestinal metaplasia; GC,
gastric cancer. |
CpG hypomethylation of the STK31
promoter is associated with STK31 upregulation in primary GC
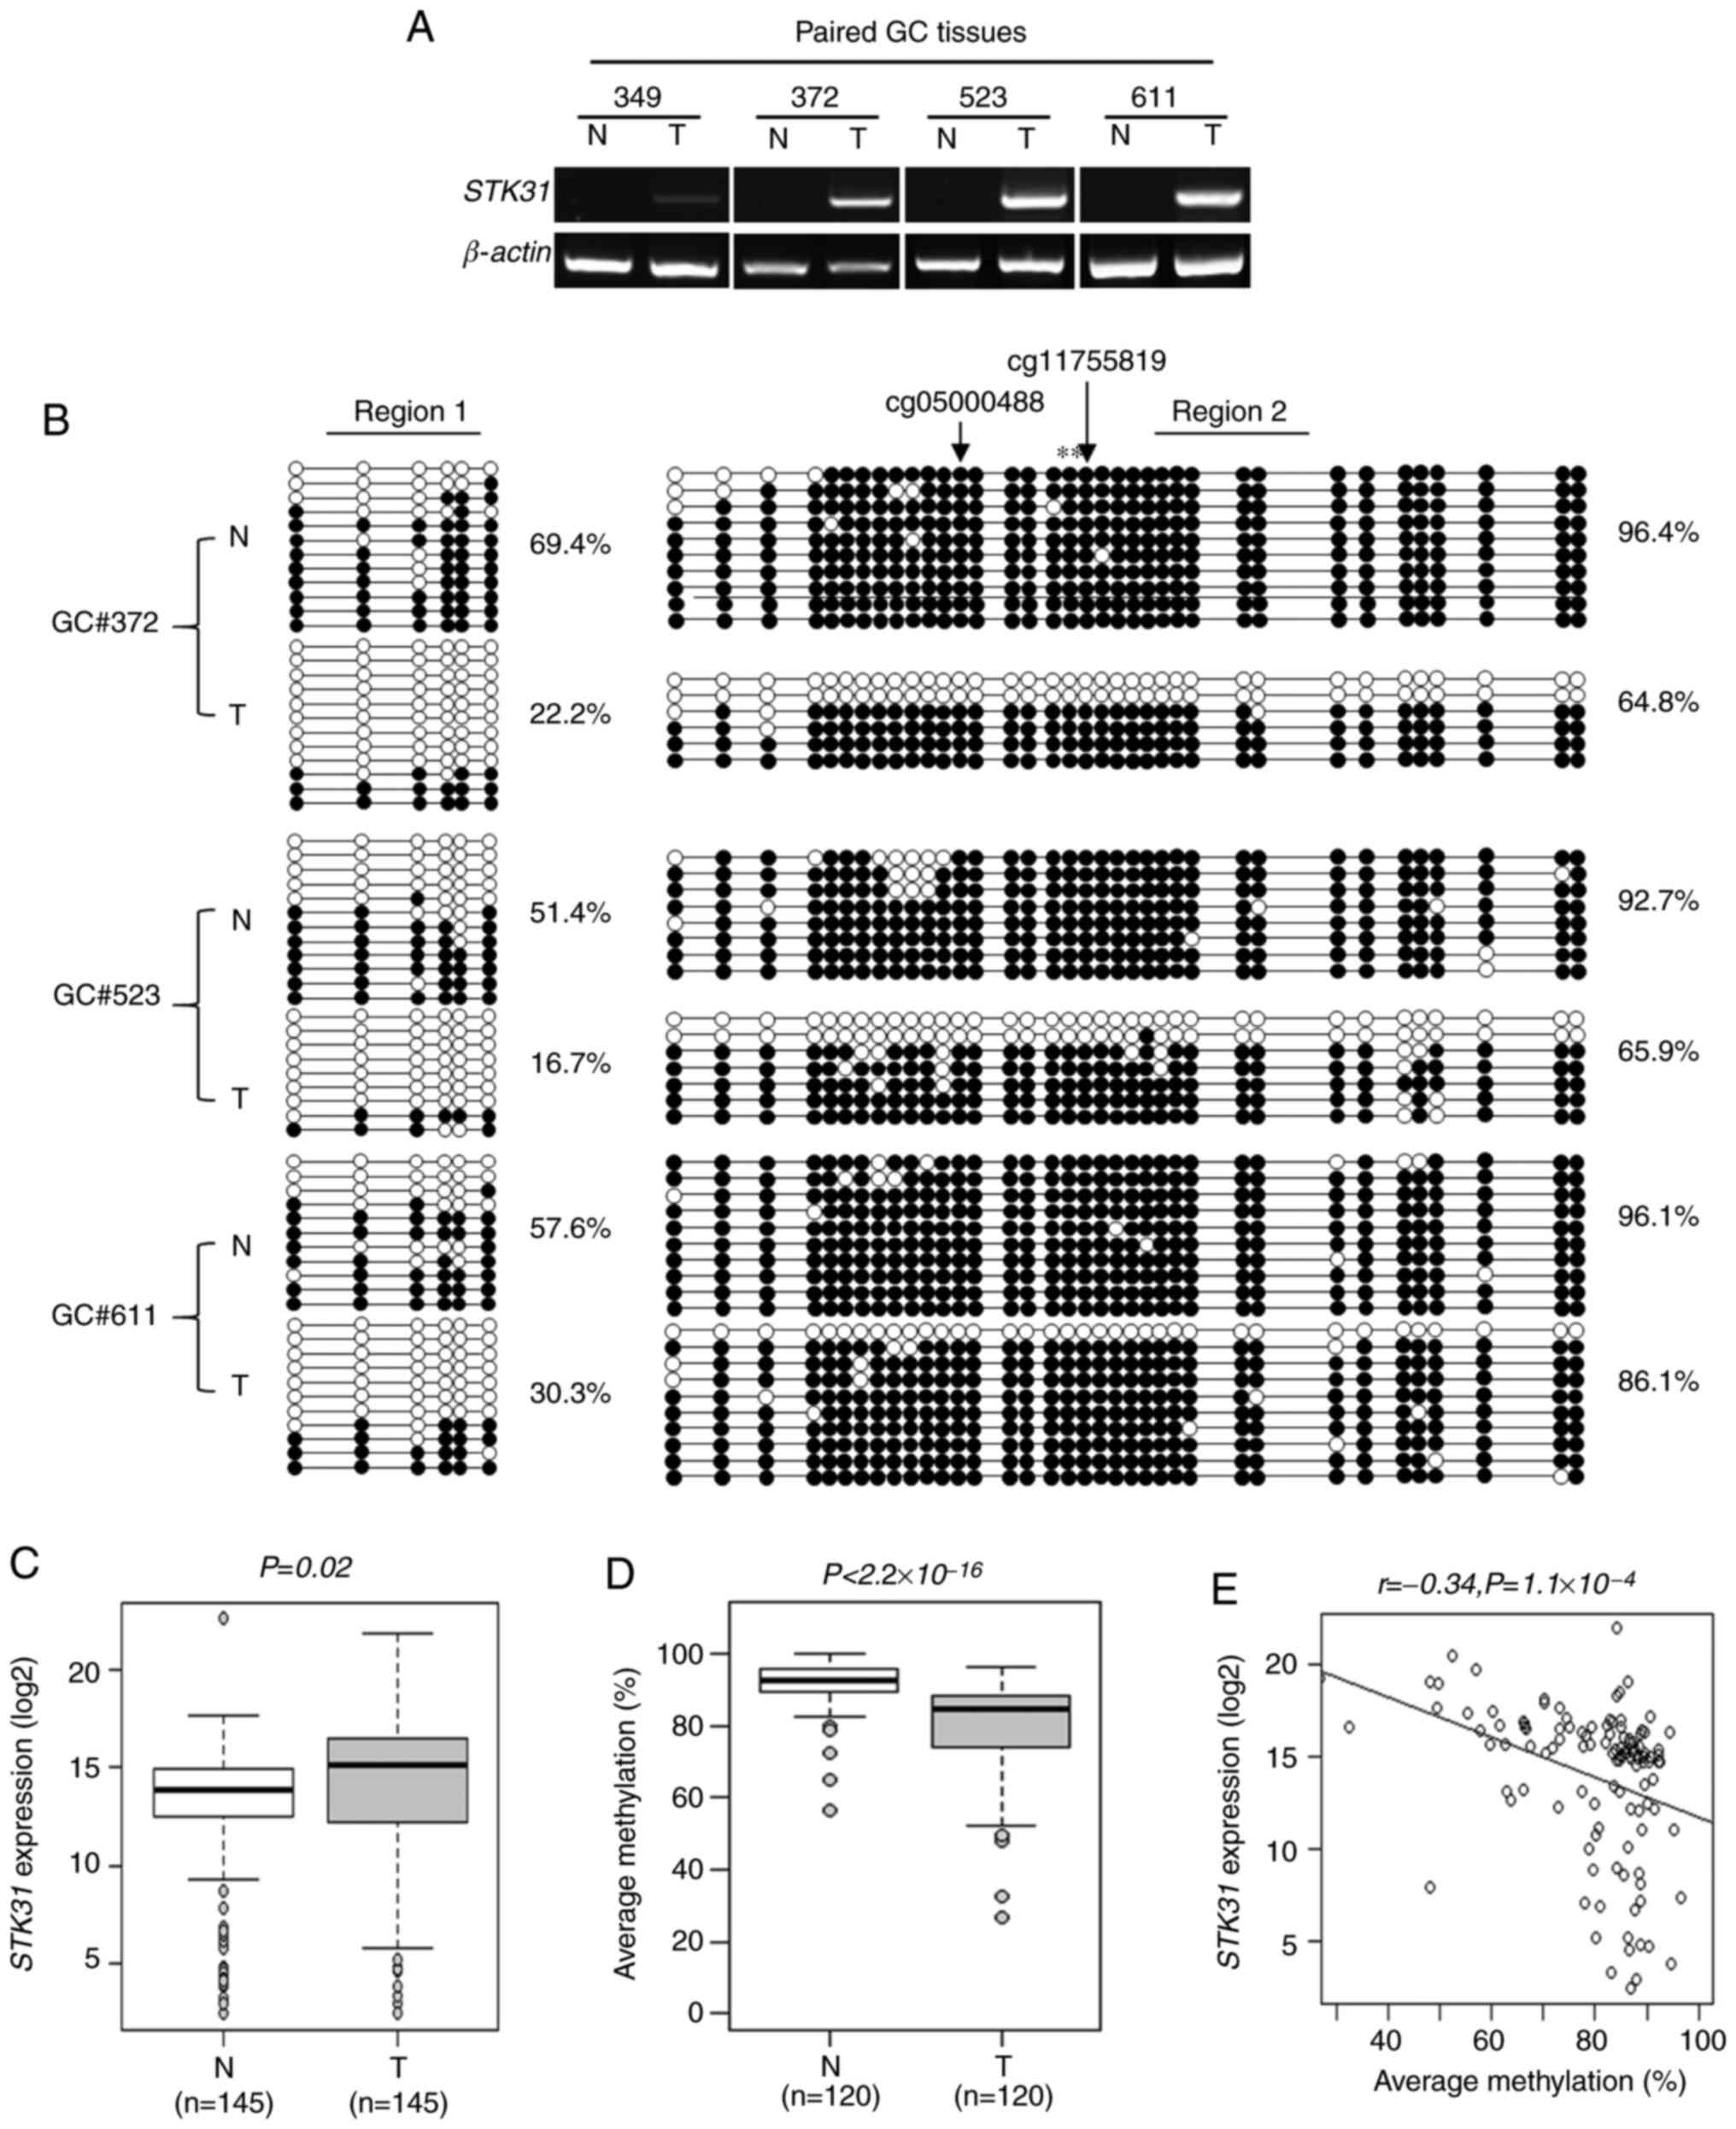
RT-qPCR analysis was performed with four paired
gastric tumor and adjacent non-tumor tissues, revealing that
STK31 was silenced in non-tumors but expressed in all tumor
samples tested (Fig. 2A). Bisulfite
sequencing analysis with three of four paired clinical tissues
revealed 51.4–69.4% methylation in Region 1 of non-tumors but
16.7–30.3% in paired tumors (Fig.
2B). For Region 2, the difference was also significant
(non-tumor, 92.7–96.4%; tumor, 64.8–86.1%; Fig. 2B), although not as large as for Region
1. These data suggested that STK31 expression levels in
tumors may be a consequence of CpG hypomethylation at the promoter
comprising Regions 1 and 2.
STK31 expression levels and promoter
methylation were analyzed using 145 paired clinical tissue samples
of the CNUH cohort. RT-qPCR analysis of STK31 revealed
significant upregulation in tumor (16.70±3.60%) compared with
non-tumor samples (13.29±5.49%; Fig.
2C; P=0.02). A a significant increase in expression was defined
as >2-fold with respect to the values for tumors compared with
paired non-tumors; increased STK31 expression was apparent
in approximately half (72/145) of tumors. Methylation at two CpG
sites, namely CpG#23 and #24, within Region 2 was quantified by
pyrosequencing (Fig. 1C) of 120
paired clinical tissues and compared with the corresponding RT-qPCR
data. Pyrosequencing of these two sites revealed 92.1±6.4%
methylation in non-tumors and 79.7±13.0% in tumors, the difference
for which was significant (Fig. 2D;
P<2.2×10⁻¹⁶). Finally, there was a negative
correlation between methylation at the two CpG sites and
STK31 expression in 120 matched tumors (Fig. 2E; r=−0.34; P=1.1×10⁻⁴).
From the public data for 450K HumanMethylation
BeadChip of the TCGA, methylation status between GC and non-tumors
at CpG sites proximal to the STK31 promoter was compared;
the promoter and upstream region were hypomethylated in primary GC,
whereas there was no difference in CpG methylation on the gene body
(Fig. 3A). For example, methylation
at cg05000488 within the STK31 promoter was significantly
decreased in GC, especially in IGC (Fig.
3B), whereas STK31 mRNA expression levels were
significantly increased in GC (Fig.
3C), revealing a negative correlation between CpG methylation
and STK31 mRNA expression levels (Fig. 3D). In addition, methylation status was
compared at the same CpG sites proximal to the STK31
promoter from the public data (GSE103186) for 450K BeadChip of
gastric mucosae and IM tissue from GC-free patients (17). Methylation at cg05000488 within the
STK31 promoter was significantly decreased in IM compared
with that in gastric mucosae (Fig.
3E).
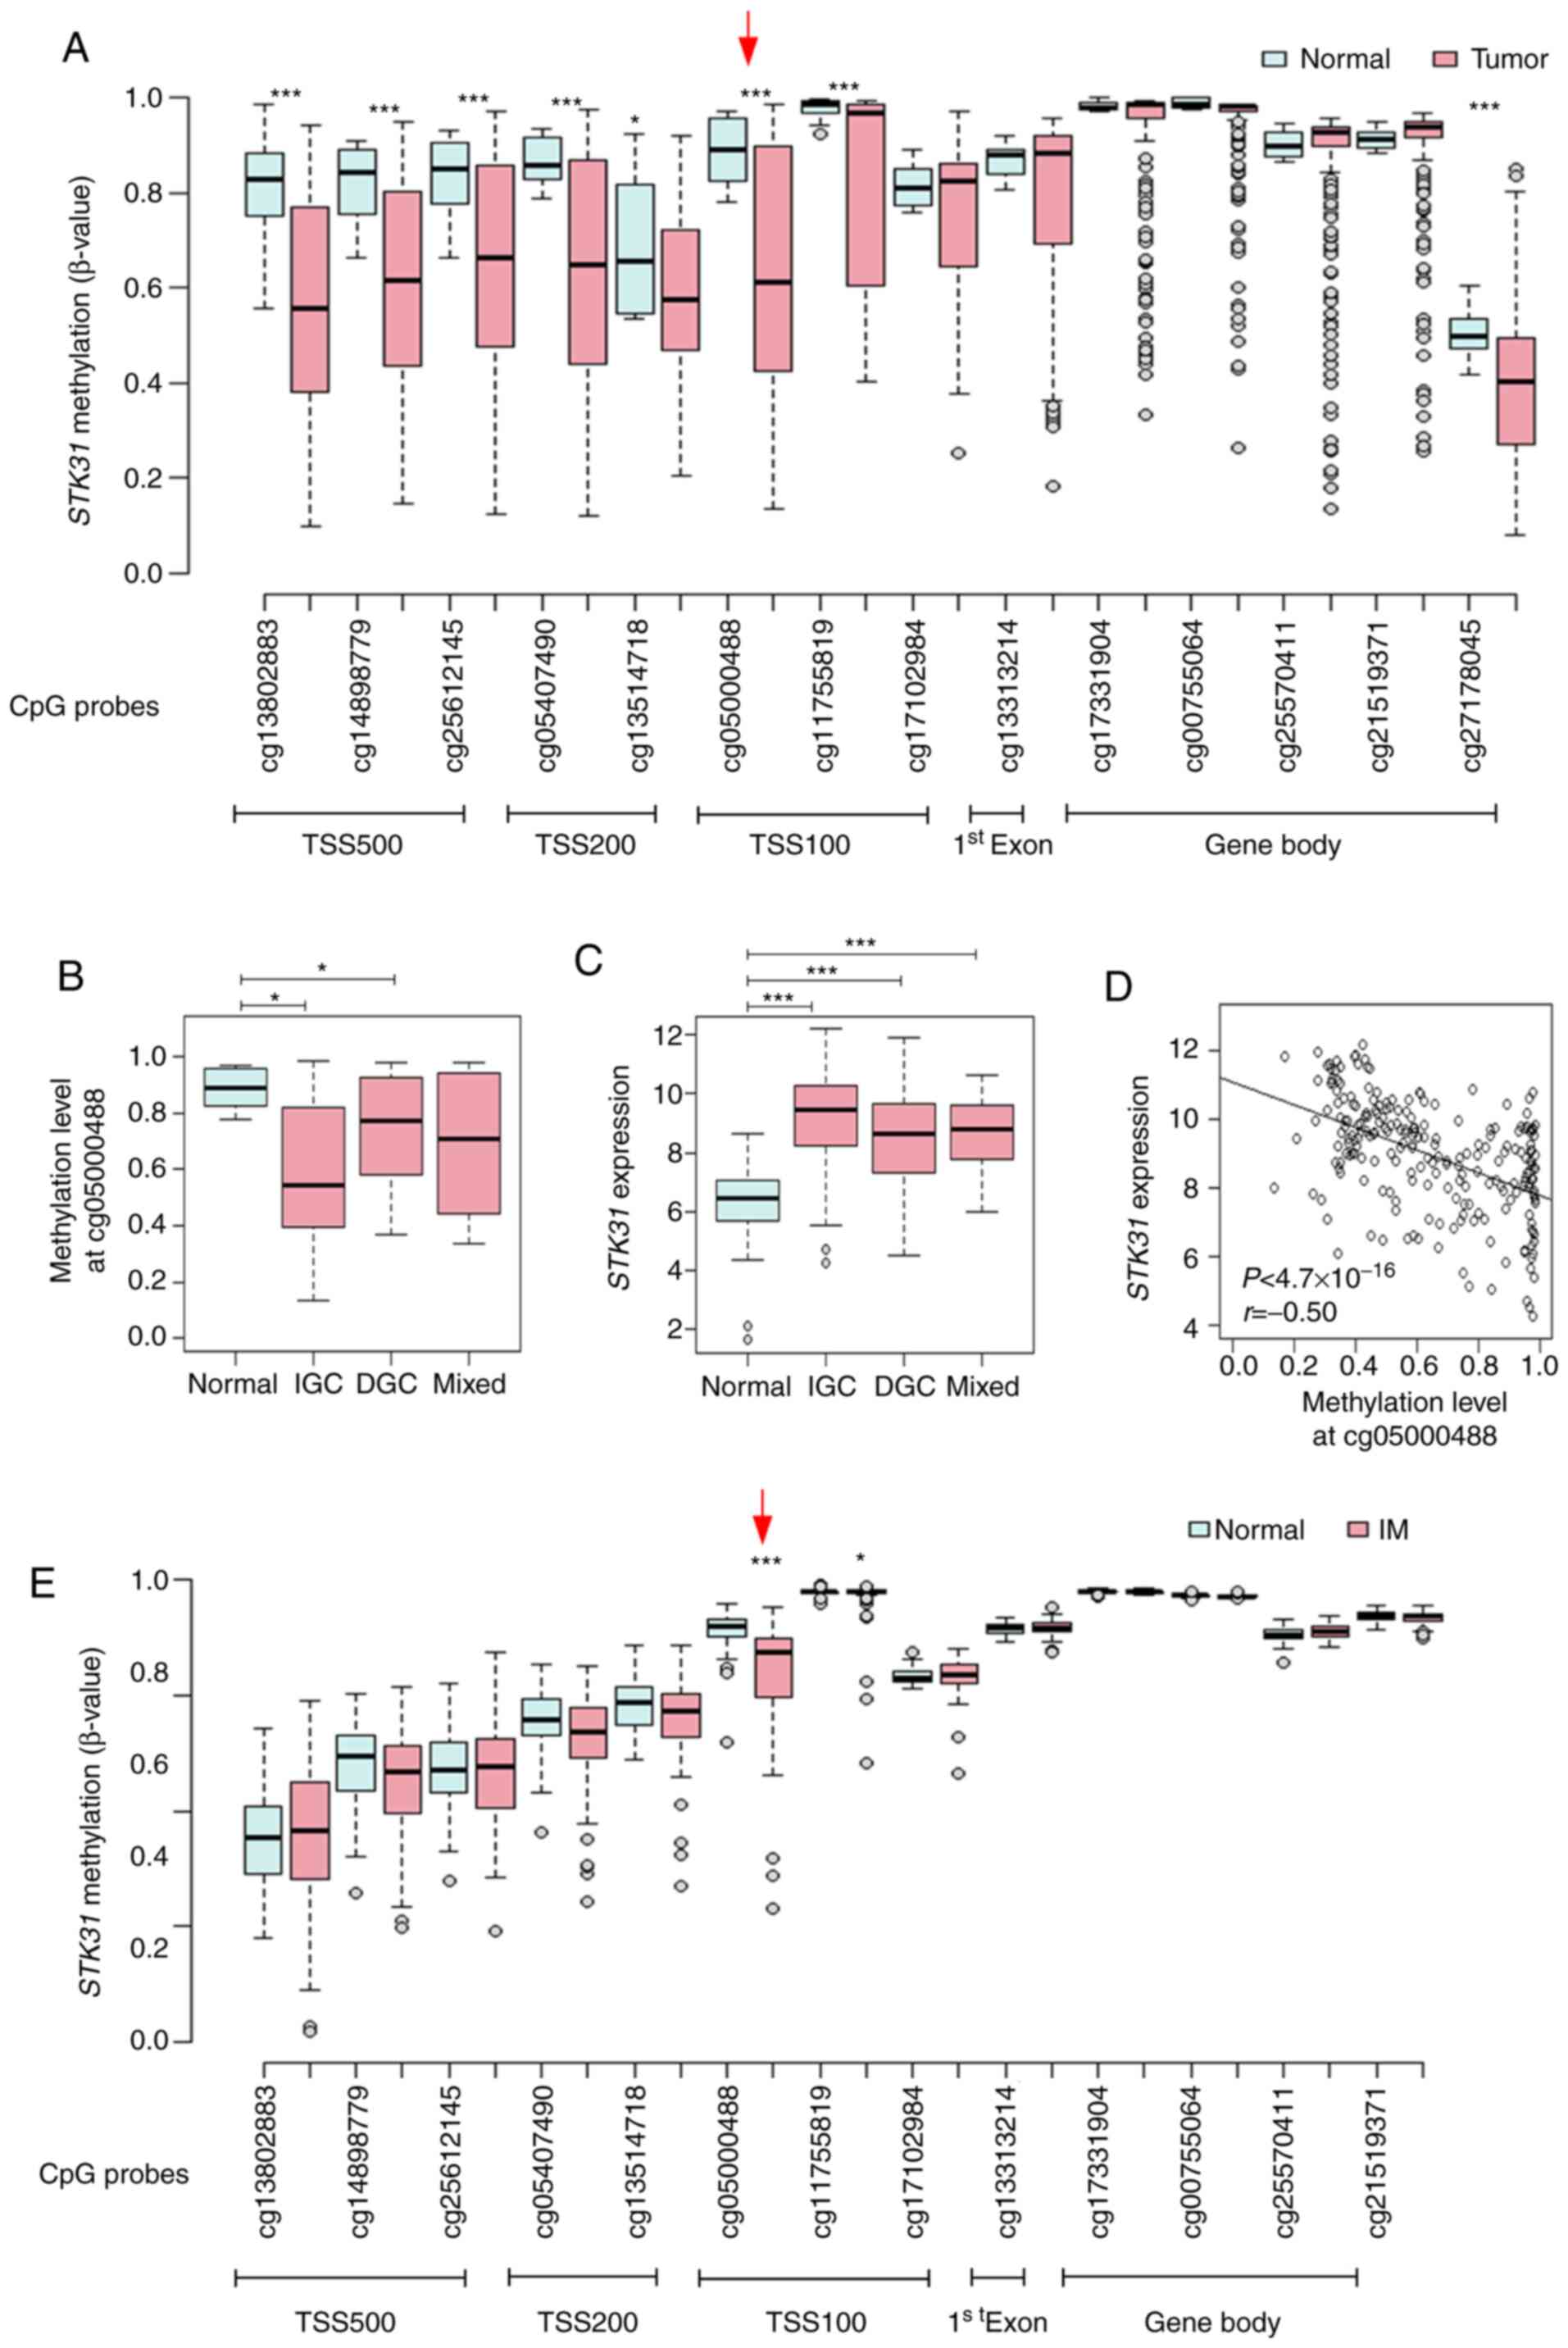 | Figure 3.Correlation between STK31
promoter methylation and expression levels in primary gastric
tumors or STK31 promoter methylation in IM from the public
database. (A) Methylation status at CpG sites proximal to the
STK31 promoter. β-values at 14 CpG sites from TSS500,
TSS200, TSS100, exon 1 and the gene body were retrieved from 450K
HumanMethylation BeadChip data for 29 gastric mucosa samples
(normal) and 214 gastric tumors including IGC (n=140), DGC (n=57)
and mixed-type GC (n=17) from the TCGA database. Red arrow
indicates cg05000488, the CpG site in TSS100 at which correlation
with STK31 expression levels was examined. (B) STK31
methylation status at cg05000488 was examined in normal tissue,
IGC, DGC and mixed-type GC. P-values were determined using the
Wilcoxon rank-sum test and corrected for multiple comparisons by
Bonferroni method (n=3). (C) STK31 expression was examined.
Pairwise P-values were calculated using Student's t-test and
corrected for multiple comparisons by Bonferroni method (n=3). (D)
Pearson's correlation analysis between methylation at cg05000488
and STK31 expression levels in the TCGA cohort. (E)
Methylation status at CpG sites proximal to the STK31
promoter in IM. β-values at 13 CpG sites were retrieved from 450K
BeadChip data for 39 normal and 76 IM samples from public data
GSE103186 (17). P-values were
determined using Student's t-test. *P<0.05, ***P<0.001. STK,
serine/threonine kinase; IM, intestinal metaplasia; TSS,
transcription start site; IGC, intestinal-type gastric cancer; DGC,
diffuse-type gastric cancer; TCGA, The Cancer Genome Atlas. |
Change in promoter methylation in GC
cell lines alters STK31 expression
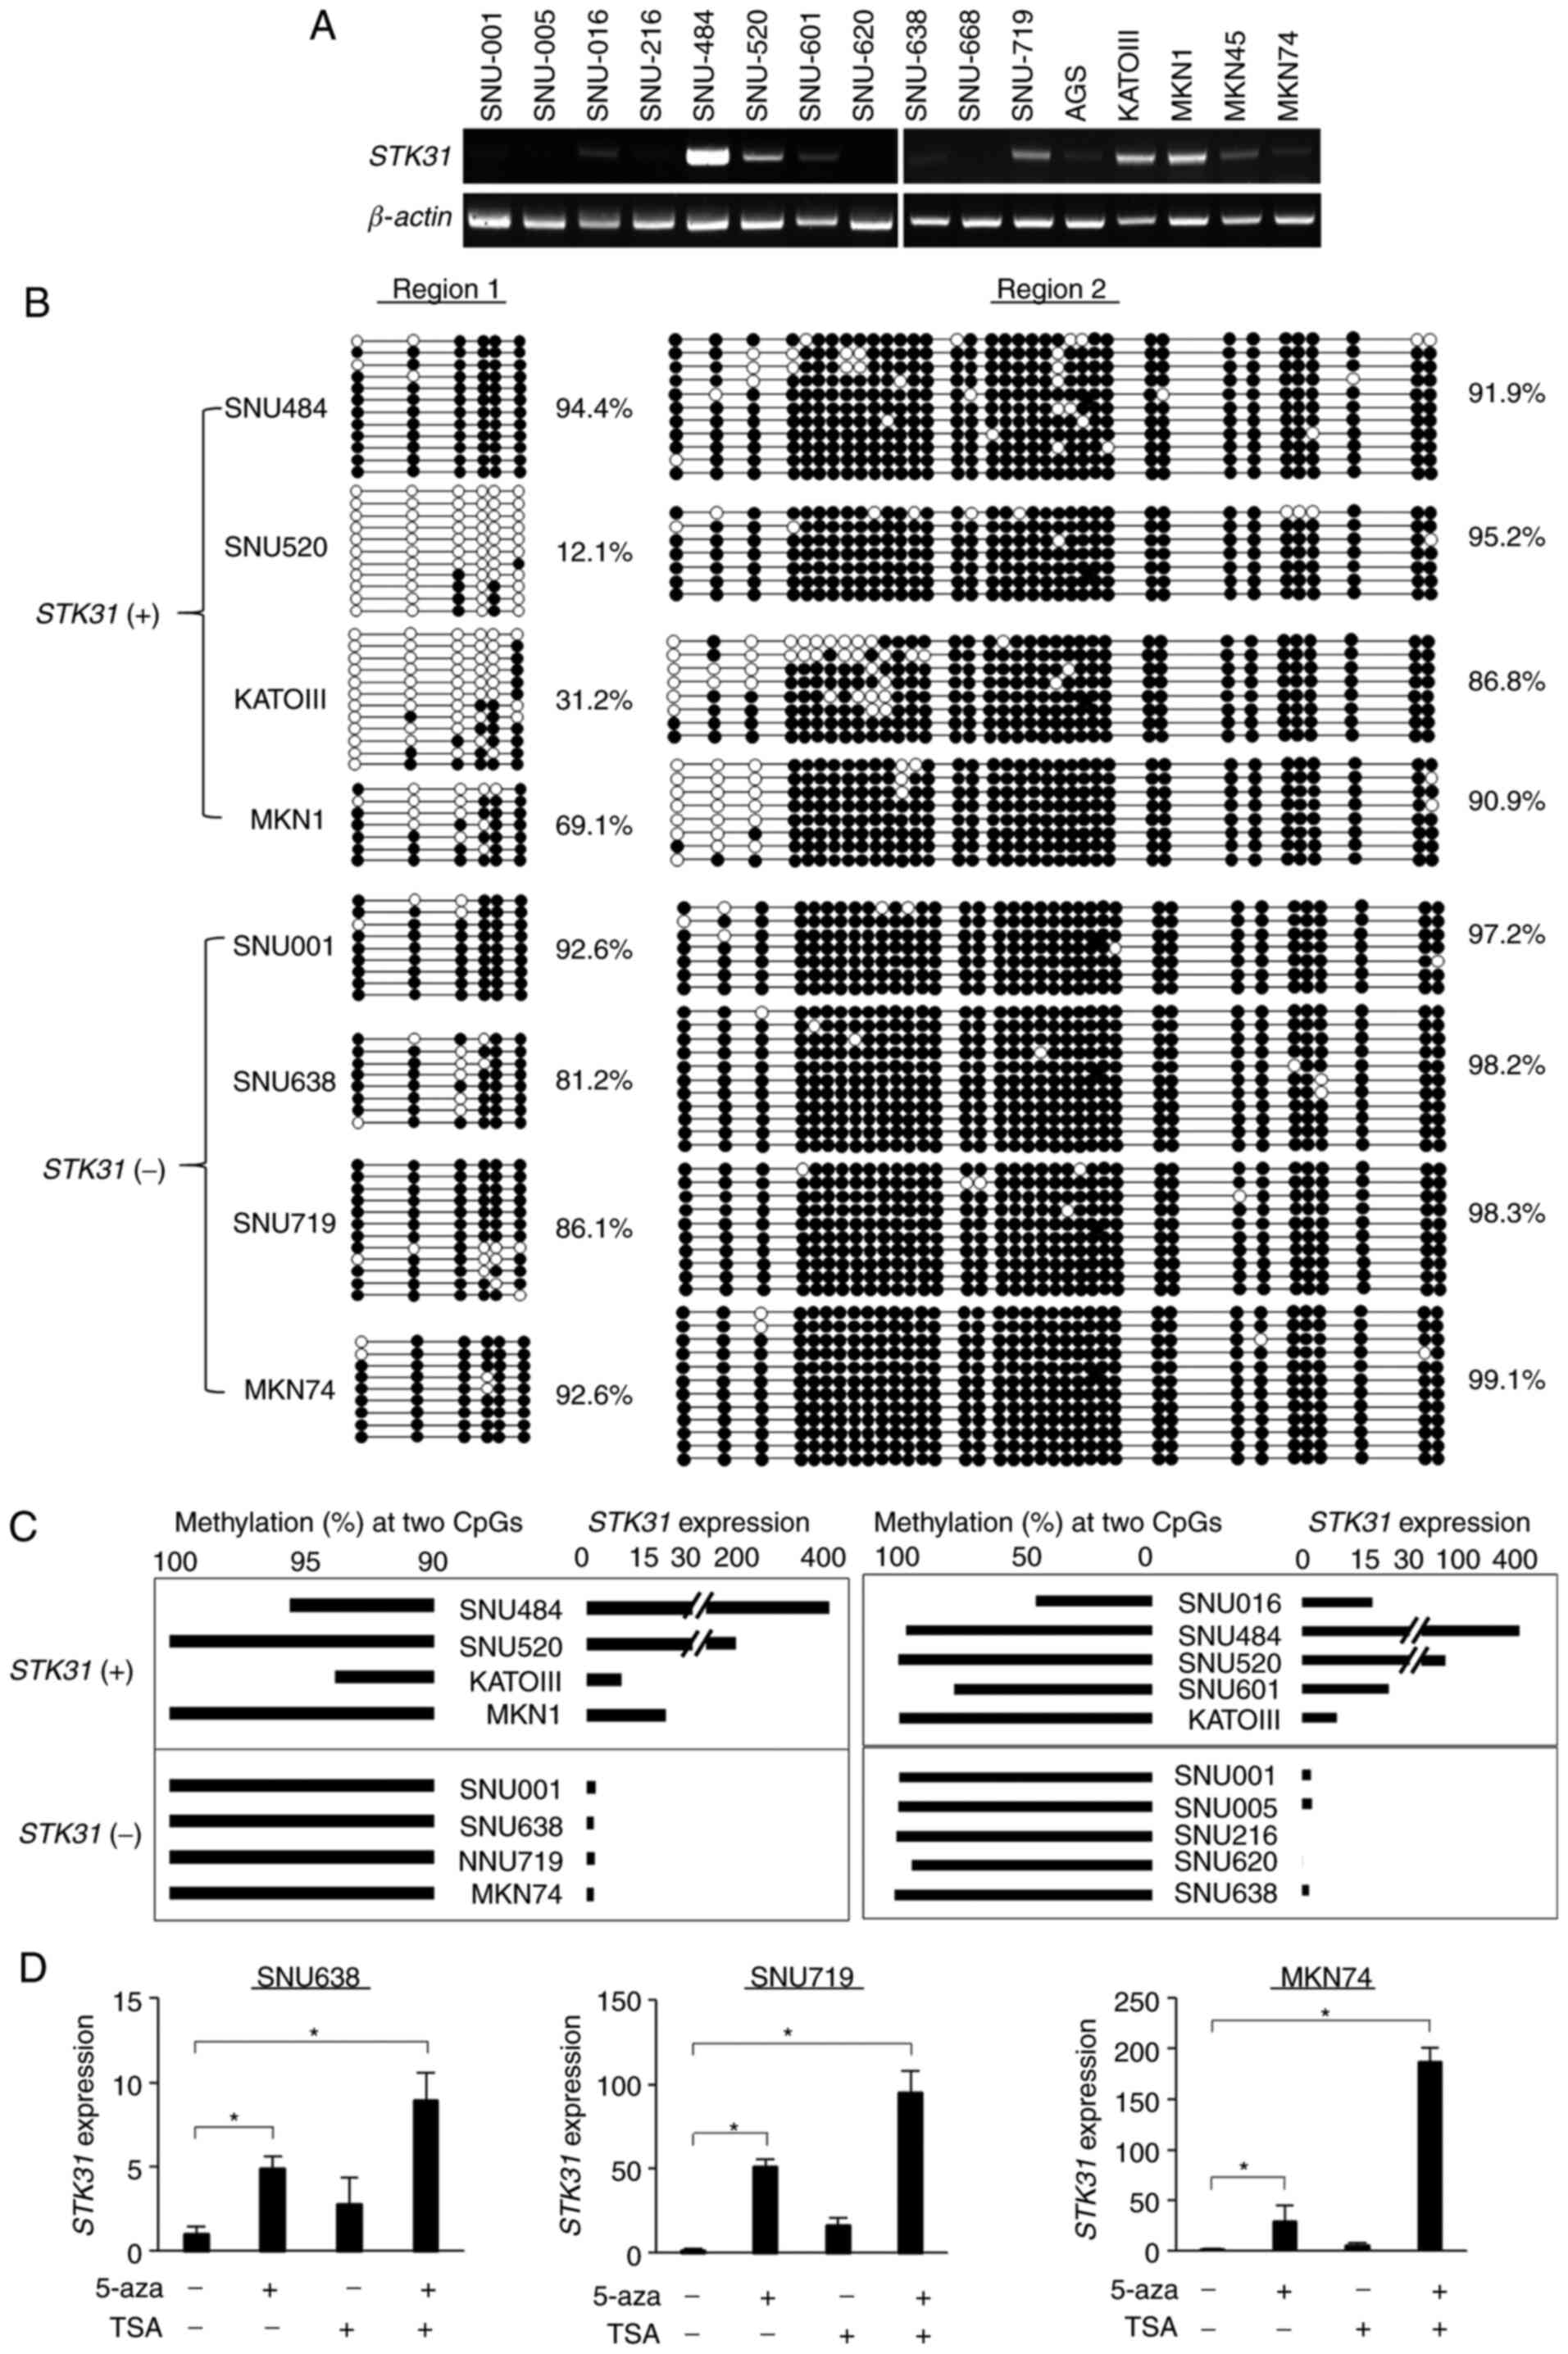
In order to investigate the association between
STK31 expression and methylation of its promoter in GC cell
lines, RT-qPCR and bisulfite sequencing analysis of GC cell lines
were performed. Based on the RT-qPCR results, cell lines were
divided into two groups according to the median relative
STK31 expression level. Fig. 4A
and B); the STK31-expressing group (+; >median value)
included SNU484, SNU520, KATOIII and MKN1 and the
weakly/non-expressing group (−; <median value) included SNU001,
SNU638, SNU719 and MKN74. For Region 1, bisulfite sequencing
revealed that members of the STK31 (+) group, except for
SNU484, exhibited low mean methylation (12.1–69.1%), whereas the
STK31 (−) group had relatively high methylation (81.2–92.6%;
Fig. 4B). In Region 2, however,
members of both groups were highly methylated (86.8–99.1%; Fig. 4B). The association between methylation
status at two CpG sites (CpG#23 and #24) and STK31
expression was examined in both groups; methylation status tended
to be decreased in STK31 (+) group compared with the
STK31 (−) group and STK31 expression levels tended to
be increased in STK31 (+) group compared with the
STK31 (−) group (Fig. 4C) in
both bisulfite sequencing and pyrosequencing analyses. In order to
determine whether STK31 expression is controlled
epigenetically, cells were treated with 5-aza-dC and/or TSA.
Treatment with 5-aza-dC significantly restored STK31
expression levels in SNU-638, SNU-719, and MKN74 cells (Fig. 4D). Treatment of GC cells with both
5-aza-dC and TSA also restored STK31 expression levels
(Fig. 4D), suggesting that its
expression in GC cells may be regulated epigenetically.
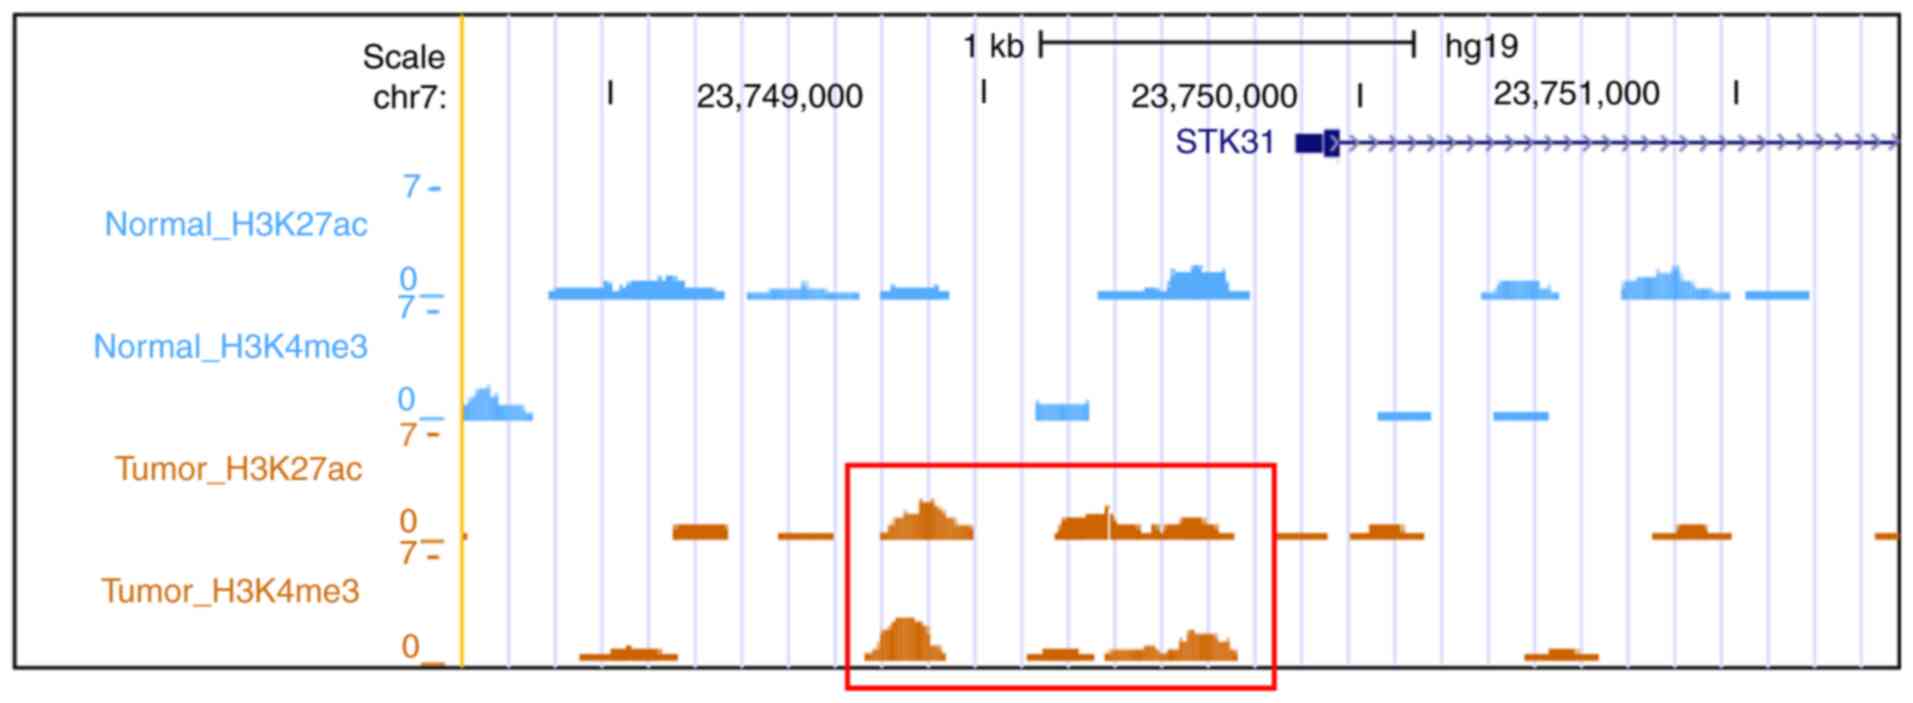
Genome-wide histone modification data
reveal upregulation of the STK31 promoter in primary GC
From the public data (GSE51776), unique reads were
identified by peak calling using macs2 with default parameters.
This yielded peak regions for H3K4me3 (chromatin mark for active
promoters), H3K4me1 (chromatin mark for active enhancers and
promoters) and H3K27ac (chromatin mark for active regulatory
elements), for which five paired normal and gastric tumor tissue
samples were merged. Then, signatures for promoter activity were
examined near the STK31 promoter. Gain of STK31
promoter activity (increased H3K4me3 and H3K27ac) was evident in
primary GC but not in normal mucosae (Fig. 5).
STK31 KD inhibits cell proliferation
and migration and induces G1 arrest in vitro
It was next investigated whether STK31
expression in SNU484 or MKN1 cells, in which STK31 was
highly expressed (Fig. 6A), could be
knocked down by two shRNAs. RT-qPCR and western blotting analysis
confirmed that STK31 expression levels significantly
decreased in STK31-KD SNU484 and MKN01 cells (Fig. 6A). Each shRNA significantly decreased
colony formation (Fig. 6B),
proliferation (Fig. 6C) and migration
(Fig. 6D) of both STK31-KD
cell lines compared with cells treated with control shRNA. In order
to investigate the underlying mechanisms for the cell proliferation
of STK31 suppression, the effect of STK31 silencing
on cell cycle progression in MKN1 cells was assessed by flow
cytometry. STK31-KD MKN1 cells was increased in the
G0/G1 phase but decreased in the
G2/M phase compared with the control (Fig. 6E). Next, the expression levels of
apoptosis regulatory proteins such as Caspase3 and PARP, were
assessed. Western blotting revealed that Cleaved caspase-3 and
Cleaved PARP were increased in STK31-KD cells compared with
the control (Fig. 6F). These results
suggest that shRNAs targeting STK31 mRNA modulated the
oncogenic potential of STK31 by inducing G1
arrest and apoptosis in GC cells.
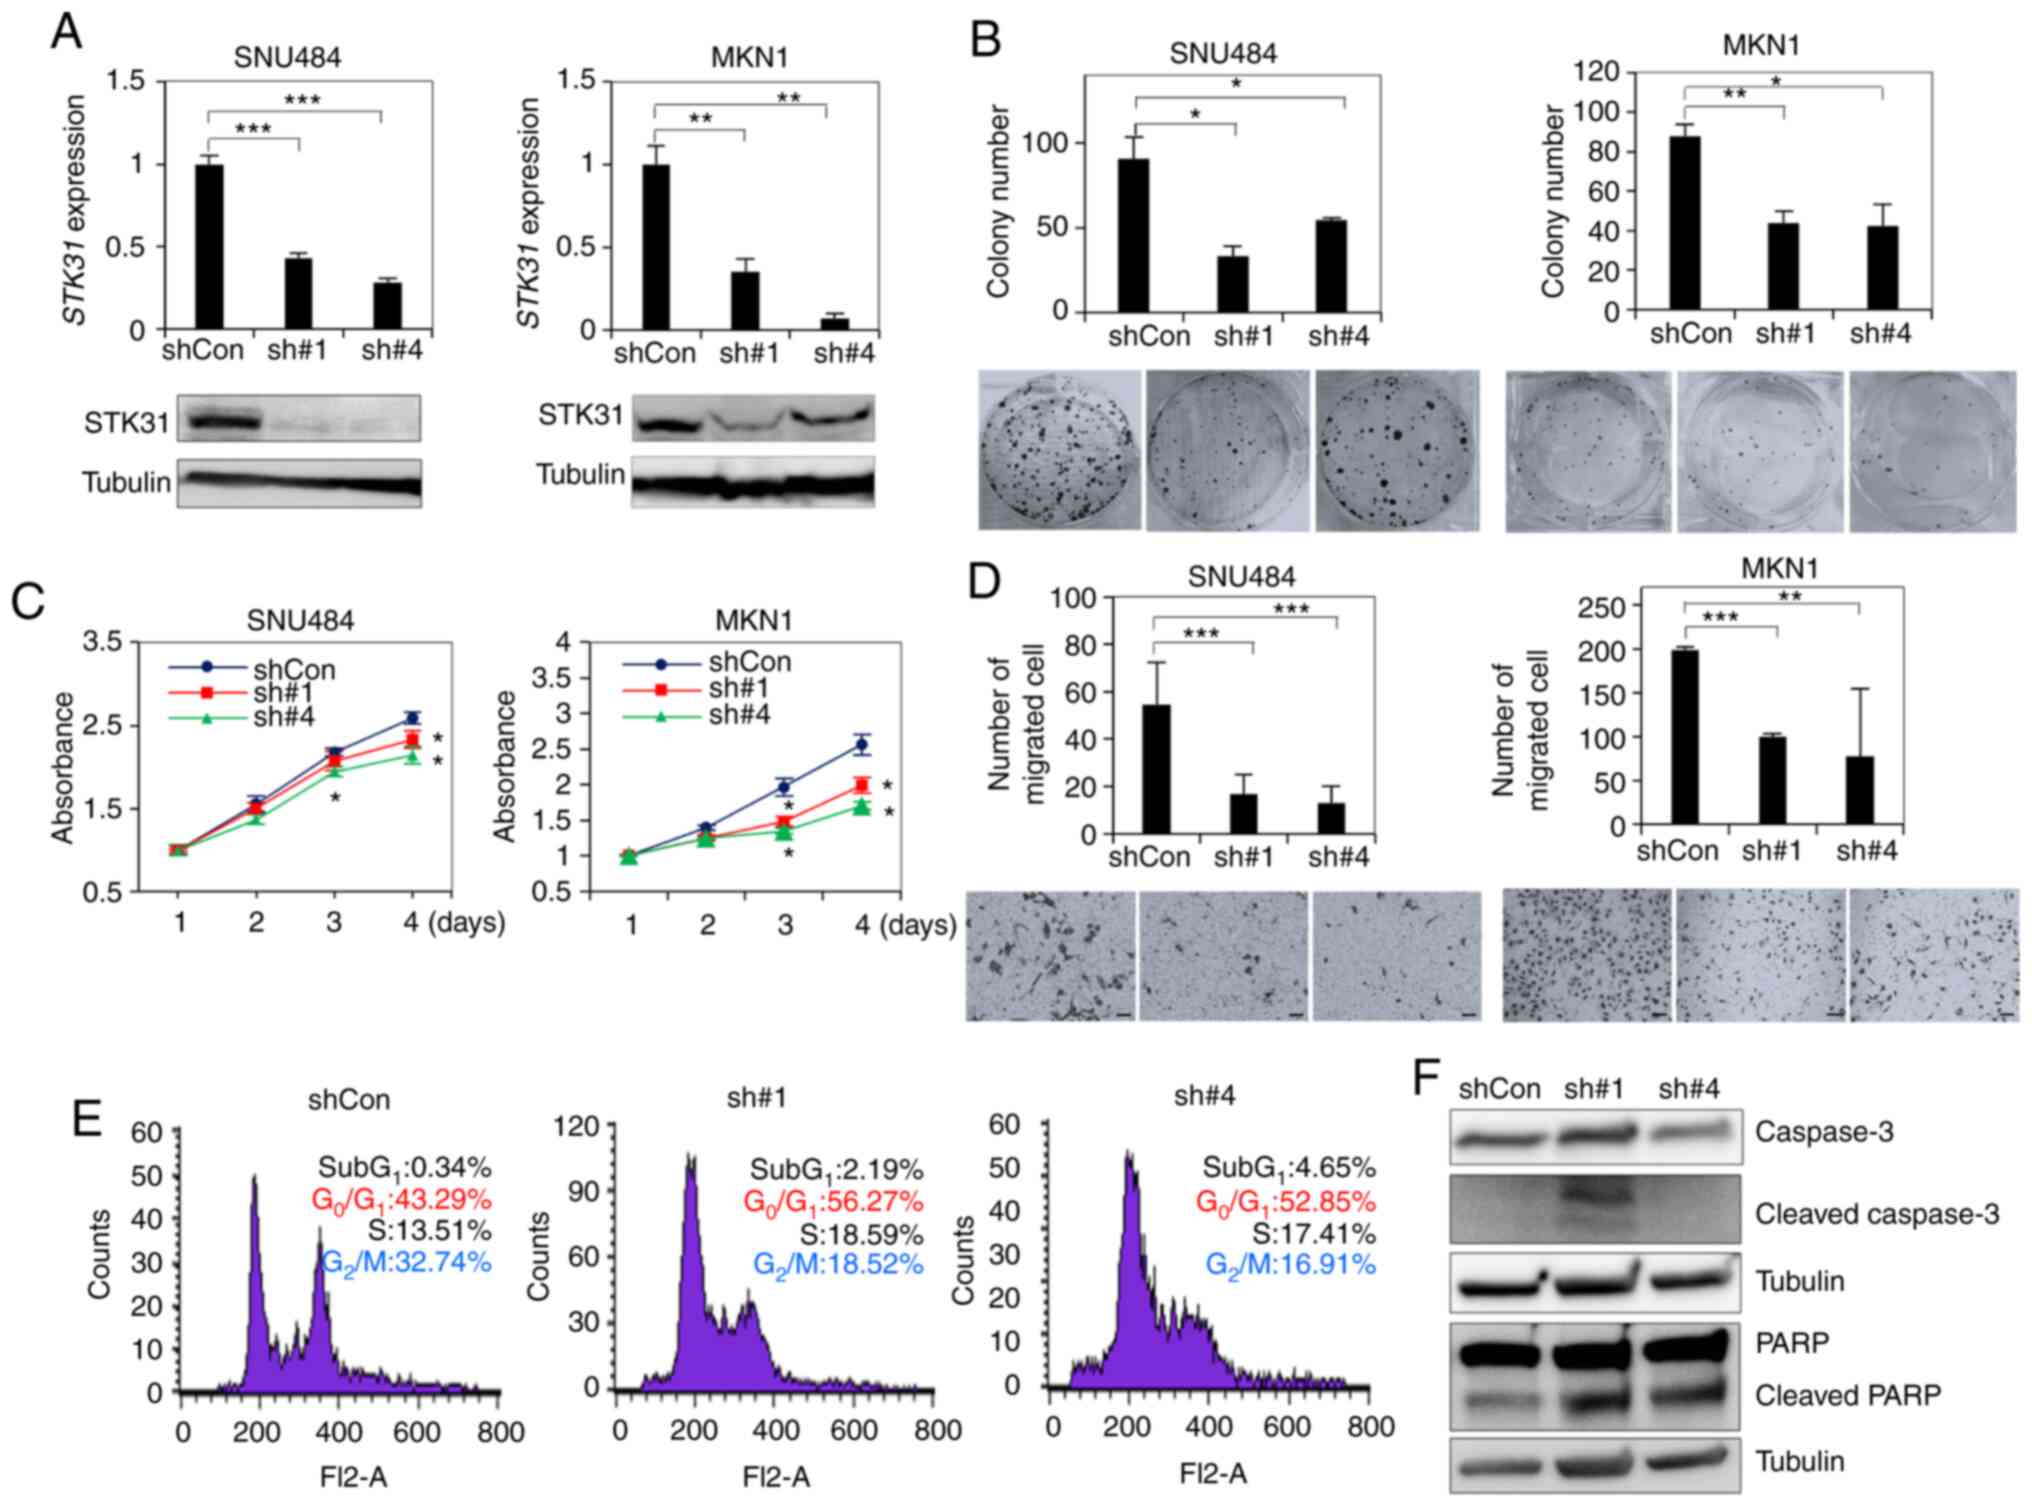 | Figure 6.In vitro assay of STK31
expression levels in STK31-KD cells. (A) Establishment of
STK31-KD cells by expression of shRNA. SNU484 and MKN01
cells were transfected with either of two lentiviral STK31
shRNAs (sh#1, sh#4) or scrambled-sequence shCon and cultured for 2
weeks. KD and control cells were compared by reverse
transcription-quantitative PCR and western blotting. Tubulin was
used as an internal control. (B) Colony formation assay.
Transfected cells were plated on 6-well plates at 1×10³
cells per well. After 2 weeks, colonies were stained with crystal
violet and counted. (C) Relative viability of STK31-KD cells
over 4 days was measured using EZ-Cytox Cell Viability Assay kit
and compared with empty vector control (PLKO). (D) Migration assay.
Transfected cells were plated on Transwell chambers at 2×10⁴ cells
per well. After 18–22 h, Transwell membranes were stained with
crystal violet and cells were counted. (E) Cell cycle analysis of
STK31-KD MKN1 cells. Following PI staining, cells were
assessed by flow cytometry. (F) Western blot analysis of caspase-3
and PARP cleavage in MKN1 cells. Two membranes were used for PARP
and Caspase-3. Pairwise P-values were calculated using Student's
t-test and corrected for multiple comparison by Bonferroni method
(n=2). *P<0.05, **P<0.01, ***P<0.001. STK,
serine/threonine kinase; KD, knockdown; sh, short hairpin; Con,
control. |
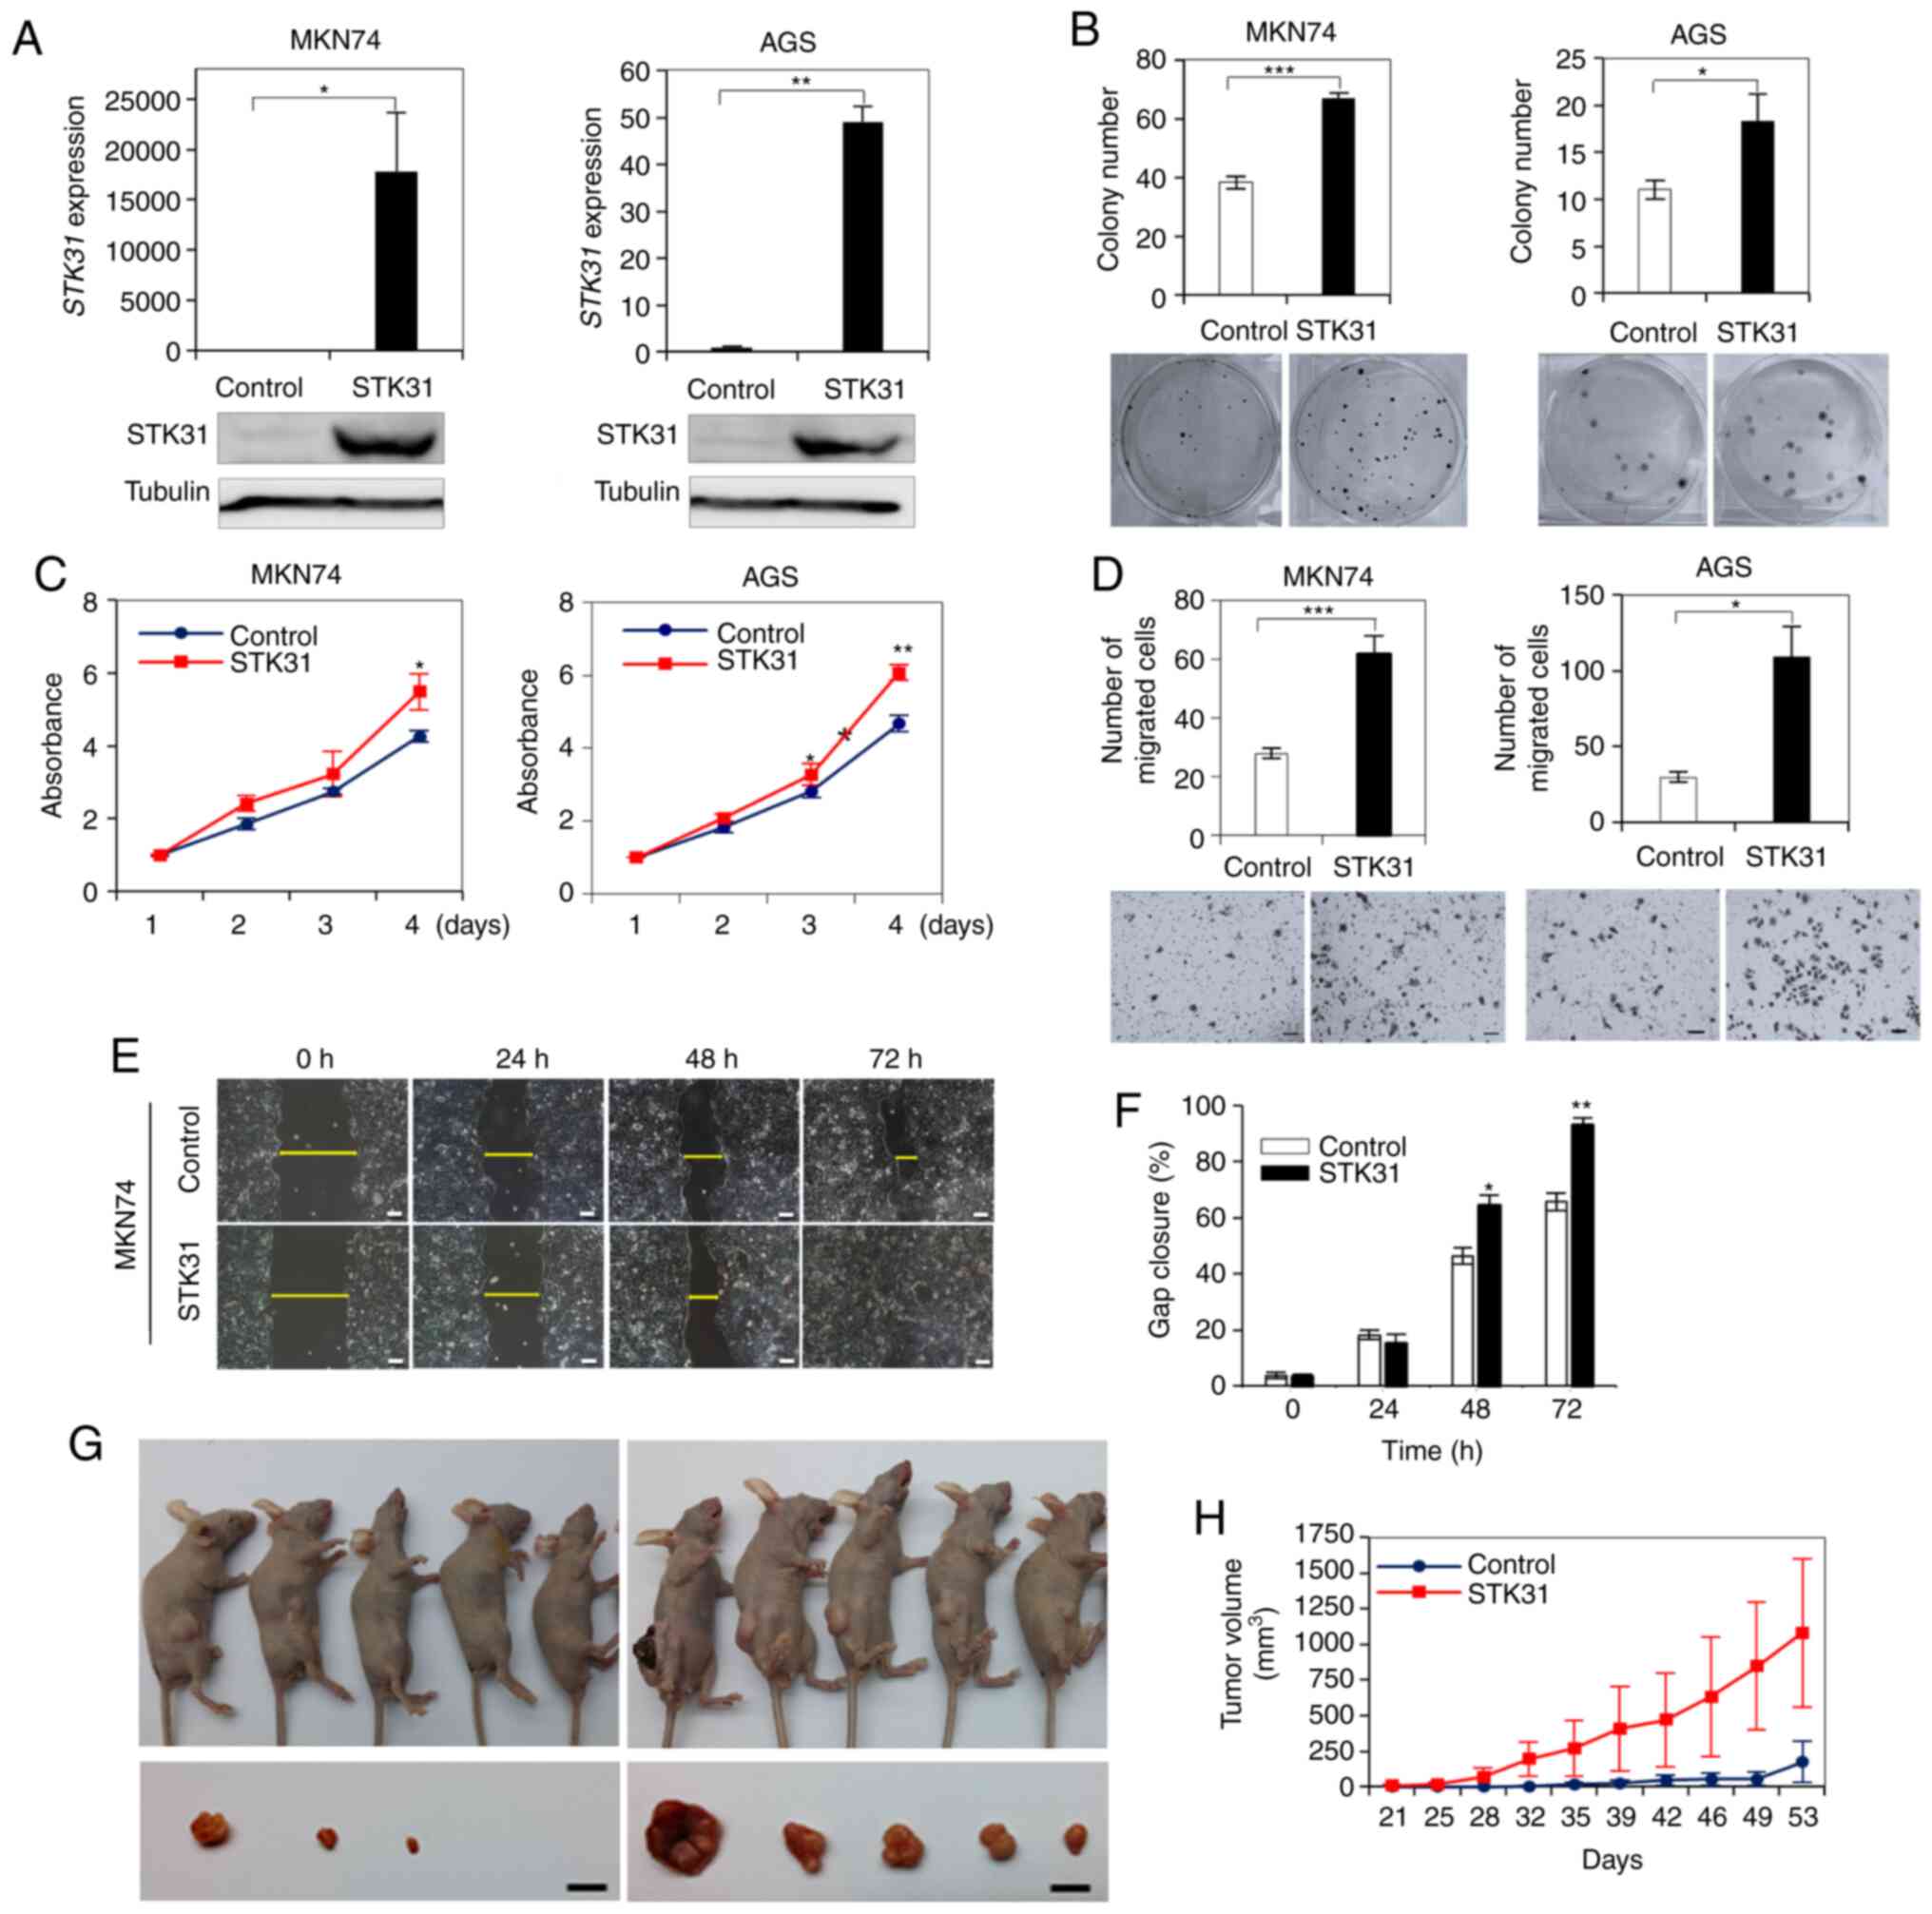
STK31 overexpression promotes cell
proliferation, migration and tumorigenesis
The effect of ectopic STK31 expression was
assessed in MKN74 or AGS cells, in which STK31 was repressed
or weakly expressed (Fig. 7A).
RT-qPCR and western blotting confirmed that STK31 mRNA was
stably expressed in STK31-transfected MKN74
(STK31-MKN74) and AGS (STK31-AGS) cells (Fig. 7A). Moreover, ectopic STK31
expression significantly induced colony formation in each of
STK31-MKN74 and STK31-AGS cells (Fig. 7B) compared with control cells. Ectopic
STK31 expression also significantly induced the
proliferation (Fig. 7C) and cell
migration (Fig. 7D-F) in both
STK31-transfected cell lines. Finally, in vivo
experiments revealed that tumors in mice engrafted with
STK31-MKN74 cells were significantly larger than those of
control cells (Fig. 7G and H),
demonstrating that tumorigenicity was promoted by ectopic
STK31 expression in a xenograft mouse model.
Molecular signature of STK31 is
informative regarding prognosis of patients with GC
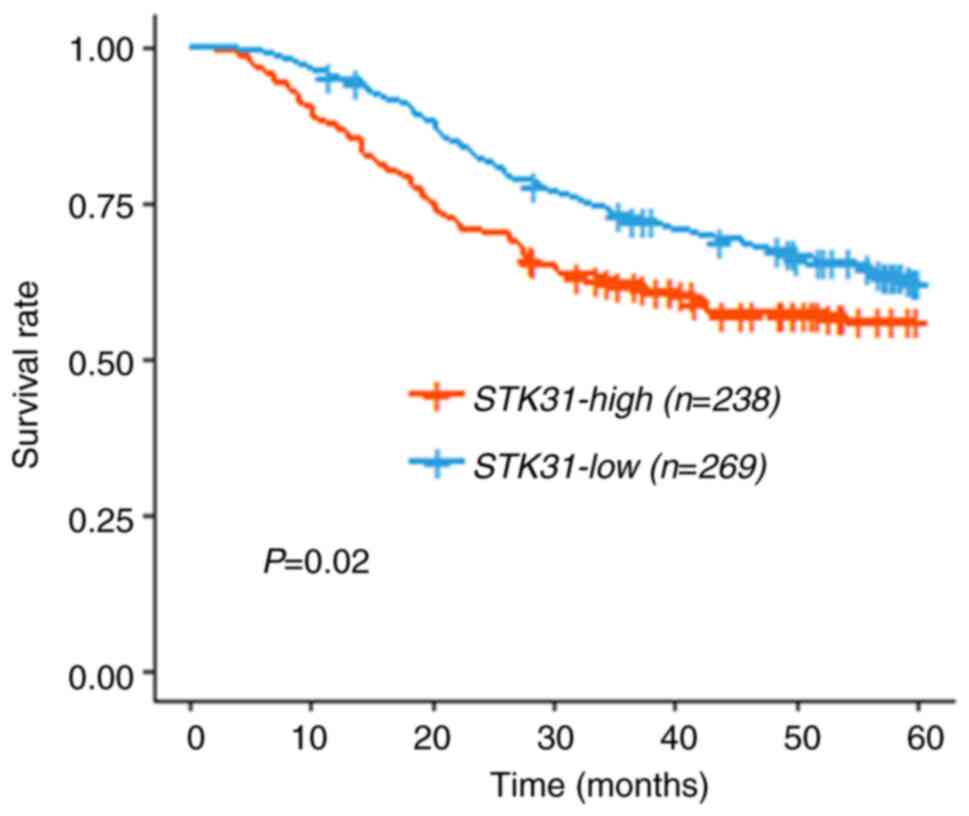
In order to assess the prognostic value of
STK31, clinical data from the CNUH (n=145) and SMC (n=432)
cohorts were combined to improve predictability. Using the mean
cut-off risk score, each cohort was divided into two groups based
on the mean expression value of STK31, and the upper and
lower groups were combined and analyzed. Kaplan-Meier survival
analysis revealed a significant difference in survival rate between
the two groups in the combined cohort (Fig. 8; log-rank test; P=0.02), indicating
that patient outcome was significantly poorer in the STK31
high expression group compared with the STK31 low expression
group.
Discussion
The present results demonstrate that hypomethylation
of CpG sites in the STK31 promoter in GC is correlated with
disease progression. The present study demonstrated that DNA
hypomethylation occurs in IM as well as IGC cells isolated by
laser-captured microdissection, suggesting that STK31
expression may be induced during the pre-cancer IM stage. A
previous study provided extensive information for 450K BeadChip of
gastric mucosae and IM tissue from GC-free patients, showing that
CpG methylation at the STK31 promoter was significantly
decreased in IM compared with gastric mucosae (18). TCGA Research Network has produced
transcriptome and methylation data for primary GC and non-tumor
tissues as a part of a study to develop a molecular classification
of GC (19). Here, TCGA public data
was used to show that the promoter and upstream region of
STK31 were hypomethylated in primary GC and that promoter
methylation was negatively correlated with STK31 mRNA
expression levels. Thus, the public data regarding DNA
hypomethylation at the STK31 promoter correspond well with
the present results.
The STK31 promoter in GC cell lines may be
key for regulating its transcription because the promoter was
heavily methylated in the few GC cell lines in which STK31
was silenced. However, the association between promoter methylation
and transcriptional efficiency in GC cell lines is unclear. In
SNU484 cells, for example, the STK31 promoter was heavily
methylated but STK31 was strongly expressed. The present
data explain the association between STK31 promoter
methylation and its transcription in the majority of GC cell lines,
with the exception of SNU484. Further investigation is required to
elucidate the association between STK31 promoter methylation
and its transcription in SNU484 cells. Our results reveal that
STK31 mRNA expression levels were restored in GC cell lines
following treatment with 5-aza-dC and/or TSA, indicating that
STK31 transcription is activated in GC cells as a
consequence of drug-induced chromatin remodeling. Previously,
Nano-ChIP-seq has been performed to characterize the landscapes of
promoters that undergo changes in methylation in primary GC and
matched normal tissue (22). Based on
that data, signatures for promoter activity proximal to
STK31 were analyzed, which demonstrated gain of promoter
activity (increased H3K4me3 and H3K27ac) at regions upstream of
STK31 in primary GC but not in normal mucosae. Notably, in
the present study, the regions in which promoter activity increased
(chr7:23,748,702-23,749,708) overlapped partially with those in
which STK31 promoter methylation decreased
(chr7:23,749,662-23,749,795) in primary GC. This result suggests
that the STK31 promoter may be repressed in gastric mucosae
but activated in primary GC as a consequence of chromatin
remodeling, i.e., altered DNA methylation and histone
modifications.
It has been proposed that, during multistep
development, human tumors acquire six hallmarks of cancer, namely
sustained proliferative signaling, growth suppressor evasion,
resistance to cell death, replicative immortality, induced
angiogenesis and invasion and metastasis (24). Two emerging hallmarks have been added
to this list, namely energy metabolism reprogramming and immune
evasion (25). Genome instability and
inflammation have been posited to constitute the underlying bases
for these latter two hallmarks. It has been suggested that
chromatin structure may be altered in response to certain hallmarks
(26). The present results
demonstrated that STK31 acquired aberrant gain of function
in GC as a consequence of specific epigenetic alterations that
promote GC cell proliferation and tumor growth both in vitro
and in vivo, suggesting that STK31 serves an
important role during the acquisition of certain hallmarks in
numerous types of human cancer, including GC. In order to clarify
the role of STK31 in vivo, however, further studies are
required using a mouse model, such as tail vein injection to
determine whether it causes metastasis. The downstream pathways of
STK31 in the regulation of cancer cell behavior are not
clear. Proteins, such as DEAD-Box helicase 4, Cullin 3 (CUL3) and
Heat Shock Protein 70 superfamily, have been identified as
interacting partners with STK31 in mouse testis tissue by liquid
chromatography-mass spectrometry (9).
CUL3 directly binds to BTB-domain containing speckle-type POZ
protein (SPOP) (27). Furthermore,
binding of CUL3 to SPOP, which is a candidate tumor suppressor gene
in several types of cancer including GC, downregulates SPOP and
thus enhances the proliferation and migration of human GC cells
(28). Further investigation is
required to determine whether the oncogenic potential of STK31 is
achieved via interaction with CUL3 and SPOP.
Gastric carcinogenesis proceeds through a series of
precursor lesions in the GM called Correa's cascade, comprising
multi-atrophic gastritis, IM, dysplasia and GC (29). In this process, IM represents a
trans-differentiation of the gastric epithelium to yield an IGC,
primarily induced by Helicobacter pylori infection and
expression of homeobox genes, including caudal type homeobox 2
(CDX2) (30). Epidemiological
evidence suggests that IM may be reversible with long-term follow
up. For example, a study (31) showed
that H. pylori eradication may reverse IM and that
reversibility may be associated with a decrease in CDX2 mRNA
levels in patients with dysplasia as well as GC. However, the
results of earlier studies on the effects of H. pylori
eradication for improving IM have been inconsistent (32–35).
Another study reported that selumetinib, an inhibitor of
mitogen-activated protein kinase, may reverse IM in a mouse model
based on tamoxifen injection and lead to re-establishment of normal
gastric lineage (36). STK31
may be silenced in GM but activated in IM by chromatin remodeling
but it is not clear whether STK31 may be a target for
reversing IM in the stomach.
Taken together, the present data suggested that
STK31 may be a novel IM marker that is hypomethylated
longitudinally in GC and its pre-cancer lesion, IM. Furthermore,
STK31 may be used as an early detection biomarker to prevent
gastric carcinogenesis and predict the prognosis of patients with
GC. These findings may contribute to the Pre-Cancer Atlas, a
concerted initiative to characterize the molecular alterations in
premalignant lesions (37). Further
studies are required to clarify the exact role of STK31 in
gastric carcinogenesis and to evaluate whether a small molecule or
epigenetic editing could be used to modulate STK31
expression levels.
Acknowledgements
Not applicable.
Funding
The present study was funded by the National
Research Foundation of Korea (grant no. 2017R1E1A1A01074883) and by
the Korea Research Institute of Bioscience and Biotechnology
Research Initiative.
Availability of data and materials
The data generated as a part of this study are
available at the Gene Expression Omnibus (accession no.
GSE55159).
Authors' contributions
YSK conceptualized and designed the study. DHB and
HJK performed the experiments. YSK, DHB and HJK authenticated all
the raw data. BHY and JLP operated the software. DHB and MK
analyzed the data. SIL and KSS collected clinical tissue samples
and pathological information. SKK and SYK interpreted data. DHB
wrote the manuscript. YSK reviewed and edited the manuscript,
supervised the study and obtained funding. DHB and HJK visualized
the data. All authors read and approved the final version of the
manuscript.
Ethics approval and consent to
participate
All clinical samples were obtained with informed
consent and their use was approved by the Internal Review Board at
Chungnam National University Hospital (approval no.
CNUH201801056006-HE001). All animal experiments were approved by
the Internal Animal Care and Use Committee at Korea Research
Institute of Bioscience and Biotechnology (approval no.
KRIBB-AEC-16158).
Patient consent for publication
Not applicable.
Competing interests
The authors declare that they have no competing
interests.
References
|
1
|
Bray F, Ferlay J, Soerjomataram I, Siegel
RL, Torre LA and Jemal A: Global cancer statistics 2018: GLOBOCAN
estimates of incidence and mortality worldwide for 36 cancers in
185 countries. CA Cancer J Clin. 68:394–424. 2018. View Article : Google Scholar : PubMed/NCBI
|
|
2
|
Orditura M, Galizia G, Sforza V,
Gambardella V, Fabozzi A, Laterza MM, Andreozzi F, Ventriglia J,
Savastano B, Mabilia A, et al: Treatment of gastric cancer. World J
Gastroenterol. 20:1635–1649. 2014. View Article : Google Scholar : PubMed/NCBI
|
|
3
|
Matsuoka T and Yashiro M: Biomarkers of
gastric cancer: Current topics and future perspective. World J
Gastroenterol. 24:2818–2832. 2018. View Article : Google Scholar : PubMed/NCBI
|
|
4
|
Correa P: Human gastric carcinogenesis: A
multistep and multifactorial process-First American Cancer Society
Award Lecture on Cancer Epidemiology and Prevention. Cancer Res.
52:6735–6740. 1992.PubMed/NCBI
|
|
5
|
Jones PA and Baylin SB: The fundamental
role of epigenetic events in cancer. Nat Rev Genet. 3:415–428.
2002. View
Article : Google Scholar : PubMed/NCBI
|
|
6
|
Szyf M, Pakneshan P and Rabbani SA: DNA
methylation and breast cancer. Biochem Pharmacol. 68:1187–1197.
2004. View Article : Google Scholar : PubMed/NCBI
|
|
7
|
Upchurch GM, Haney SL and Opavsky R:
Aberrant promoter hypomethylation in CLL: Does it matter for
disease development? Front Oncol. 6:1822016. View Article : Google Scholar : PubMed/NCBI
|
|
8
|
Kim HJ, Kang TW, Haam K, Kim M, Kim SK,
Kim SY, Lee SI, Song KS, Jeong HY and Kim YS: Whole genome MBD-seq
and RRBS analyses reveal that hypermethylation of gastrointestinal
hormone receptors is associated with gastric carcinogenesis. Exp
Mol Med. 50:1–14. 2018. View Article : Google Scholar
|
|
9
|
Bao J, Wang L, Lei J, Hu Y, Liu Y, Shen H,
Yan W and Xu C: STK31(TDRD8) is dynamically regulated throughout
mouse spermatogenesis and interacts with MIWI protein. Histochem
Cell Biol. 137:377–389. 2012. View Article : Google Scholar : PubMed/NCBI
|
|
10
|
Fok KL, Chen H, Ruan YC and Chan HC: Novel
regulators of spermatogenesis. Semin Cell Dev Biol. 29:31–42. 2014.
View Article : Google Scholar : PubMed/NCBI
|
|
11
|
Sabeur K, Ball BA, Corbin CJ and Conley A:
Characterization of a novel, testis-specific equine
serine/threonine kinase. Mol Reprod Dev. 75:867–873. 2008.
View Article : Google Scholar : PubMed/NCBI
|
|
12
|
Xiao Y, Pollack D, Andrusier M, Levy A,
Callaway M, Nieves E, Reddi P and Vigodner M: Identification of
cell-specific targets of sumoylation during mouse spermatogenesis.
Reproduction. 151:149–166. 2016. View Article : Google Scholar : PubMed/NCBI
|
|
13
|
Yokoe T, Tanaka F, Mimori K, Inoue H,
Ohmachi T, Kusunoki M and Mori M: Efficient identification of a
novel cancer/testis antigen for immunotherapy using three-step
microarray analysis. Cancer Res. 68:1074–1082. 2008. View Article : Google Scholar : PubMed/NCBI
|
|
14
|
Kuo PL, Huang YL, Hsieh CC, Lee JC, Lin BW
and Hung LY: STK31 is a cell-cycle regulated protein that
contributes to the tumorigenicity of epithelial cancer cells. PLoS
One. 9:e933032014. View Article : Google Scholar : PubMed/NCBI
|
|
15
|
Fok KL, Chung CM, Yi SQ, Jiang X, Sun X,
Chen H, Chen YC, Kung HF, Tao Q, Diao R, et al: STK31 maintains the
undifferentiated state of colon cancer cells. Carcinogenesis.
33:2044–2053. 2012. View Article : Google Scholar : PubMed/NCBI
|
|
16
|
Livak KJ and Schmittgen TD: Analysis of
relative gene expression data using real-time quantitative PCR and
the 2(-Delta Delta C(T)) method. Methods. 25:402–408. 2001.
View Article : Google Scholar : PubMed/NCBI
|
|
17
|
Kim M, Kim JH, Jang HR, Kim HM, Lee CW,
Noh SM, Song KS, Cho JS, Jeong HY, Hahn Y, et al: LRRC3B, encoding
a leucine-rich repeat-containing protein, is a putative tumor
suppressor gene in gastric cancer. Cancer Res. 68:7147–7155. 2008.
View Article : Google Scholar : PubMed/NCBI
|
|
18
|
Huang KK, Ramnarayanan K, Zhu F,
Srivastava S, Xu C, Tan AL, Lee M, Tay S, Das K, Xing M, et al:
Genomic and epigenomic profiling of high-risk intestinal metaplasia
reveals molecular determinants of progression to gastric cancer.
Cancer Cell. 33:137–150.e5. 2018. View Article : Google Scholar : PubMed/NCBI
|
|
19
|
Cancer Genome Atlas Research Network, .
Comprehensive molecular characterization of gastric adenocarcinoma.
Nature. 513:202–209. 2014. View Article : Google Scholar : PubMed/NCBI
|
|
20
|
Lokk K, Modhukur V, Rajashekar B, Märtens
K, Mägi R, Kolde R, Koltšina M, Nilsson TK, Vilo J, Salumets A and
Tõnisson N: DNA methylome profiling of human tissues identifies
global and tissue-specific methylation patterns. Genome Biol.
15:r542014. View Article : Google Scholar : PubMed/NCBI
|
|
21
|
Nazor KL, Altun G, Lynch C, Tran H,
Harness JV, Slavin I, Garitaonandia I, Müller FJ, Wang YC, Boscolo
FS, et al: Recurrent variations in DNA methylation in human
pluripotent stem cells and their differentiated derivatives. Cell
Stem Cell. 10:620–634. 2012. View Article : Google Scholar : PubMed/NCBI
|
|
22
|
Muratani M, Deng N, Ooi WF, Lin SJ, Xing
M, Xu C, Qamra A, Tay ST, Malik S, Wu J, et al: Nanoscale chromatin
profiling of gastric adenocarcinoma reveals cancer-associated
cryptic promoters and somatically acquired regulatory elements. Nat
Commun. 5:43612014. View Article : Google Scholar : PubMed/NCBI
|
|
23
|
Lee J, Sohn I, Do IG, Kim KM, Park SH,
Park JO, Park YS, Lim HY, Sohn TS, Bae JM, et al: Nanostring-based
multigene assay to predict recurrence for gastric cancer patients
after surgery. PLoS One. 9:e901332014. View Article : Google Scholar : PubMed/NCBI
|
|
24
|
Hanahan D and Weinberg RA: The hallmarks
of cancer. Cell. 100:57–70. 2000. View Article : Google Scholar : PubMed/NCBI
|
|
25
|
Hanahan D and Weinberg RA: Hallmarks of
cancer: The next generation. Cell. 144:646–674. 2011. View Article : Google Scholar : PubMed/NCBI
|
|
26
|
Berdasco M and Esteller M: Aberrant
epigenetic landscape in cancer: How cellular identity goes awry.
Dev Cell. 19:698–711. 2010. View Article : Google Scholar : PubMed/NCBI
|
|
27
|
Zhuang M, Calabrese MF, Liu J, Waddell MB,
Nourse A, Hammel M, Miller DJ, Walden H, Duda DM, Seyedin SN, et
al: Structures of SPOP-substrate complexes: Insights into molecular
architectures of BTB-Cul3 ubiquitin ligases. Mol Cell. 36:39–50.
2009. View Article : Google Scholar : PubMed/NCBI
|
|
28
|
Kim MS, Je EM, Oh JE, Yoo NJ and Lee SH:
Mutational and expressional analyses of SPOP, a candidate tumor
suppressor gene, in prostate, gastric and colorectal cancers.
APMIS. 121:626–633. 2013. View Article : Google Scholar : PubMed/NCBI
|
|
29
|
Correa P and Piazuelo MB: The gastric
precancerous cascade. J Dig Dis. 13:2–9. 2012. View Article : Google Scholar : PubMed/NCBI
|
|
30
|
Mesquita P, Raquel A, Nuno L, Reis CA,
Silva LF, Serpa J, Van Seuningen I, Barros H and David L:
Metaplasia-a transdifferentiation process that facilitates cancer
development: The model of gastric intestinal metaplasia. Crit Rev
Oncog. 12:3–26. 2006. View Article : Google Scholar : PubMed/NCBI
|
|
31
|
Shin CM, Kim N, Chang H, Kim JS, Lee DH
and Jung HC: Follow-up study on CDX1 and CDX2 mRNA expression in
noncancerous gastric mucosae after Helicobacter pylori
eradication. Dig Dis Sci. 61:1051–1059. 2016. View Article : Google Scholar : PubMed/NCBI
|
|
32
|
Tucci A, Poli L, Tosetti C, Biasco G,
Grigioni W, Varoli O, Mazzoni C, Paparo GF, Stanghellini V and
Caletti G: Reversal of fundic atrophy after eradication of
Helicobacter pylori. Am J Gastroenterol. 93:1425–1431. 1998.
View Article : Google Scholar : PubMed/NCBI
|
|
33
|
Sung JJ, Lin SR, Ching JY, Zhou LY, To KF,
Wang RT, Leung WK, Ng EK, Lau JY, Lee YT, et al: Atrophy and
intestinal metaplasia one year after cure of H. pylori
infection: A prospective, randomized study. Gastroenterology.
119:7–14. 2000. View Article : Google Scholar : PubMed/NCBI
|
|
34
|
Ohkusa T, Fujiki K, Takashimizu I, Kumagai
J, Tanizawa T, Eishi Y, Yokoyama T and Watanabe M: Improvement in
atrophic gastritis and intestinal metaplasia in patients in whom
Helicobacter pylori was eradicated. Ann Intern Med.
134:380–386. 2001. View Article : Google Scholar : PubMed/NCBI
|
|
35
|
Kang JM, Kim N, Shin CM, Lee HS, Lee DH,
Jung HC and Song IS: Predictive factors for improvement of atrophic
gastritis and intestinal metaplasia after Helicobacter
pylori eradication: A three-year follow-up study in Korea.
Helicobacter. 17:86–95. 2012. View Article : Google Scholar : PubMed/NCBI
|
|
36
|
Choi E, Hendley AM, Bailey JM, Leach SD
and Goldenring JR: Expression of activated ras in gastric chief
cells of mice leads to the full spectrum of metaplastic lineage
transitions. Gastroenterology. 150:918–930.e13. 2016. View Article : Google Scholar : PubMed/NCBI
|
|
37
|
Kensler TW, Spira A, Garber JE, Szabo E,
Lee JJ, Dong Z, Dannenberg AJ, Hait WN, Blackburn E, Davidson NE,
et al: Transforming cancer prevention through precision medicine
and immune-oncology. Cancer Prev Res (Phila). 9:2–10. 2016.
View Article : Google Scholar : PubMed/NCBI
|