Introduction
Tongue squamous cell carcinoma (TSCC) is the most
prevalent malignancy of oral cancer and accounts for 25–40% of all
cases (1). Despite significant
advancements in surgery, radiotherapy, chemotherapy and other
therapies, the 5-year survival rate for TSCC patients has remained
poor during the past few decades (1,2). Even
though the pathogenesis of TSCC has been investigated extensively
over the past few decades, the mechanisms underlying the occurrence
and development of TSCC have not been fully clarified (2). Therefore, elucidation of the mechanisms
of TSCC progression may aid in devising novel strategies for the
diagnosis, therapy and prognosis of TSCC.
Circular RNAs (circRNAs) are a class of newly
discovered non-coding RNAs (ncRNAs) with covalently closed loops,
which are more stable than conventional linear RNAs (3). Increasing evidence suggests that
circRNAs exert a crucial role in tumorigenesis (4–6). In
addition, a number of circRNAs have been implicated in the
progression of TSCC (7–10). For instance, hsa_circ_0001742 was
found to promote TSCC progression by regulating the miR-431-5p/ATF3
or miR-634/RAB1A axis (9,10). Interestingly, hsa_circ_0000003
(circ_0000003) is a poorly conserved circRNA that has been reported
to facilitate cell proliferation, invasion and migration of
non-small cell lung cancer (NSCLC) cells by regulating the
miR-338-3p/insulin receptor substrate 2 (IRS2) axis (11). Although the tumor-promoting role of
circ_0000003 has been reported in NSCLC (11), its role in other tumors has not yet
been reported.
Recent studies have demonstrated that glutamine
metabolism plays a vital role in the progression of various tumors,
including lung adenocarcinoma, prostate cancer and B-lymphoma
(12,13). In these tumors, not only tumor cell
growth, but also tumor invasion and metastasis are promoted by
dysregulated glutamate metabolism (12,13).
Interestingly, some circRNAs have been shown to be involved in the
regulation of glutamine metabolism (14–16). Among
them are circHMGCS1, which was demonstrated to promote cell
proliferation and glutaminolysis in hepatoblastoma cells by
facilitating the expression of glutaminase (GLS), one of the key
enzymes in glutamine metabolism (15), and circ_0016418, which was shown to
facilitate glutamine catabolism in melanoma cells by upregulating
GLS expression via interaction with miR-605-5p (16). The above studies suggest that some
circRNAs may affect the occurrence and development of tumors by
regulating glutamate metabolism. However, the mechanism of how
glutamate metabolism influences tumor physiology remains
unclear.
In the present study, the expression level of
circ_0000003 in TSCC and its roles in TSCC progression were
investigated. Furthermore, whether circ_0000003 exerts its
functions by regulating glutamate metabolism via the miR-330-3p/GLS
axis in TSCC was assessed.
Materials and methods
Clincical tissues
The clinical research was conducted with the
approval of the Medical Ethics Committee of Taizhou University
Hospital (approval no. 2018-092), and 40 TSCC patients at Taizhou
University Hospital (Taizhou, Zhejiang, China) provided written
consent to donate their cancerous tissues for this research before
surgery. All patients were adults with no history of other cancers,
and had not undergone any targeted therapeutic treatments prior to
surgery. The 40 paired TSCC tissues and their paracancerous
nontumor samples (>1 cm away from the edge of TSCC tissues) were
collected between January 2015 and December 2017, and diagnosed by
more than two pathologists. All the specimens were immediately
snap-frozen in liquid nitrogen and preserved at −80°C before
use.
Cell culture
Human TSCC cell lines (SCC25, SCC4, Cal27 and SCC1)
were obtained from the American Type Culture Collection (ATCC), and
cultured in DMEM (Gibco; Thermo Fisher Scientific, Inc.) containing
10% fetal bovine serum (FBS) (Gibco; Thermo Fisher Scientific,
Inc.) and 1% Penicillin-Streptomycin Solution. Human oral
keratinocytes (HOKs) were obtained from the ScienCell Research
Laboratories (cat. no. 2610), and cultured in Oral Keratinocyte
Medium (ScienCell Research Laboratories).
Construction of plasmid and cell
transfection
For overexpression, circ_0000003 was cloned into
mammalian expression vector pcDNA3.1 (Invitrogen; Thermo Fisher
Scientific, Inc.) to construct overexpressing plasmid
pcDNA3.1-circ_0000003 (p-circ_0000003). Empty pcDNA3.1 vector was
used as a vector control. Short hairpin RNAs (shRNAs) targeting
circ_0000003 (pLKO.1-sh-circ_0000003, sh-circ_0000003), negative
control shRNAs (sh-NC), miR-330-3p inhibitors
(UCUCUGCAGGCCGUGUGCUUUGC) (17),
miRNA inhibitor negative control (miRNA inhibitor-NC;
CAGUACUUUUGUGUAGUACAA) (18),
miR-330-3p mimics (GCAAAGCACACGGCCUGCAGAGA) (17) and miRNA scrambled control (control
mimics; UUCUCCGAACGUGUCACGUTT) (18)
were all synthesized by GenePharma. All the obtained constructs
were subsequently transfected via Lipofectamine 2000 reagent
(Invitrogen; Thermo Fisher Scientific, Inc.) according to the
manufacturers protocol.
Cell proliferation assay
A total of 5×10³ transfected TSCC cells
were seeded into 96-well plates. After incubation for 0, 24, 48, 72
and 96 h, the medium was discarded, and the fresh medium containing
10 µl Cell Counting Kit-8 (CCK-8) solution (Beyotime Institute of
Biotechnology) was mixed and pipetted into the TSCC cells. After
reaction for 4 h, the absorbance at 450 nm was measured using a
microplate reader (Bio-Rad Laboratories, Inc.).
Cell invasion and migration
assays
Transwell chambers (Corning Inc.) precoated with
Matrigel (BD Biosciences) were used to detect the TSCC cell
invasion ability. For cell invasion assay, TSCC cells were seeded
into the upper chamber of Matrigel-coated inserts and incubated for
48 h. The invasive TSCC cells were fixed in 70% ethanol at room
temperature and stained with 0.1% crystal violet for 30 min. Then
the stained cells were lysed with 200 µl of lysis reagent, and 100
µl of lysate was pipetted into a 96-well plate to detect the
absorbance value at 560 nm using a microplate reader (550;
Bio-Rad).
Transwell assay without Matrigel was performed to
detect the TSCC cell migration ability. For cell migration
detection, TSCC cells were resuspended into a single-cell
suspension in 250 µl DMEM containing 1% FBS, and then
5×10⁴ cells per well were pipetted into uncoated 8-µm
transwell filter inserts (Corning Inc.) in 24-well plates in
triplicate. DMEM (500 µl) containing 15% FBS was added into the
lower chambers as a chemoattractant. The TSCC cells were incubated
for 16 h, and the non-migratory TSCC cells in the upper chamber
were wiped away gently with a cotton swab. Then the migratory TSCC
cells on the bottom side of the upper chamber were fixed in 100%
methanol at room temperature and stained with 0.5 µg/ml
4,6-diamidino-2-phenylindole (DAPI) for 5 min. Finally the stained
cells were counted with a fluorescence microscope (original
magnification, ×200; Eclipse 80i; Nikon Corp.) in five random
fields.
Glutamine, α-ketoglutarate (α-KG) and
ATP assays
Glutamine consumption, α-KG and ATP production were
tested as detailed previously (19).
Glutamine consumption levels were analyzed using the glutamine
assay kit (BioVision Inc.). α-KG production levels were detected
with the fluorescence-based lactate assay kit (BioVision Inc.). ATP
production levels were detected with the enhanced ATP assay kit
(Beyotime Institute of Biotechnology). All the above kits were
operated according to the manufacturers protocol.
Reverse transcription and quantitative
polymerase chain reaction (RT-qPCR)
Total RNA of TSCC cells and tissues was extracted
with TRIzol reagent (Invitrogen; Thermo Fisher Scientific Inc.),
and then the first-strand cDNA was synthesized using the
PrimeScript 1st Strand cDNA Synthesis Kit (Takara). RT-qPCR was
performed using the SYBR Green qPCR Kit (Thermo Fisher Scientific
Inc.) with a StepOne™ Real-Time PCR System (Applied Biosystems;
Thermo Fisher Scientific Inc.). The thermocycling conditions were:
95°C for 10 min, followed by 40 cycles of 95°C for 15 sec, 55°C for
30 sec, and 72°C for 30 sec. Relative gene expression was
calculated using the 2−ΔΔCq method (20). GAPDH and U6 were respectively used as
control references for circRNA/mRNA and miRNA. Their primers were
purchased from Sangon Biotech, and the sequences as described in
previous studies (11,21–25) are
listed in Table I.
 | Table I.RT-qPCR primer sequences. |
Table I.
RT-qPCR primer sequences.
| Name | Primer
sequences |
|---|
| circ_0000003 | F:
5′-TTGACTGGGCCAATACCAGC-3′ |
|
| R:
5′-ACAGGAAGGCGTTCAGTGTG-3′ |
| miR-31 | F:
5′-UAGCAGCACAGAAAUAUUGGC-3′ |
|
| R:
5′-CAAUAUUUCUGUGCUGCUAUU-3′ |
| miR-197 | F:
5′-CGGTAGTCTGATACTGTAA-3′ |
|
| R:
5′-GTGCTCCGAAGGGGGT-3′ |
| miR-210 | F:
5′-TAATATAGCCCCTGCCCACC-3′ |
|
| R:
5′-TATGCTTGTTCTCGTCTCTGTGTC-3′ |
| miR-330-3p | F:
5′-ACACTCCAGCTGGGAGAGACGTCCGGCACAC-3′ |
|
| R:
5′-CTCAACTGGTGTCGTGGAGTCGGCAATTCAGTTGAGCGTTTCGT-3′ |
| miR-338-3p | F:
5′-GTGTGGCTCTGAGGTCCTTG-3′ |
|
| R:
5′-ATCCGTGAAGTTGTTCGTGG-3′ |
| GLS | F:
5′-TTCCAGAAGGCACAGACATGGTTG-3′ |
|
| R:
5′-GCCAGTGTCGCAGCCATCAC-3′ |
| GAPDH | F:
5′-GCACCGTCAAGGCTGAGAAC-3′ |
|
| R:
5′-GCCTTCTCCATGGTGGTGAA-3′ |
| U6 | F:
5′-GCTTCGGCAGCACATATACTAAAAT-3′ |
|
| R:
5′-CGCTTCACGAATTTGCGTGTCAT-3′ |
Western blot analysis
RIPA buffer (Beyotime Institute of Biotechnology)
was used to extract the total protein from the TSCC cells, which
was then quantified using the BCA Kit (Pierce; Thermo Fisher
Scientific Inc.). Then the protein samples were separated by 10%
SDS-PAGE electrophoresis, and transferred onto a PVDF membrane
(Millipore Corp.). After blocking with 5% defatted milk powder, the
membrane was incubated overnight at 4°C with specific primary
antibodies (both from Abcam) against glutaminase (dilution 1:1,000,
cat. no. ab156876), and GAPDH (dilution 1:1,000, cat. no.
ab181602). Next, the membranes were incubated with horseradish
peroxidase-conjugated rabbit secondary antibody (dilution 1:2,000,
cat. no.7074, Cell Signaling Technology) for 1 h at room
temperature. The immunoreactive bands were visualized by enhanced
chemiluminescence ECL kit, and then scanned by a LAS-4000 imaging
system (Fujifilm).
Bioinformatics analysis
The interaction between circ_0000003 and miRNAs was
predicted using Circular RNA Interactome (https://circinteractome.nia.nih.gov/). miR-330-3p that
may interact with GLS mRNA 3-untranslated region (UTR) was searched
using miRDB (http://mirdb.org/) and TargetScan
(http://www.targetscan.org/).
Luciferase reporter assay
The partial sequences of circ_0000003 or GLS 3′-UTR,
which contain the putative miR-330-3p-binding site, were amplified
via PCR and constructed into the pmirGLO Luciferase vector (Promega
Corp.) to generate wild-type circ_0000003 reporter
(circ_0000003-WT) or GLS reporter (GLS-WT). The GeneArt™
Site-Directed Mutagenesis System (Thermo Fisher Scientific, Inc.)
was used to produce miR-330-3p target site-mutation circ_0000003
(circ_0000003-MUT) reporter or miR-330-3p target site-mutation GLS
3′-UTR (GLS-MUT) reporter. All constructs were verified via DNA
sequencing. Subsequently, the luciferase reporters and miR-330-3p
mimic or control mimic were co-transfected into the cells using
Lipofectamine 2000 reagent (Invitrogen; Thermo Fisher Scientific,
Inc.). The cells were collected at 48 h after transfection, and
then the relative firefly luciferase activities were measured using
a Dual-Glo luciferase assay system (Promega Corp.) following the
manufacturers instructions. Firefly luciferase activities were
normalized to Renilla luciferase activities.
Pull-down assay with biotinylated
miR-330-3p
TSCC cell lysates were collected using RIPA buffer
plus RNase inhibitor (Promega Corp.), followed by transfection with
biotin-labeled wild-type (WT) miR-330-3p (Bio-miR-330-3p-WT),
mutated (MUT) miR-330-3p (Bio-miR-330-3p-MUT) or antagonistic
miR-330-3p probe (Bio-NC-probe), which were all designed and
synthesized by GenePharma. Then, the TSCC cell lysates were mixed
with M-280 streptavidin magnetic beads (Sigma-Aldrich; Merck KGaA)
for 3 h at 4°C. The pull-down products were subjected to RT-qPCR
for circ_0000003 expression.
RNA immunoprecipitation (RIP)
assay
RIP assay was carried out using the RIP RNA-Binding
Protein Immunoprecipitation Kit (Millipore Corp.). In brief, TSCC
cells were lysed in RIP lysis buffer, followed by incubation with
anti-Ago2 antibody (catalog no.ab57113, Abcam) and protein G
magnetic beads. After 6 washes, the immunocomplexes bound by Ago2
were eluted, and then incubated with proteinase K at 55°C for 30
min to digest the proteins, followed by RNA extraction and RT-qPCR
analysis for the expression of circ_0000003 or GLS mRNA.
Statistical analysis
All data were statistically analyzed via SPSS 25.0
(IBM Corp.). Paired t-tests were used in the comparisons between
TSCC tissues and their adjacent normal tissues. Unpaired t-tests
were used in the comparisons between two groups of TSCC cells.
Differences among ≥3 groups were assessed using one-way ANOVA
followed by Tukeys post-hoc test. The overall survival curve was
generated and assessed by Kaplan-Meier and log-rank tests. The
associations between circ_0000003 expression and
clinicopathological parameters of TSCC patients were assessed using
the χ2 test (for analyzing sex and age) or Fishers exact
test (for analyzing TNM stage and tumor size) in Table II. Among circ_0000003, miR-330-3p and
GLS mRNA, their linear correlations were assessed using Pearsons
correlation analysis and two-tailed t-test.
| Table II.Correlation between circ_0000003 and
the clinicopathological features of the TSCC patients (N=40). |
Table II.
Correlation between circ_0000003 and
the clinicopathological features of the TSCC patients (N=40).
|
|
|
Clinicopathological |
|
|
|---|
|
|
|
|
|
|
|---|
| Circ_0000003
factors | All patients | Low level | High level | χ2 | P-value |
|---|
| Age (years) |
|
≤55 | 17 | 9 | 8 | 0.102 | 0.749 |
|
>55 | 23 | 11 | 12 |
|
|
| Sex |
|
Male | 24 | 11 | 13 | 0.417 | 0.519 |
|
Female | 16 | 9 | 7 |
|
|
| TNM stage |
|
I+II | 18 | 13 | 5 | 6.465 | 0.011a |
|
III+IV | 22 | 7 | 15 |
|
|
| Tumor size
(cm) |
| ≤2 | 21 | 14 | 7 | 4.912 | 0.027a |
|
>2 | 19 | 6 | 13 |
|
|
Results
Circ_0000003 is upregulated in TSCC
and promotes TSCC cell proliferation
To determine the role of circ_0000003 in TSCC, we
tested circ_0000003 expression levels in 40 pairs of TSCC tissues
and their paired adjacent normal tissues. As shown in Fig. 1A, circ_0000003 expression was
significantly increased in the TSCC tissues compared with that
noted in the paired adjacent normal tissues. We also examined
circ_0000003 expression levels in HOKs and TSCC cell lines (SCC25,
SCC4, Cal27 and SCC1), and found that circ_0000003 expression was
significantly increased in the TSCC cells when compared with the
HOKs cells (Fig. 1B). The above data
revealed that circ_0000003 is highly expressed in TSCC tissues and
cell lines. Furthermore, the clinicopathological characteristics of
the 40 TSCC patients are shown in Table
II. High expression of circ_0000003 was found to be
significantly correlated with advanced TNM stage and increased
tumor size. In addition, high expression of circ_0000003 predicted
a poor patient prognosis (Fig.
1C).
 | Figure 1.Circ_0000003 is upregulated in TSCC
tissues and cell lines and promotes TSCC cell proliferation in
vitro. (A) Circ_0000003 level was examined in TSCC tissues
(n=40) and their paired adjacent nontumor tissues (n=40).
**P<0.01 vs. the nontumor tissues. (B) Circ_0000003 level was
measured in HOK and TSCC cells (SCC25, SCC4, Cal27 and SCC1).
**P<0.01 vs. the HOK. (C) Survival rates of TSCC patients with
high and low circ_0000003 expression were analyzed via Kaplan-Meier
survival analysis. (D) Circ_0000003 shRNA (sh-circ_0000003)
transfection silenced the circ_0000003 expression in Cal27 and SCC1
cells. (E) CCK-8 assay was conducted to detect the cell
proliferative ability of Cal27 and SCC1 cells with circ_0000003
knockdown. (F) p-circ_0000003 transfection enforced the
circ_0000003 expression in SCC25 and SCC4 cells. (G) CCK-8 assay
was conducted to detect the cell proliferative ability of SCC25 and
SCC4 cells with circ_0000003 overexpression. *P<0.05 and
**P<0.01 vs. controls. circ_0000003, hsa_circ_0000003; TSCC,
tongue squamous cell carcinoma; HOK, human oral keratinocytes;
sh-circ_0000003, circ_0000003 shRNA; CCK-8, Cell Counting Kit-8;
p-circ_0000003, pcDNA3.1-circ_0000003; sh, shRNA; NC, negative
control. |
Loss-of-function and gain-of-function experiments
were performed to determine the biological functions of
circ_0000003. RT-qPCR analysis confirmed that circ_0000003 was
significantly knocked down via sh-circ_0000003 in the Cal27 and
SCC1 cells (Fig. 1D), and CCK-8 assay
showed that circ_0000003 knockdown significantly repressed the cell
proliferation of Cal27 and SCC1 cells (Fig. 1E). Meanwhile, circ_0000003 was
overexpressed via p-circ_0000003 in SCC25 and SCC4 cells (Fig. 1F), and circ_0000003 overexpression
significantly promoted the cell proliferation of SCC25 and SCC4
cells (Fig. 1G).
Circ_0000003 regulates the tumor
phenotype of TSCC cells by targeting miR-330-3p/GLS axis
Bioinformatics analysis via Circular RNA Interactome
(https://circinteractome.nia.nih.gov/)
indicated that the top five predicted potential target miRNAs of
circ_0000003 are miR-31, miR-197, miR-210, miR-330-3p and
miR-338-3p (Table III). The results
of RT-qPCR demonstrated that circ_0000003 knockdown in Cal27 cells
facilitated the expression of miR-197, miR-210, miR-330-3p and
miR-338-3p, respectively, among which the increase in miR-330-3p
expression was the most obvious (Fig.
2A). The binding sites that miR-330-3p may share with
circ_0000003 are showed in Fig. 2B.
Subsequently, the results from the dual-luciferase reporter assay
verified that miR-330-3p could bind with circ_0000003 at the
molecular level in Cal27 and SCC1 cells (Fig. 2C).
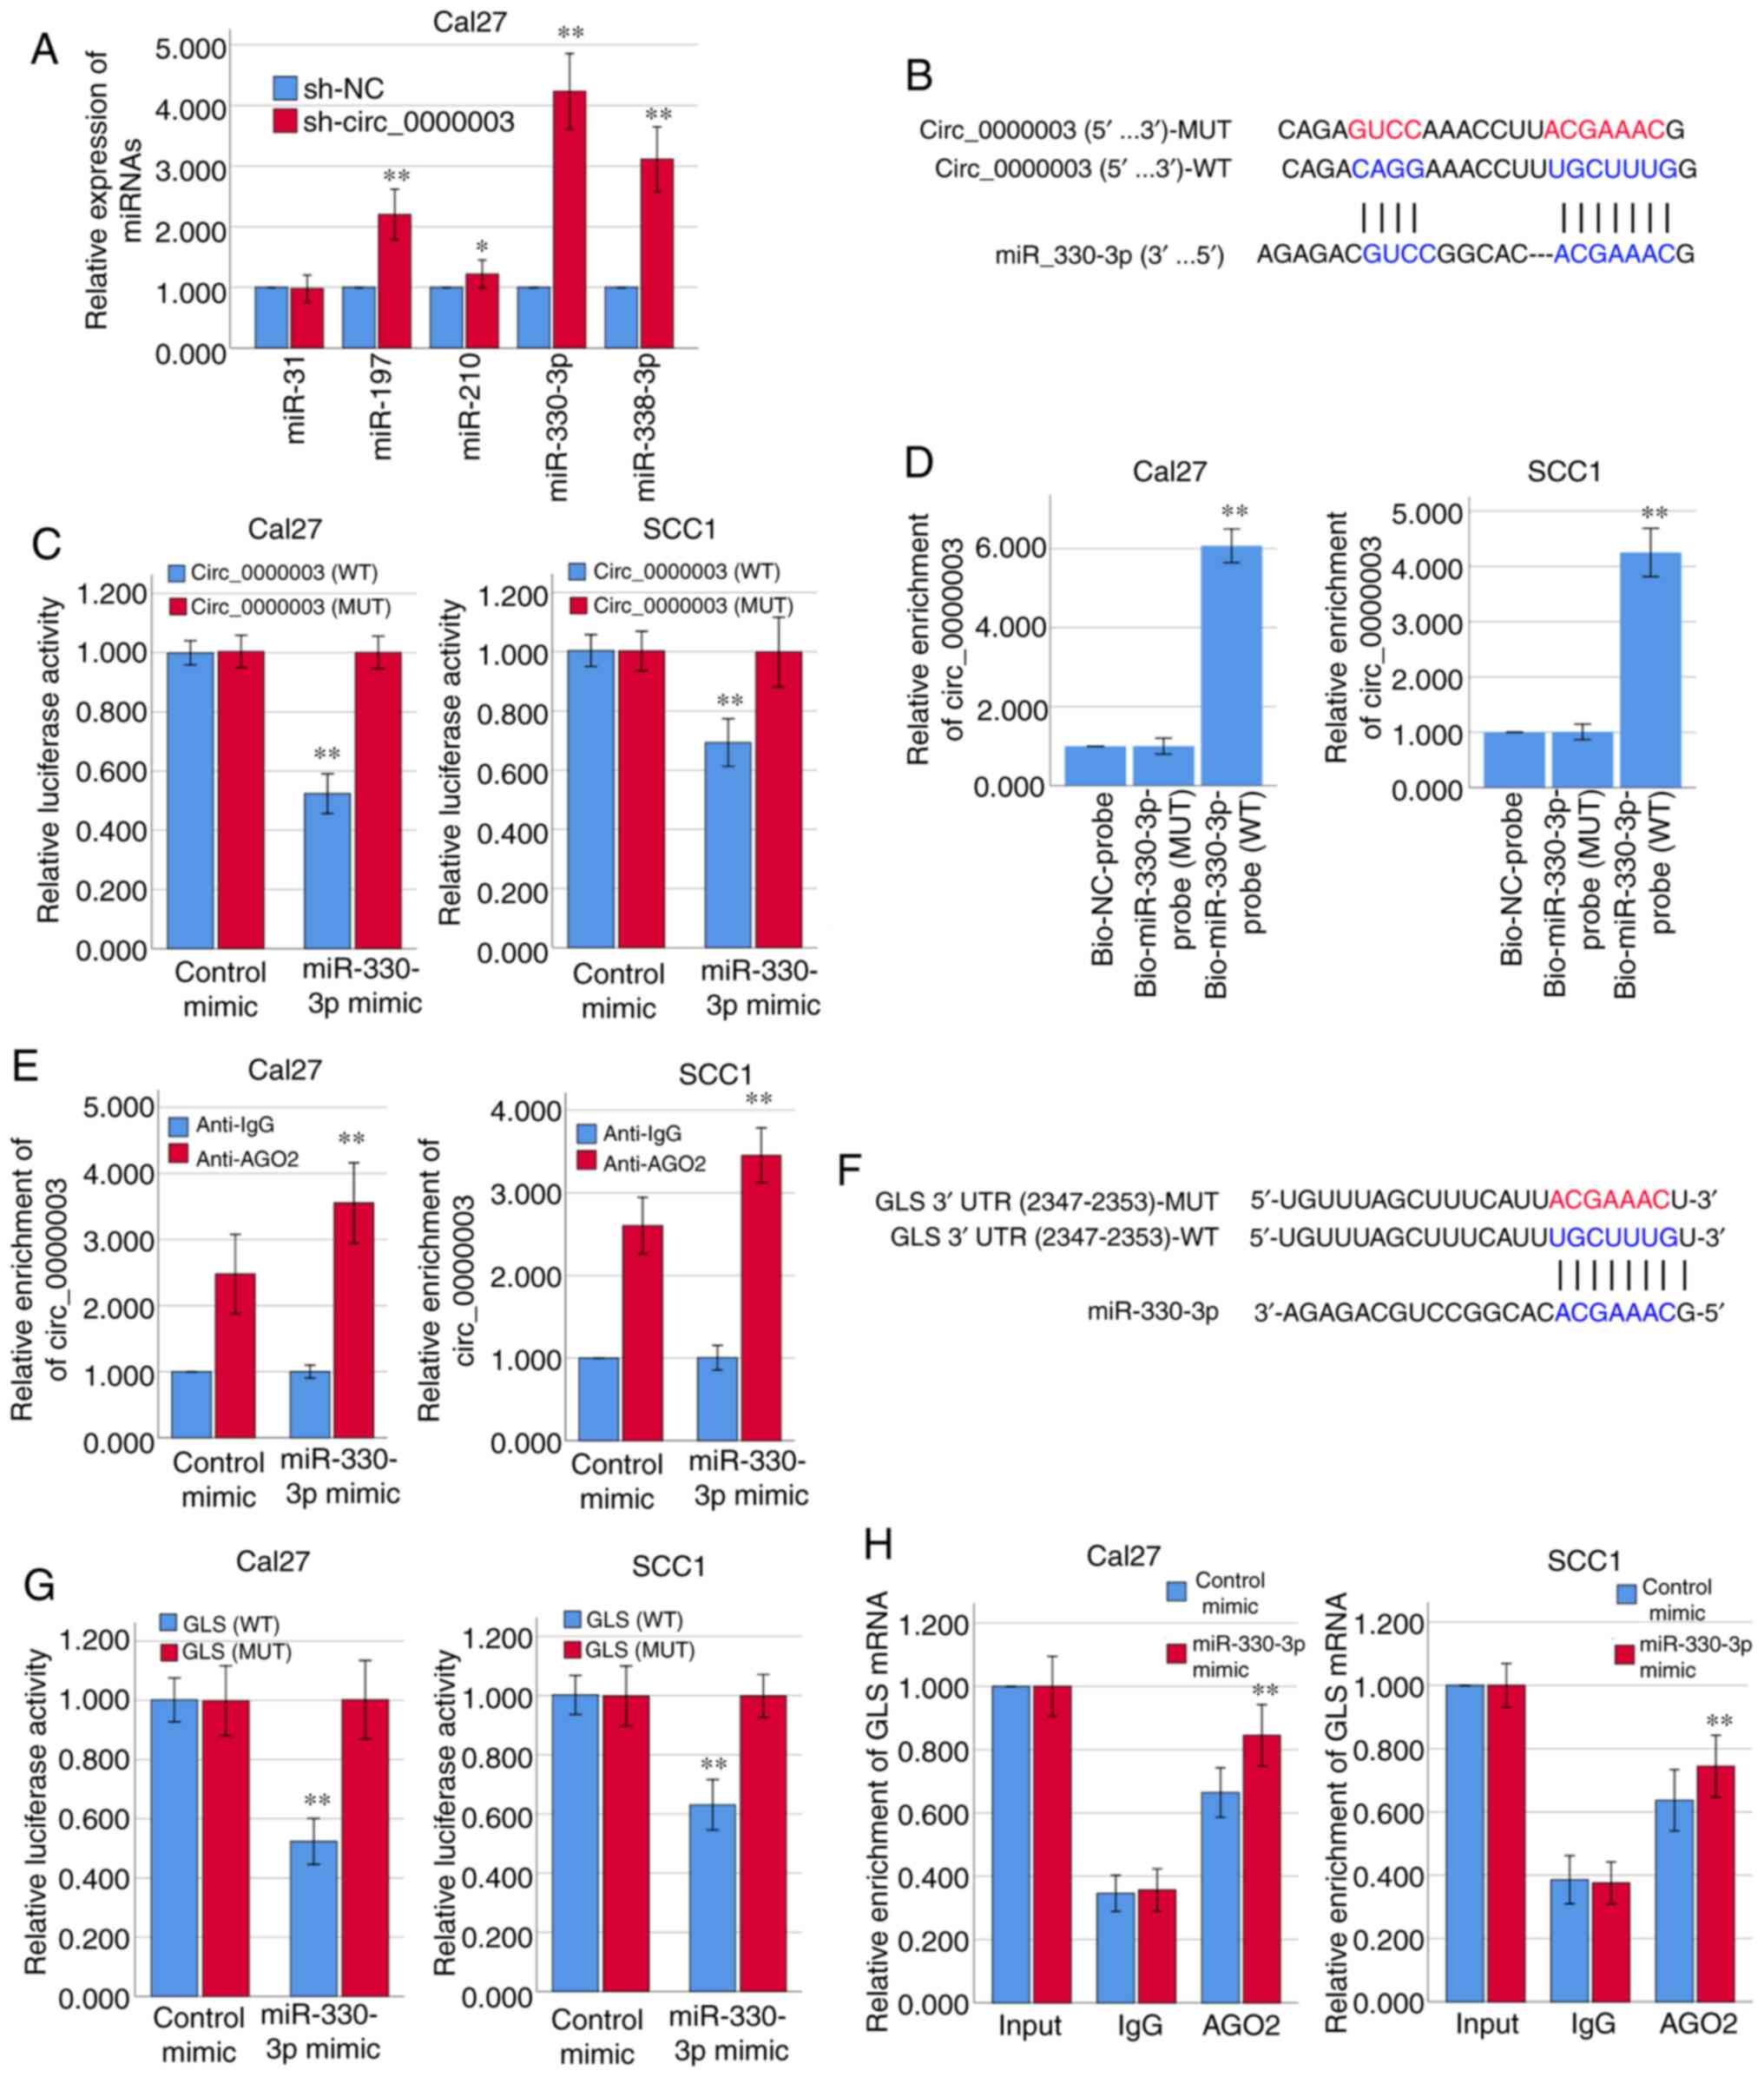 | Figure 2.Circ_0000003 modulates the tumor
phenotype of TSCC cells via the miR-330-3p/GLS axis. (A) After
transfection of sh-circ_0000003, expression levels of miR-31,
miR-197, miR-210, miR-330-3p and miR-338-3p were detected via
RT-qPCR. *P<0.05 and **P<0.01 vs. sh-NC. (B) Bioinformatics
analysis suggested that miR-330-3p may share binding sites with
circ_0000003. (C) Luciferase reporter assay indicated the molecular
level combination of miR-330-3p and circ_0000003. **P<0.01 vs.
circ_0000003(MUT). (D) Circ_0000003 was pulled down by biotinylated
miR-330-3p-WT. **P<0.01 vs. Bio-miR-330-3p-probe(MUT). (E)
AGO2-RIP followed by RT-qPCR to detect circ_0000003 enrichment
level after miR-330-3p overexpression via miR-330-3p mimics.
**P<0.01 vs. Anti-IgG. (F) Bioinformatics analysis suggested the
associability within miR-330-3p and GLS. (G) Luciferase reporter
assay indicated the covalent targeting of miR-330-3p with GLS mRNA
3′-UTR. **P<0.01 vs. GLS(MUT). (H) RIP assays using antibodies
against AGO2 or IgG were performed in cellular lysates from Cal27
and SCC1 cells, and RT-qPCR demonstrated the relative enrichment of
GLS mRNA in Cal27 and SCC1 cells transfected with miR-330-3p or
control mimics. **P<0.01 vs. control mimic. circ_0000003,
hsa_circ_0000003; TSCC, tongue squamous cell carcinoma;
sh-circ_0000003, circ_0000003 shRNA; qRT-PCR, Reverse transcription
and quantitative polymerase chain reaction; WT, wild-type; RIP, RNA
immunoprecipitation; GLS, glutaminase; 3′-UTR, 3-untranslated
region; MUT, mutant type. |
| Table III.Predicted targets of
circ_0000003. |
For further verification of the interaction between
miR-330-3p and circ_0000003, RNA pull-down assay was conducted
using biotinylated miR-330-3p-WT and miR-330-3p-MUT probes. As
shown in Fig. 2D, only miR-330-3p-WT
could bind and precipitate circ_0000003 in the cell lysates of
Cal27 and SCC1 cells. However, there was no interaction between
circ_0000003 and miR-330-3p-MUT or biotin-labeled antagonistic
miR-330-3p probe (Bio-NC-probe). To determine whether circ_0000003
binds miR-330-3p in an AGO2-dependent manner, we conducted
anti-AGO2 RIP in Cal27 and SCC1 cells overexpressing miR-330-3p via
miR-330-3p mimics, and found that circ_0000003 enrichment was
significantly increased after overexpression of miR-330-3p in Cal27
and SCC1 cells (Fig. 2E).
Furthermore, the two online bioinformatics
databases, miRDB (http://mirdb.org/) and TargetScan
(http://www.targetscan.org/vert_72/),
suggested that GLS mRNA 3′-UTR had the high associability with
miR-330-3p (Fig. 2F; Table IV). Luciferase reporter assay
verified that miR-330-3p covalently targeted GLS mRNA 3′-UTR in
Cal27 and SCC1 cells (Fig. 2G).
Moreover, RIP assay revealed a higher level of GLS mRNA enrichment
in the AGO2 group after overexpression of miR-330-3p in Cal27 and
SCC1 cells (Fig. 2H). Therefore, we
here found that circ_0000003 has a direct effect on miR-330-3p, and
miR-330-3p has a direct effect on GLS mRNA 3′-UTR.
| Table IV.Prediction of binding sites of GLS
3′-UTR and mir-330-3p. |
Table IV.
Prediction of binding sites of GLS
3′-UTR and mir-330-3p.
|
| Predicted
consequential pairing of target region (top) and miRNA
(bottom) | Site type | Context++
score | Context++ score
percentile | Weighted context++
score | Conserved branch
length | PCT |
|---|
| Position 2347–2353
of GLS 3′-UTR |  | 7mer-m8 | −0.11 | 92 | −0.11 | 3.834 | N/A |
| hsa-miR-330-3p |
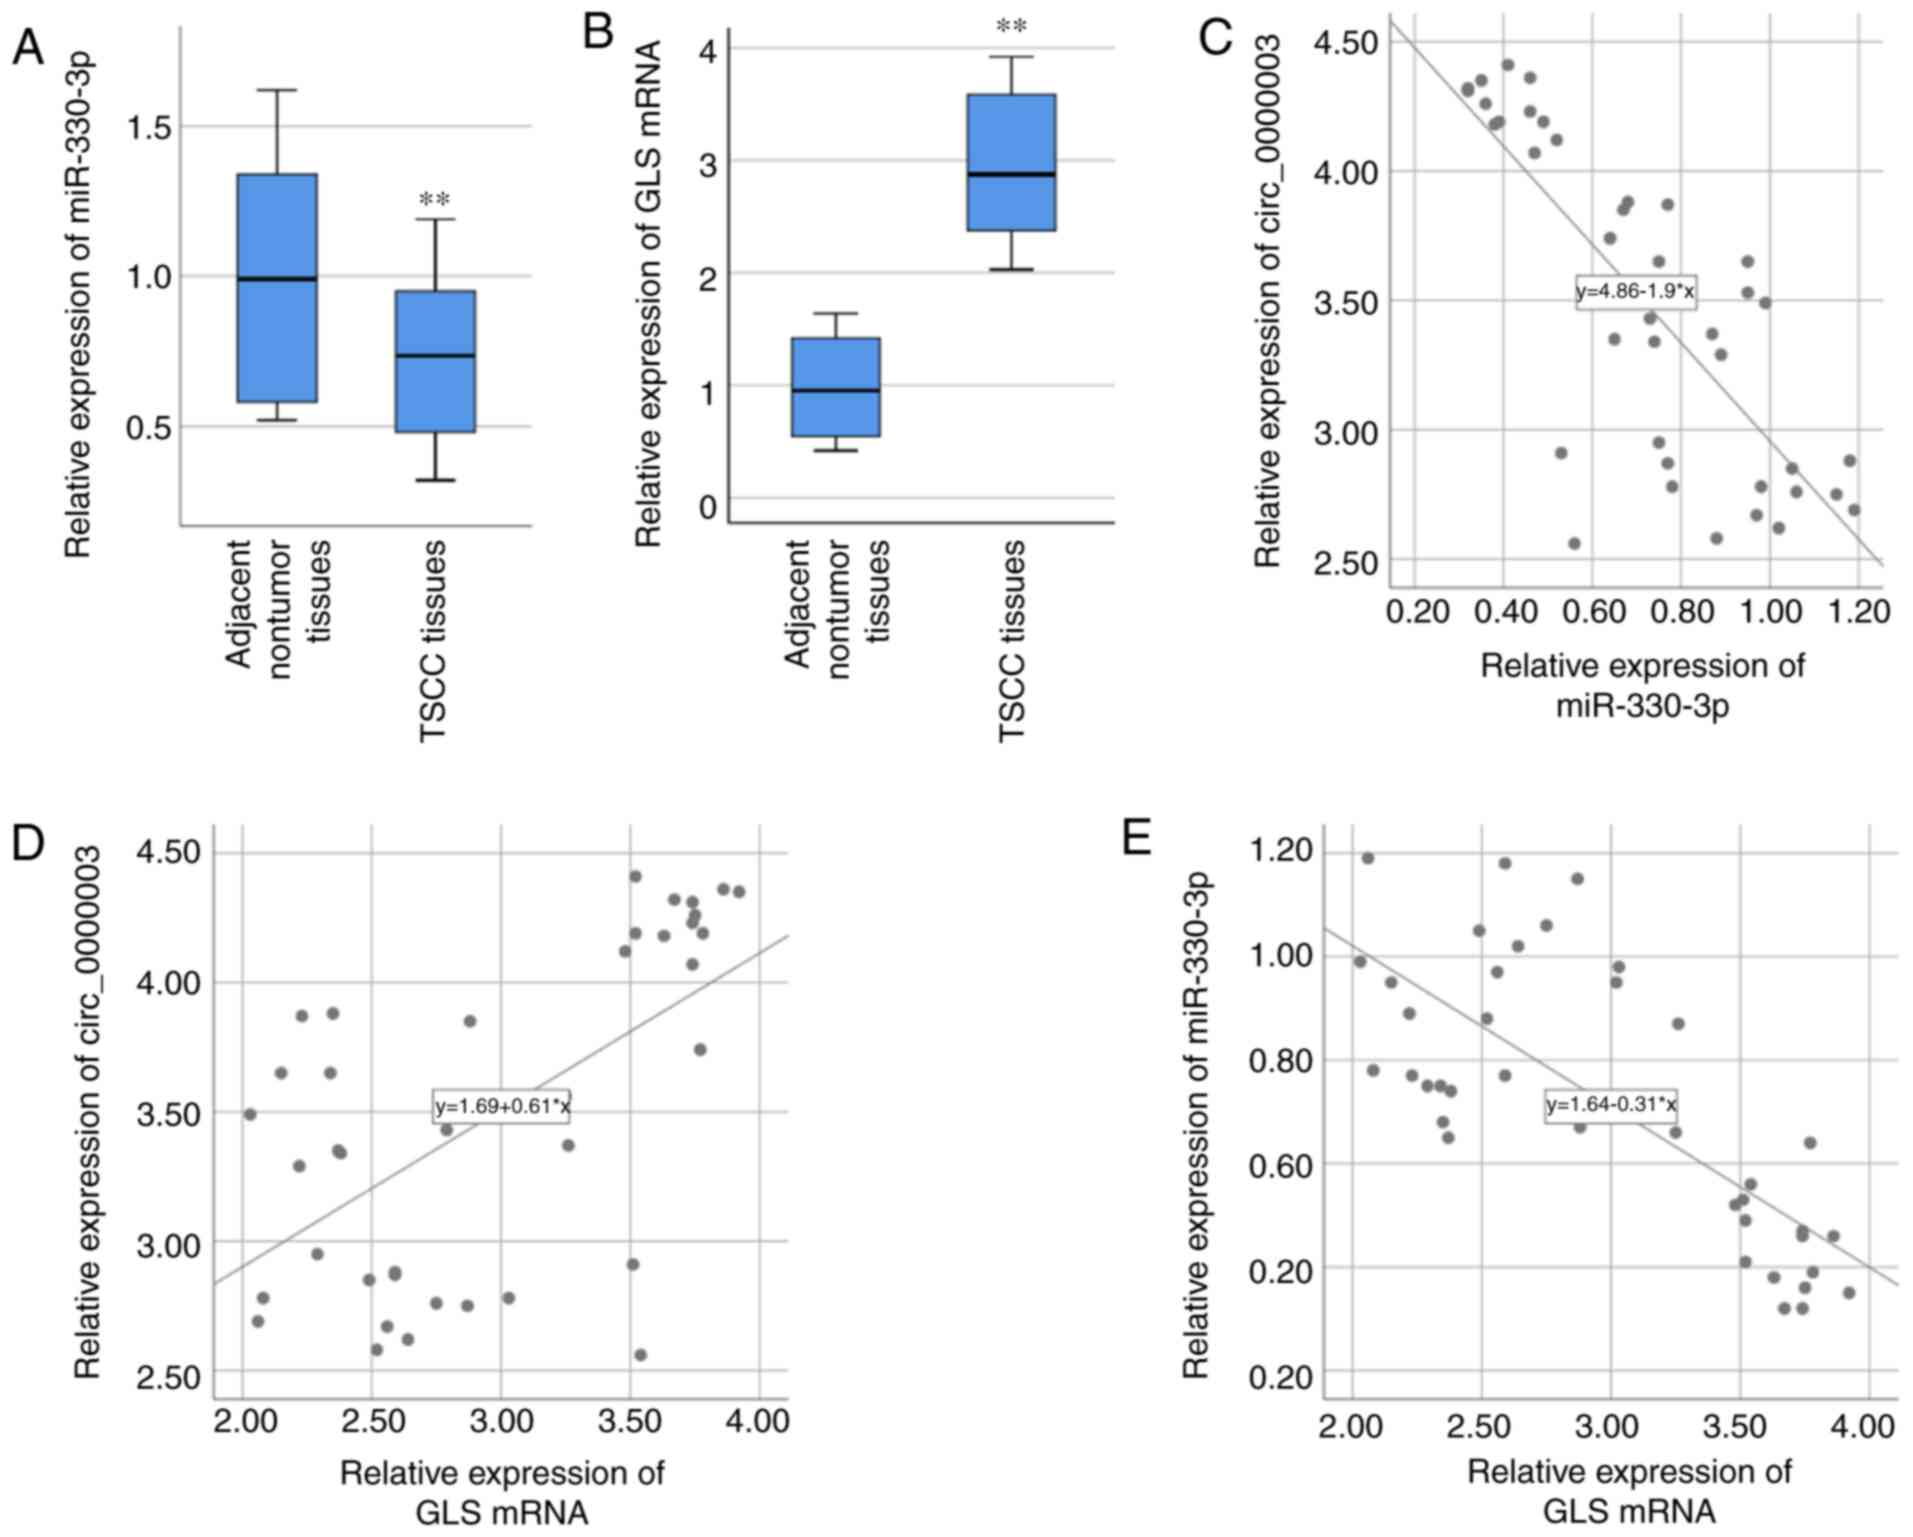
Association of circ_0000003,
miR-330-3p and GLS in TSCC
Based on the above bioinformatics analyses and
related verification experiments, there may be certain interactions
among circ_0000003, miR-330-3p and GLS. Therefore, miR-330-3p and
GLS were chosen for our further studies. miR-330-3p expression in
the 40 specimens of TSCC tissues was examined via RT-qPCR, and the
result demonstrated that miR-330-3p expression was significantly
lower in TSCC tissues compared with that noted in the adjacent
nontumor tissues (Fig. 3A). GLS mRNA
expression in the 40 specimens of TSCC tissues was also examined
via RT-qPCR, and the result demonstrated that GLS mRNA expression
was significantly higher in TSCC tissues compared with that found
in the paired adjacent normal tissues (Fig. 3B). After statistically analyzing the
associations of their expressions, circ_0000003 expression was
found to be negatively correlated with miR-330-3p expression
(R=−0.783, P<0.01, Fig. 3C), while
positively correlated with GLS mRNA expression (R=0.606, P<0.01,
Fig. 3D). Moreover, miR-330-3p
expression was negatively correlated with GLS mRNA expression
(R=−0.753, P<0.01, Fig. 3E).
Circ_0000003 downregulates miR-330-3p
expression and upregulates GLS expression in TSCC cells
RT-qPCR assay demonstrated that knockdown of
circ_0000003 significantly promoted miR-330-3p expression in Cal27
and SCC1 cells (Fig. 4A), while
overexpression of circ_0000003 significantly inhibited miR-330-3p
expression in the SCC25 and SCC4 cells (Fig. 4B). Furthermore, RT-qPCR assay
indicated that overexpression of miR-330-3p via miR-330-3p mimics
significantly decreased GLS mRNA expression in Cal27 and SCC1 cells
(Fig. 4C and D), while inhibition of
miR-330-3p via miR-330-3p inhibitors significantly increased GLS
mRNA expression in the SCC25 and SCC4 cells (Fig. 4E and F). Coincidentally, western blot
analysis demonstrated that overexpression of miR-330-3p decreased
GLS protein expression in Cal27 and SCC1 cells (Fig. 4G), while inhibition of miR-330-3p
increased GLS protein expression in SCC25 and SCC4 cells (Fig. 4H).
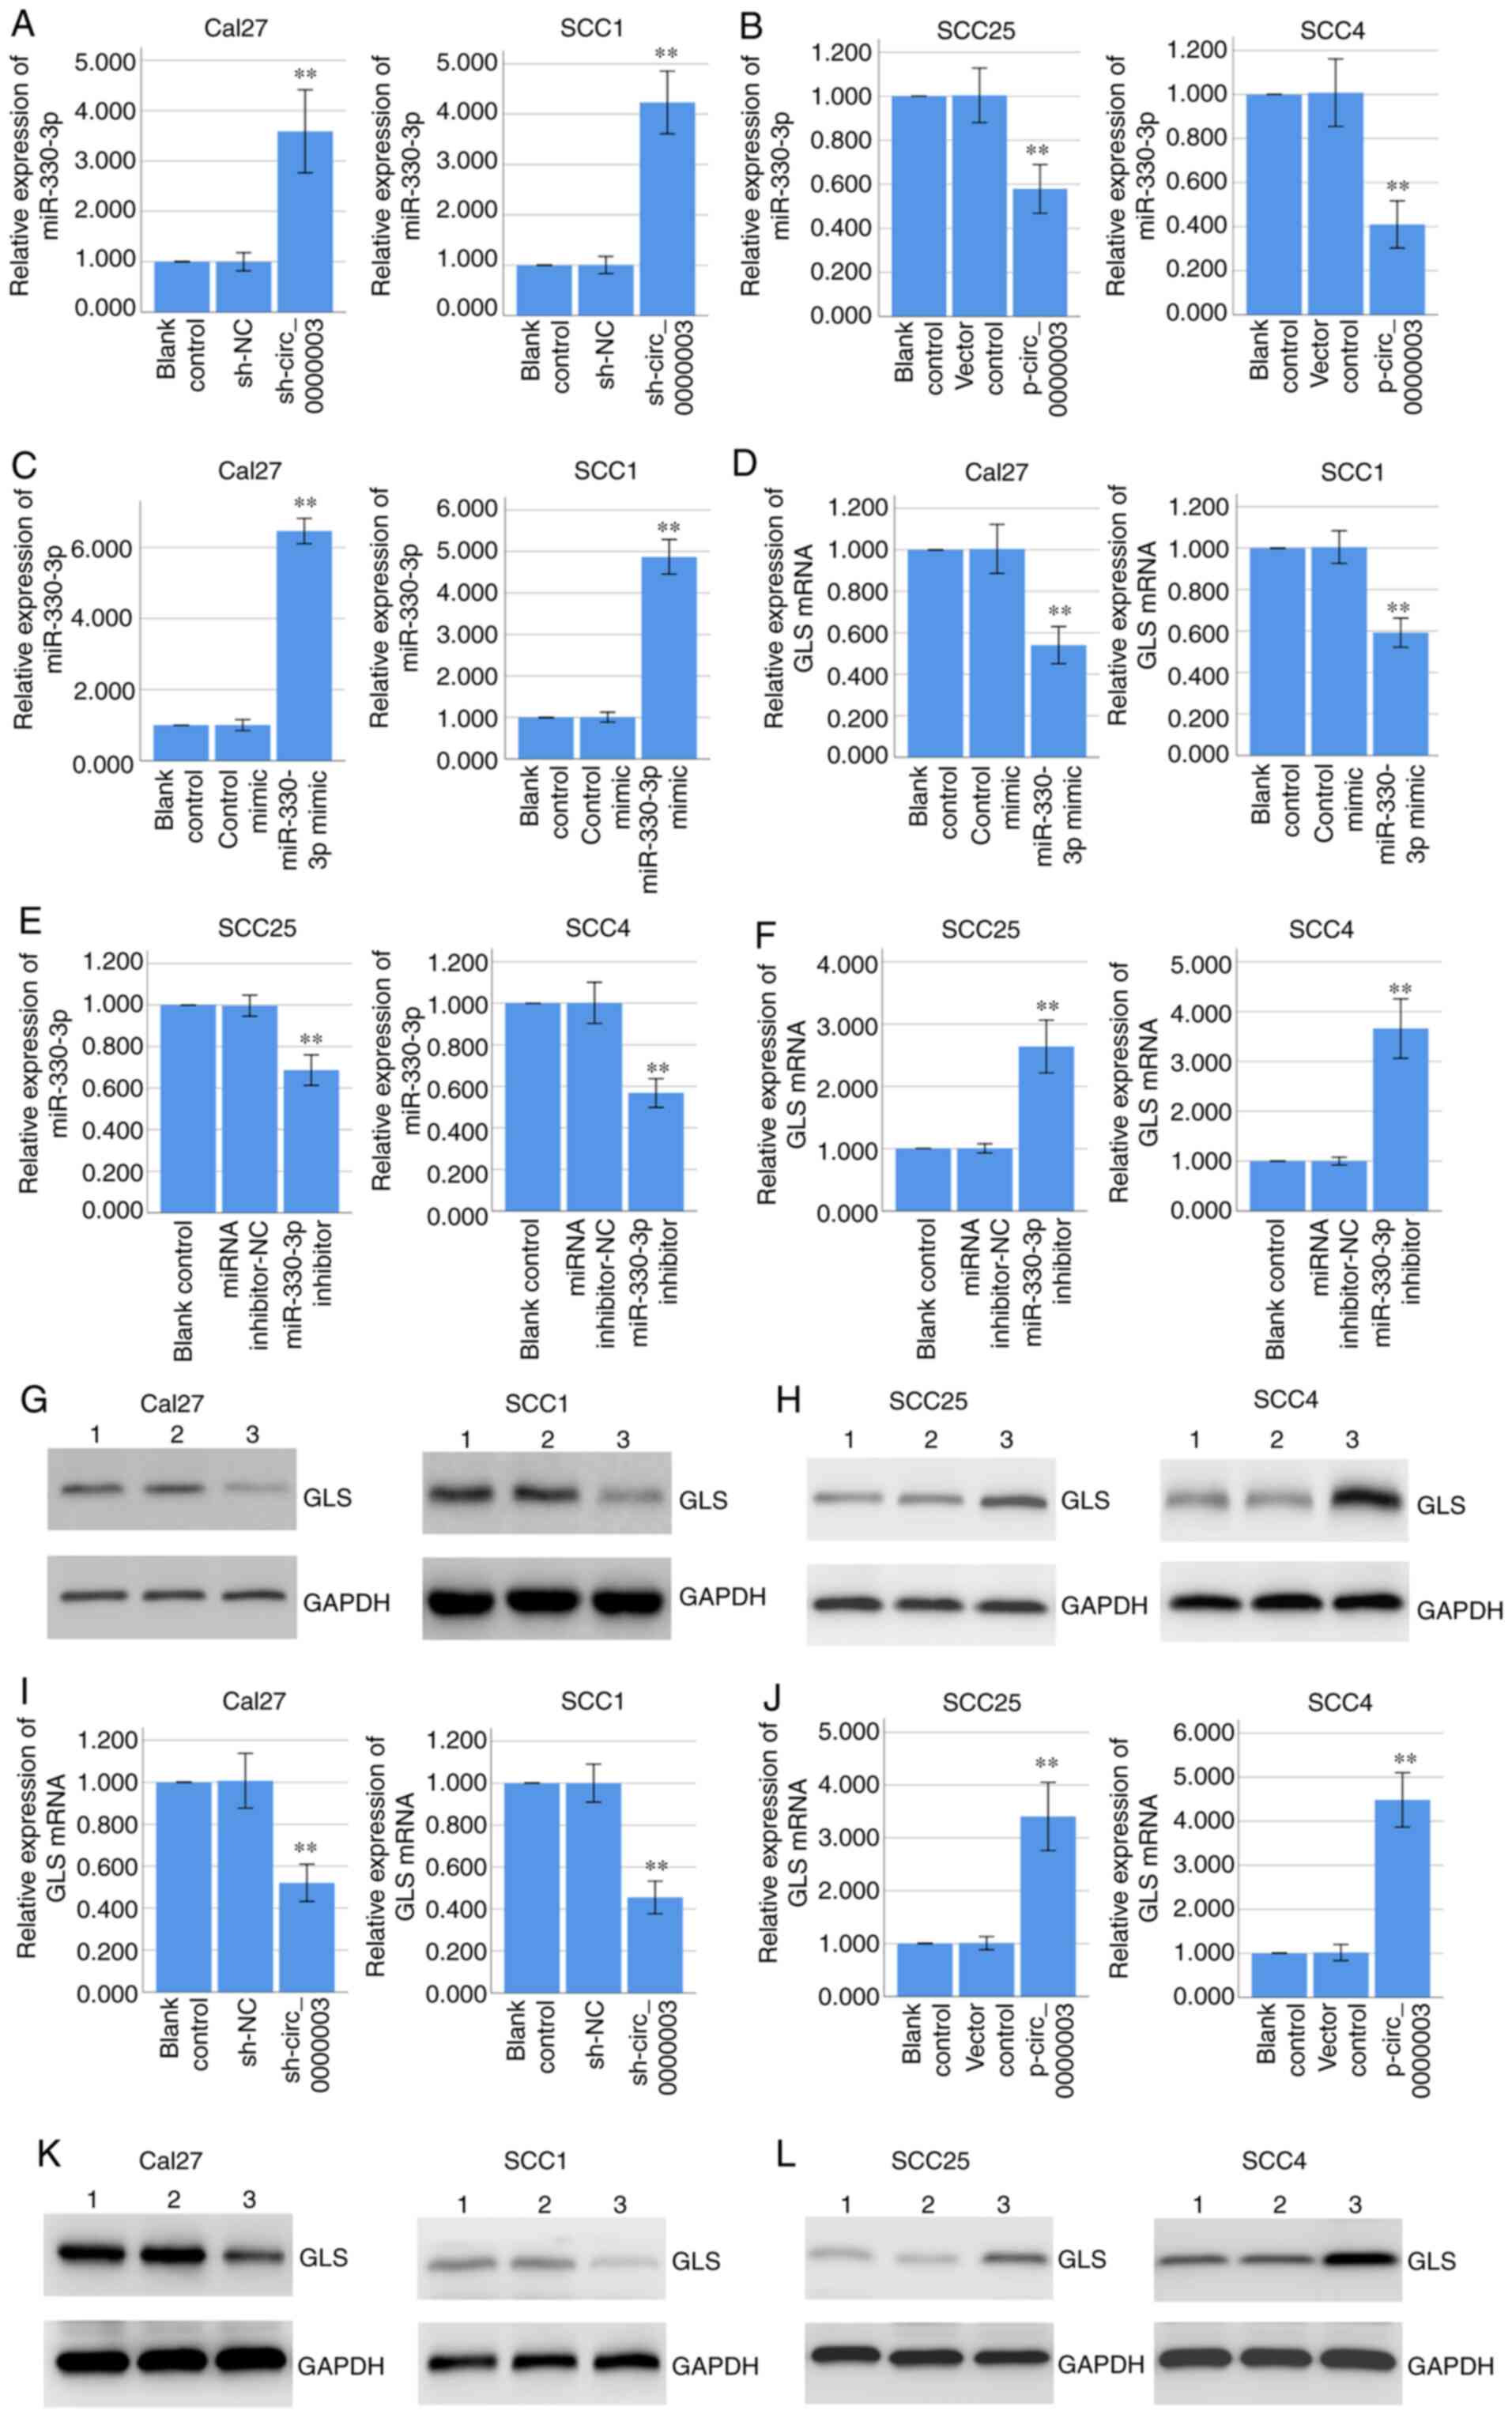 | Figure 4.Circ_0000003 regulates miR-330-3p and
GLS expressions, and miR-330-3p regulates GLS expression. (A and B)
RT-qPCR determined the miR-330-3p expression in Cal27 and SCC1
cells transfected with sh-NC or sh-circ_0000003, and in SCC25 and
SCC4 cells transfected with empty vector or p-circ_0000003. (C and
D) RT-qPCR determined the miR-330-3p and GLS mRNA expression in
Cal27 and SCC1 cells transfected with control mimic or miR-330-3p
mimic. (E and F) RT-qPCR determined the miR-330-3p and GLS mRNA
expression in SCC25 and SCC4 cells transfected with miRNA
inhibitor-NC or miR-330-3p inhibitor. (G) Western blot analysis
determined the GLS protein expression in Cal27 and SCC1 cells
transfected with control mimic or miR-330-3p mimic. Lane 1, blank
control; lane 2, control mimic; lane 3, miR-330-3p mimic. (H)
Western blot analysis determined the GLS protein expression in
SCC25 and SCC4 cells transfected with miRNA inhibitor-NC or
miR-330-3p inhibitor. Lane 1, blank control; lane 2, miRNA
inhibitor-NC; lane 3, miR-330-3p inhibitor. (I and J) RT-qPCR
determined the GLS mRNA expression in Cal27 and SCC1 cells
transfected with sh-NC or sh-circ_0000003, and in SCC25 and SCC4
cells transfected with empty vector or p-circ_0000003. (K) Western
blot analysis determined the GLS protein expression in Cal27 and
SCC1 cells transfected with sh-NC or sh-circ_0000003. Lane 1, blank
control; Lane 2, sh-NC; Lane 3, sh-circ_0000003. (L) Western blot
analysis determined the GLS protein expression in SCC25 and SCC4
cells transfected with empty vector or p-circ_0000003. Lane 1,
blank control; lane 2, vector control; lane 3, p-circ_0000003.
**P<0.01 vs. controls. circ_0000003, hsa_circ_0000003; GLS,
glutaminase; RT-qPCR, reverse transcription and quantitative
polymerase chain reaction; sh, shRNA; miRNA, microRNA; NC, negative
control; sh-circ_0000003, circ_0000003 shRNA; p-circ_0000003,
pcDNA3.1-circ_0000003. |
Coincidentally, RT-qPCR assay indicated that
knockdown of circ_0000003 significantly decreased GLS mRNA
expression in Cal27 and SCC1 cells (Fig.
4I), while overexpression of circ_0000003 significantly
increased GLS mRNA expression in the SCC25 and SCC4 cells (Fig. 4J). Coincidentally, western blot
analysis demonstrated that circ_0000003 knockdown decreased GLS
protein expression in Cal27 and SCC1 cells (Fig. 4K), while circ_0000003 overexpression
increased GLS protein expression in SCC25 and SCC4 cells (Fig. 4L). Overall, our results indicated that
circ_0000003 downregulated miR-330-3p expression and upregulated
GLS expression, and miR-330-3p downregulated GLS expression,
suggesting circ_0000003 may promote GLS expression by restraining
miR-330-3p.
Circ_0000003 regulates cell invasion
and migration in TSCC cells
Interestingly, transfection of sh-circ_0000003
caused a dramatic reduction in cell invasion (Fig. 5A) and migration (Fig. 5B and C). To clarify whether miR-330-3p
was involved in the inhibition of cell invasion and migration
capability elicited by circ_0000003 knockdown, co-transfection
experiments were performed in Cal27 cells. As shown in Fig. 5D-F, co-transfection of sh-NC +
miR-330-3p inhibitor resulted in significantly increased cell
invasion and migration capability. Meanwhile, the transfection of
miR-330-3p inhibitor reversed the decrease in cell invasion and
migration induced by sh-circ_0000003 (Fig. 5D-F). These results indicated that the
cell invasion and migration were significantly restrained by
circ_0000003 knockdown, and then it was reversed after transfection
with miR-330-3p inhibitor in TSCC cells.
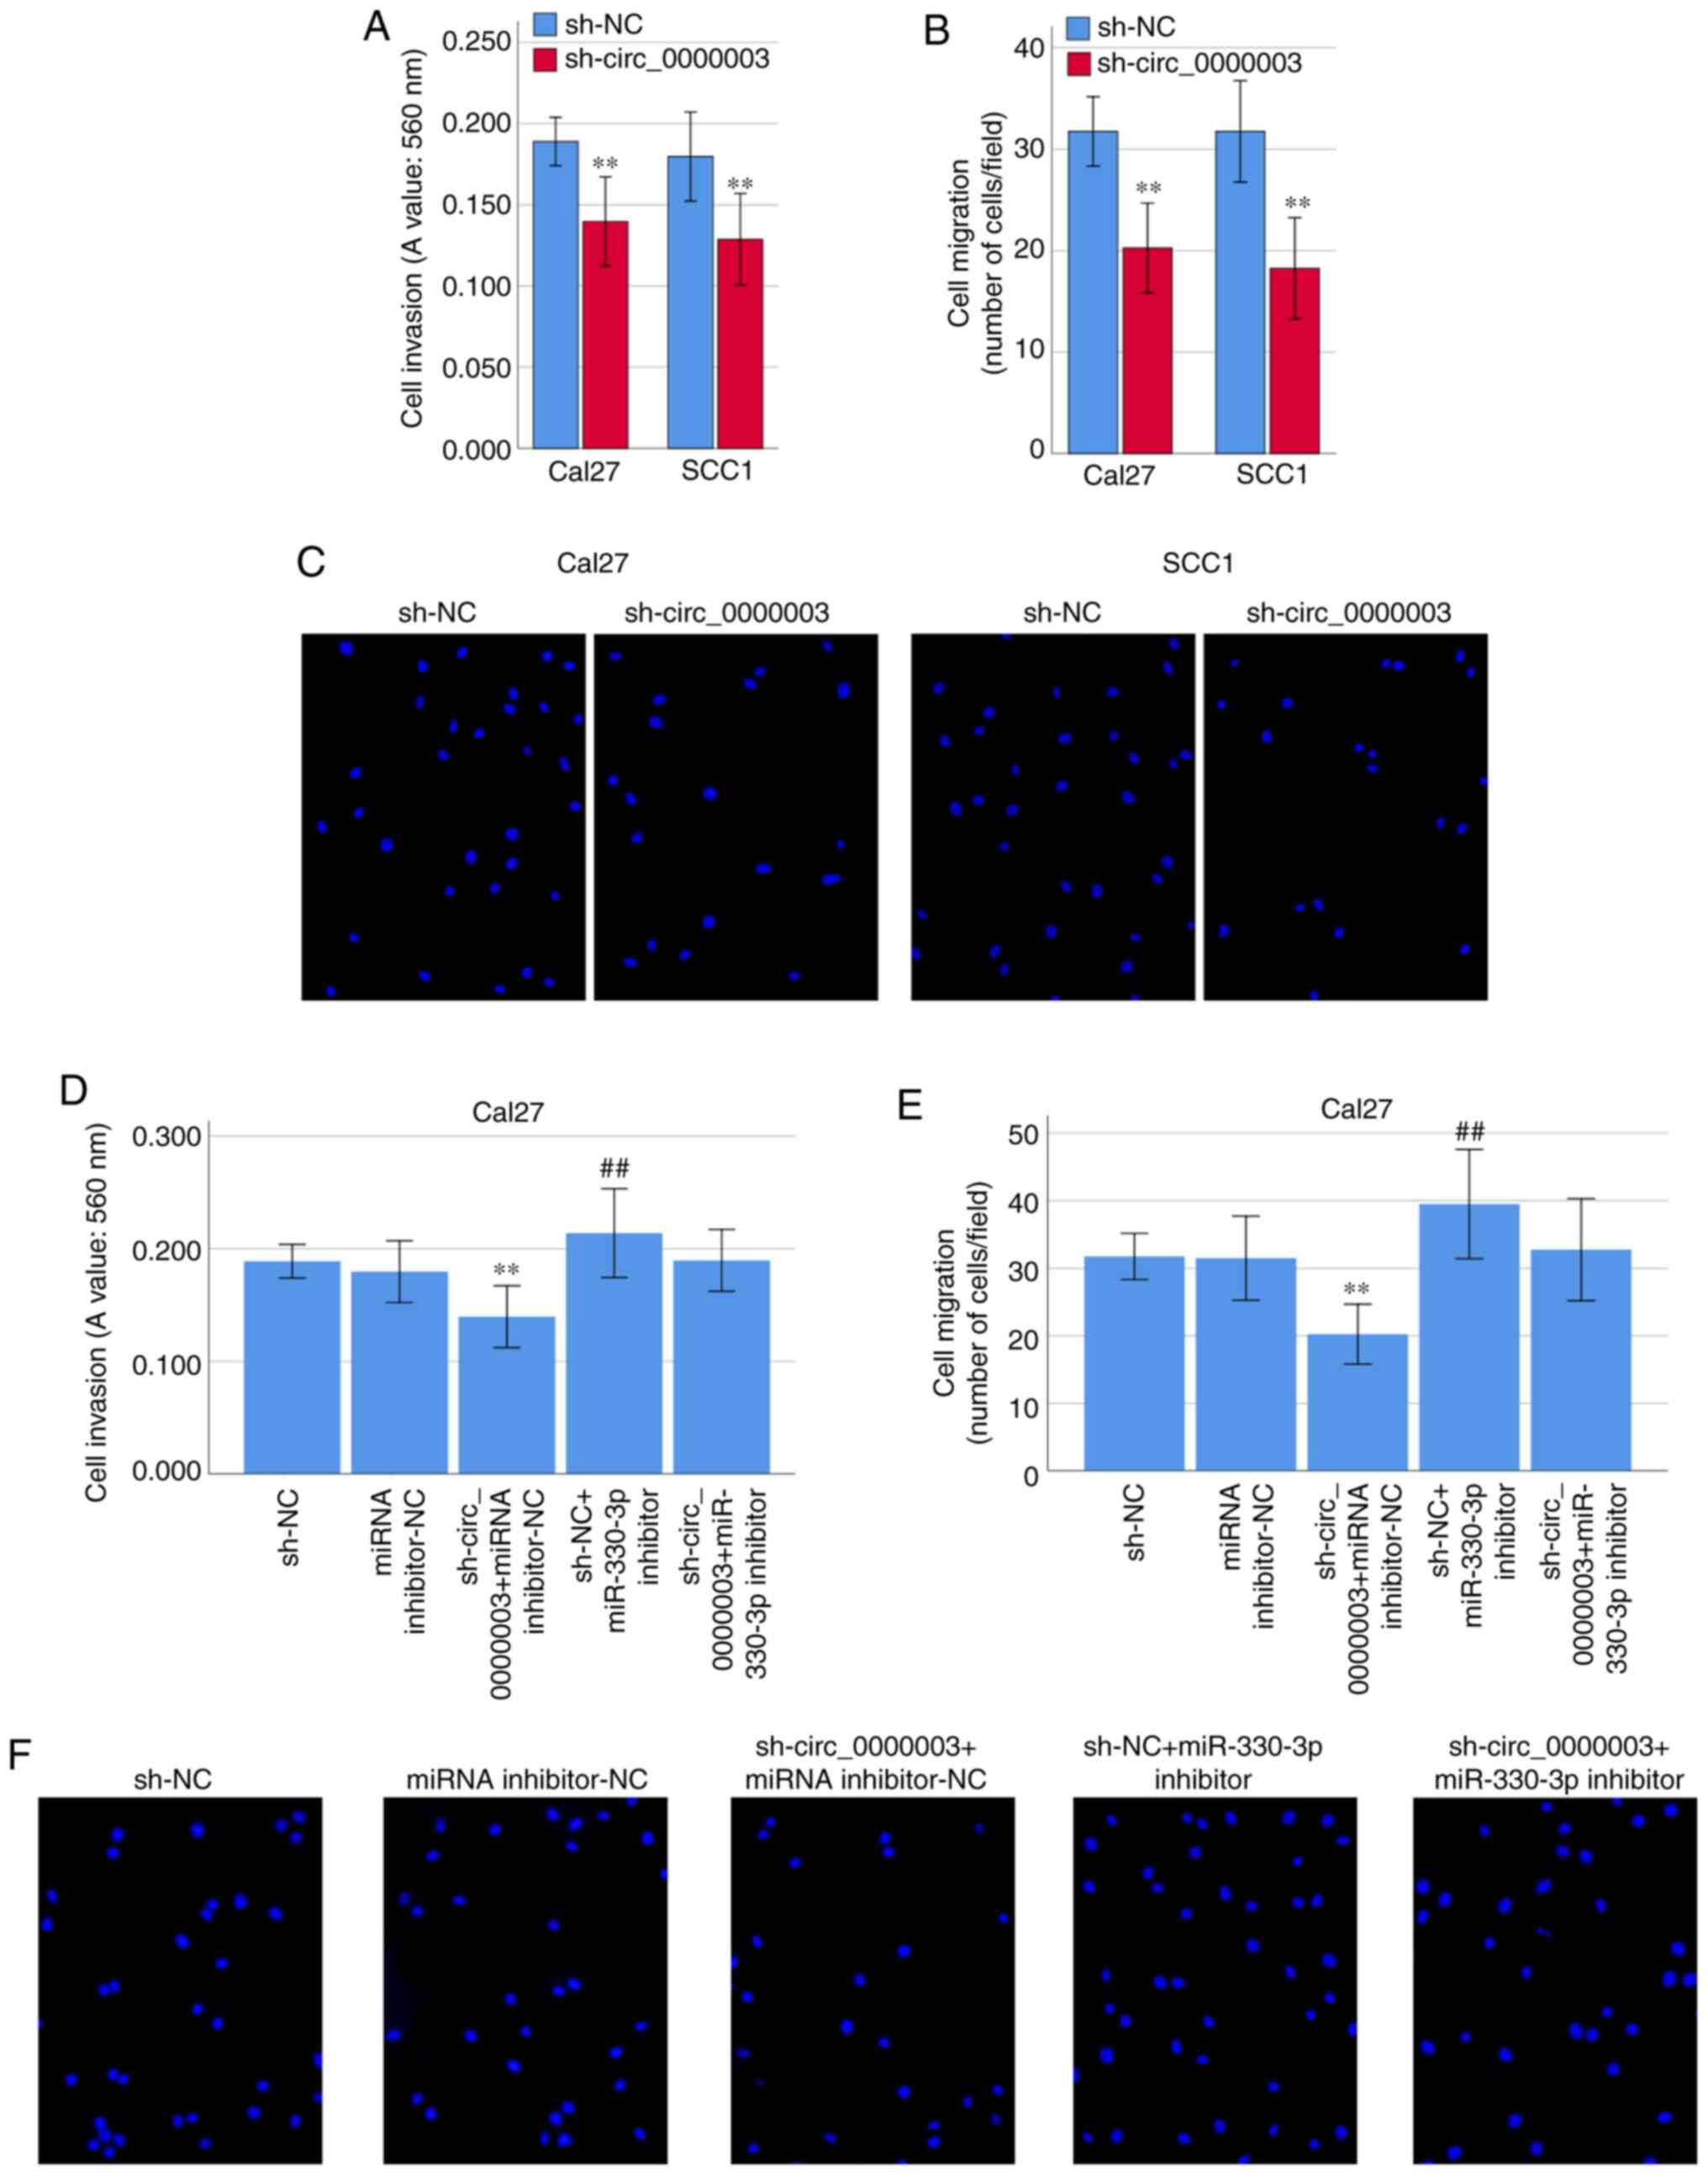 | Figure 5.Circ_0000003 facilitates cell
invasion and migration capability in TSCC by inhibiting miR-330-3p.
(A) Cell invasion levels in TSCC cells after circ_0000003
knockdown. (B) Cell migration levels in TSCC cells after
circ_0000003 knockdown. (C) Representative images of the cell
migration in Cal27 and SCC1 cells after circ_0000003 knockdown
(original magnification, ×200). (D) Cell invasion and (E) migration
capability in Cal27 cells transfected with sh-NC, miRNA
inhibitor-NC, sh-circ_0000003 + miRNA inhibitor-NC, sh-NC +
miR-330-3p inhibitor, and sh-circ_0000003 + miR-330-3p inhibitor.
**P<0.01 vs. sh-NC; ##P<0.01 vs. miRNA
inhibitor-NC. (F) Representative images of the cell migration in
Cal27 cells after the transfections (original magnification, ×200).
circ_0000003, hsa_circ_0000003; TSCC, tongue squamous cell
carcinoma; sh-circ_0000003, circ_0000003 shRNA; sh, shRNA; NC,
negative control. |
Circ_0000003 regulates glutamine
metabolism in TSCC cells
Since some circRNAs have been found to be involved
in the progression of glutamine metabolism (14), we asked whether circ_0000003 could
facilitate TSCC progression by regulating glutamine metabolism.
Interestingly, transfection of sh-circ_0000003 caused a dramatic
reduction in glutamine consumption, α-KG production and ATP
production in TSCC cells (Fig. 6A-C).
To clarify whether miR-330-3p was involved in the inhibition of
glutamine metabolism elicited by circ_0000003 knockdown,
co-transfection experiments were performed in Cal27 cells. As shown
in Fig. 6D-F, co-transfection of
sh-NC + miR-330-3p inhibitor resulted in significantly increased
glutamine consumption, α-KG production, and ATP production.
Meanwhile, miR-330-3p inhibitor transfection reversed the decrease
in glutamine consumption, α-KG production and ATP production
induced by sh-circ_0000003 transfection (Fig. 6D-F). These results indicated that the
glutamine consumption, α-KG production and ATP production were
significantly restrained by circ_0000003 knockdown, and then it was
reversed after transfection with miR-330-3p inhibitor in TSCC
cells.
 | Figure 6.Circ_0000003 facilitates glutamine
metabolism in TSCC by inhibiting miR-330-3p. (A) Glutamine
consumption, (B) cellular α-KG production, and (C) ATP production
levels in TSCC cells after circ_0000003 knockdown. (D) Glutamine
consumption, (E) α-KG production, and (F) ATP production levels in
Cal27 cells transfected with sh-NC, miRNA inhibitor-NC,
sh-circ_0000003 + miRNA inhibitor-NC, sh-NC + miR-330-3p inhibitor,
and sh-circ_0000003 + miR-330-3p inhibitor. *P<0.05, **P<0.01
vs. sh-NC; #P<0.05, ##P<0.01 vs. miRNA
inhibitor-NC. circ_0000003, hsa_circ_0000003; TSCC, tongue squamous
cell carcinoma; α-KG, α-ketoglutarate; ATP, adenosine triphosphate;
sh-circ_0000003, circ_0000003 shRNA; sh, shRNA; NC, negative
control. |
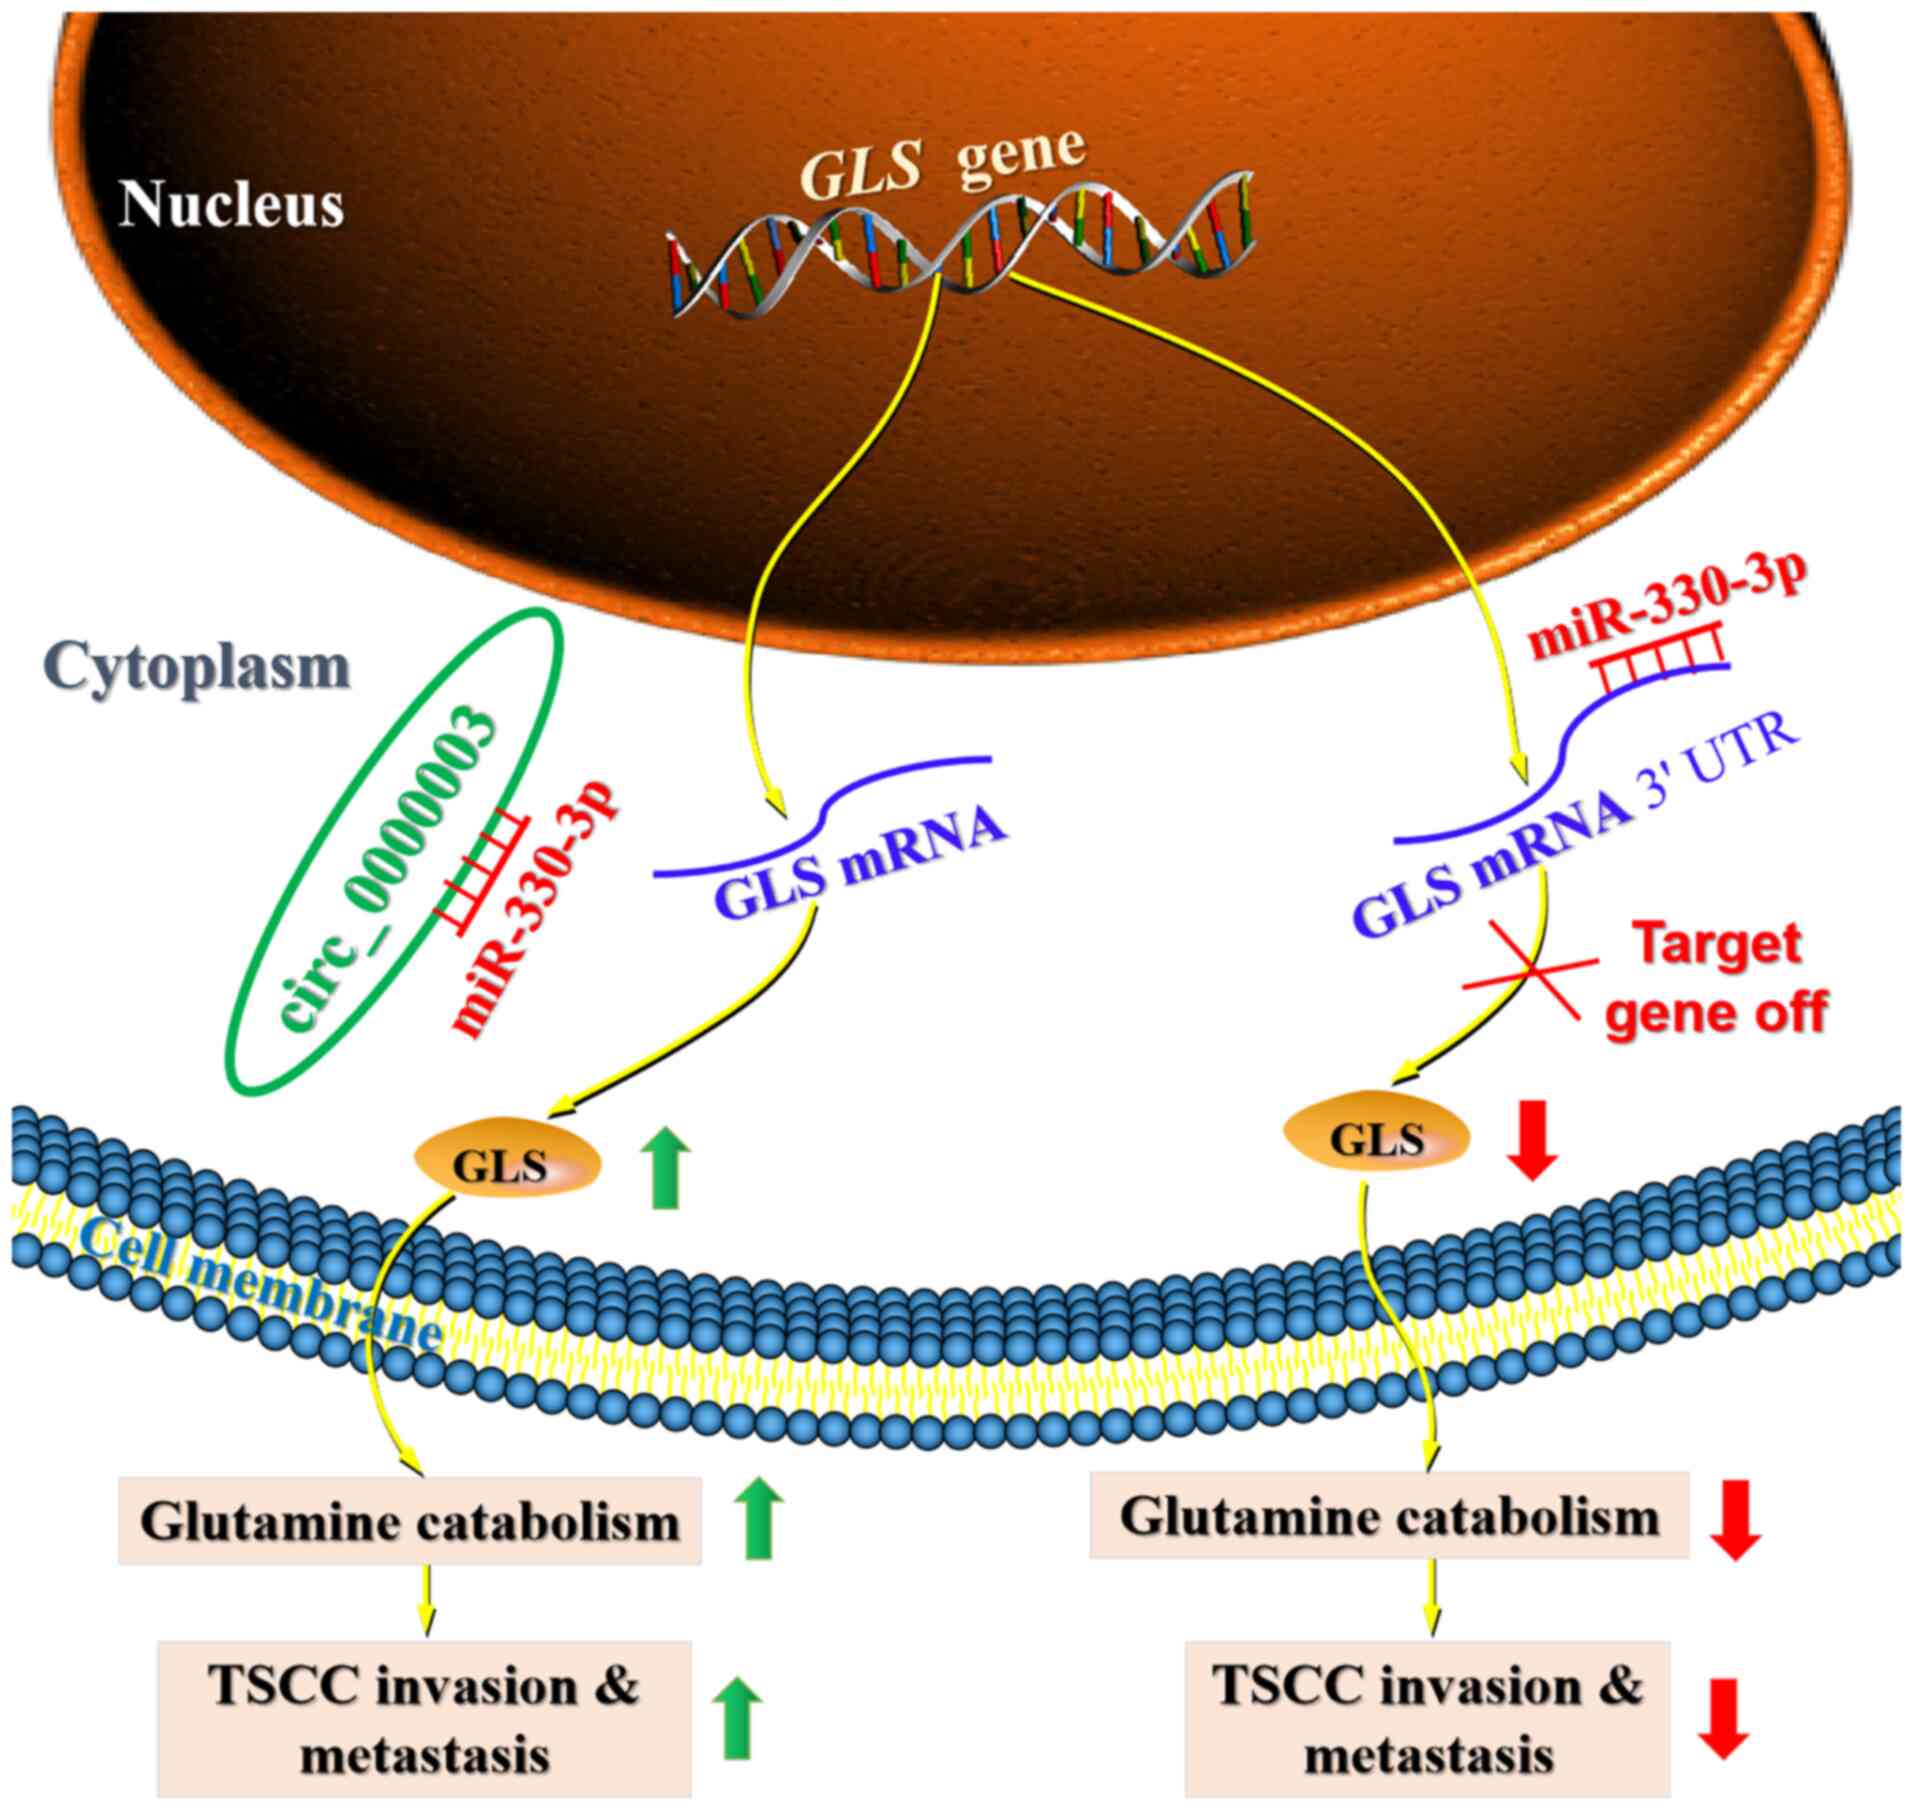
Discussion
Recently, a number of circulating RNAs (circRNAs)
have been revealed to participate in the progression of tongue
squamous cell carcinoma (TSCC) by sponging miRNAs to regulate
protein-coding target gene expression (7–9). Moreover,
some previous studies have demonstrated that circRNAs play a
regulatory role in tumor progression by regulating cell metabolism,
including glucose metabolism, glutamine catabolism and lipid
metabolism (14). However, to date,
there is no report on how circRNAs affect TSCC progression by
regulating cell metabolism. Our current findings provide evidence
demonstrating the essential biological relevance of circRNAs in
TSCC, and uncover that dysregulation of circ_0000003 may be
responsible for TSCC progression. Importantly, the current research
demonstrated that circ_0000003 elevated glutaminase (GLS)
expression by sponging miR-330-3p, leading to promotion of TSCC
glutamine catabolism, invasion and metastasis (Fig. 7).
Circ_0000003 has been demonstrated to facilitate the
cell proliferation, invasion and migration of NSCLC cells via
targeting the miR-338-3p/IRS2 axis (11). However, circ_0000003 has not been
systematically studied in other tumors. Because there are very few
articles concerning circ_0000003, we deduced the hypothesis about
circ_0000003 mainly through bioinformatics analysis and the study
about circ_0000003 in NSCLC (11).
Thus, we detected circ_0000003 expression in TSCC tissues and cell
lines, and found that circ_0000003 was upregulated in TSCC tissues
and cell lines, and high circ_0000003 expression was associated
with poor patient prognosis and advanced tumor progression,
suggesting that circ_0000003 has an oncogenic function in TSCC.
Here, we used bioinformatics online analysis software to speculate
possible targets for circ_0000003 to elucidate the potential
mechanism of circ_0000003 in TSCC. Then, we found that miR-330-3p
expression was strongly increased by circ_0000003 knockdown in TSCC
cells compared with other potential targeting miRNAs. Therefore,
miR-330-3p was chosen as a candidate for further research.
Several studies have revealed that miR-330-3p exerts
a tumor-suppressive effect in various tumors (23,26–28). For
instance, circ-0016068 restrained miR-330-3p expression and
facilitated insertion region-1 (BMI-1) expression to promote the
cell proliferation, invasion and migration of prostate cancer cells
(23). Moreover, upregulation of
miR-330-3p restricted the cell proliferation, colony formation and
invasion of laryngeal squamous cell carcinoma (LSCC) cells by
targeting transformer-2 protein homolog β (Tra2β) to repress Akt
activation (27). In our current
research, miR-330-3p expression was markedly reduced in TSCC
tissues, and was negatively correlated with circ_0000003 expression
in the TSCC tissues. More importantly, our present study revealed
that circ_0000003 was a decoy for miR-330-3p, and circ_0000003
participated in the progression of TSCC by sponging miR-330-3p.
Increasing studies indicate that circRNAs contain
miRNA binding sites and function as competing endogenous RNAs
(ceRNAs) that sponge downstream miRNAs and restrain their
expression and functions (11,29). For
instance, circ_0000003 has been shown to sponge miR-338-3p and
restrain miR-338-3p expression, leading to promotion of cell
proliferation and invasion of NSCLC cells (11). In the current research, our gain- and
loss-of-function experiments indicated that circ_0000003 knockdown
facilitated miR-330-3p expression, whereas circ_0000003
overexpression repressed miR-330-3p expression. Moreover, our
rescue experiments demonstrated that circ_0000003 facilitated cell
proliferation, migration and invasion by counteracting the
miR-330-3p-mediated effects on TSCC cells. Therefore, our current
study presents strong evidence for a tumor-promoting role of the
circ_0000003/miR-330-3p interaction in TSCC.
Increasing evidence has revealed that miRNAs can
bind to the 3′-UTR of their downstream target genes, thereby
inhibiting the target gene expression at the post-transcriptional
levels (30). Thus, we here used two
bioinformatics databases (miRDB and TargetScan) to speculate
potential target genes for miR-330-3p, and found GLS may be a
target gene of miR-330-3p. GLS is a key enzyme involved in the
progression of glutamine metabolism, and functions as a
tumor-promoting factor in various tumors (31). The knockdown of GLS repressed cell
proliferation and induced apoptosis by inhibiting the Wnt/β-catenin
pathway in prostate cancer cells (32). Moreover, circ_0016418 facilitated
melanoma progression and glutamine catabolism by sponging
miR-605-5p to promote GLS expression (16). In the current research, we verified
that miR-330-3p directly bound to GLS 3′-UTR and negatively
regulated GLS expression.
Aberrant energy metabolism, such as increased
glutamine catabolism, is one of critical hallmarks of cancer
(33,34). In addition to abnormal glycolysis,
several previous studies revealed that enhanced glutamine
metabolism was correlated with tumor metastasis and poor prognosis
in patients with cancer (12,35). GLS is a rate-limiting enzyme for
glutamine catabolism, catalyzing the hydrolysis of glutamine to
glutamate (31,36). Interestingly, GLS has multiple effects
in cancer cells, including maintaining mitochondrial metabolism,
activating cell signaling, and promoting cancer cell growth
(31,35,36).
Moreover, dysfunction of glutamine metabolism has been found in
oral squamous cell carcinoma (OSCC) and head and neck squamous cell
carcinoma (HNSCC) (37,38). However, it is still unclear whether
glutamine metabolism exerts a vital regulatory role in TSCC
progression, and whether the glutamine metabolism-related molecules
can be used as potential biomarkers or targets for TSCC diagnosis,
treatment and prognosis. Therefore, glutamine metabolism may be a
good entry point for future diagnosis and treatment of TSCC.
Several circRNAs have, interestingly, been shown to
be involved in the progression of cell metabolism in various tumors
(14). Recently, accumulating
evidence has illuminated that altered glutamine catabolism exerts a
critical effect on cell proliferation in tumor cells (39). Moreover, circHMGCS1 was found to
regulate glutamine metabolism in hepatoblastoma cells by targeting
the miR-503-5p/IGF/PI3K/Akt axis (15). However, there is no systematic study
on the correlation between circRNAs and glutamine metabolism in
TSCC. Therefore, we here explored how circ_0000003 regulated
glutamine metabolism in TSCC. Herein, our current study
demonstrated that circ_0000003 knockdown significantly repressed
glutamine consumption, α-KG production and ATP production of TSCC
cells, indicating that circ_0000003 knockdown impeded glutamine
catabolism in TSCC cells. Moreover, in the current rescue
experiments, miR-330-3p inhibitor reversed the reduction in
glutamine consumption, α-KG production and ATP production induced
by sh-circ_0000003 transfection in Cal27 cells, suggesting
circ_0000003 knockdown may exert the inhibitory effects on the
glutamine metabolism by facilitating miR-330-3p expression and
function in TSCC.
In summary, this research work suggests a vital role
for circ_0000003 in glutamine metabolism and tumor progression by
binding and restraining miR-330-3p to facilitate GLS expression in
TSCC. This work provides a novel mechanism for understanding cancer
metabolism, and suggests that the circ_0000003/miR-330-3p/GLS axis
may provide novel strategies for TSCC diagnosis, therapy and
prognosis. However, there are some limitations that exist in the
present study. First, the limited TSCC tissue samples might not
fully substantiate the accuracy of the present results. Secondly,
there is a lack of parallel studies on HOK cells as a control to
detect cell proliferation and invasion. Furthermore, the role of
circ_0000003 in TSCC was explored only in TSCC cell lines in
vitro, but not in a TSCC mouse model in vivo. Finally,
but perhaps extremely important, the relationships between
circ_0000003 and other potential targeting miRNAs should be
explored in future work.
Acknowledgements
Not applicable.
Funding
This work was supported by the Zhejiang Provincial
Natural Science Foundation of China (LY16H160033), the Basic Public
Welfare Research Project of Zhejiang Province (2016C33189), the
National Natural Science Foundation of China (81902138), the
Zhejiang Provincial Medical Science and Technology Project of China
(2019RC314), the National College Students Innovation and
Entrepreneurship Training Program of China (202010350053), and the
Science and Technology Project of Taizhou City (20ywa61).
Availability of data and materials
The datasets used and/or analyzed during the current
study are available from the corresponding author on reasonable
request.
Authors contributions
JY designed the study. CQ, SC and SL contributed to
the cell transfection, RT-qPCR, western blotting, RIP, RNA
pull-down and luciferase assays. CQ performed the CKK-8 and
Transwell assays. SC performed the glutamine, α-KG and ATP assays.
YW collected the clinical data and follow-up data. JY, CQ and SC
participated in writing and revising the manuscript. All authors
have read and approved the final manuscript.
Ethics approval and consent to
participate
The research protocol conformed to the principles
outlined in the Declaration of Helsinki. All patients provided
written informed consent and the protocol of the study was approved
by the Medical Ethics Committee of Taizhou University Hospital
(Taizhou, Zhejiang, China) (approval no. 2018-092).
Patient consent for publication
Not applicable.
Competing interests
The authors declare that they have no competing
interests.
References
|
1
|
Cohen N, Fedewa S and Chen AY:
Epidemiology and demographics of the head and neck cancer
population. Oral Maxillofac Surg Clin North Am. 30:381–395. 2018.
View Article : Google Scholar : PubMed/NCBI
|
|
2
|
Hussein AA, Forouzanfar T, Bloemena E, de
Visscher J, Brakenhoff RH, Leemans CR and Helder MN: A review of
the most promising biomarkers for early diagnosis and prognosis
prediction of tongue squamous cell carcinoma. Br J Cancer.
119:724–736. 2018. View Article : Google Scholar : PubMed/NCBI
|
|
3
|
Di Agostino S, Riccioli A, De Cesaris P,
Fontemaggi G, Blandino G, Filippini A and Fazi F: Circular RNAs in
embryogenesis and cell differentiation with a focus on cancer
development. Front Cell Dev Biol. 8:3892020. View Article : Google Scholar : PubMed/NCBI
|
|
4
|
Bach DH, Lee SK and Sood AK: Circular RNAs
in cancer. Mol Ther Nucleic Acids. 16:118–129. 2019. View Article : Google Scholar : PubMed/NCBI
|
|
5
|
Rajappa A, Banerjee S, Sharma V and
Khandelia P: Circular RNAs: Emerging role in cancer diagnostics and
therapeutics. Front Mol Biosci. 7:5779382020. View Article : Google Scholar : PubMed/NCBI
|
|
6
|
Lei M, Zheng G, Ning Q, Zheng J and Dong
D: Translation and functional roles of circular RNAs in human
cancer. Mol Cancer. 19:302020. View Article : Google Scholar : PubMed/NCBI
|
|
7
|
Wei T, Ye P, Yu GY and Zhang ZY: Circular
RNA expression profiling identifies specific circular RNAs in
tongue squamous cell carcinoma. Mol Med Rep. 21:1727–1738.
2020.PubMed/NCBI
|
|
8
|
Yao Y, Bi L and Zhang C: Circular
RNA_0001742 has potential to predict advanced tumor stage and poor
survival profiles in tongue squamous cell carcinoma management. J
Clin Lab Anal. 34:e233302020. View Article : Google Scholar : PubMed/NCBI
|
|
9
|
Hu YT, Li XX and Zeng LW: Circ_0001742
promotes tongue squamous cell carcinoma progression via
miR-431-5p/ATF3 axis. Eur Rev Med Pharmacol Sci. 23:10300–10312.
2019.PubMed/NCBI
|
|
10
|
Shao B and He L: Hsa_circ_0001742 promotes
tongue squamous cell carcinoma progression via modulating miR-634
expression. Biochem Biophys Res Commun. 513:135–140. 2019.
View Article : Google Scholar : PubMed/NCBI
|
|
11
|
Li S, Niu X, Li H, Liang Y, Sun Z and Yan
Y: Circ_0000003 promotes the proliferation and metastasis of
non-small cell lung cancer cells via miR-338-3p/insulin receptor
substrate 2. Cell Cycle. 18:3525–3539. 2019. View Article : Google Scholar : PubMed/NCBI
|
|
12
|
Faubert B, Solmonson A and DeBerardinis
RJ: Metabolic reprogramming and cancer progression. Science.
368:eaaw54732020. View Article : Google Scholar : PubMed/NCBI
|
|
13
|
Kery M and Papandreou I: Emerging
strategies to target cancer metabolism and improve radiation
therapy outcomes. Br J Radiol. 93:202000672020. View Article : Google Scholar : PubMed/NCBI
|
|
14
|
Yu T, Wang Y, Fan Y, Fang N, Wang T, Xu T
and Shu Y: CircRNAs in cancer metabolism: A review. J Hematol
Oncol. 12:902019. View Article : Google Scholar : PubMed/NCBI
|
|
15
|
Zhen N, Gu S, Ma J, Zhu J, Yin M, Xu M,
Wang J, Huang N, Cui Z, Bian Z, et al: CircHMGCS1 promotes
hepatoblastoma cell proliferation by regulating the IGF signaling
pathway and glutaminolysis. Theranostics. 9:900–919. 2019.
View Article : Google Scholar : PubMed/NCBI
|
|
16
|
Lu R, Zhang X, Li X and Wan X:
Circ_0016418 promotes melanoma development and glutamine catabolism
by regulating the miR-605-5p/GLS axis. Int J Clin Exp Pathol.
13:1791–1801. 2020.PubMed/NCBI
|
|
17
|
Zhu H, Hu Y, Wang C, Zhang X and He D:
CircGCN1L1 promotes synoviocyte proliferation and chondrocyte
apoptosis by targeting miR-330-3p and TNF-α in TMJ osteoarthritis.
Cell Death Dis. 11:2842020. View Article : Google Scholar : PubMed/NCBI
|
|
18
|
Chen S, Sun YY, Zhang ZX, Li YH, Xu ZM and
Fu WN: Transcriptional suppression of microRNA-27a contributes to
laryngeal cancer differentiation via GSK-3β-involved Wnt/β-catenin
pathway. Oncotarget. 8:14708–14718. 2017. View Article : Google Scholar : PubMed/NCBI
|
|
19
|
Zeng B, Ye H, Chen J, Cheng D, Cai C, Chen
G, Chen X, Xin H, Tang C and Zeng J: LncRNA TUG1 sponges miR-145 to
promote cancer progression and regulate glutamine metabolism via
Sirt3/GDH axis. Oncotarget. 8:113650–113661. 2017. View Article : Google Scholar : PubMed/NCBI
|
|
20
|
Livak KJ and Schmittgen TD: Analysis of
relative gene expression data using real-time quantitative PCR and
the 2(-Delta Delta C(T)) method. Methods. 25:402–408. 2001.
View Article : Google Scholar : PubMed/NCBI
|
|
21
|
Zhang X, Xu L and Yang T: miR-31 Modulates
liver cancer HepG2 cell apoptosis and Invasion via ROCK1/F-Actin
Pathways. Onco Targets Ther. 13:877–888. 2020. View Article : Google Scholar : PubMed/NCBI
|
|
22
|
Wu J, Zhao W, Wang Z, Xiang X, Zhang S and
Liu L: Long non-coding RNA SNHG20 promotes the tumorigenesis of
oral squamous cell carcinoma via targeting miR-197/LIN28 axis. J
Cell Mol Med. 23:680–688. 2019. View Article : Google Scholar : PubMed/NCBI
|
|
23
|
Li Q, Wang W, Zhang M, Sun W, Shi W and Li
F: Circular RNA circ-0016068 promotes the growth, migration, and
invasion of prostate cancer cells by regulating the
miR-330-3p/BMI-1 axis as a competing endogenous RNA. Front Cell Dev
Biol. 8:8272020. View Article : Google Scholar : PubMed/NCBI
|
|
24
|
Zhang Y, Zhou YM, Zhang ZJ and Li X:
miR-210 is a serological biomarker for predicting recurrence and
prognosis of colon carcinoma patients with liver metastases after
radiofrequency ablation treatment. Cancer Manag Res. 12:9077–9085.
2020. View Article : Google Scholar : PubMed/NCBI
|
|
25
|
Zhang J, Wang L, Mao S, Liu M, Zhang W,
Zhang Z, Guo Y, Huang B, Yan Y, Huang Y and Yao X: miR-1-3p
contributes to cell proliferation and invasion by targeting
glutaminase in bladder cancer cells. Cell Physiol Biochem.
51:513–527. 2018. View Article : Google Scholar : PubMed/NCBI
|
|
26
|
He D, Yang X, Kuang W, Huang G, Liu X and
Zhang Y: The Novel Circular RNA Circ-PGAP3 promotes the
proliferation and invasion of triple negative breast cancer by
regulating the miR-330-3p/Myc axis. Onco Targets Ther.
13:10149–10159. 2020. View Article : Google Scholar : PubMed/NCBI
|
|
27
|
Cheng Y, Zhu H and Gao W: MicroRNA-330-3p
represses the proliferation and invasion of laryngeal squamous cell
carcinoma through downregulation of Tra2β-mediated Akt signaling.
Mol Cell Probes. 52:1015742020. View Article : Google Scholar : PubMed/NCBI
|
|
28
|
Wang H, Liu G, Li T, Wang N, Wu J and Zhi
H: MiR-330-3p functions as a tumor suppressor that regulates glioma
cell proliferation and migration by targeting CELF1. Arch Med Sci.
16:1166–1175. 2020. View Article : Google Scholar : PubMed/NCBI
|
|
29
|
Ren S, Lin P, Wang J, Yu H, Lv T, Sun L
and Du G: Circular RNAs: Promising molecular biomarkers of human
aging-related diseases via functioning as an miRNA sponge. Mol Ther
Methods Clin Dev. 18:215–229. 2020. View Article : Google Scholar : PubMed/NCBI
|
|
30
|
Narayanan R and Schratt G: miRNA
regulation of social and anxiety-related behaviour. Cell Mol Life
Sci. 77:4347–4364. 2020. View Article : Google Scholar : PubMed/NCBI
|
|
31
|
Masisi BK, El Ansari R, Alfarsi L, Rakha
EA, Green AR and Craze ML: The role of glutaminase in cancer.
Histopathology. 76:498–508. 2020. View Article : Google Scholar : PubMed/NCBI
|
|
32
|
Zhang J, Mao S, Guo Y, Wu Y, Yao X and
Huang Y: Inhibition of GLS suppresses proliferation and promotes
apoptosis in prostate cancer. Biosci Rep. 39:BSR201818262019.
View Article : Google Scholar : PubMed/NCBI
|
|
33
|
Yoo HC, Yu YC, Sung Y and Han JM:
Glutamine reliance in cell metabolism. Exp Mol Med. 52:1496–1516.
2020. View Article : Google Scholar : PubMed/NCBI
|
|
34
|
Park JH, Pyun WY and Park HW: Cancer
Metabolism: Phenotype, signaling and therapeutic targets. Cells.
9:23082020. View Article : Google Scholar
|
|
35
|
Matés JM, Campos-Sandoval JA,
Santos-Jiménez JL and Márquez J: Dysregulation of glutaminase and
glutamine synthetase in cancer. Cancer Lett. 467:29–39. 2019.
View Article : Google Scholar : PubMed/NCBI
|
|
36
|
Shah R and Chen S: Metabolic Signaling
Cascades Prompted by Glutaminolysis in Cancer. Cancers (Basel).
12:26242020. View Article : Google Scholar
|
|
37
|
Ogawa T, Washio J, Takahashi T, Echigo S
and Takahashi N: Glucose and glutamine metabolism in oral squamous
cell carcinoma: insight from a quantitative metabolomic approach.
Oral Surg Oral Med Oral Pathol Oral Radiol. 118:218–225. 2014.
View Article : Google Scholar : PubMed/NCBI
|
|
38
|
Zhang Z, Liu R, Shuai Y, Huang Y, Jin R,
Wang X and Luo J: ASCT2 (SLC1A5)-dependent glutamine uptake is
involved in the progression of head and neck squamous cell
carcinoma. Br J Cancer. 122:82–93. 2020. View Article : Google Scholar : PubMed/NCBI
|
|
39
|
Matés JM, Di Paola FJ, Campos-Sandoval JA,
Mazurek S and Márquez J: Therapeutic targeting of glutaminolysis as
an essential strategy to combat cancer. Semin Cell Dev Biol.
98:34–43. 2020. View Article : Google Scholar : PubMed/NCBI
|