Introduction
MDM2 proto-oncogene, E3 ubiquitin protein ligase
(MDM2) is a well-known oncogene that has been reported to be
closely associated with different disease phenotypes (1). MDM2 is a specific target gene of p53 and
is a unique ubiquitin-protein ligase associated with numerous
cancer types (1). MDM2 can transfer
from the nucleus to the cytoplasm and degrade various substrates,
such as p53 (2). In addition, MDM2
and p53 can form a negative-feedback loop (2). The p53 gene enhances MDM2 protein
expression, while MDM2 inhibits p53 through simultaneously
ubiquitinating and degrading p53 (2,3). P53 is a
cancer suppressor the function of which can be eliminated by MDM2
activity (2,3). Therefore, MDM2 is related to tumor
formation, anti-apoptosis effects and drug resistance (4,5).
Epithelial-to-mesenchymal transition (EMT) is a
dynamic and complex process. When EMT occurs, epithelial cells
change their morphology, lose their polarity, and acquire the
features and potential of mesenchymal cells (6). EMT is involved in embryonic development,
wound healing, invasion and metastasis in tumor cells (6). Notably, EMT serves a crucial role in
tumor progression (6). According to
previous studies, the expression levels of MDM2 are increased in
TGF-β-induced EMT (2,3,7,8). Therefore, MDM2 is an important part of
tumor cell invasion, metastasis and the EMT process. In certain
invasive ductal breast carcinoma models, overexpression of MDM2
promotes the invasion and migration of tumor cells (7). A previous study reported that MDM2 can
promote EMT by upregulating the expression of Snail family
transcriptional repressor 1 (Snail) in breast cancer cells
(4). A number of articles have
reported the close relationship between MDM2 and EMT in other
cancer cells (4–8). MDM2 induces the migration of tumor cells
by inhibiting E-cadherin (E-CAD) expression (7,8). However,
to the best of our knowledge, the mechanism by which MDM2 promotes
EMT is still unknown.
The MAPK/ERK signaling pathway is a complex and
highly conserved cellular signaling pathway widely used in
eukaryotic cells, and it is important for the occurrence,
development and malignant transformation of tumors (9). Raf/MEK/ERK is a classical and important
pathway involved in tumor development, leading to abnormal
proliferation, invasion, growth and distant metastasis of malignant
tumors (10). Various in vitro
experiments have demonstrated the important roles of Raf/MEK/ERK
signaling in the development of cancer; however, there are still
numerous unknowns regarding the involvement of this pathway with
cancer (9–11). A number of studies have reported that
Raf/MEK/ERK signaling can participate in EMT, while the mechanism
by which Raf/MEK/ERK signaling is involved in and affects EMT is
unclear (9–11). Therefore, with the continuous progress
and updating of diagnosis and treatment technology, the specific
regulatory mechanism for the Raf/MEK/ERK signaling pathway to block
its induction of tumor biological behavior has become a focus of
current cancer research (9–11).
Tyrosine 3-monooxygenase activation protein ε
(14-3-3) proteins are a family of highly conserved small proteins
(12). At present, 14-3-3 proteins
are regarded as a major class of molecular chaperones, with >200
proteins having been demonstrated to be targeted by them, and the
list is still expanding (12). A
turning point in understanding the role of 14-3-3 proteins was the
discovery that 14-3-3 proteins bind to specific phosphorylated
motifs in protein targets in 1996 (13). The majority of target proteins contain
14-3-3-binding motif(s) with the following amino acid sequences:
RSXpSXP (mode I) and RXY/FXpSXP (mode II) or
-pS/pTX(1–2)-CO2 H (mode III) (where X is not Pro)
(14–16). Upon interaction with a target, 14-3-3
proteins alter target protein modifications, activities and
cellular localizations, and thus regulate five major cellular
functions: Cell cycle regulation, apoptosis, signal transduction,
metabolism and intracellular protein trafficking (17–23).
Notably, previous studies have revealed that B-Raf contains at
least two binding sites for 14-3-3, and 14-3-3 could combine with
B-Raf to affect the activation of B-Raf (14–16). It is
interesting to note that 14-3-3 can deactivate B-Raf directly by
making it locate to the cytoplasm (24–27). Under
basal conditions, B-Raf phosphorylation creates docking sites for
14-3-3 proteins, resulting in the sequestration of B-Raf in the
cytoplasm as an off-state (28,29).
14-3-3 deficiency can directly lead to B-Raf reactivation (28,29).
EMT contributes to the resistance of cancer cells to
chemotherapy agents. According to previous studies, numerous
chemicals have been used in cancer treatments (7,8,30–32).
However, they often have little or no effect on cells that have
undergone EMT (30). EMT is also
involved in the drug resistance of breast cancer cells, and these
resistant cancer cells exhibit increased migration and invasion
activities (31,32). In some human glioma cell models, EMT
is necessary for tumor cells to acquire resistance to drugs
(33,34). Furthermore, EMT has been reported to
be associated with drug resistance and sensitivity to numerous
chemotherapeutics in non-small-cell lung carcinoma, breast cancer
and bladder cancer (35,36).
Based on previous studies and data, the present
study attempted to reveal the mechanism of MDM2-mediated induction
of EMT. In addition, the present study aimed to explore whether p53
is involved in MDM2-mediated EMT. Since EMT contributes to the drug
resistance of tumor cells, the present study also tried to reveal
the relationship between MDM2 and drug sensitivity.
Materials and methods
Plasmid vector construction
Plasmid construction was performed as described in
our previous studies (37–39). pLenti-CMV-MDM2-green fluorescent
protein (GFP)-puro was constructed based on a plenti-CMV-puro
backbone. The present study first PCR-amplified the MDM2 sequence
lacking a termination codon using the plasmid pcDNA3.1-MDM2 as a
template using the following primer pair and the Prime Star DNA
Polymerase kit (Takara Bio, Inc.): Forward,
5′-CGCGCCACCATGGTGAGGAGCAGGCAAAT-3′ and reverse,
5′-ACGCGGGGAAATAAG-3′. The PCR conditions used were as follows:
94°C for 5 min; 94°C for 30 sec; 56°C for 60 sec; 72°C for 1 min;
72°C for 10 min; 4°C for 10 min; cycle number, 35. PCR fragments
were purified on a 1.5% agarose gel with ethidium bromide using the
E.Z.N.A.® DNA Kit (Omega Bio-Tek, Inc.). A purified GFP
cDNA fragment that lacked an initiation codon was PCR-amplified
using plenti-CMV-GFP as a template by the following primer pair and
the Prime Star DNA Polymerase kit (Takara Bio, Inc.): Forward,
5′-CGTCAGATCCGCTAGCGCTACCGGTCG-3′ and reverse,
5′-GCTTACTTGTACAGCTCGTCCATGCCG-3′. The PCR conditions used were as
follows: 94°C for 5 min; 94°C for 30 sec; 55°C for 30 sec; 72°C for
30 sec; 72°C for 10 min; 4°C for 10 min; cycle number, 32. PCR
fragments were purified on a 1.5% agarose gel with ethidium bromide
using the E.Z.N.A.® DNA Kit (Omega Bio-Tek, Inc.).
Overlap PCR was used to connect the purified MDM2 and GFP fragments
using the following primer pair and the Prime Star DNA Polymerase
kit (Takara Bio, Inc.): Forward,
5′-CGCGCCACCATGGTGAGGAGCAGGCAAAT-3′ and reverse,
5′-GCTTACTTGTACAGCTCGTCCATGCCG-3′. The PCR conditions used were as
follows: 94°C for 5 min; 94°C for 30 sec; 56°C for 60 sec; 72°C for
1.5 min; 72°C for 10 min; 4°C for 10 min; cycle number, 35. PCR
fragments were purified on a 1.5% agarose gel with ethidium bromide
using the E.Z.N.A.® DNA Kit (Omega Bio-Tek, Inc.).
Subsequently, Kozak sequences were added to the purified MDM2-GFP
fragment and restriction enzyme sites for BamHI and
SalI were also inserted. The recombinant fragment and
pLenti-CMV-puro were digested with BamHI and SalI
(Takara Bio, Inc.), respectively, and then T4 ligase (Takara Bio,
Inc.), was used to form the recombinant plasmid
pLenti-CMV-MDM2-GFP-puro plasmid (Fig.
S1A and B). In the present study, fragments and plasmids were
digested with Takara QuickCut enzymes (Takara Bio, Inc.) and
fragments and vectors were ligated with T4 ligase (Takara Bio,
Inc.). In the present study, the pLenti-CMV-MDM2-GFP-puro plasmid
sequencing process was conducted at Sangon Biotech Co., Ltd.
Stbl3 competent cells were used for plasmid transformation,
and plasmid was extracted from Stbl3 using a TIANGEN Kit.
The pLenti-CMV-MDM2-GFP-puro plasmid sequencing result and original
sequence were aligned using APE software (version 2.0; https://jorgensen.biology.utah.edu/wayned/ape/;
Fig. S1B). Flag-14-3-3 and
pcDNA3.1-p53 were purchased from Addgene, Inc.
Cell culture
U251MG, A549, MCF-7 and 293T cells (The Cell Bank of
Type Culture Collection of The Chinese Academy of Sciences) were
used in the present study. All cell lines were cultured at 37°C
with 5% CO2. Ham's F-12K (Kaighn's) Medium (Thermo
Fisher Scientific, Inc.) was used to culture A549 cells. U251MG,
293T and MCF-7 cells were cultured in DMEM with high glucose
(HyClone; Cytiva). All media were supplemented with 10% FBS
(Shanghai ExCell Biology, Inc.) and 100 µg/ml penicillin and
streptomycin to make complete medium. Media were changed every
other day. The inhibitors and activators used in the present study
included an ERK inhibitor (FR180204; 10 µM, 24 h; cat. no. S7524;
Selleck Chemicals), a 90 KDa ribosomal protein S6 kinase (RSK)
inhibitor (SL0101; 50 µM, 24 h; cat. no. 77307-50-7; Sigma-Aldrich;
Merck KGaA), vemurafenib (2 µM, 24 h; cat. no. A3004; APeXBIO
Technology LLC), a MEK inhibitor U0126 (2 µM, 24 h; cat. no. 9903;
Cell Signaling Technology, Inc.), TGF-β (10 ng/ml, 48 h; cat. no.
8915; Cell Signaling Technology, Inc.) and 20 mM Citrate pH 3.0
(Sterile) (cat. no. 9871; Cell Signaling Technology, Inc.). To
examine TGF-β inducing EMT, U251 cells were incubated with 10 ng/ml
TGF-β, and the control group was incubated with an equal volume of
20 mM citrate solution buffer, which was the buffer solution for
TGF-β.
Plasmid transfection
pcDNA6B, pcDNA6B-Flag-14-3-3, pcDNA3.1 and
pcDNA3.1-p53 were purchased from Addgene, Inc. Before transfection,
MDM2-GFP stable cells were digested by tryptase that contained EDTA
when the cells were 80% confluent. Then, 2×10⁵
cells/well were seeded into six-well plates (Suzhou Beaver
Biomedical Engineering Co., Ltd.). pcDNA6B-Flag-14-3-3 or
pcDNA3.1-p53 plasmid (2 µg) were transfected using PloyFect
Effectene Transfection Reagent (Qiagen, Inc.) according to the
manufacturer's protocols when cells were 60–80% confluent. Related
empty vector (2 µg) was also transfected into MDM2-GFP stable cells
using PloyFect as a control group. Cells were cultured at 37°C with
5% CO2 for 8 h, and then the media were replaced with
fresh media. After transfection, cells were cultured at 37°C with
5% CO2 for 36 h. When the transfection was finished,
cells were harvested in 1.5-ml microcentrifuge tubes for
determination of gene overexpression by quantitative PCR (qPCR).
Samples successfully transfected with plasmids were further tested
by western blotting.
Co-transfection and lentivirus
transduction
According to the manufacturer's protocols of the
PloyFect Effectene Transfection Reagent (Qiagen, Inc.) The second
generation lentiviral system plasmid plenti-CMV-MDM2-GFP-puro,
pCMV–VSV-G (Addgene, Inc.) and pCMV-dR8.2 dvpr (Addgene, Inc.) (at
a ratio of 4:1:3; 2 µg total plasmids) were co-transfected into
293T packaging cells. Additionally, plenti-CMV-puro empty vector
(Addgene, Inc.), pCMV–VSV-G and pCMV-dR8.2 dvpr (at a ratio of
4:1:3; 2 µg total plasmids) were co-transfected into 293T packaging
cells as a control group for control stable cell lines. All cells
were cultured at 37°C with 5% CO2 for 8 h, and the media
were replaced by fresh media. After 24 and 36 h, media were
collected in centrifuge tubes. Subsequently, media were
concentrated by ultracentrifugation at 16,100 × g for 30 min at 4°C
and filtered with a 4-µm filter. Viral titers were measured, and
then recombinant lentiviral particles (107 TU/ml) were
added to U251, A549 and MCF7 cells. The multiplicity of infection
for U251, A549 and MCF7 cells was 3, 40 and 30, respectively. Equal
volumes of complete media that contained 8 µg/ml Polybrene
(Sigma-Aldrich; Merck KGaA) were then added. The media were
replaced with fresh media containing 2 µg/ml Puromycin (Puro;
Sigma-Aldrich; Merck KGaA) for selection after 24 h for stable cell
line enrichment. The duration of the selection process was 7 days.
Subsequently, complete media with 1 µg/ml Puro for maintenance were
used to culture this purified stable cell line. Then,
2×10⁵ cells per well were seeded into six-well plates
using 0.25% Trypsin-EDTA solution (Sigma-Aldrich; Merck KGaA) for 5
min at 37°C, and then the stable cells were collected for qPCR and
western blotting.
Western blot analysis
Cells were harvested in 1.5-ml microcentrifuge tubes
and washed with PBS. Subsequently, Nonidet P (NP)-40 lysis buffer
(2% NP-40, 80 mM NaCl, 100 mM Tris-HCl and 0.1% SDS) was added to
the cells, and PMSF (1 mM; Thermo Fisher Scientific, Inc.) was
supplemented. Cell lysate was incubated on ice for 5 min and then
the lysate was centrifuged at 16,100 × g for 10 min at 4°C. The
sample protein concentration was determined using a Bio-Rad Protein
DC Assay kit (Bio-Rad Laboratories, Inc.). Protein samples (50 µg
per lane) from the control group and treatment group were subjected
to SDS-PAGE (15%). Next, proteins were transferred from gels to a
0.45-µm PVDF membrane (EMD Millipore) at 200 mA for 70 min. The
membranes were blocked with 5% BSA (Sigma-Aldrich; Merck KGaA) in
PBS with 0.02% Tween 20 for 1 h at room temperature. Membranes were
incubated with the primary antibodies (diluted to recommended
concentration with 5% BSA) overnight at 4°C. The antibodies used
were as follows: Anti-GAPDH (rabbit; dilution, 1:1,000 for western
blotting; cat no. 10494-1-AP; ProteinTech Group, Inc.), anti-GFP
(mouse; dilution, 1:1,000 for western blotting; cat no. 66002-1-Ig;
ProteinTech Group, Inc.), anti-p53 (mouse; dilution, 1:1,000 for
western blotting; cat no. TA808657; OriGene Technologies, Inc.),
phosphorylated (p-)B-Raf (dilution, 1:1,000 for western blotting;
cat. no. 2696; Cell Signaling Technology, Inc.), B-Raf (dilution,
1:1,000 for western blotting; cat. no. 14814; Cell Signaling
Technology, Inc.), p-MEK (dilution, 1:1,000 for western blotting;
cat. no. 3958; Cell Signaling Technology, Inc.), MEK (dilution,
1:1,000 for western blotting; cat. no. 4694; Cell Signaling
Technology, Inc.), p-ERK (T202/Y204) (dilution, 1:1,000 for western
blotting; cat. no. 4370; Cell Signaling Technology, Inc.), ERK
(dilution, 1:1,000 for western blotting; cat. no. 4695; Cell
Signaling Technology, Inc.), p-ribosomal protein S6 kinase (p70S6K)
(T389) (dilution, 1:1,000 for western blotting; cat. no. 9206S;
Cell Signaling Technology, Inc.), p70S6K (dilution, 1:1,000 for
western blotting; cat. no. 9202S; Cell Signaling Technology, Inc.),
p-eukaryotic translation initiation factor 4E binding protein 1
(4EBP1) (T37/46) (dilution, 1:1,000 for western blotting; cat. no.
9451T; Cell Signaling Technology, Inc.), 4EBP1(dilution, 1:1,000
for western blotting; cat. no. 9644S; Cell Signaling Technology,
Inc.), 14-3-3 (pan) (dilution, 1:1,000 for western blotting; cat.
no. 8312; Cell Signaling Technology, Inc.), E-CAD (dilution,
1:1,000 for western blotting; cat. no. 20874-1-AP; ProteinTech
Group, Inc.), N-cadherin (N-CAD; dilution, 1:1,000 for western
blotting; cat. no. GTX-127345; GeneTex, Inc.), vimentin (VIM;
dilution, 1:1,000 for western blotting; cat. no. 5741T; Cell
Signaling Technology, Inc.), zinc finger E-box binding homeobox 1
(ZEB1; dilution, 1:1,000 for western blotting; cat. no. 3396T; Cell
Signaling Technology, Inc.), Snail (dilution, 1:1,000 for western
blotting; cat. no. 3879T; Cell Signaling Technology, Inc.), Snail
family transcriptional repressor 2 (Slug; dilution, 1:1,000 for
western blotting; cat. no. 9585T; Cell Signaling Technology, Inc.),
GFP (dilution, 1:1,000 for western blotting; cat. no. GTX-113617;
GeneTex, Inc.) and Flag (dilution, 1:1,000 for western blotting;
cat. no. F3165; Sigma-Aldrich; Merck KGaA). GAPDH served as a
control. Then, appropriate anti-rabbit and anti-mouse secondary
antibodies (cat nos. SA00001-1 and SA00001-2; ProteinTech Group,
Inc.; dilution, 1:3,000 with 5% BSA) were added to the membranes
for 1 h at room temperature. Subsequently, membranes were exposed
to ECL solution (cat no. WBKLS0500; EMD Millipore) using an
Amersham Imager 600 machine (GE Healthcare). For protein expression
intensity measurement and quantification, densitometry of the bands
was performed using ImageJ version 1.49 software (National
Institutes of Health).
RNA extraction, cDNA synthesis and
qPCR analysis
A RNeasy Mini kit (cat. no. 74104; QIAGEN Inc.) was
used to extract total RNA of U251, MCF7 and A549 cells. The RNA
products isolated using this kit were loaded on a 1% agarose gel
and separated by electrophoresis. Subsequently, bands for 28S RNA,
18S RNA and 5S RNA were inspected to ensure that RNA was extracted
correctly. Next, the RNA quality and concentration were assayed
using a Nanodrop 2000 spectrophotometer (Thermo Fisher Scientific,
Inc.). A total of 1 µg RNA was used for cDNA synthesis using the
iScript™ cDNA Synthesis Kit (cat no. 170-8890; Bio-Rad
Laboratories, Inc.). The reverse transcription (RT) conditions were
as follows: 25°C for 5 min, 46°C for 20 min, 95°C for 60 sec, hold
at 4°C. Primers used for qPCR are listed in Table I. PerfeCTa®
SYBR® Green SuperMix (cat no. 95054-100; Quantabio) was
used for qPCR and the conditions were as follows: 95°C for 3 min,
95°C for 15 sec, 55°C for 45 sec, 72°C for 30 sec, total of 35
cycles. A CFX96 Touch Real-Time PCR Detection System (Bio-Rad
Laboratories, Inc.) was used to obtain and analyze the data. Actin
was used to normalize gene expression levels. For quantification,
the 2−ΔΔCq method was used for this experiment (40).
 | Table I.List of primers used for quantitative
PCR. |
Table I.
List of primers used for quantitative
PCR.
| Gene | Forward
(5′-3′) | Reverse
(5′-3′) |
|---|
| ACTIN |
GCTCGTCGTCGACAACGGCT |
CAAACATGATCTGGCTCATCTTCTC |
| E-CAD |
CTGAGAACGAGGCTAACG |
TTCACATCCAGCACATCC |
| ZEB1 |
GTGGCGGTAGATGGTAAT |
CTGTTTGTAGCGACTGGA |
| SNAIL |
CCCCAATCGGAAGCCTAA |
CCTTTCCCACTGTCCTCAT |
| SLUG |
TCCTGGTCAAGAAGCATT |
GAGGAGGTGTCAGATGGA |
| MDM2 |
CGGGAGTCCGCAGTCTTA |
GCTTGAGGGTCTGAATCTTG |
|
VIMENTIN |
CCAGGCAAAGCAGGAGTC |
CGAAGGTGACGAGCCATT |
| N-CAD |
CACTGCTCAGGACCCAGAT |
TAAGCCGAGTGATGGTCC |
| P53 |
CACCCGCGTGCTAATGG |
ATGCTGTGTGTACTCTGCTTGAACT |
Immunohistochemistry
Tissue sections were fixed in 10% neutral buffered
formalin at room temperature for 48 h and then embedded in
paraffin. The thickness of tissue sections was 4 µm. For
immunohistochemical staining, slides were placed in a 65°C
incubator for 30 min. Tissue slides were deparaffinized in xylene
for 5 min, then in fresh xylene for another 5 min, 100% ethanol for
5 min, 95% ethanol for 5 min and 75% ethanol for 5 min, and then
washed in water for 5 min. Endogenous peroxidase was blocked with
3% hydrogen peroxide. Antigen retrieval was achieved using a hot
water bath (100°C) and 10 mM citric sodium buffer (pH 6.0) for 15
min. Sections were then blocked with 5% BSA for 1 h at room
temperature and incubated overnight at 4°C with the indicated
primary antibodies in 5% BSA: E-CAD (dilution, 1:100; cat. no.
20874-1-AP; ProteinTech Group, Inc.) and N-CAD (dilution, 1:50;
cat. no. GTX-127345; GeneTex, Inc.). Antibody binding was detected
using the EnVision™ Dual Link System-HRP DAB kit (undiluted; cat.
no. K4010; Dako; Agilent Technologies, Inc.). Anti-Rabbit HRP
labeled polymer (cat. no. K4010; Dako; Agilent Technologies, Inc.)
was used to cover tissues, followed by incubation for 30 min at
room temperature. Subsequently, 20 µl DAB (~1 drop) in 1 ml DAB
substrate buffer was applied to each slide and incubated for 5 min.
Sections were then counterstained with hematoxylin for 5 min at
room temperature, followed by washing of the slides at room
temperature. After staining, the slides were washed with running
tap water for 5 min. Subsequently, tissue slides were placed in 75%
ethanol for 5 min, 95% ethanol for 5 min, 100% ethanol for 5 min,
xylene for 5 min and then in fresh xylene for another 5 min. For
negative controls, primary antibodies were excluded. The mitotic
index was quantified by viewing and capturing images of 10 random
high-power fields for each tissue section on a Keyence All-In-One
Fluorescence Microscope (Keyence Corporation), using a 40× or 20×
objective. For evaluation and quantification of immunohistochemical
data, 10 fields within the tumor area under high power
magnification (40×) were randomly selected for evaluation using
ImageJ version 1.49 software (National Institutes of Health). The
investigators performed blind counting for all quantifications.
Clinical patient glioma samples
All clinical patient glioma samples were obtained
from The Affiliated Hospital of Southwest Medical University
(Luzhou, China). Recruitment was between March 2017 and May 2018.
And the recruitment patient mean age is 33 years old. And all
patient ages are among 18–59 years old. The recruitment patient
proportion is 50 percent male and 50 percent female. The inclusion
criteria were: i) Signature of informed consent voluntarily; ii)
pathological diagnosis of glioma; iii) aged 18–59 years old, male
and female; iv) normal blood-routine test; and v) normal liver
function. The exclusion criteria were: i) Patients unwilling to
participate in the experiment or had poor compliance; ii) other
clinical trials being conducted; iii) previous history of brain
tumor and radiotherapy conducted; iv) multiple lesions with
extensive radiation volume; and v) with history of radiotherapy for
brain tumors.
All samples were obtained from resection surgery and
handled following clinical guidelines and in compliance with
ethical standards (approval no. Y2019045; Southwest Medical
University Ethics Committee, Luzhou, China). An informed consent
document was signed by the patients to agree to the use of their
samples in scientific research. Clinical samples were graded
according to tumor cell density, mitotic index, degree of necrosis
from the WHO Classification of Tumors (3rd Edition) (41). Samples were frozen at −196°C in liquid
nitrogen for qPCR, western blotting and paraffin sectioning for
subsequent histological examination.
Clonogenic cell survival assay
After treatment (24 h exposure), cells were
trypsinized, counted, and 800 cells per well were re-plated in
six-well plates for colony formation assays. After incubation for
10–14 days, colonies were fixed with methanol:acetic acid (3:1;
pre-cooled at 4°C) at 4°C for 10 min, and stained with 1% crystal
violet at room temperature for 15 min, and then counted. A light
microscope (Nikon Corporation) was used to observe and count
colonies, and GraphPad Prism 6.0 software (GraphPad Software, Inc.)
was used for quantification and analysis. Plating efficiency (PE)
was determined, and the surviving fraction was calculated based on
the number of colonies that arose after treatment and is expressed
in terms of PE. Each experiment was repeated three times.
High throughput RNA sequencing
(RNA-seq)
RNA was prepared using the Qiagen RNeasy Kit (cat.
no. 74104; Qiagen, Inc.) according to the manufacturer's protocols.
Strand-specific libraries were generated using the KAPA Stranded
mRNA-Seq Kit with KAPA mRNA Capture Beads (cat no. KK8421; Kapa
Biosystems; Roche Diagnostics). Sequencing libraries were
quantified using the Qubit 2.0 Fluorometer (Invitrogen; Thermo
Fisher Scientific, Inc.) and validated using High-Performance
Capillary Electrophoresis and the Agilent Tapestation 4200 (Agilent
Technologies, Inc.). RNA-seq was performed by Genewiz, Inc. The
sequencing libraries were multiplexed and clustered on one lane of
a Flow Cell. After clustering, the Flow Cell was loaded on the
Illumina HiSeq instrument (Illumina, Inc.) according to the
manufacturer's protocol. The samples were sequenced using a 2×150
Paired End configuration. Image analysis and base-calling were
conducted by the HiSeq Control Software (version 3.3.20; Illumina,
Inc.). Raw sequence data (.bcl files) generated from Illumina HiSeq
were converted into Fastq files and de-multiplexed using Illumina's
bcl2fastq software (version 2.17; Illumina, Inc.). One mismatch was
allowed for index sequence identification. The quality of Fastq
files was checked with FastQC (version 0.11.8; Baraham
Bioinformatics group; http://www.bioinformatics.babraham.ac.uk/). To be
referred to as ‘differentially expressed’, a gene had to have a
false discovery rate adjusted P<0.05 in Differential Expression
Analysis of RNA-seq Data (DEseq) as well as in null model of
hypothesis. DesEQ2 performs a likelihood ratio test that compares
how well a gene count data fits a full model (with independent
variable time) compared with a reduced model without those
variables. The null model of hypothesis takes the average
expression of groups into consideration. The gene list was further
ranked using fold change criteria.
Gene set enrichment analysis
(GSEA)
GSEA was used to study the enrichment of genes in
different pathways. Non-parametric GSEA was performed using GSEA
3.0 (Broad Institute, Inc.; http://www.gsea-msigdb.org/gsea/index.jsp). The gene
sets that significantly out-performed random-class permutations
were considered significant.
MTT assay
Cells were digested and then seeded into 24-well
culture plates at a density of 1×10⁴ cells/well.
Subsequently, cells were treated with Silibinin at the indicated
concentration for 24 and 48 h. MTT reagent (5 mg/ml; HyClone;
Cytiva) was then added to each well, and the cells were incubated
at 37°C for 4 h. After incubation, DMSO was used to replace the MTT
reagent, and cells were further incubated at room temperature for
30 min. The absorbance of formazan at 570 nm was detected using a
spectrophotometer (Bio-Rad Laboratories, Inc.).
Scratch wound migration assay
U251 and A549 cells were first seeded into a 12-well
cell culture plate (2×10⁵ cells/well). The monolayer was
scratched using a 200-µl pipet tip when the cell confluence reached
75–80%. Subsequently, cells were cultured in an incomplete medium
that contained 0.5% serum. Images were captured at 0, 24 and 48 h
after wounding using a light microscope (Olympus Corporation).
ImageJ (version 1.49; National Institutes of Health) was used to
analyze these images, and the cell migration ratio was calculated
as follows: N=[1-(Dn/D0)] ×100%, where N
represents the ratio of cell migration, Dn represents
the closure distance at the sampling time and D0
represents the original distance.
Animal experiments
NOD/SCID mice (stock no. 001303) were purchased from
Chengdu Dossy Experimental Animals Co., Ltd. All animal experiments
were performed following the guidelines that were reviewed and
approved by Southwest Medical University Ethics Committee (Luzhou,
China) before conduction (approval no. 201903-34). For subcutaneous
xenografts, U251 cells and stable MDM2 and 14-3-3-expressing cells
(5×10⁶) in PBS were injected subcutaneously into the
lower flank of 6-week-old female NOD/SCID mice (weight, ~20 g; 6
mice per group; total of 24 mice). All mice were housed in a SPF
mice room under standard conditions (temperature, 20-26°C;
humidity, 40–70%; ammonia concentration below 14 mg/m3;
light/dark cycle was 12/12 h; free access to food and water).
Animal health and behavior were monitored daily. Mice were
monitored for tumor development by measurements of tumor weight,
tumor length and width. Tumor volume was calculated according to
the following formula: (Length × width2)/2. Related mice
were treated daily with 100 mg/kg (body weight) FR180204 via
intraperitoneal injection using a 27-gauge needle. The duration of
the experiment was 28 days. After a 4-week period
(post-inoculation), once tumors grew to a palpable size (~500
mm3), the mice were sacrificed (no mice died before the
endpoint), and tumors were dissected (no other tumors were
observed). To minimize the struggle of the animals and reduce the
pain of the animal, the cervical dislocation method was performed
after the mice were anesthetized. When mice were sacrificed, mice
were placed in the induction chamber with 2% isoflurane (induction
dose) in oxygen, and then cervical dislocation was used for
euthanasia immediately. Half of each tumor was frozen at −196°C in
liquid nitrogen, and half was fixed in 4% paraformaldehyde for
subsequent histological examinations.
During the 4-week observation period, if there was
evidence of weight loss >20% from the baseline, partial rigor of
the limbs, inability to regain normal posture if placed on back,
labored breathing, inability to eat or drink, severe dyspnea or any
other serious illness, the mice would have been euthanized.
Consequently, tumor growth of 1.0 cm3 will be a humane
endpoint to euthanize mice. Mice would be euthanized if tumor
growth plateaus for more than five measurements in which case
controls would be concurrently euthanized with experimental
populations. Animals were checked daily for body condition scoring
and signs of discomfort. Those animals in pain or extreme
discomfort would have been euthanized. The final decision to
perform euthanasia was at the discretion of the clinical
veterinarian.
Image capture and analysis
Images were acquired using Olympus Stream software
(version 2.4; Olympus Corporation) under a fluorescence microscope
(Olympus Corporation), and ImageJ (version 1.49; National
Institutes of Health) was used to analyze the images. Band
densitometry and data quantification was also conducted using
ImageJ. All images in the present study were grouped using Adobe
Illustrator software (version 24.0; Adobe Systems, Inc.).
Statistical analysis
Data were normalized using control markers. Data
from each group were obtained from at least three replicates. Mean
values and SD are presented. In this study, statistical analysis
was performed using GraphPad Prism 6.0 software (GraphPad Software,
Inc.). Statistical significance was analyzed using an unpaired
Student's t-test or one-way ANOVA with Tukey's post hoc test to
correct for multiple comparisons. P<0.05 was considered to
indicate a statistically significant difference, P<0.01 was
considered to indicate a statistically very significant difference
and P<0.001 was considered to indicate a statistically extremely
significant difference.
Results
MDM2 expression is increased in
TGF-β-induced EMT
According to previous studies, MDM2 is an important
factor related to cell invasion, metastasis and EMT (7,8).
Therefore, the present study aimed to determine the MDM2 levels in
cells undergoing EMT. TGF-β can induce EMT (6). U251 cells were incubated with 10 ng/ml
TGF-β or an equal volume of 20 mM Citrate solution buffer which was
the buffer solution for TGF-β. Subsequently, cells were collected
and total RNA was extracted. As shown in Fig. 1A, compared with the control group,
full length MDM2 was upregulated ~2.5 times after incubation based
on semi-quantitative analysis of band intensity from PCR results.
Similarly, MDM2 gene expression in U251 cells treated in the same
manner was increased ~3 times after incubation according to qPCR
(Fig. 1B). Subsequently, the protein
expression levels of MDM2, p53, E-CAD, N-CAD and VIM in
TGF-β-treated U251 cells were analyzed by western blotting
(Fig. 1C). As shown in the
quantitative analyses, U251 cells treated with TGF-β exhibited
decreased E-CAD protein expression and increased N-CAD and VIM
protein expression, which suggested that EMT had been induced. In
the same cells, RT-qPCR indicated that the MDM2 expression
was significantly increased after incubation with TGF-β peptide
(Fig. 1D). Furthermore, since MDM2 is
an upstream gene of p53, the present study also determined p53
protein expression (2–4). Consistent with other publications, it
was observed that the accumulation of MDM2 was associated with the
degradation of p53 (Fig. 1C). To
summarize, MDM2 expression was upregulated in EMT induced by
TGF-β.
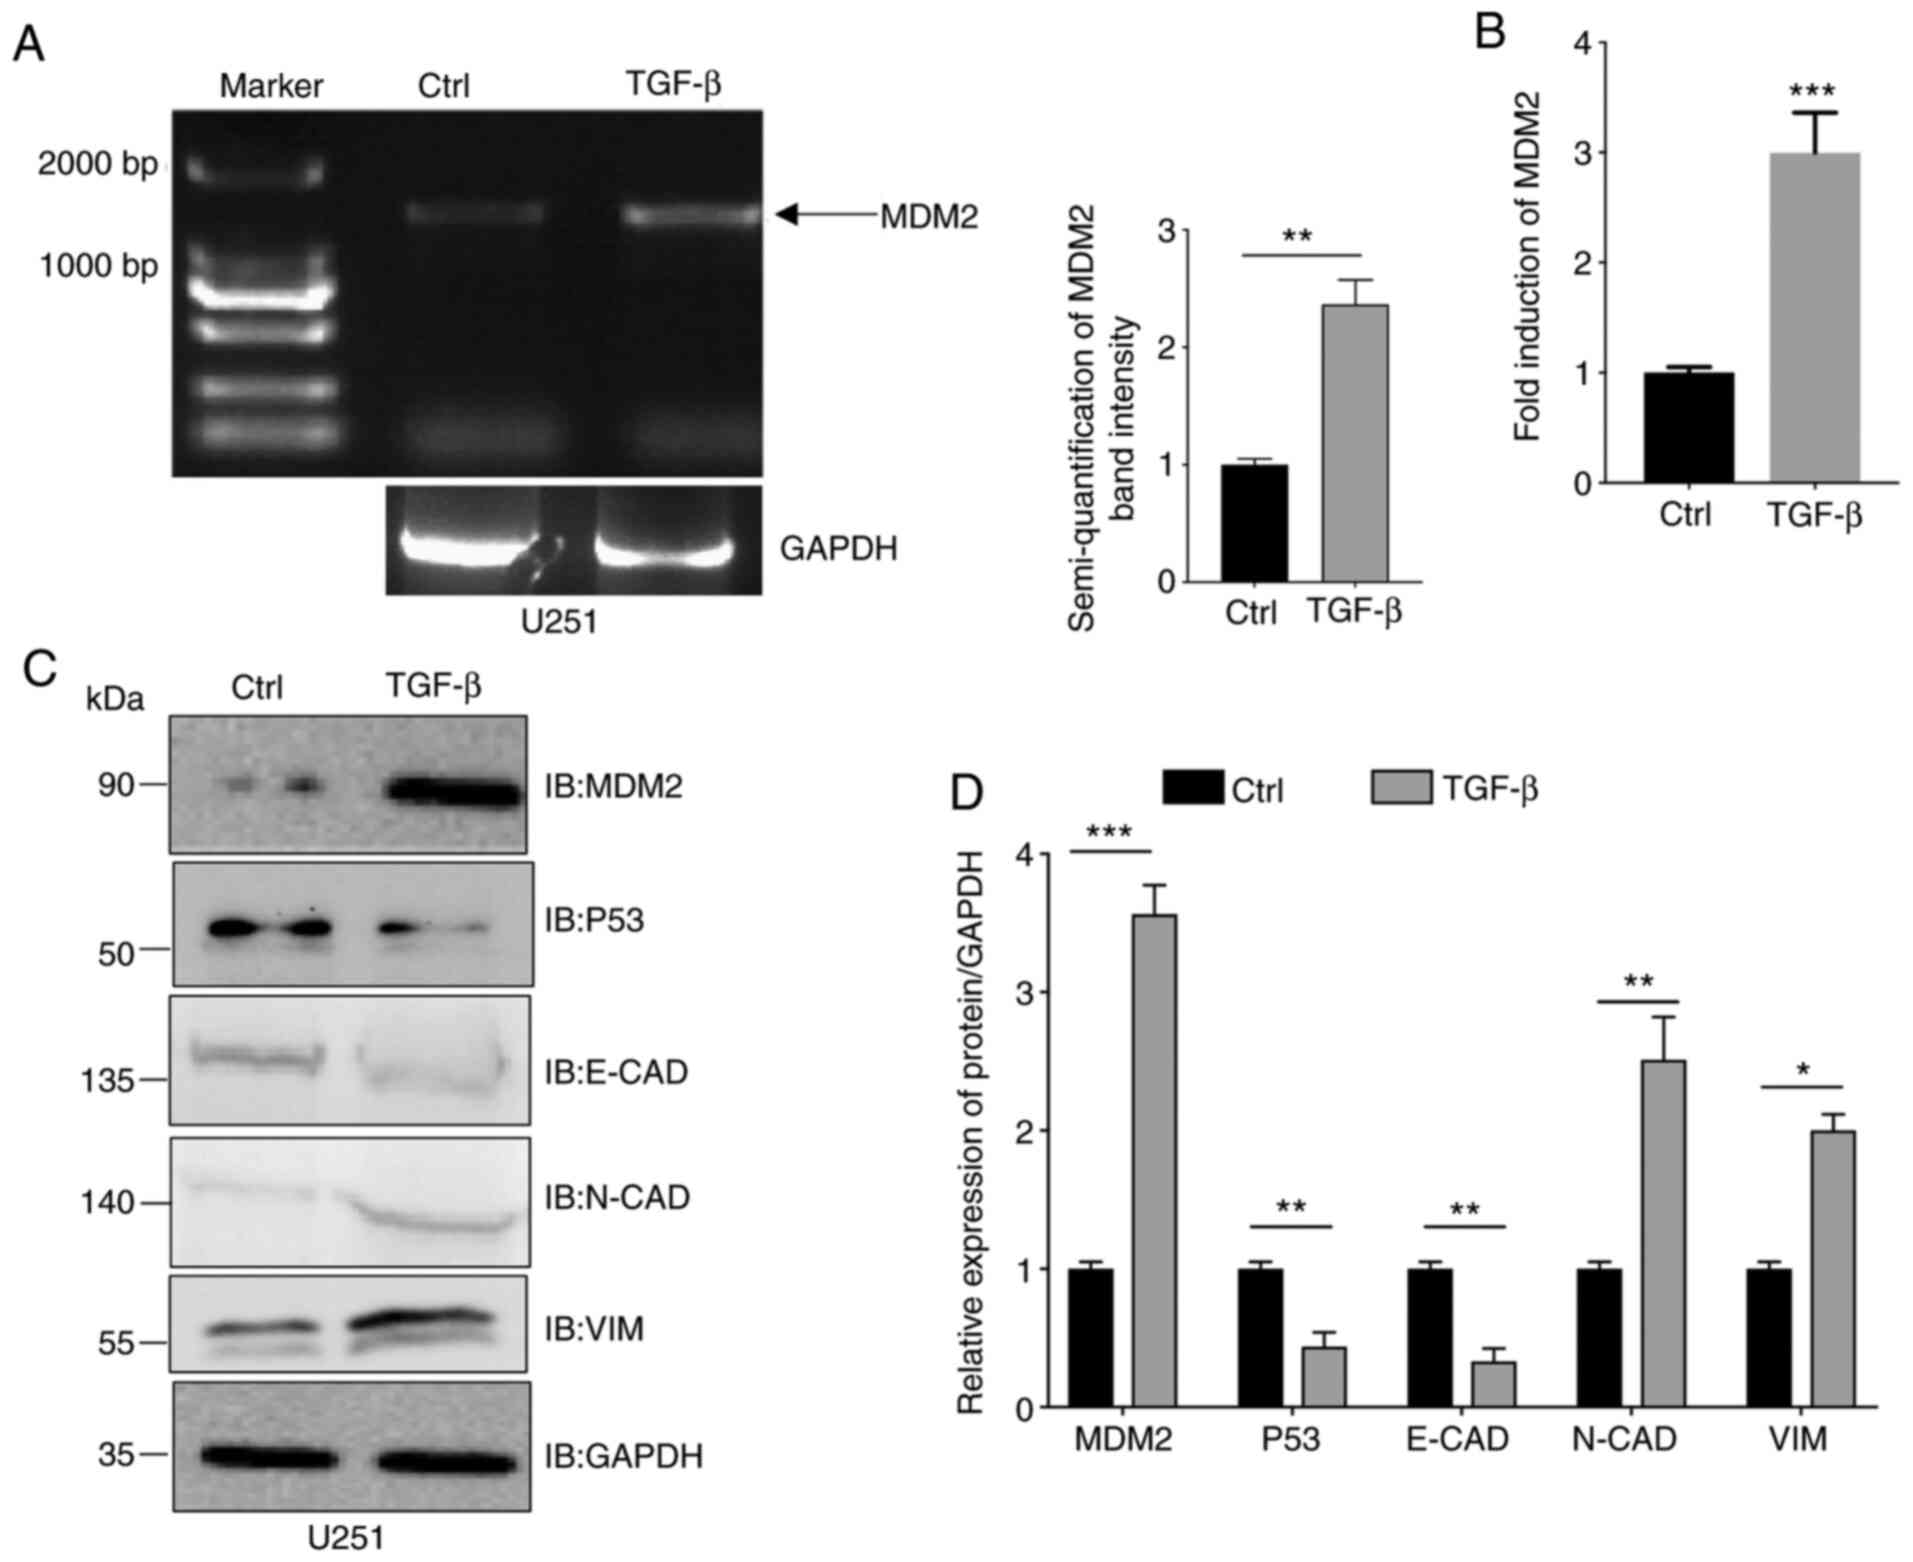 | Figure 1.MDM2 expression is upregulated in
TGF-β-induced epithelial-to-mesenchymal transition. (A) U251 cells
were incubated with 10 ng/ml TGF-β for 72 h and MDM2 expression was
analyzed by semi-quantitative reverse transcription PCR. The
control group was incubated with an equal volume buffer solution in
the U251 cell line. GAPDH was used as a control. (B) U251
cells were incubated with 10 ng/ml TGF-β for 72 h and the MDM2
expression was analyzed by quantitative PCR. GAPDH was used
as a control. (C) MDM2, p53, E-CAD, N-CAD and VIM protein
expression was analyzed by western blotting in U251 cells treated
with 10 ng/ml TGF-β for 72 h. GAPDH was used as a loading control.
(D) Semi-quantitative analysis of the expression levels of MDM2,
E-CAD, N-CAD, VIM and p53 in U251 cells treated with 10 ng/ml TGF-β
for 72 h. GAPDH was used as a control. For all quantifications,
data are presented as the mean ± SD derived from three independent
experiments. Comparisons were made using Student's t-test.
*P<0.05; **P<0.01; ***P<0.001. The control group was the
U251 cell line, which was incubated with an equal volume of buffer
solution. Ctrl, control; E-CAD, E-cadherin; IB, immunoblotting;
MDM2, MDM2 proto-oncogene, E3 ubiquitin protein ligase; N-CAD,
N-cadherin; VIM, vimentin. |
MDM2 overexpression induces EMT in
U251 glioma cells
The aforementioned results demonstrated that MDM2
expression was upregulated by TGF-β-induced EMT. Furthermore, a
previous study has reported that MDM2 can promote EMT in breast
cancer cells (42). Therefore,
clinical glioma samples were collected from patients with different
pathological gradings. These tumor samples were then processed for
immunohistochemistry. According to the immunohistochemistry results
and positive cell quantification data, it was identified that the
higher the glioma grading, the higher the protein expression levels
of MDM2 (Fig. 2A). Additionally, the
present study used qPCR and western blotting to analyze MDM2 gene
and protein expression, respectively, in tumor samples. Similar to
the immunohistochemistry findings, it was observed that the
expression levels of MDM2 were positively associated with
pathological grade. MDM2 expression in G3 glioma samples was the
highest, and it was the lowest in G1 glioma samples (Fig. 2B-D). It is well known that higher
tumor pathological grades are strongly associated with higher
malignancy and lower tumor differentiation, which results in higher
metastatic potential (6,7). EMT is an important mechanism enabling
tumor metastasis (6–8). The present data suggested that MDM2 may
serve a key role in inducing EMT in glioma. Therefore, the present
study aimed to determine whether MDM2 overexpression could induce
EMT in U251 cells. pLenti-CMV-MDM2-GFP-puro (Fig. S1A) was a flexible and convenient tool
for studying MDM2 expression by tracking green fluorescence by
microscopy. Recombinant lentiviral plasmid
(pLenti-CMV-MDM2-GFP-puro) was co-transfected into 293T packaging
cells to generate MDM2-GFP lentivirus. In the control group, empty
vector pLenti-CMV-Puro was used. After 36 h, green fluorescence was
observed (Fig. S1C), and the virus
was then collected and concentrated by ultracentrifugation. Viral
titers were measured, and then the virus was added to U251 cells.
After purification, green fluorescence was observed in stable puro
positive U251 cells (Fig. S1D).
Stable control U251 cells and stable U251 cells overexpressing
MDM2-GFP were collected, and total RNA was extracted. The gene
expression levels of MDM2, p53, E-CAD, N-CAD and VIM
were analyzed (Fig. 2E).
Subsequently, band intensity was quantified by SqRT-PCR (Fig. 2E). As shown by the quantification
data, MDM2 overexpression significantly decreased the gene
expression levels of E-CAD and significantly increased the
gene expression levels of N-CAD and VIM at the same
time. This suggested that EMT had been successfully induced
compared with the control group (Fig. 2E
and F). qPCR was also used to verify these in stable control
U251 cells and stable U251 cells overexpressing MDM2-GFP (Fig. 2F). p53 gene expression was also
decreased significantly compared with the control group due to the
degradation of p53 by MDM2 overexpression (Fig. 2E and F). MDM2, p53, E-CAD, N-CAD and
VIM protein expression in stable control U251 cells and stable U251
cells overexpressing MDM2-GFP was then analyzed by western
blotting. Consistent with the gene expression data, MDM2
overexpression significantly decreased the protein expression
levels of E-CAD and p53, and markedly increased the protein
expression levels of N-CAD and VIM (Fig.
2G). MDM2 overexpression and control U251 cell lines were then
used for RNA-Seq. GSEA revealed that the EMT pathway gene set was
closely associated with the expression levels of MDM2 compared with
the control group (Fig. 2H). Overall,
MDM2 overexpression could induce EMT in U251 cells.
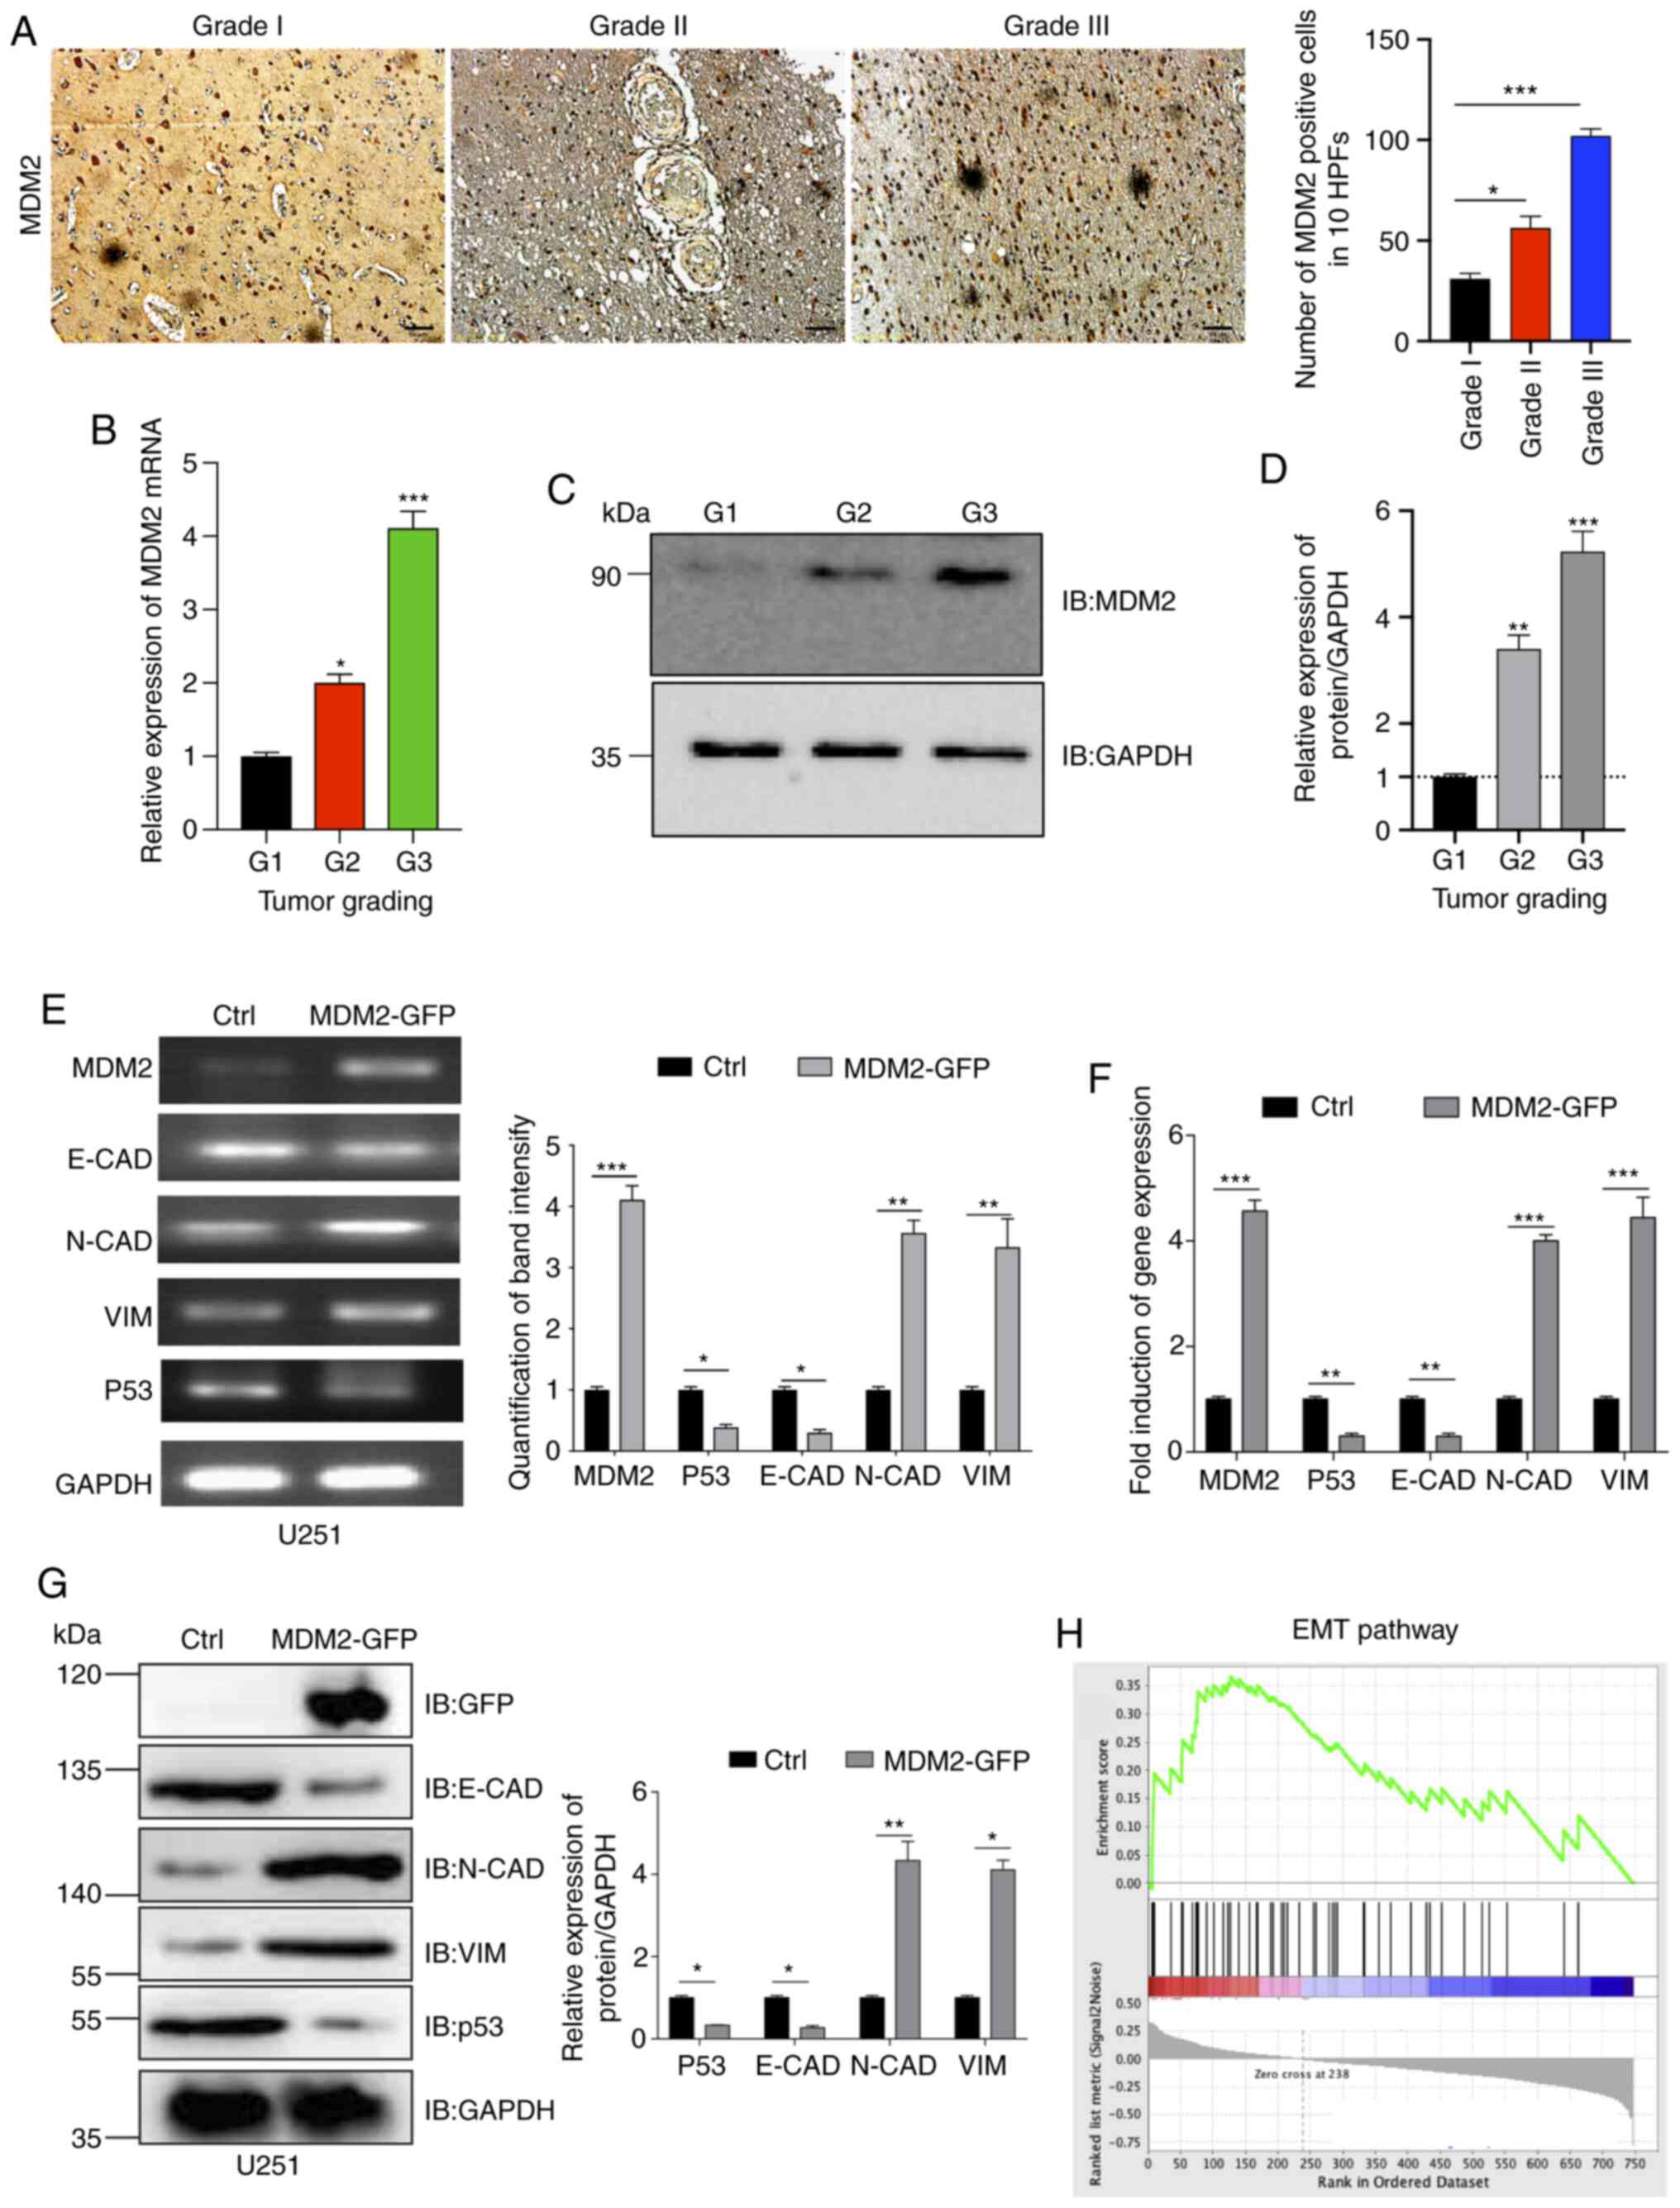 | Figure 2.MDM2 overexpression induces EMT in
U251 cells. (A) Immunohistochemical staining of MDM2 and
quantification of positive MDM2 cells in 10 HPFs. Data are from
clinical patient glioma samples that represented 5–6 patients from
each group. Scale bars, 50 µm. (B) qPCR analyses of MDM2 expression
in indicated clinical patient glioma samples (three randomly
selected samples per group). GAPDH served as a control. (C)
Immunoblot analyses of MDM2 expression in indicated clinical
patient glioma samples. GAPDH served as a loading control. (D)
Densitometric quantitation of the relative expression levels of the
MDM2 protein in the clinical patient glioma samples. n=3
independent experiments. (E) MDM2, p53 and EMT levels were
analyzed by semi-quantitative reverse transcription PCR. Ctrl
referred to the U251 cell line with stable overexpression of
plenti-CMV-puro empty vector. GAPDH was used as a control.
(F) MDM2, p53 and E-CAD, N-CAD and VIM
expression was analyzed by qPCR. Ctrl referred to the U251 cell
line with stable overexpression of plenti-CMV-puro empty vector.
(G) Immunoblot analyses and semi-quantitative analysis of the
expression levels of MDM2, E-CAD, N-CAD, VIM and p53 in stable MDM2
overexpression cells and control cells. Ctrl referred to the U251
cell line with stable overexpression of plenti-CMV-puro empty
vector. (H) Gene Set Enrichment Analysis plot for U251 cells
showing the most significantly changed EMT pathway gene set. Note
that the EMT gene signature was significantly upregulated upon
expression of MDM2 but downregulated upon expression of empty
vector. For all quantifications, data are presented as the mean ±
SD derived from three independent experiments. Statistical
significance was analyzed using an unpaired Student's t-test in (E,
F and G) Statistical significance was analyzed using one-way ANOVA
with Tukey's post hoc test to correct for multiple comparisons in
(A, B and D). *P<0.05; **P<0.01; ***P<0.001 vs. G1 or as
indicated. Ctrl, control; E-CAD, E-cadherin; EMT,
epithelial-to-mesenchymal transition; GFP, green fluorescent
protein; HPFs, high-power fields; IB, immunoblotting; MDM2, MDM2
proto-oncogene, E3 ubiquitin protein ligase; N-CAD, N-cadherin;
qPCR, quantitative PCR; VIM, vimentin. |
MDM2 overexpression induces EMT in
A549 and MCF7 cancer cells
The aforementioned results demonstrated that
overexpression of MDM2 could promote EMT in the U251 glioma cell
line. Subsequently, the present study examined whether MDM2
overexpression induced EMT in other cancer cell lines. Lentivirus
from 293T cells was added to the A549 lung cancer cell line to
yield control A549 cells and A549 cells stably overexpressing
MDM2-GFP. Green fluorescence was observed in stable A549 cells
after purification (Fig. S1E), and
the gene and protein expression levels of MDM2-GFP were assessed by
qPCR (Fig. S2A) and western blotting
(Fig. S2B). Subsequently, the gene
expression levels of E-CAD, N-CAD and VIM were
determined by SqRT-PCR and qPCR in these two stable A549 cell lines
(Fig. 3A and B). As shown in the
quantification analysis, MDM2 overexpression significantly
decreased the gene expression levels of E-CAD and
significantly increased the gene expression levels of N-CAD
and VIM. Furthermore, the migration ability of these two
stable cell lines was determined. Scratch wound assays were used to
evaluate their migration abilities and the percentage closure of
the scratch wound was quantified at 0, 24 and 48 h post injury in
these two cell lines (Fig. 3C). As
shown by the images of migration and quantification data, the
percentage closure in the MDM2 overexpression group was higher than
that in the control group at 24 and 48 h post injury (Fig. 3C). These data demonstrated that MDM2
overexpression increased the cell migration abilities of A549
cells. Additionally, E-CAD, N-CAD and VIM protein expression was
analyzed by western blotting (Fig. 3D and
E). Consistently, MDM2 overexpression significantly decreased
the protein expression levels of E-CAD and significantly increased
the protein expression levels of N-CAD and VIM (Fig. 3D and E). Therefore, the present data
demonstrated that MDM2 overexpression induced EMT in the A549 lung
cancer cell line. Furthermore, this was also tested in the MCF7
breast cancer cell line. Green fluorescence was observed in stable
MCF7 cells after purification (Fig.
S1F), and gene and protein expression levels of MDM2-GFP were
assessed by qPCR (Fig. S2C) and
western blotting (Fig. S2D).
According to SqRT-PCR, qPCR and western blotting data, MDM2
overexpression also induced EMT in MCF7 cells (Fig. 3F-H). Therefore, overexpression of MDM2
promoted EMT in a number of cancer cell lines.
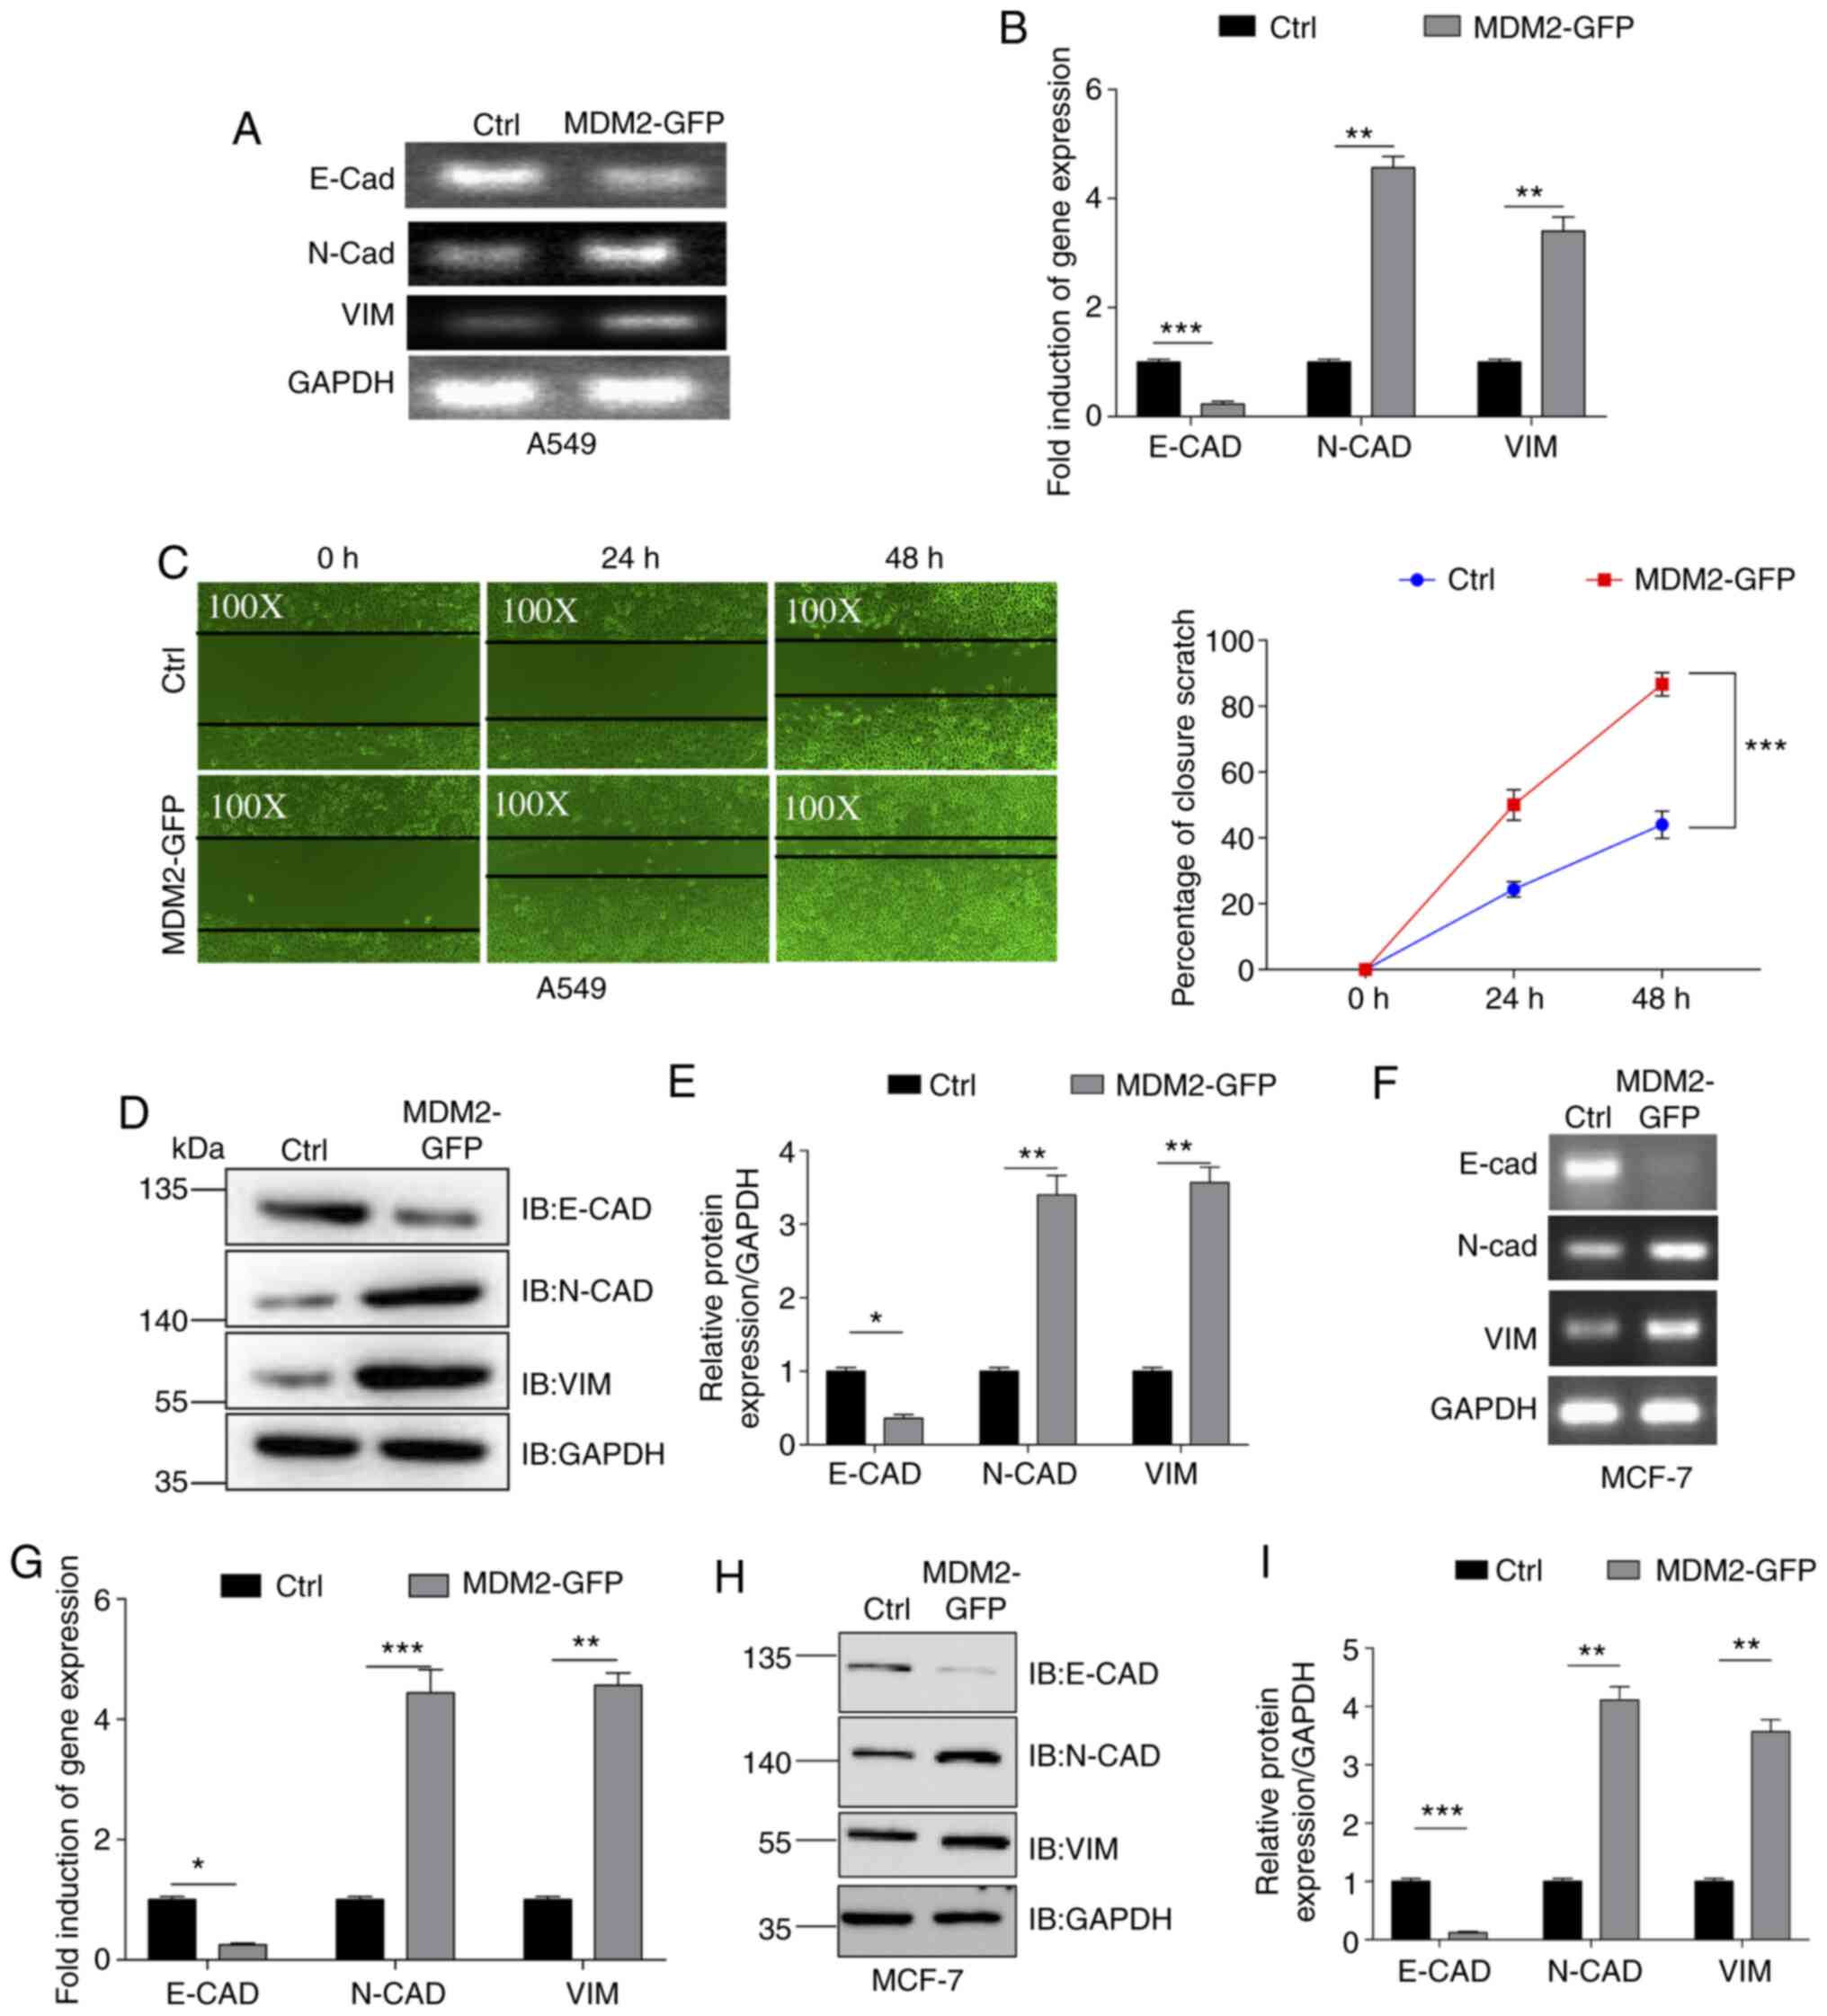 | Figure 3.MDM2 overexpression induces EMT in
A549 and MCF7 cells. (A) EMT levels were analyzed by SqRT-PCR.
GAPDH served as a control. Ctrl referred to the A549 cell
line with stable overexpression of plenti-CMV-puro empty vector.
(B) E-CAD, N-CAD and VIM levels were analyzed by qPCR
in a A549 stable cell line. Ctrl referred to the A549 cell line
with stable overexpression plenti-CMV-puro empty vector.
GAPDH served as a control. (C) Migration of
MDM2-GFP-overexpressing A549 cells (magnification, ×100) and
control cells (magnification, ×100) at 0, 24 and 48 h after
wounding. Data are presented as the percentage closure of each
scratch at 0, 24 and 48 h after wounding. MDM2 overexpression
significantly induced cell migration in A549 cells. Ctrl referred
to the A549 cell line with stable overexpression of plenti-CMV-puro
empty vector. (D) E-CAD, N-CAD and VIM levels were analyzed by
western blotting in a MDM2-overexpressing A549 stable cell line and
A549 control cells. Ctrl referred to the A549 cell line with stable
overexpression of plenti-CMV-puro empty vector. (E)
Semi-quantification of the relative expression levels of the E-CAD,
N-CAD and VIM levels in a MDM2-overexpressing A549 stable cell line
and A549 control cells. n=3 independent experiments. Ctrl referred
to the A549 cell line with stable overexpression of plenti-CMV-puro
empty vector. (F) EMT levels were analyzed by SqRT-PCR in MCF7
stable cell lines. Ctrl referred to the MCF7 cell line with stable
overexpression of plenti-CMV-puro empty vector. GAPDH served
as a control. (G) E-CAD, N-CAD and VIM levels were
analyzed by qPCR in MCF7 stable cell lines. Ctrl referred to the
MCF7 cell line with stable overexpression of plenti-CMV-puro empty
vector. GAPDH served as a control. (H and I) E-CAD, N-CAD
and VIM expression was analyzed by western blotting in MCF7 stable
cell lines. Ctrl referred to the MCF7 cell line with stable
overexpression of plenti-CMV-puro empty vector. For all
quantifications, data are presented as the mean ± SD derived from
three independent experiments. Comparisons were made using
Student's t-test. *P<0.05; **P<0.01; ***P<0.001. Ctrl,
control; E-CAD, E-cadherin; EMT, epithelial-to-mesenchymal
transition; GFP, green fluorescent protein; IB, immunoblotting;
MDM2, MDM2 proto-oncogene, E3 ubiquitin protein ligase; N-CAD,
N-cadherin; qPCR, quantitative PCR; SqRT-PCR, semi-quantitative
reverse transcription PCR; VIM, vimentin. |
MDM2 induces EMT by activating B-Raf
signaling
Previously, it was demonstrated that MDM2 promoted
EMT in glioma cells (U251), lung cancer cells (A549) and breast
cancer cells (MCF7). However, the mechanism by which MDM2 induced
EMT was not clear. Therefore, the present study aimed to determine
the mechanism driving this EMT. It was previously identified that
the protein expression levels of E-CAD, N-CAD and VIM were altered,
and the gene levels were also altered. This suggested that the
transcription factors that control EMT may have been upregulated
when MDM2 was overexpressed. Snail, Slug and ZEB1 are the most
important transcriptional factors of EMT (Fig. 4A) (6,43,44). Therefore, Snail, Slug and ZEB1 protein
expression was analyzed by western blotting in stable
MDM2-overexpressing U251 cells and control U251 cells. As shown in
the semi-quantification data, MDM2 overexpression significantly
upregulated the protein expression levels of Snail, Slug and ZEB1
(Fig. 4A). Since these transcription
factors were activated, the present study aimed to determine the
upstream signaling pathway driving their upregulation. Therefore,
GSEA was used to analyze these two stable cell lines, and revealed
that the gene set for the B-Raf signaling pathway was closely
associated with MDM2 expression compared with the control group
(Fig. 4B). Additionally, GSEA was
used to analyze whether the mTOR signaling pathway was associated
with the expression levels of MDM2. However, according to the
present data, no significant association was observed between the
mTOR signaling pathway and MDM2 overexpression in U251 cells (data
not shown). Subsequently, western blotting was used to analyze the
levels of p-B-Raf, p-MEK and p-ERK to verify whether the B-Raf
signaling pathway was activated by MDM2 overexpression. Consistent
with the present GSEA data, western blotting demonstrated that the
B-Raf signaling pathway was activated (Fig. 4C). Furthermore, the levels of p-P70S6K
and p-4EBP1, downstream target genes of mTOR, were determined by
western blotting (45–47). No significant changes in the levels of
p-P70S6K and p-4EBP1 were detected, indicating that this process
was independent of the mTOR signaling pathway (Fig. 4C). E-CAD levels were also analyzed by
western blotting in stable control U251 cells and stable U251 cells
overexpressing MDM2-GFP following treatment with DMSO, vemurafenib
(B-Raf inhibitor) (48,49), U0126 (MEK inhibitor) (50,51) and
FR180204 (ERK inhibitor) (52,53). As
shown in Fig. 4, vemurafenib, U0126
and FR180204 could prevent the decrease in the protein expression
of E-CAD (Fig. 4D and F). However,
RSK inhibitor SL0101 did not affect the protein expression of E-CAD
(Fig. 4D and F), which suggested that
inhibition of B-Raf signaling could prevent MDM2 from inducing EMT.
In other words, MDM2 promoted EMT by activating the B-Raf signaling
pathway. Subsequently, the protein expression levels of Snail, Slug
and ZEB1 were analyzed by western blotting in MDM2-overexpressing
U251 cells which were treated with FR180204 and in control U251
cells (U251 cell line with stable overexpression of plenti-CMV-puro
empty vector). No significant changes in the expression levels of
Snail, Slug or ZEB1 were detected between the two groups by western
blotting, which suggested that ERK inhibition could inhibit the
increase of these EMT transcription factors (Fig. 4E). These data verified that MDM2
induced EMT by upregulating EMT transcription factors via the B-Raf
signaling pathway. Additionally, the present data demonstrated that
B-Raf inhibitors, MEK inhibitors and ERK inhibitors could all
rescue the protein expression levels of E-CAD. RSK is a downstream
protein kinase of ERK (54,55). To determine whether components
downstream of ERK also participated in this process, western
blotting was used to analyze E-CAD protein expression in control
U251 cells and MDM2-overexpressing U251 cells treated with SL0101
(RSK inhibitor). As shown in the western blot images and
semi-quantification data, only the RSK inhibitor had no effect on
the protein expression levels of E-CAD (Fig. 4F), while all other drugs did have an
effect. These data demonstrated that MDM2 induced EMT by
upregulating EMT transcription factors via activation of ERK rather
than through the ERK signaling pathway. Additionally, this
mechanism was assessed in other cell lines, and E-CAD levels were
analyzed by western blotting in control A549 cells and
MDM2-overexpressing A549 cells treated with DMSO, vemurafenib,
U0126 or FR180204. Similar to the results in U251 cells, B-Raf, MEK
and ERK inhibitors could all rescue a decrease in E-CAD protein
expression (Fig. 4G). Furthermore,
the same experiment was repeated in MCF7 cells (Fig. 4H). To summarize, MDM2 induced EMT by
upregulating EMT transcription factors via activation of ERK
regulated by B-Raf.
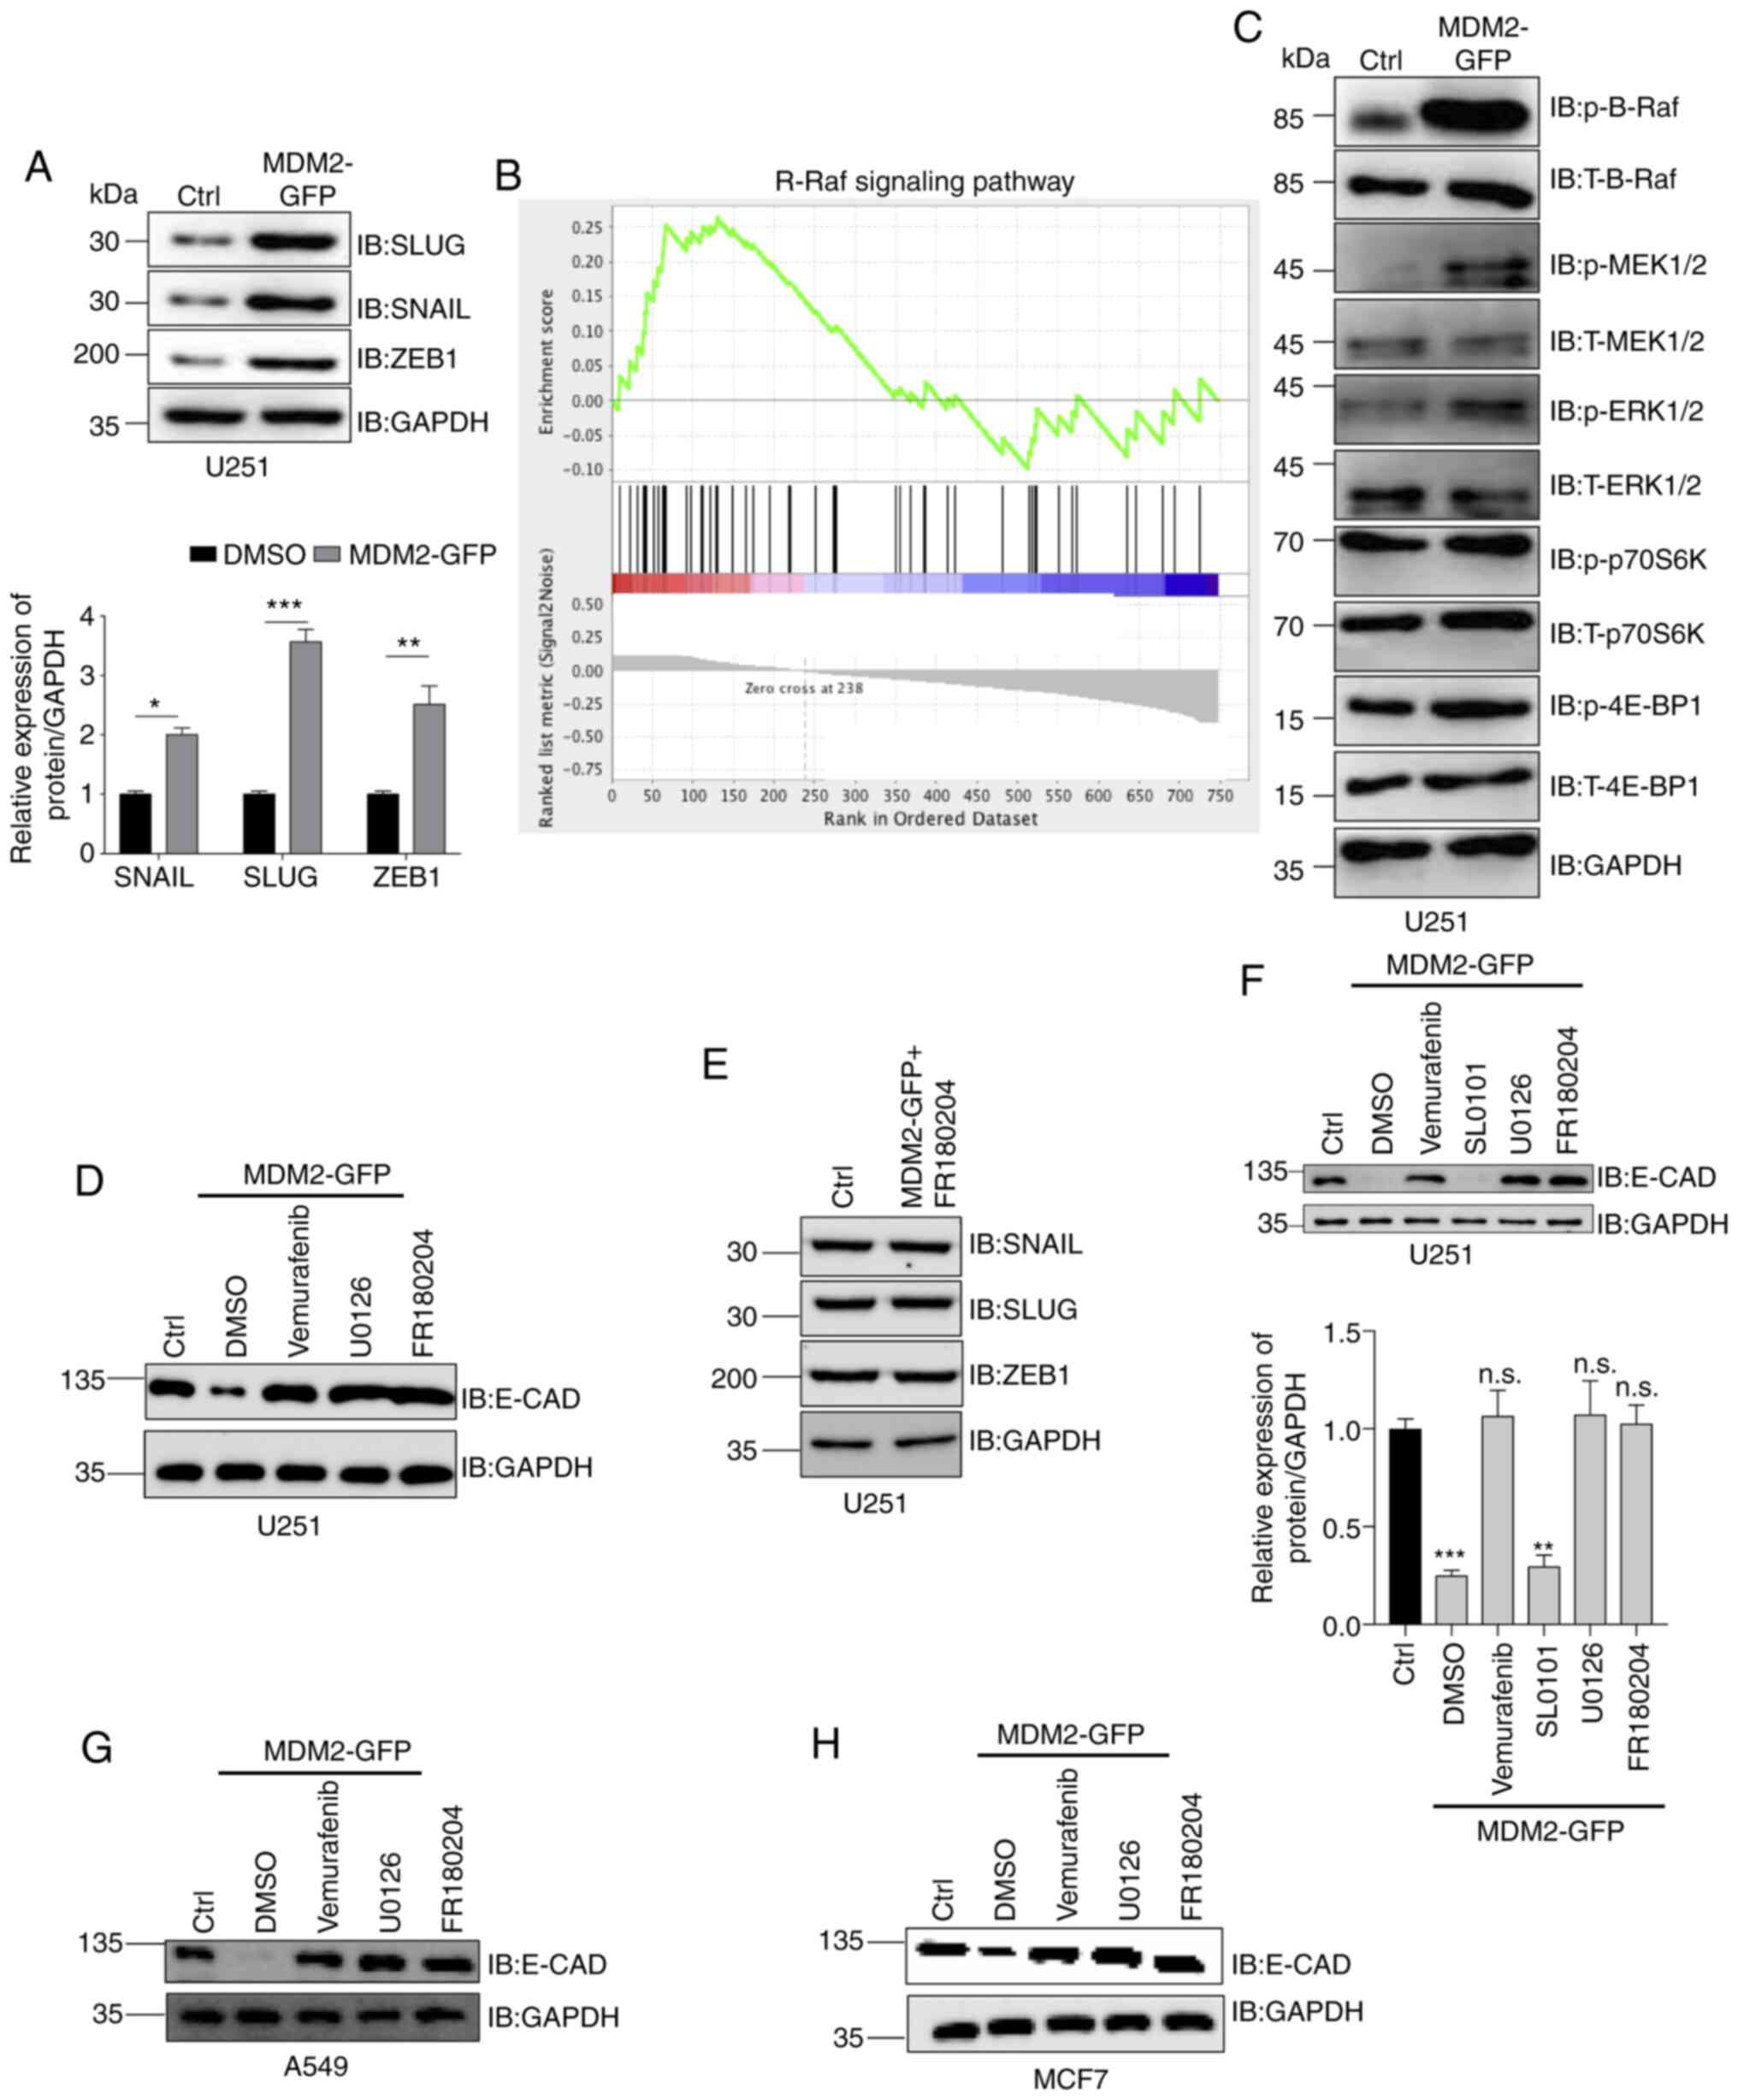 | Figure 4.MDM2 induces
epithelial-to-mesenchymal transition progression via the B-Raf
signaling pathway. (A) Snail, Slug and ZEB1 expression was analyzed
by western blotting in stable MDM2-overexpressing U251 cells and
control U251 cells. Ctrl referred to the U251 cell line with stable
overexpression of plenti-CMV-puro empty vector. GAPDH was used as a
control, and semi-quantitative analysis is shown. (B) Gene Set
Enrichment Analysis plot of U251 cells showing the most
significantly changed B-Raf signaling pathway set. Note that the
B-Raf signaling pathway was significantly upregulated upon
expression of MDM2 but downregulated upon expression of empty
vector. (C) Western blot analysis of the levels of p-B-Raf, p-MEK,
p-ERK, p-P70S6K and p-4EBP1 in stable MDM2-overexpressing U251
cells and control U251 cells. Ctrl referred to the U251 cell line
with stable overexpression of plenti-CMV-puro empty vector. GAPDH
served as a control. (D) E-CAD levels were analyzed by western
blotting in control U251 cells and stable MDM2-overexpressing U251
cells following treatment with DMSO, vemurafenib (B-Rafi at 2 µM
for 24 h), U0126 (MEKi at 20 µM for 24 h) and FR180204 (ERKi at 10
µM for 24 h). Ctrl referred to the U251 cell line with stable
overexpression of plenti-CMV-puro empty vector. GAPDH was used as a
control. (E) Snail, Slug and ZEB1 levels were analyzed by western
blotting in control U251 cells and stable MDM2-overexpressing U251
cells treated with FR180204 (ERKi at 10 µM for 24 h). Ctrl referred
to the U251 cell line with stable overexpression of plenti-CMV-puro
empty vector. GAPDH was used as a normalization control. (F) E-CAD
expression was analyzed by western blotting in stable control U251
cells and stable MDM2-overexpressing U251 cells treated with
Vemurafenib, U0126, FR180204 and SL0101 (RSKi at 50 µM for 24 h).
Ctrl referred to the U251 cell line with stable overexpression of
plenti-CMV-puro empty vector. GAPDH was used as a control, and the
band density was semi-quantified. (G) E-CAD expression was analyzed
by western blotting in stable control A549 cells and stable
MDM2-overexpressing A549 cells treated with DMSO, vemurafenib
(B-Rafi at 2 µM for 24 h), U0126 (MEKi at 20 µM for 24 h), and
FR180204 (ERKi at 10 µM for 24 h). Ctrl referred to the A549 cell
line with stable overexpression of plenti-CMV-puro empty vector.
GAPDH was used as a control. (H) E-CAD levels were analyzed by
western blotting in stable control MCF7 cells and stable
MDM2-overexpressing MCF7 cells treated with DMSO, vemurafenib
(B-Rafi at 2 µM for 24 h), U0126 (MEKi at 20 µM for 24 h) or
FR180204 (ERKi at 10 µM for 24 h). Ctrl referred to the MCF7 cell
line with stable overexpression of plenti-CMV-puro empty vector.
GAPDH was used as a control. For all quantifications, data are
presented as the mean ± SD derived from three independent
experiments. Statistical significance was analyzed using an
unpaired Student's t-test for A, and one-way ANOVA with Tukey's
post hoc test was used to compare the indicated group and Ctrl in
F. *P<0.05; **P<0.01; ***P<0.001; n.s., not significant
vs. Ctrl or as indicated. 4EBP1, eukaryotic translation initiation
factor 4E binding protein 1; BRafi, B-Raf inbibitor; Ctrl, control;
E-CAD, E-cadherin; ERKi, ERK inhibitor; GFP, green fluorescent
protein; IB, immunoblotting; MDM2, MDM2 proto-oncogene, E3
ubiquitin protein ligase; MEKi, MEK inhibitor; p-, phosphorylated;
P70S6K, ribosomal protein S6 kinase; RSKi, RSK inhibitor; Slug,
Snail family transcriptional repressor 2; Snail, Snail family
transcriptional repressor 1; T-, total; ZEB1, zinc finger E-box
binding homeobox 1. |
MDM2 activates B-Raf signaling through
14-3-3 and p53
As demonstrated in the aforementioned experiments,
MDM2 induced EMT by upregulating EMT transcription factors through
ERK. Furthermore, it was revealed that MDM2 expression was
associated with the degradation of p53, thus decreasing the protein
expression levels of p53 (Fig. 2E-G).
Therefore, the present study aimed to explore whether the mechanism
of MDM2-induced EMT depended on p53. qPCR and western blotting were
used to analyze p53, E-CAD, N-CAD and VIM protein expression in
control U251 cells and U251 cells overexpressing p53 together with
MDM2-GFP (Figs. 5A and S2E). As shown in Fig. 5, overexpression of p53 rescued the
decrease of E-CAD and inhibited the increase of N-CAD and VIM
(Fig. 5A). These results indicated
that the overexpression of p53 inhibited EMT induced by MDM2. In
other words, MDM2-induced EMT was p53-dependent. Previous studies
have reported that 14-3-3 is one of the most important p53
transcriptional targets (56–59). Notably, 14-3-3 can deactivate Raf
directly and prevent its activation (24–27). The
present study used western blot analysis to determine the
expression levels of 14-3-3 in stable MDM2-overexpressing U251
cells and control U251 cells. As shown by the semi-quantitative
analysis data, 14-3-3 expression was markedly decreased in stable
MDM2-overexpressing U251 cells compared with the control group
(Fig. 5B). Furthermore, as the most
important downstream autophagy transcription factor of 14-3-3,
transcription factor EB (TFEB) expression was decreased following
MDM2 overexpression in the U251 cell line (data not shown).
Previously, the relationship of 14-3-3 with B-Raf has been
discussed, and it has been revealed that lower 14-3-3 expression is
associated with an activated B-Raf signaling pathway (39), which was consistent with the present
B-Raf signaling pathway data. Therefore, the present study aimed to
verify whether MDM2 activated the B-Raf signaling pathway via
14-3-3. 14-3-3 overexpression was checked by qPCR (Fig. S2F) and MDM2, 14-3-3, E-CAD, N-CAD,
VIM and p-B-Raf protein levels were analyzed by western blotting in
control cells and cells stably overexpressing MDM2 together with
Flag-14-3-3 (Fig. 5C). Overexpression
of 14-3-3 inhibited the activation of the B-Raf signaling pathway.
Notably, overexpression of 14-3-3 rescued the decrease in E-CAD and
inhibited the increase in N-CAD and VIM, which meant that
overexpression of 14-3-3 could prevent MDM2-induced EMT (Fig. 5C). The colony formation abilities of
control cells and MDM2-overexpressing U251 cells with or without
FR180204 were determined. As shown in the quantification data, MDM2
overexpression significantly increased the colony formation rate.
However, this increased colony formation rate induced by MDM2 could
be inhibited by treatment with an ERK inhibitor (Fig. 5D). Scratch wound assays were used to
detect the migration abilities in control cells and
MDM2-overexpressing U251 cells with or without FR180204 treatment.
The percentage closure of the scratch was quantified at 0, 24 and
48 h after wounding. As shown in the images of the migration and
the quantification data, the percentage closure of the scratch in
the MDM2 overexpression group was higher than that in the control
group at 24 and 48 h post wounding (Fig.
5E). However, there was no significant difference between MDM2
U251 cells treated with FR180204 and the control group, which meant
that the migration ability was inhibited by ERK inhibition in MDM2
U251 cells (Fig. 5E). To summarize,
MDM2 induced EMT by activating the B-Raf signaling pathway through
14-3-3, which depended on p53.
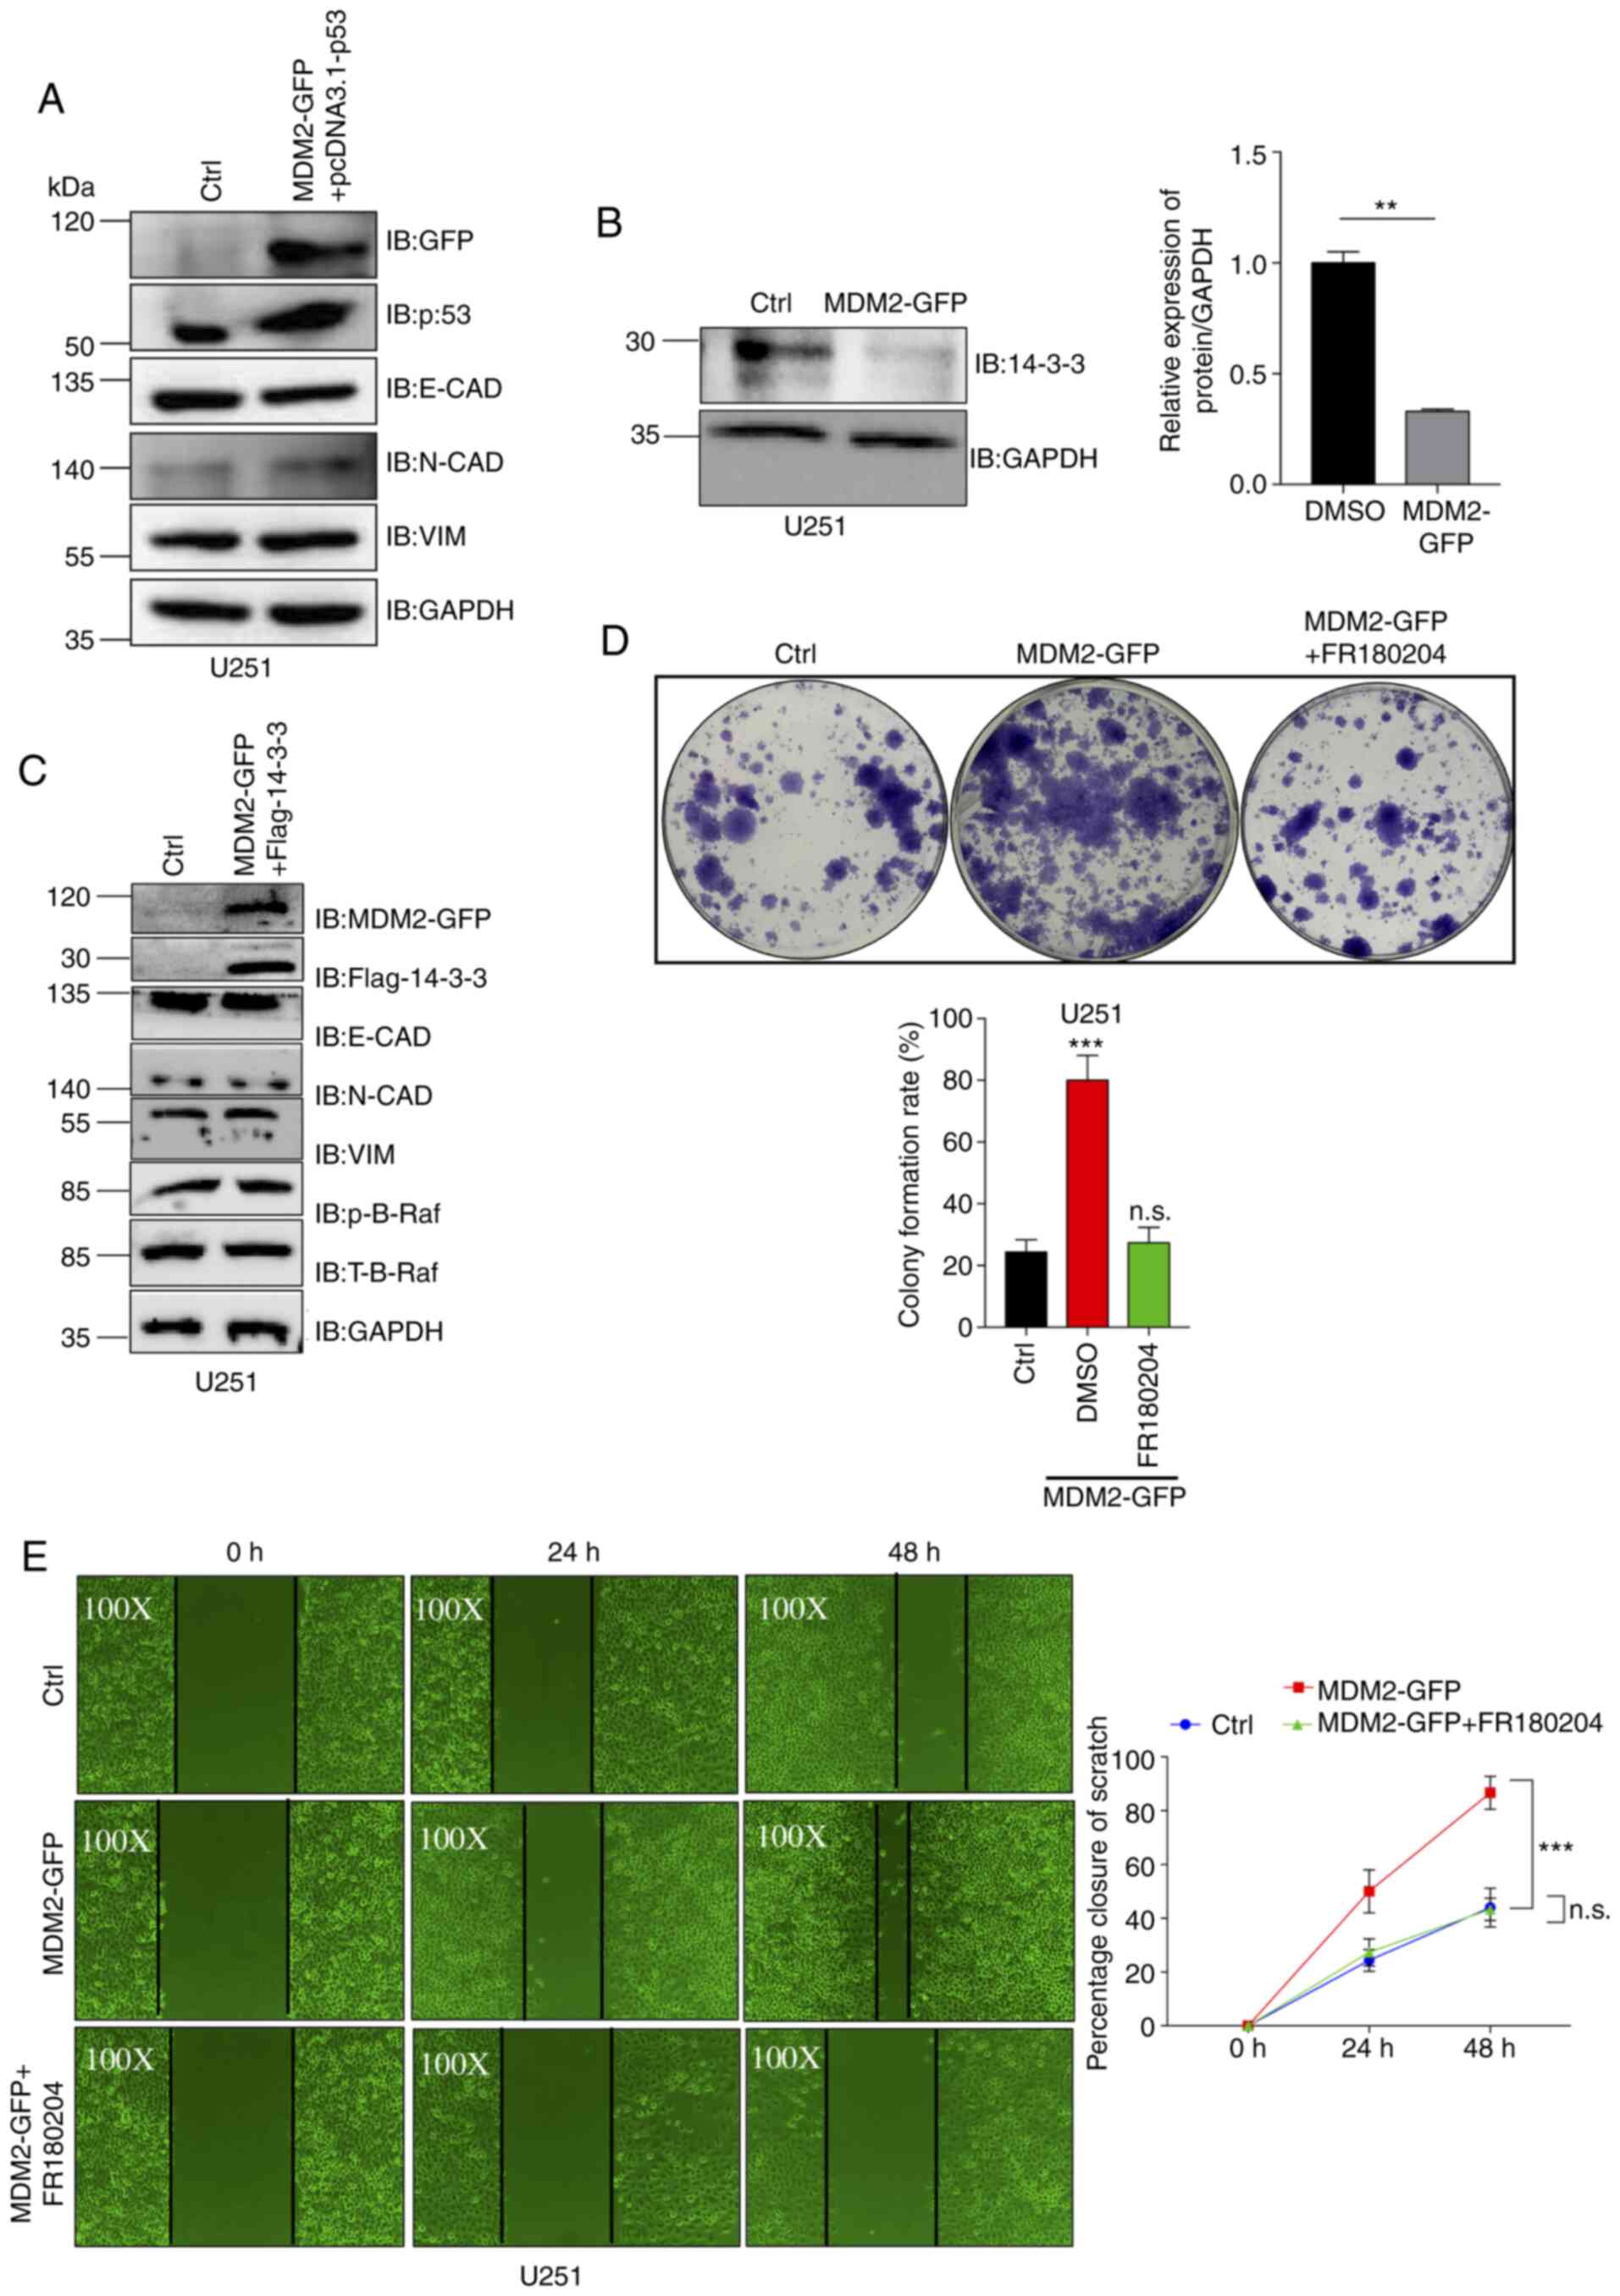 | Figure 5.MDM2-mediated B-Raf signaling pathway
activation via 14-3-3 is dependent on p53. (A) MDM2, p53, E-CAD,
N-CAD and VIM protein expression was analyzed by western blotting
in control U251 cells and stable MDM2-overexpressing U251 cells
transfected with pcDNA3.1-p53. Ctrl referred to the U251 cell line
with stable overexpression of plenti-CMV-puro empty vector. GAPDH
was used as a control. (B) Western blot analysis of the expression
levels of 14-3-3 in stable MDM2-overexpressing U251 cells and
control U251 cells. Ctrl referred to the U251 cell line with stable
overexpression of plenti-CMV-puro empty vector. GAPDH was used as a
control. Semi-quantitative analysis data are shown. (C) MDM2,
14-3-3, E-CAD, N-CAD, VIM and p-B-Raf protein expression was
analyzed by western blotting in control U251 cells and stable
MDM2-overexpressing U251 cells expressing Flag-14-3-3. Ctrl
referred to the U251 cell line with stable overexpression of
plenti-CMV-puro empty vector. GAPDH was used as a control. (D)
Colony formation assay for control U251 cells, stable
MDM2-overexpressing U251 cells and stable MDM2-overexpressing U251
cells treated with FR180204 (ERKi at 10 µM). Ctrl referred to the
U251 cell line with stable overexpression of plenti-CMV-puro empty
vector. Data are presented as the mean ± SD percentage of colonies
for each group after 14 days (bottom). n=3 independent experiments.
(E) Images of the migration of control U251 cells (magnification,
×100), stable MDM2-GFP overexpressing U251 cells (magnification,
×100) and stable MDM2-GFP-overexpressing U251 cells treated with
FR180204 (ERKi at 10 µM) (magnification, ×100) at 0, 24 and 48 h
after wounding. MDM2 could induce cell migration in U251 cells and
FR180204 treatment could rescue this cell migration in scratch
wound assays. Ctrl referred to the U251 cell line with stable
overexpression of plenti-CMV-puro empty vector. For all
quantifications, data are presented as the mean ± SD derived from
three independent experiments. Statistical significance was
analyzed using an unpaired Student's t-test in B, and one-way ANOVA
with Tukey's post hoc test was used to compare the indicated group
and Ctrl or two indicated groups in D and E. **P<0.01;
***P<0.001; n.s., not significant vs. Ctrl or as indicated.
14-3-3, tyrosine 3-monooxygenase activation protein ε; Ctrl,
control; E-CAD, E-cadherin; ERKi, ERK inhibitor; GFP, green
fluorescent protein; IB, immunoblotting; MDM2, MDM2 proto-oncogene,
E3 ubiquitin protein ligase; N-CAD, N-cadherin; p-, phosphorylated;
T-, total; VIM, vimentin. |
B-Raf signaling, which is activated by
MDM2, can promote glioma xenograft tumor progression
To assess whether MDM2 activated B-Raf signaling
function in tumor progression, a xenograft model was established in
NOD/SCID mice with U251 tumors. In agreement with the colony
formation data (Fig. 5D), MDM2
expression accelerated tumor growth. By contrast, tumor growth was
significantly inhibited when MDM2 was overexpressed together with
14-3-3 or when treated with an ERK inhibitor (Fig. 6A-C). These results indicated that the
MDM2-activated B-Raf signaling pathway promoted clonogenicity and
glioma xenograft tumor growth.
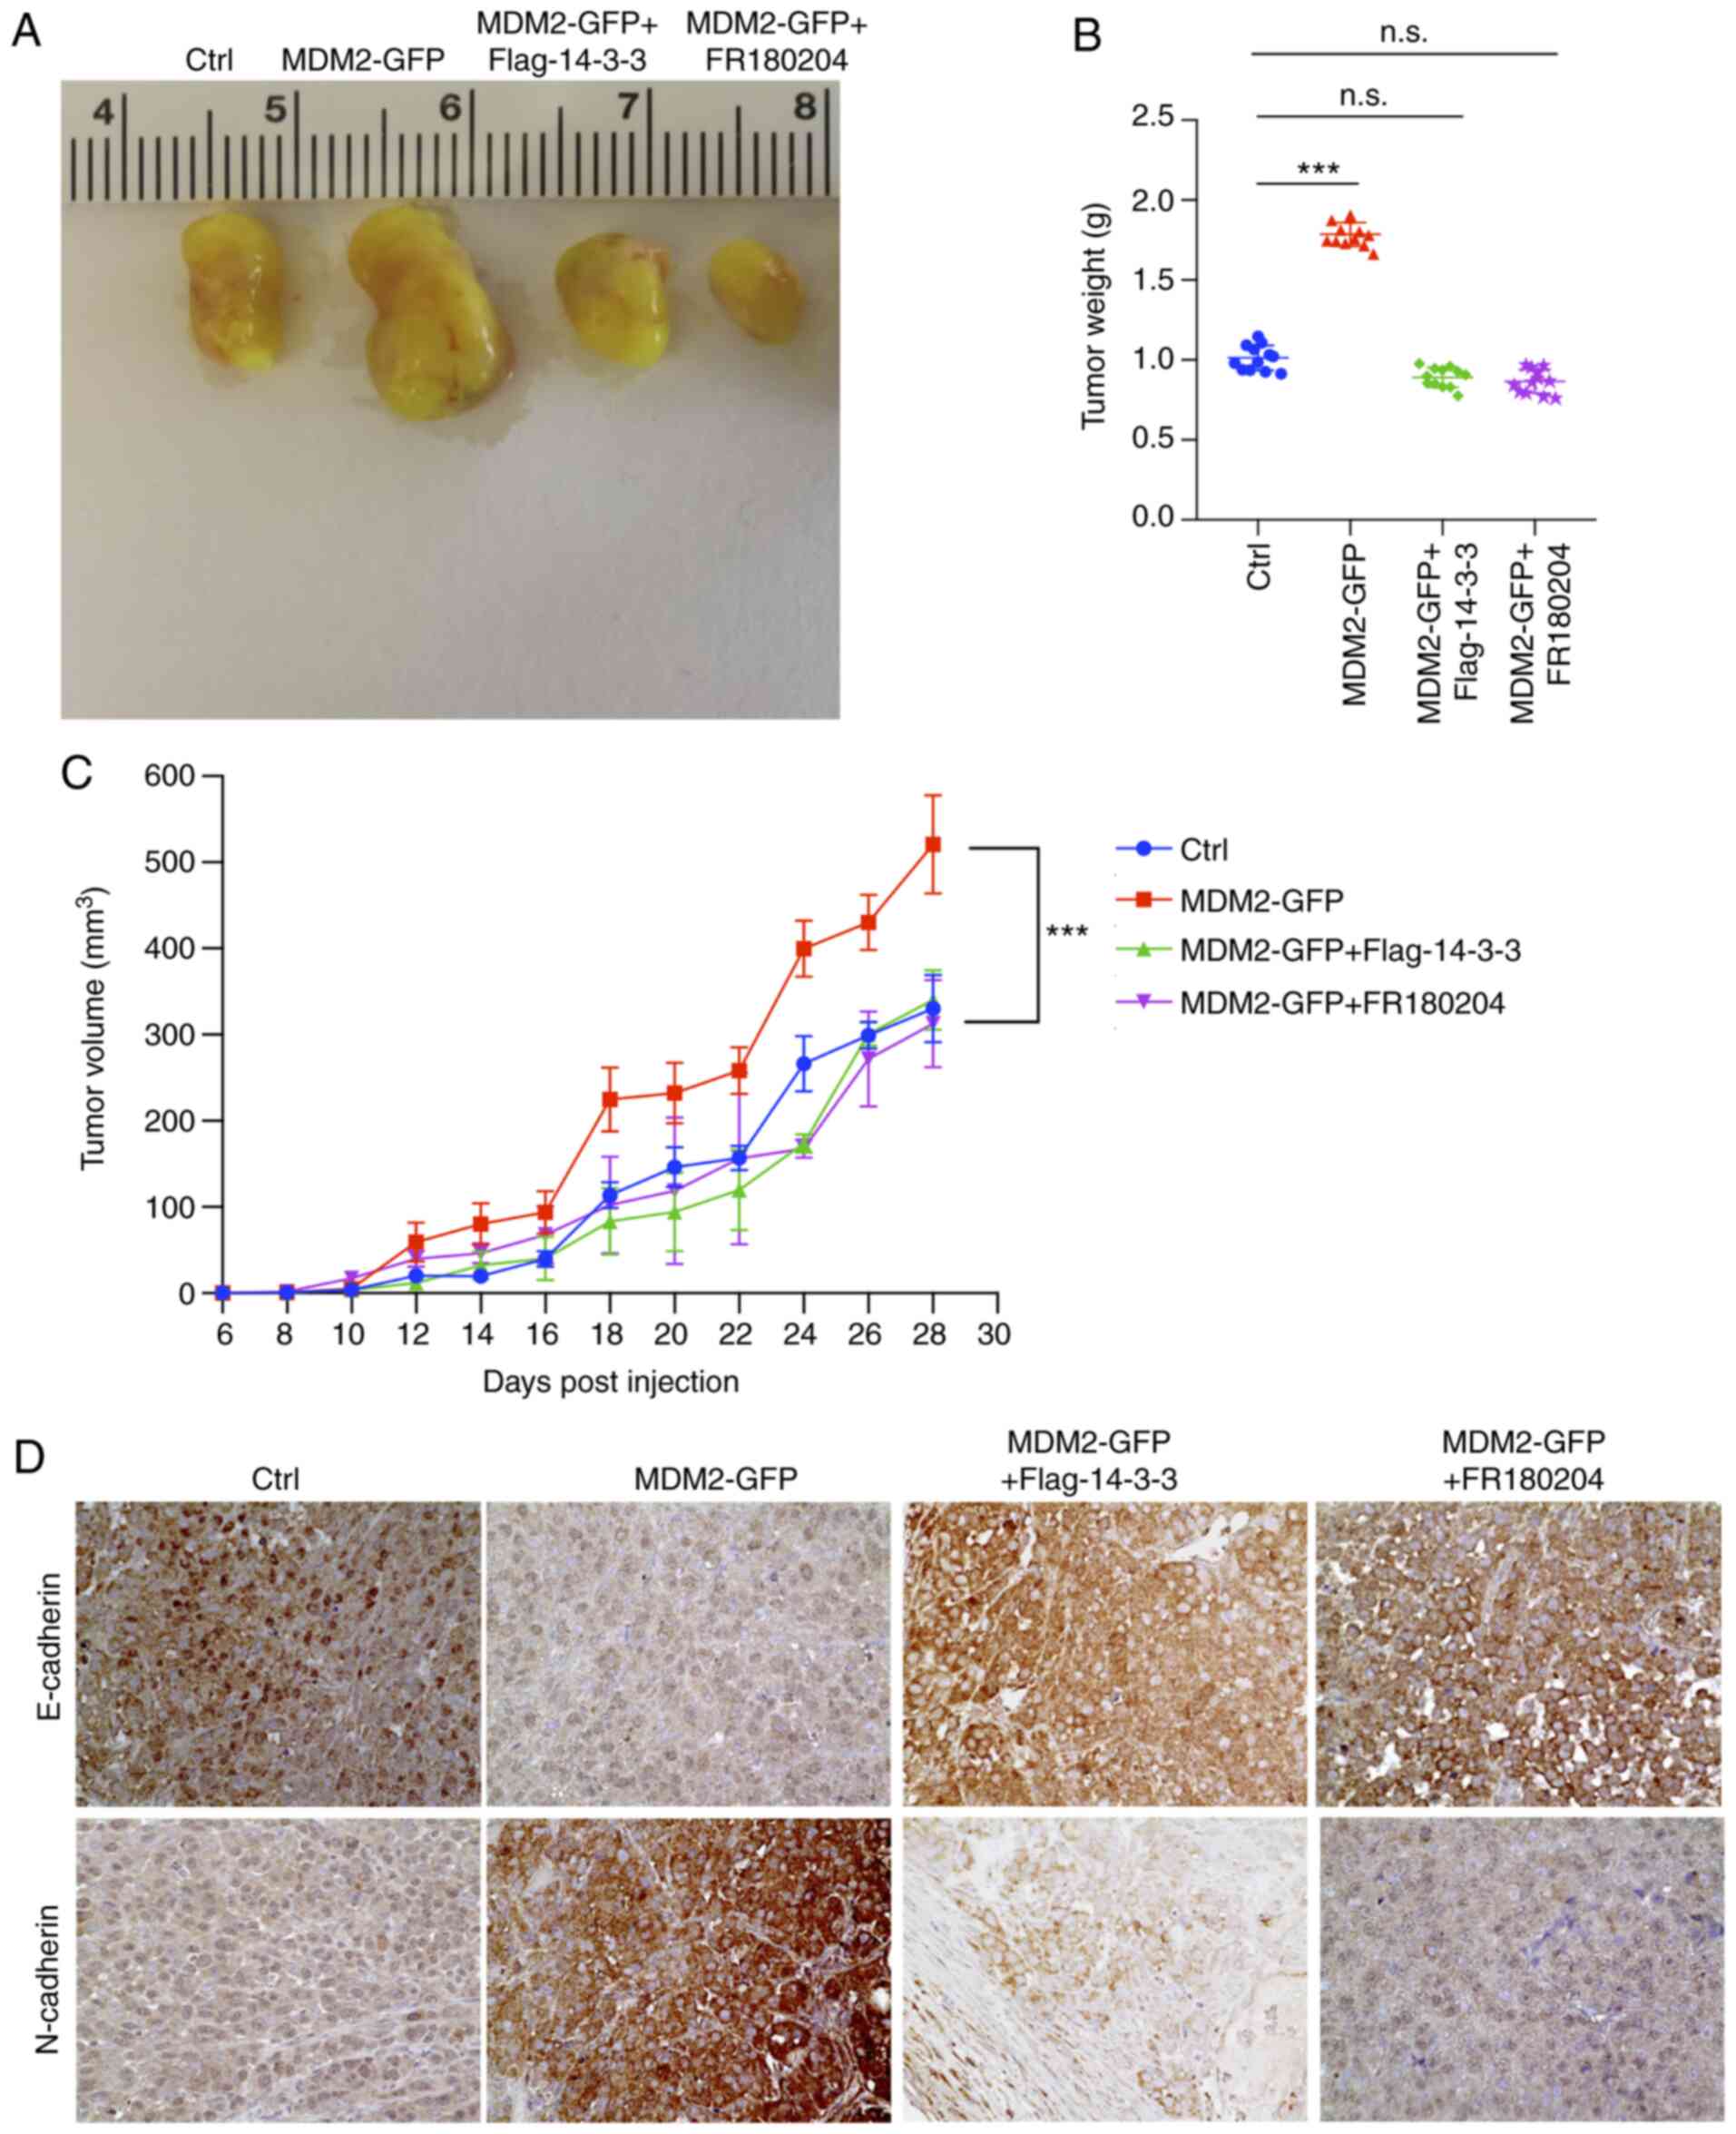 | Figure 6.B-Raf signaling, which is activated
by MDM2, can promote glioma xenograft tumor progression. (A)
Representative images of tumors of NOD/SCID mice bearing U251
×enografts stably expressing empty vector, MDM2, MDM2 together with
14-3-3 or MDM2 together with an ERK inhibitor. Tumors isolated on
day 28 after subcutaneous injection. Ctrl referred to tumors, which
were injected with the stable overexpression of plenti-CMV-puro
empty vector U251 cell line. Data are from one representative
animal of 5–6 animals from each group. (B) Tumor weight from
experiment in (A) upon autopsy at day 28 post injection. Ctrl
referred to tumors, which were injected with the stable
overexpression of plenti-CMV-puro empty vector U251 cell line.
Results are presented as the mean weight (g) ± SD for 5–6 mice per
group. (C) Tumor volume of xenografts formed after subcutaneous
injection of NOD/SCID mice with U251 cells stably expressing
indicated plasmids. Ctrl referred to tumors, which were injected
with the stable overexpression of plenti-CMV-puro empty vector U251
cell line. Results are presented as the mean volume ± SD for 5–6
mice per group per time point. (D) Immunohistochemical staining of
E-cadherin and N-cadherin in indicated U251 ×enograft tumor
genotypes (magnification, ×400). Data are from 1 animal that was
representative of the 5–6 animals from each group (n=5-6 mice per
group). Ctrl referred to tumors, which were injected with the
stable overexpression of plenti-CMV-puro empty vector U251 cell
line. For all quantifications, data are presented as the mean ± SD
derived from three independent experiments. Comparisons were made
using Student's t-test. ***P<0.001; n.s., not significant.
14-3-3, tyrosine 3-monooxygenase activation protein ε; Ctrl,
control; GFP, green fluorescent protein; MDM2, MDM2 proto-oncogene,
E3 ubiquitin protein ligase. |
Immunohistochemical analyses also demonstrated
increased N-CAD expression and decreased E-CAD expression in U251
×enografts expressing MDM2, which represented the occurrence of an
EMT process (Fig. 6D). Loss of
E-cadherin has been associated with accelerated tumor progression
and metastasis (6,7). By contrast, EMT was inhibited in
xenografts overexpressing MDM2 together with 14-3-3 or those
treated with an ERK inhibitor (Fig.
6D). This demonstrated a partial EMT-like process in MDM2
tumors, which was reversed in tumors which overexpressed Flag
14-3-3 or were treated with FR180204. Collectively, these results
indicated that the B-Raf signaling pathway serves as a downstream
effector of MDM2, contributing to tumor progression and higher
metastatic potential.
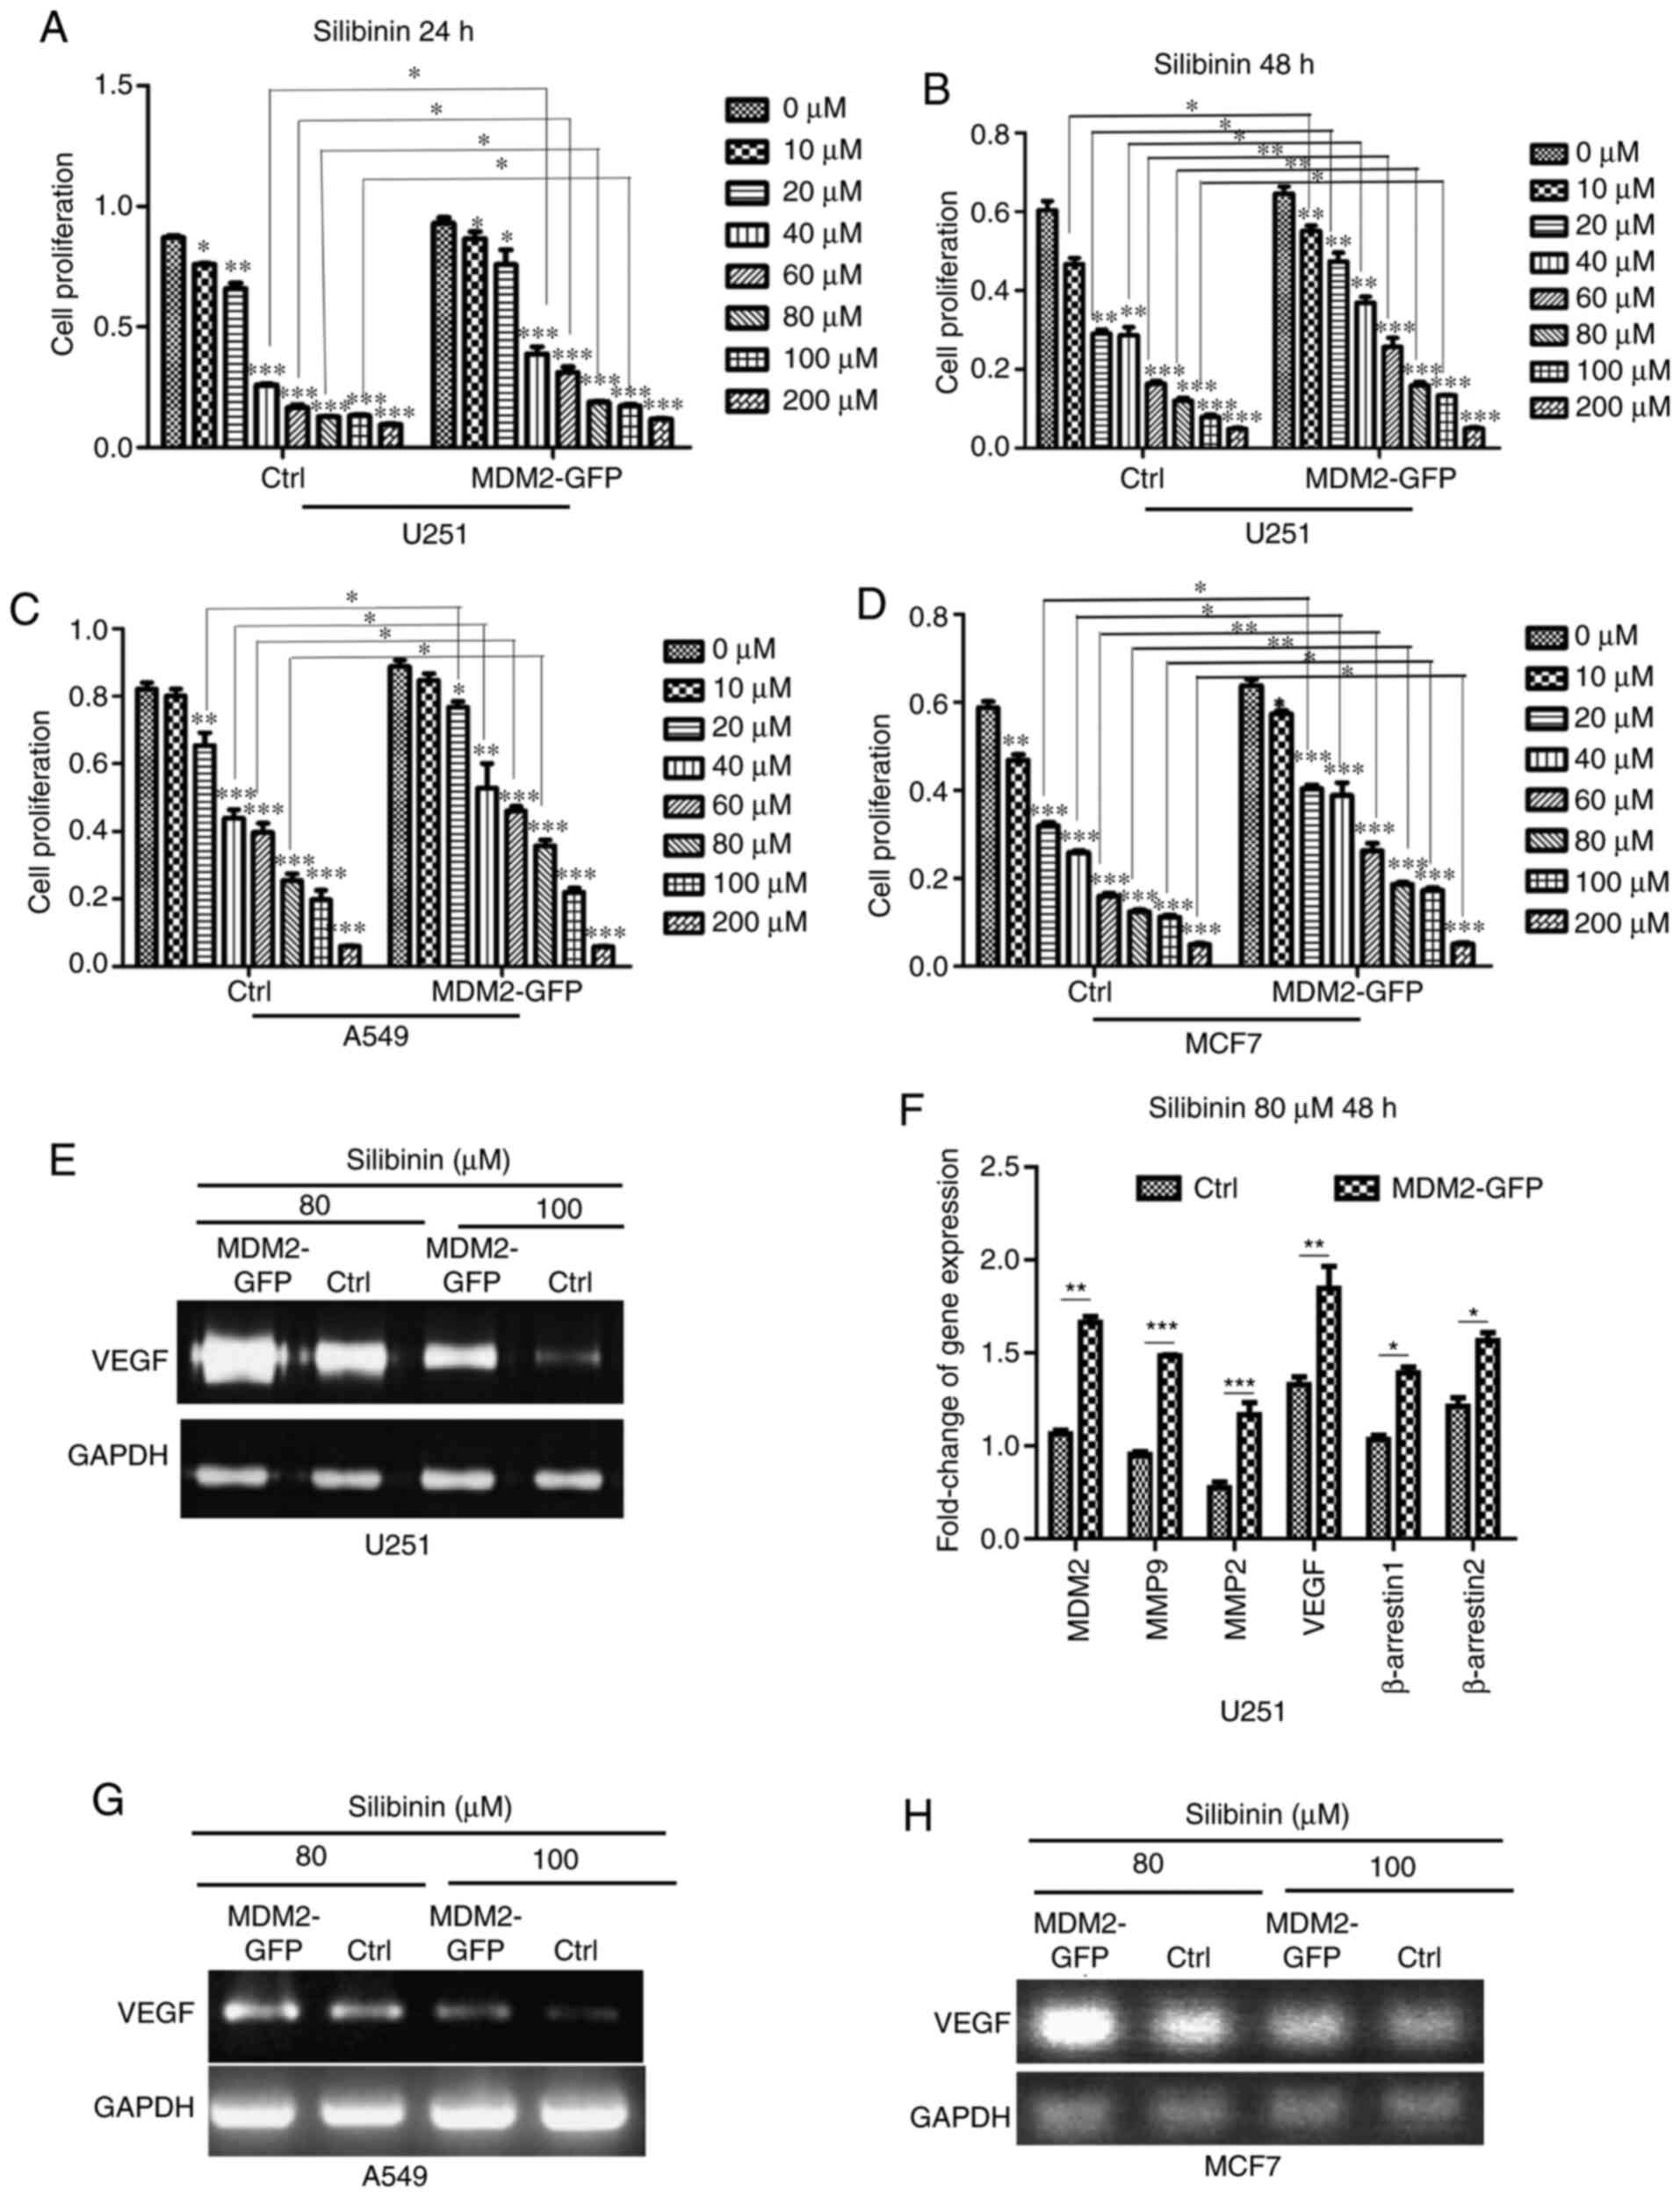
MDM2 promotes cell insensitivity to
drug treatment by inducing EMT
It has been reported that EMT contributes to cancer
cell resistance to chemotherapy agents (30–32).
According to previous studies, numerous chemicals have little or no
effect on cells that have undergone EMT in a number of cancer
types, for example breast cancer cells and glioma (30–32).
Therefore, the present study aimed to explore whether MDM2 could
promote cell insensitivity to drug treatment by inducing EMT.
Silibinin, also known as silybin, is a promising cancer treatment
drug (60,61). The present study aimed to determine
whether overexpression of MDM2 could affect drug sensitivities.
First, stable overexpression MDM2 U251 cells and control cells were
treated with indicated doses of silibinin (0, 10, 20, 40, 60, 80,
100 and 200 µM) and cell viability was determined using an MTT
assay after 24 h. As shown in the quantification data, control
cells were more sensitive to 40, 60, 80 and 100 µM silibinin
treatment than MDM2-U251 cells at 24 h (Fig. 7A). Subsequently, an MTT assay was used
again after 48 h in these two cell lines. Similar to the data from
24 h, control cells were more sensitive to silibinin treatment than
MDM2-U251 cells at 48 h (Fig. 7B).
This suggested that MDM2 promoted cell insensitivity to silibinin
by inducing EMT in the U251 glioma cell line. Furthermore, this was
verified in an A549 cell model. As shown in the quantification
data, control cells were more sensitive to 20, 40, 60 and 80 µM
silibinin treatment than MDM2-GFP cells at 48 h in A549 cell model
(Fig. 7C). Control cells were more
sensitive to 20–200 µM silibinin treatment than MDM2-GFP cells in
an MCF7 cell model (Fig. 7D).
According to previous literature reports, silibinin inhibits the
relevant pathways for angiogenesis and decreases the expression of
VEGF and other related genes (35,36).
Therefore, total mRNA was subjected to SqRT-PCR to analyze changes
in VEGF expression in U251 cells (Fig.
7E). MDM2, β-arrestin1, β-arrestin2, MMP-2, MMP-9 and
VEGF expression was analyzed by qPCR (Fig. 7F). According to SqRT-PCR and qPCR,
MDM2 overexpression rescued the decreased expression of
β-arrestin1, β-arrestin2, MMP-2, MMP-9 and VEGF,
which are downstream genes of silibinin. Subsequently, the changes
in VEGF expression were also verified by SqRT-PCR in A549
and MCF7 cell models (Fig. 7G and H).
Therefore, MDM2 induced EMT by upregulating EMT transcription
factors via activation of the B-Raf signaling pathway through
14-3-3, and this depended on p53. Subsequently, the EMT induced by
MDM2 could promote cell insensitivity to drug treatment (Fig. 8).
 | Figure 7.MDM2 overexpression prevents
sensitivity to growth inhibition by silibinin in U251, A549 and
MCF7 cells. (A) After cells were treated with the indicated doses
of silibinin (0, 10, 20, 40, 60, 80, 100 or 200 µM), cell
viabilities were determined using an MTT assay after 24 h in
control U251 cells and MDM2-overexpressing U251 cells. Ctrl
referred to the U251 cell line with stable overexpression of
plenti-CMV-puro empty vector. (B) After cells were treated with the
indicated doses of silibinin (0, 10, 20, 40, 60, 80, 100 and 200
µM), cell proliferation were determined using an MTT assay after 48
h in control U251 cells and MDM2-overexpressing U251 cells. Ctrl
referred to the U251 cell line with stable overexpression of
plenti-CMV-puro empty vector. (C) After cells were treated with the
indicated doses of silibinin (0, 10, 20, 40, 60, 80, 100 and 200
µM), cell proliferation were determined using an MTT assay after 48
h in control A549 cells and MDM2-overexpressing A549 cells. Ctrl
referred to the A549 cell line with stable overexpression of
plenti-CMV-puro empty vector. (D) After cells were treated with the
indicated doses of silibinin (0, 10, 20, 40, 60, 80, 100 and 200
µM), cell proliferation were determined using an MTT assay after 48
h in control MCF7 cells and MDM2-overexpressing MCF7 cells. Ctrl
referred to the MCF7 cell line with stable overexpression of
plenti-CMV-puro empty vector. (E) Control U251 cells and
MDM2-overexpressing U251 cells were treated with the indicated
doses of silibinin (80 and 100 µM) for 48 h, and total mRNA was
subjected to SqRT-PCR to analyze VEGF expression. Ctrl
referred to the U251 cell line with stable overexpression of
plenti-CMV-puro empty vector. GAPDH served as a
normalization control. (F) Total mRNA from control U251 cells and
MDM2-overexpressing U251 cells was subjected to quantitative PCR to
analyze the changes in MDM2, β-arrestin1, β-arrestin2, MMP-2,
MMP-9 and VEGF expression. Ctrl referred to the U251
cell line with stable overexpression of plenti-CMV-puro empty
vector. GAPDH was used as a control. Quantitative analysis
data are shown. (G) Control A549 cells and MDM2-overexpressing A549
cells were treated with the indicated doses of silibinin (80 and
100 µM) for 48 h, and then total mRNA was subjected to SqRT-PCR to
analyze VEGF expression. Ctrl referred to the U251 cell line
with stable overexpression of plenti-CMV-puro empty vector.
GAPDH served as a control. (H) Control MCF7 cells and
MDM2-overexpressing MCF7 cells were treated with the indicated
doses of silibinin (80 and 100 µM) for 48 h, and then total mRNA
was subjected to SqRT-PCR to analyze changes in VEGF
expression. Ctrl referred to the U251 cell line with stable
overexpression of plenti-CMV-puro empty vector. GAPDH served
as a normalization control. For all quantifications, data are
presented as the mean ± SD derived from three independent
experiments. Statistical significance was analyzed using an
unpaired Student's t-test in (F), and one-way ANOVA with Tukey's
post hoc test was used to compare the indicated group and the 0 µM
group within the Ctrl type, or the indicated group and the 0 µM
group within the MDM2-GFP type, or two indicated groups in A-D.
*P<0.05; **P<0.01; ***P<0.001 vs. 0 µM group or as
indicated. β-arrestin1, subtype 1 of β-arrestin protein family;
β-arrestin2, subtype 2 of β-arrestin protein family; Ctrl, control;
GFP, green fluorescent protein; MDM2, MDM2 proto-oncogene, E3
ubiquitin protein ligase; SqRT-PCR, semi-quantitative reverse
transcription PCR. |
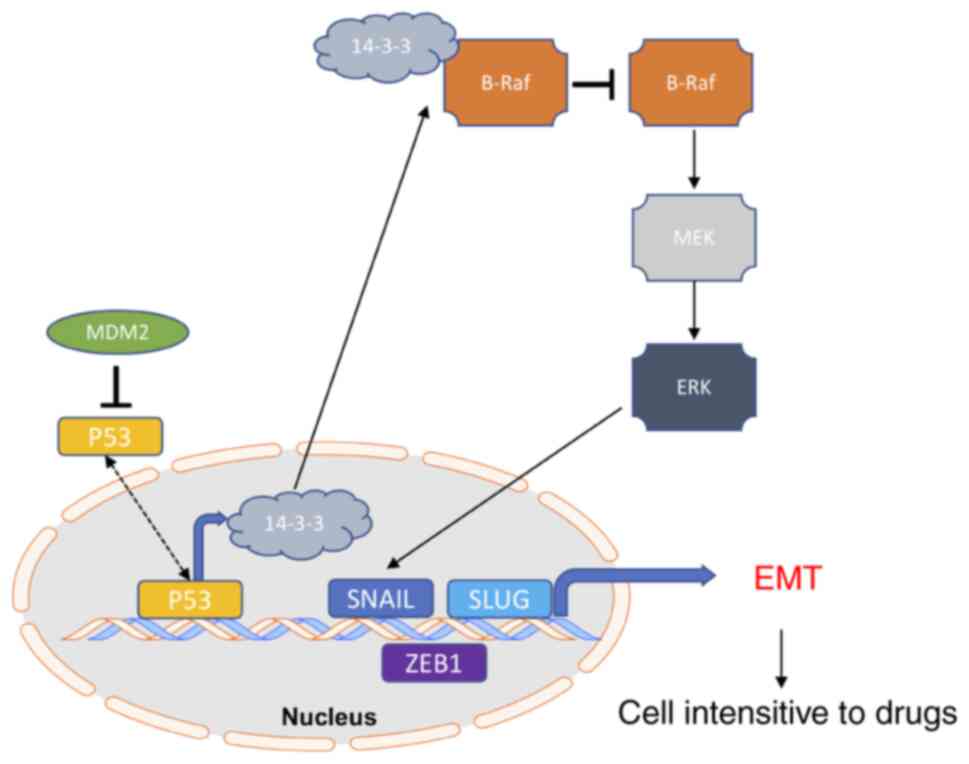 | Figure 8.Model of MDM2-mediated B-Raf
signaling pathway activation through 14-3-3 inducing p53-dependent
EMT progression and altering cell sensitivities to cancer drugs.
MDM2 may regulate the transcriptional activity of the EMT
transcription factors Snail, Slug and ZEB1 through B-Raf and
p53-dependent mechanisms, resulting in decreased net production of
14-3-3, which can activate B-Raf. Activation of B-Raf induces the
B-Raf signaling pathway. Subsequently, ERK1/2 activates the EMT
transcription factors Snail, Slug and ZEB1, which promotes EMT
progression. EMT progression induces cells to have different
sensitivities to drugs in cell lines and tumors. 14-3-3, tyrosine
3-monooxygenase activation protein ε; EMT,
epithelial-to-mesenchymal transition; MDM2, MDM2 proto-oncogene, E3
ubiquitin protein ligase; Slug, Snail family transcriptional
repressor 2; Snail, Snail family transcriptional repressor 1; ZEB1,
zinc finger E-box binding homeobox 1. |
Discussion
The present study utilized SqRT-PCR, qPCR, GSEA,
scratch wound assays and western blotting, and revealed that MDM2
overexpression increased migration and induced EMT in three cell
models. EMT serves a crucial role in tumor development (6). The present data regarding MDM2 provide a
novel direction for tumor research. MDM2 is involved in the
invasion and metastasis of tumor cells (62,63). MDM2
overexpression can increase the expression of EMT transcranial
factors, such as Snail, Slug and ZEB1; however, these factors are
not only associated with EMT (62–64). MDM2
can take part in other physiological mechanisms by regulating
Snail, Slug and ZEB1 (64,65). Previous studies have reported that
Raf/MEK/ERK signaling serves a role in the EMT process (39,66). The
present study explored the mechanism of Raf/MEK/ERK signaling
involved in and affecting EMT. Using scratch wound assays, colony
formation assays, western blotting and in vivo experiments,
it was demonstrated that B-Raf-MEK-ERK signaling serves as a
downstream effector of MDM2.
The present study also demonstrated that the
B-Raf-MEK-ERK signaling pathway was activated, while the mTOR
signaling pathway and ERK downstream RSK pathway were not involved
in the EMT process induced by MDM2. The Raf/MEK/ERK signaling
pathway is associated with other important physiological
mechanisms, such as autophagy and lysosome biogenesis (67,68).
However, to the best of our knowledge, whether MDM2 may also take
part in autophagy and lysosome biogenesis through the Raf/MEK/ERK
signaling pathway is unclear. According to the present in
vitro and in vivo experiments, MDM2 activated the B-Raf
signaling pathway, and induced EMT and tumor progression through
14-3-3. The present data highlighted an important research
direction for future cancer research.
The most important finding of the present study was
that it revealed the relationship between MDM2 and 14-3-3. 14-3-3
is involved in regulating multiple cellular processes. There is
growing evidence that 14-3-3 serves an important role in human
cancer and neurological diseases (17–23).
Therefore, it was hypothesized that MDM2 may also participate in
these important processes through 14-3-3 regulation. Importantly,
14-3-3 is an important regulator of the autophagy transcription
factor TFEB (69–71). The preliminary experimental data has
indicated that MDM2 decreased TFEB expression in the U251 cell line
(data not shown). Whether MDM2 participates in autophagy management
through 14-3-3 regulation of TFEB remains unclear.
A significant amount of evidence has indicated that
the actions of MDM2 and p53 are closely related. MDM2 inhibits p53
by ubiquitinating and degrading p53 (2,3). p53 is a
widely studied factor associated with apoptosis and other related
mechanisms (72,73). Therefore, MDM2 may be used in clinical
therapy of the numerous diseases in which p53 is involved. EMT has
been reported to contribute to cancer cells becoming resistant to
chemotherapy agents (74,75). The present study indicated that MDM2
promoted cell insensitivity to silibinin treatment by inducing EMT
in three cell models. However, the mechanism of EMT-induced drug
sensitivity is still unclear (76).
The present study also demonstrated possible directions for future
research investigating the association between MDM2 and drug
resistance in clinical settings.
Although the present study revealed a novel
mechanism of the MDM2-induced EMT process and indicated that MDM2
promote cell insensitivity to silibinin treatment, whether MDM2
influences other biological mechanisms through the BRAF signaling
pathway or not is unclear. The preliminary experimental data has
indicated that MDM2 decreased TFEB expression (data not shown). It
is unknown whether MDM2 can interfere with autophagy and lysosomal
signals through TFEB, which is an important autophagy-lysosomal
transcription factor. The current hypothesis that autophagy
inhibition may promote tumor inhibition and chemosensitivity is
largely based on studies of anti-tumor effects of the
lysosomotropic agent or its derivatives in combination cancer
chemotherapy (39,66). In addition, previous studies have
uncovered a unappreciated role for TFEB-mediated
autophagy-lysosomal activation in suppressing TGF-β signaling, and
revealed that TFEB blockade enhances TGF-β secretion and signaling
(67,68). These studies have demonstrated an
association between B-Raf, TFEB, TGF-β-EMT, autophagy and tumor
resistance. However, the relationship between MDM2,
autophagy-lysosome, TFEB and tumor chemosensitivity is unknown.
Therefore, it is important to understand the association between
MDM2 and autophagy and chemosensitivity in future studies. At
least, the present study provided theoretical support to explore
these mechanisms.
In conclusion, MDM2 induced EMT by upregulating EMT
transcription factors via activation of the B-Raf signaling pathway
through 14-3-3, and this depended on p53 (Fig. 8). This finding will become a crucial
paradigm for research in cancer therapy and can provide novel
research directions for future biological and clinical
research.
Supplementary Material
Supporting Data
Acknowledgements
The authors acknowledge the financial support from
China Scholarship Council (CSC) of MO for her PhD study at
University of Southern California (USC) (grant no.
201606050090).
Funding
The present study was supported by grants from the
Natural Science Foundation of China (grant nos. 31670952 and
81902796) and the Science and Technology Strategic Cooperation
Programs of Luzhou Municipal People's Government and Southwest
Medical University (grant no. 2018LZXNYD-ZK05).
Availability of data and materials
The RNA-Seq datasets generated and/or analyzed
during the current study are available in the Gene Expression
Omnibus repository (https://www.ncbi.nlm.nih.gov/geo/query/acc.cgi?acc=GSE165030).
The GSEA and other datasets used and/or analyzed during the current
study are available from the corresponding author on reasonable
request.
Authors' contributions
LT and JF conceptualized and designed the research.
MO, XX, YC, YL and LL performed the experiments. YL and JF
contributed reagents and collected clinical samples. CQ, LZ and WS
analyzed the data. MO and CQ wrote and revised the manuscript. LT,
JF and MO confirm the authenticity of all the raw data. All authors
read and approved the final manuscript and agree to be accountable
for all aspects of the research in ensuring that the accuracy or
integrity of any part of the work are appropriately investigated
and resolved.
Ethics approval and consent to
participate
All experiments were performed in accordance with
the guidelines and complied with ethical standards. All clinical
tumor samples were obtained according to clinical guidelines and in
compliance with ethical standards (approval no. Y2019045; Southwest
Medical University Ethics Committee, Luzhou, China). The informed
consent document was signed by each patient to agree to the use of
their samples in scientific research. All animal studies were
performed in accordance with the guidelines. The research was
reviewed and approved by ethical committee before conduction
(approval no. 201903-34; Southwest Medical University Ethics
Committee, Luzhou, China).
Patient consent for publication
Not applicable.
Competing interests
The authors declare that they have no competing
interests.
Glossary
Abbreviations
Abbreviations:
|
MDM2
|
MDM2 proto-oncogene, E3 ubiquitin
protein ligase
|
|
EMT
|
epithelial-to-mesenchymal
transition
|
|
14-3-3
|
tyrosine 3-monooxygenase activation
protein ε
|
|
B-RAF
|
B-Raf proto-oncogene,
serine/threonine kinase
|
|
RSK
|
90 KDa ribosomal protein S6
kinase
|
|
β-arrestin1
|
subtype 1 of β-arrestin protein
family
|
|
β-arrestin2
|
subtype 2 of β-arrestin protein
family
|
|
Snail
|
Snail family transcriptional
repressor 1
|
|
Slug
|
Snail family transcriptional
repressor 2
|
|
ZEB1
|
zinc finger E-box binding homeobox
1
|
|
E-CAD
|
E-cadherin
|
|
N-CAD
|
N-cadherin
|
|
VIM
|
vimentin
|
|
GSEA
|
Gene Set Enrichment Analysis
|
|
SqRT-PCR
|
semi-quantitative reverse
transcription PCR
|
|
qPCR
|
quantitative PCR
|
|
p70S6K
|
ribosomal protein S6 kinase
|
|
4EBP1
|
eukaryotic translation initiation
factor 4E binding protein 1
|
References
|
1
|
Fakharzadeh SS, Trusko SP and George DL:
Tumorigenic potential associated with enhanced expression of a gene
that is amplified in a mouse tumor cell line. EMBO J. 10:1565–1569.
1991. View Article : Google Scholar : PubMed/NCBI
|
|
2
|
Xia YZ, Yang L, Xue GM, Zhang C, Guo C,
Yang YW, Li SS, Zhang LY, Guo QL and Kong LY: Combining GRP78
suppression and MK2206-induced Akt inhibition decreases
doxorubicin-induced P-glycoprotein expression and mitigates
chemoresistance in human osteosarcoma. Oncotarget. 7:56371–56382.
2016. View Article : Google Scholar : PubMed/NCBI
|
|
3
|
Haupt Y, Maya R, Kazaz A and Oren M: Mdm2
promotes the rapid degradation of p53. Nature. 387:296–299. 1997.
View Article : Google Scholar : PubMed/NCBI
|
|
4
|
Momand J, Zambetti GP, Olson DC, George D
and Levine AJ: The mdm-2 oncogene product forms a complex with the
p53 protein and inhibits p53-mediated transactivation. Cell.
69:1237–1245. 1992. View Article : Google Scholar : PubMed/NCBI
|
|
5
|
Jung CR, Lim JH, Choi Y, Kim DG, Kang KJ,
Noh SM and Im DS: Enigma negatively regulates p53 through MDM2 and
promotes tumor cell survival in mice. J Clin Invest. 120:4493–4506.
2010. View Article : Google Scholar : PubMed/NCBI
|
|
6
|
Thiery JP: Epithelial-mesenchymal
transitions in cancer onset and progression. Bull Acad Natl Med.
193:1969–1979. 2009.(In French). PubMed/NCBI
|
|
7
|
Iwakuma T and Agarwal N: MDM2 binding
protein, a novel metastasis suppressor. Cancer Metastasis Rev.
31:633–640. 2012. View Article : Google Scholar : PubMed/NCBI
|
|
8
|
Wang SP, Wang WL, Chang YL, Wu CT, Chao
YC, Kao SH, Yuan A, Lin CW, Yang SC, Chan WK, et al: p53 controls
cancer cell invasion by inducing the MDM2-mediated degradation of
Slug. Nat Cell Biol. 11:694–704. 2009. View Article : Google Scholar : PubMed/NCBI
|
|
9
|
Osborne JK, Zaganjor E and Cobb MH: Signal
control through Raf: In sickness and in health. Cell Res. 22:14–22.
2012. View Article : Google Scholar : PubMed/NCBI
|
|
10
|
Stephen AG, Esposito D, Bagni RK and
McCormick F: Dragging ras back in the ring. Cancer Cell.
25:272–281. 2014. View Article : Google Scholar : PubMed/NCBI
|
|
11
|
Min L, He B and Hui L: Mitogen-activated
protein kinases in hepatocellular carcinoma development. Semin
Cancer Biol. 21:10–20. 2011. View Article : Google Scholar : PubMed/NCBI
|
|
12
|
Tzivion G, Gupta VS, Kaplun L and Balan V:
14-3-3 proteins as potential oncogenes. Semin Cancer Biol.
16:203–213. 2006. View Article : Google Scholar : PubMed/NCBI
|
|
13
|
Zhang J and Zhou Y: 14-3-3 Proteins in
glutamatergic synapses. Neural Plast. 2018:84076092018. View Article : Google Scholar : PubMed/NCBI
|
|
14
|
Vergroesen PP, Kingma I, Emanuel KS,
Hoogendoorn RJ, Welting TJ, van Royen BJ, van Dieën JH and Smit TH:
Mechanics and biology in intervertebral disc degeneration: A
vicious circle. Osteoarthritis Cartilage. 23:1057–1070. 2015.
View Article : Google Scholar : PubMed/NCBI
|
|
15
|
Stevers LM, Sijbesma E, Botta M,
MacKintosh C, Obsil T, Landrieu I, Cau Y, Wilson AJ, Karawajczyk A,
Eickhoff J, et al: Modulators of 14-3-3 protein-protein
interactions. J Med Chem. 61:3755–3778. 2018. View Article : Google Scholar : PubMed/NCBI
|
|
16
|
Park E, Rawson S, Li K, Kim BW, Ficarro
SB, Pino GG, Sharif H, Marto JA, Jeon H and Eck MJ: Architecture of
autoinhibited and active BRAF-MEK1-14-3-3 complexes. Nature.
575:545–550. 2019. View Article : Google Scholar : PubMed/NCBI
|
|
17
|
Aitken A: 14-3-3 proteins: A historic
overview. Semin Cancer Biol. 16:162–172. 2006. View Article : Google Scholar : PubMed/NCBI
|
|
18
|
Li X, Wang QJ, Pan N, Lee S, Zhao Y, Chait
BT and Yue Z: Phosphorylation-dependent 14-3-3 binding to LRRK2 is
impaired by common mutations of familial Parkinson's disease. PLoS
One. 6:e171532011. View Article : Google Scholar : PubMed/NCBI
|
|
19
|
Nichols RJ, Dzamko N, Morrice NA, Campbell
DG, Deak M, Ordureau A, Macartney T, Tong Y, Shen J, Prescott AR
and Alessi DR: 14-3-3 binding to LRRK2 is disrupted by multiple
Parkinson's disease-associated mutations and regulates cytoplasmic
localization. Biochem J. 430:393–404. 2010. View Article : Google Scholar : PubMed/NCBI
|
|
20
|
Kilani RT, Maksymowych WP, Aitken A, Boire
G, St-Pierre Y, Li Y and Ghahary A: Detection of high levels of 2
specific isoforms of 14-3-3 proteins in synovial fluid from
patients with joint inflammation. J Rheumatol. 34:1650–1657.
2007.PubMed/NCBI
|
|
21
|
Neal CL and Yu D: 14-3-3ζ as a prognostic
marker and therapeutic target for cancer. Expert Opin Ther Targets.
14:1343–1354. 2010. View Article : Google Scholar : PubMed/NCBI
|
|
22
|
Lamba S, Ravichandran V and Major EO:
Glial cell type-specific subcellular localization of 14-3-3 zeta:
An implication for JCV tropism. Glia. 57:971–977. 2009. View Article : Google Scholar : PubMed/NCBI
|
|
23
|
Kelly MN, Johnston DA, Peel BA, Morgan TW,
Palmer GE and Sturtevant JE: Bmh1p (14-3-3) mediates pathways
associated with virulence in Candida albicans. Microbiology
(Reading). 155:1536–1546. 2009. View Article : Google Scholar : PubMed/NCBI
|
|
24
|
Halbach T, Scheer N and Werr W:
Transcriptional activation by the PHD finger is inhibited through
an adjacent leucine zipper that binds 14-3-3 proteins. Nucleic
Acids Res. 28:3542–3550. 2000. View Article : Google Scholar : PubMed/NCBI
|
|
25
|
Ritt DA, Monson DM, Specht SI and Morrison
DK: Impact of feedback phosphorylation and Raf heterodimerization
on normal and mutant B-Raf signaling. Mol Cell Biol. 30:806–819.
2010. View Article : Google Scholar : PubMed/NCBI
|
|
26
|
Tzivion G and Avruch J: 14-3-3 proteins:
Active cofactors in cellular regulation by serine/threonine
phosphorylation. J Biol Chem. 277:3061–3064. 2002. View Article : Google Scholar : PubMed/NCBI
|
|
27
|
Tzivion G, Luo Z and Avruch J: A dimeric
14-3-3 protein is an essential cofactor for Raf kinase activity.
Nature. 394:88–92. 1998. View
Article : Google Scholar : PubMed/NCBI
|
|
28
|
Liau NPD, Wendorff TJ, Quinn JG, Steffek
M, Phung W, Liu P, Tang J, Irudayanathan FJ, Izadi S, Shaw AS, et
al: Negative regulation of RAF kinase activity by ATP is overcome
by 14-3-3-induced dimerization. Nat Struct Mol Biol. 27:134–141.
2020. View Article : Google Scholar : PubMed/NCBI
|
|
29
|
Kondo Y, Ognjenović J, Banerjee S,
Karandur D, Merk A, Kulhanek K, Wong K, Roose JP, Subramaniam S and
Kuriyan J: Cryo-EM structure of a dimeric B-Raf:14-3-3 complex
reveals asymmetry in the active sites of B-Raf kinases. Science.
366:109–115. 2019. View Article : Google Scholar : PubMed/NCBI
|
|
30
|
Ahmed N, Abubaker K, Findlay J and Quinn
M: Epithelial mesenchymal transition and cancer stem cell-like
phenotypes facilitate chemoresistance in recurrent ovarian cancer.
Curr Cancer Drug Targets. 10:268–278. 2010. View Article : Google Scholar : PubMed/NCBI
|
|
31
|
Wang TH, Wang HS and Soong YK:
Paclitaxel-induced cell death: Where the cell cycle and apoptosis
come together. Cancer. 88:2619–2628. 2000. View Article : Google Scholar : PubMed/NCBI
|
|
32
|
Yang Q, Huang J, Wu Q, Cai Y, Zhu L, Lu X,
Chen S, Chen C and Wang Z: Acquisition of epithelial-mesenchymal
transition is associated with Skp2 expression in
paclitaxel-resistant breast cancer cells. Br J Cancer.
110:1958–1967. 2014. View Article : Google Scholar : PubMed/NCBI
|
|
33
|
Zhang P, Liu H, Xia F, Zhang QW, Zhang YY,
Zhao Q, Chao ZH, Jiang ZW and Jiang CC: Epithelial-mesenchymal
transition is necessary for acquired resistance to cisplatin and
increases the metastatic potential of nasopharyngeal carcinoma
cells. Int J Mol Med. 33:151–159. 2014. View Article : Google Scholar : PubMed/NCBI
|
|
34
|
Gu MF, Liu LZ, He LJ, Yuan WX, Zhang R,
Luo GY, Xu GL, Zhang HM, Yan CX and Li JJ: Sequential
chemoradiotherapy with gemcitabine and cisplatin for locoregionally
advanced nasopharyngeal carcinoma. Int J Cancer. 132:215–223. 2013.
View Article : Google Scholar : PubMed/NCBI
|
|
35
|
Li QQ, Xu JD, Wang WJ, Cao XX, Chen Q,
Tang F, Chen ZQ, Liu XP and Xu ZD: Twist1-mediated
adriamycin-induced epithelial-mesenchymal transition relates to
multidrug resistance and invasive potential in breast cancer cells.
Clin Cancer Res. 15:2657–2665. 2009. View Article : Google Scholar : PubMed/NCBI
|
|
36
|
McConkey DJ, Choi W, Marquis L, Martin F,
Williams MB, Shah J, Svatek R, Das A, Adam L, Kamat A, et al: Role
of epithelial-to-mesenchymal transition (EMT) in drug sensitivity
and metastasis in bladder cancer. Cancer Metastasis Rev.
28:335–344. 2009. View Article : Google Scholar : PubMed/NCBI
|
|
37
|
Li L, Feng J, Chen Y, Li S, Ou M, Sun W
and Tang L: Estradiol shows anti-skin cancer activities through
decreasing MDM2 expression. Oncotarget. 8:8459–8474. 2017.
View Article : Google Scholar : PubMed/NCBI
|
|
38
|
Li S, Ma L, Ou M, Feng J, Liao Y, Wang G
and Tang L: A novel inducible lentiviral system for multi-gene
expression with human HSP70 promoter and tetracycline-induced
promoter. Appl Microbiol Biotechnol. 101:3689–3702. 2017.
View Article : Google Scholar : PubMed/NCBI
|
|
39
|
Li S, Song Y, Quach C, Guo H, Jang GB,
Maazi H, Zhao S, Sands NA, Liu Q, In GK, et al: Transcriptional
regulation of autophagy-lysosomal function in BRAF-driven melanoma
progression and chemoresistance. Nat Commun. 10:16932019.
View Article : Google Scholar : PubMed/NCBI
|
|
40
|
Livak KJ and Schmittgen TD: Analysis of
relative gene expression data using real-time quantitative PCR and
the 2(-Delta Delta C(T)) method. Methods. 25:402–408. 2001.
View Article : Google Scholar : PubMed/NCBI
|
|
41
|
Weselling P and Capper D: WHO 2016
classification of gilomas. Neuropathol Appl Neurobiol. 44:139–150.
2018. View Article : Google Scholar : PubMed/NCBI
|
|
42
|
Lu X, Yan C, Huang Y, Shi D, Fu Z, Qiu J
and Yin Y: Mouse double minute 2 (MDM2) upregulates Snail
expression and induces epithelial-to-mesenchymal transition in
breast cancer cells in vitro and in vivo. Oncotarget.
7:37177–37191. 2016. View Article : Google Scholar : PubMed/NCBI
|
|
43
|
Galvan JA, Zlobec I, Wartenberg M, Lugli
A, Gloor B, Perren A and Karamitopoulou E: Expression of E-cadherin
repressors SNAIL, ZEB1 and ZEB2 by tumour and stromal cells
influences tumour-budding phenotype and suggests heterogeneity of
stromal cells in pancreatic cancer. Br J Cancer. 112:1944–1950.
2015. View Article : Google Scholar : PubMed/NCBI
|
|
44
|
Schulte J, Weidig M, Balzer P, Richter P,
Franz M, Junker K, Gajda M, Friedrich K, Wunderlich H, Östman A, et
al: Expression of the E-cadherin repressors Snail, Slug and Zeb1 in
urothelial carcinoma of the urinary bladder: Relation to stromal
fibroblast activation and invasive behaviour of carcinoma cells.
Histochem Cell Biol. 138:847–860. 2012. View Article : Google Scholar : PubMed/NCBI
|
|
45
|
Weichhart T: mTOR as regulator of
lifespan, aging, and cellular senescence: A Mini-review.
Gerontology. 64:127–134. 2018. View Article : Google Scholar : PubMed/NCBI
|
|
46
|
Bertacchini J, Heidari N, Mediani L,
Capitani S, Shahjahani M, Ahmadzadeh A and Saki N: Targeting
PI3K/AKT/mTOR network for treatment of leukemia. Cell Mol Life Sci.
72:2337–2347. 2015. View Article : Google Scholar : PubMed/NCBI
|
|
47
|
Hermida MA, Dinesh Kumar J and Leslie NR:
GSK3 and its interactions with the PI3K/AKT/mTOR signalling
network. Adv Biol Regul. 65:5–15. 2017. View Article : Google Scholar : PubMed/NCBI
|
|
48
|
Bollag G, Hirth P, Tsai J, Zhang J,
Ibrahim PN, Cho H, Spevak W, Zhang C, Zhang Y, Habets G, et al:
Clinical efficacy of a RAF inhibitor needs broad target blockade in
BRAF-mutant melanoma. Nature. 467:596–599. 2010. View Article : Google Scholar : PubMed/NCBI
|
|
49
|
Garber K: Cancer research. Melanoma drug
vindicates targeted approach. Science. 326:16192009. View Article : Google Scholar : PubMed/NCBI
|
|
50
|
DeSilva DR, Jones EA, Favata MF, Jaffee
BD, Magolda RL, Trzaskos JM and Scherle PA: Inhibition of
mitogen-activated protein kinase kinase blocks T cell proliferation
but does not induce or prevent anergy. J Immunol. 160:4175–4181.
1998.PubMed/NCBI
|
|
51
|
Favata MF, Horiuchi KY, Manos EJ, Daulerio
AJ, Stradley DA, Feeser WS, Van Dyk DE, Pitts WJ, Earl RA, Hobbs F,
et al: Identification of a novel inhibitor of mitogen-activated
protein kinase kinase. J Biol Chem. 273:18623–18632. 1998.
View Article : Google Scholar : PubMed/NCBI
|
|
52
|
Ohori M, Takeuchi M, Maruki R, Nakajima H
and Miyake H: FR180204, a novel and selective inhibitor of
extracellular signal-regulated kinase, ameliorates collagen-induced
arthritis in mice. Naunyn Schmiedebergs Arch Pharmacol.
374:311–316. 2007. View Article : Google Scholar : PubMed/NCBI
|
|
53
|
Alexaki VI, Javelaud D, Van Kempen LC,
Mohammad KS, Dennler S, Luciani F, Hoek KS, Juàrez P, Goydos JS,
Fournier PJ, et al: GLI2-mediated melanoma invasion and metastasis.
J Natl Cancer Inst. 102:1148–1159. 2010. View Article : Google Scholar : PubMed/NCBI
|
|
54
|
Smith JA, Maloney DJ, Hecht SM and
Lannigan DA: Structural basis for the activity of the RSK-specific
inhibitor, SL0101. Bioorg Med Chem. 15:5018–5034. 2007. View Article : Google Scholar : PubMed/NCBI
|
|
55
|
Smith JA, Maloney DJ, Clark DE, Xu Y,
Hecht SM and Lannigan DA: Influence of rhamnose substituents on the
potency of SL0101, an inhibitor of the Ser/Thr kinase, RSK. Bioorg
Med Chem. 14:6034–6042. 2006. View Article : Google Scholar : PubMed/NCBI
|
|
56
|
Hu W, Feng Z and Levine AJ: The regulation
of multiple p53 stress responses is mediated through MDM2. Genes
Cancer. 3:199–208. 2012. View Article : Google Scholar : PubMed/NCBI
|
|
57
|
Chen DY, Dai DF, Hua Y and Qi WQ: p53
suppresses 14-3-3γ by stimulating proteasome-mediated 14-3-3γ
protein degradation. Int J Oncol. 46:818–824. 2015. View Article : Google Scholar : PubMed/NCBI
|
|
58
|
Radhakrishnan VM, Putnam CW, Qi W and
Martinez JD: P53 suppresses expression of the 14-3-3γ oncogene. BMC
Cancer. 11:3782011. View Article : Google Scholar : PubMed/NCBI
|
|
59
|
Zhang Y, Dube C, Gibert M Jr, Cruickshanks
N, Wang B, Coughlan M, Yang Y, Setiady I, Deveau C, Saoud K, et al:
The p53 pathway in glioblastoma. Cancers. 10:2972018. View Article : Google Scholar : PubMed/NCBI
|
|
60
|
Singh RP and Agarwal R: Cosmeceuticals and
silibinin. Clin Dermatol. 27:479–484. 2009. View Article : Google Scholar : PubMed/NCBI
|
|
61
|
Cheung CW, Gibbons N, Johnson DW and Nicol
DL: Silibinin-a promising new treatment for cancer. Anticancer
Agents Med Chem. 10:186–195. 2010. View Article : Google Scholar : PubMed/NCBI
|
|
62
|
Hauck PM, Wolf ER, Olivos DJ III, Batuello
CN, McElyea KC, McAtarsney CP, Cournoyer RM, Sandusky GE and Mayo
LD: Early-stage metastasis requires Mdm2 and Not p53 gain of
function. Mol Cancer Res. 15:1598–1607. 2017. View Article : Google Scholar : PubMed/NCBI
|
|
63
|
Chen Y, Wang DD, Wu YP, Su D, Zhou TY, Gai
RH, Fu YY, Zheng L, He QJ, Zhu H and Yang B: MDM2 promotes
epithelial-mesenchymal transition and metastasis of ovarian cancer
SKOV3 cells. Br J Cancer. 117:1192–1201. 2017. View Article : Google Scholar : PubMed/NCBI
|
|
64
|
Her NG, Oh JW, Oh YJ, Han S, Cho HJ, Lee
Y, Ryu GH and Nam DH: Potent effect of the MDM2 inhibitor AMG232 on
suppression of glioblastoma stem cells. Cell Death Dis. 9:7922018.
View Article : Google Scholar : PubMed/NCBI
|
|
65
|
Jung CH, Kim J, Park JK, Hwang SG, Moon
SK, Kim WJ and Um HD: Mdm2 increases cellular invasiveness by
binding to and stabilizing the Slug mRNA. Cancer Lett. 335:270–277.
2013. View Article : Google Scholar : PubMed/NCBI
|
|
66
|
Lionarons DA, Hancock DC, Rana S, East P,
Moore C, Murillo MM, Carvalho J, Spencer-Dene B, Herbert E, Stamp
G, et al: RAC1P29S induces a mesenchymal phenotypic
switch via serum response factor to promote melanoma development
and therapy resistance. Cancer Cell. 36:68–83.e9. 2019. View Article : Google Scholar : PubMed/NCBI
|
|
67
|
Li S, Song Y, Quach C, Nemecio D and Liang
C: Revisiting the role of autophagy in melanoma. Autophagy.
15:1843–1844. 2019. View Article : Google Scholar : PubMed/NCBI
|
|
68
|
Klionsky DJ, Abdelmohsen K, Abe A, Abedin
MJ, Abeliovich H, Acevedo Arozena A, Adachi H, Adams CM, Adams PD,
Adeli K, et al: Guidelines for the use and interpretation of assays
for monitoring autophagy (3rd edition). Autophagy. 12:1–222. 2016.
View Article : Google Scholar : PubMed/NCBI
|
|
69
|
Xu Y, Ren J, He X, Chen H, Wei T and Feng
W: YWHA/14-3-3 proteins recognize phosphorylated TFEB by a
noncanonical mode for controlling TFEB cytoplasmic localization.
Autophagy. 15:1017–1030. 2019. View Article : Google Scholar : PubMed/NCBI
|
|
70
|
Zhitomirsky B, Yunaev A, Kreiserman R,
Kaplan A, Stark M and Assaraf YG: Lysosomotropic drugs activate
TFEB via lysosomal membrane fluidization and consequent inhibition
of mTORC1 activity. Cell Death Dis. 9:11912018. View Article : Google Scholar : PubMed/NCBI
|
|
71
|
Nezich CL, Wang C, Fogel AI and Youle RJ:
MiT/TFE transcription factors are activated during mitophagy
downstream of Parkin and Atg5. J Cell Biol. 210:435–450. 2015.
View Article : Google Scholar : PubMed/NCBI
|
|
72
|
Hafner A, Bulyk ML, Jambhekar A and Lahav
G: The multiple mechanisms that regulate p53 activity and cell
fate. Nat Rev Mol Cell Biol. 20:199–210. 2019. View Article : Google Scholar : PubMed/NCBI
|
|
73
|
Robin M, Issa AR, Santos CC, Napoletano F,
Petitgas C, Chatelain G, Ruby M, Walter L, Birman S, Domingos PM,
et al: Drosophila p53 integrates the antagonism between autophagy
and apoptosis in response to stress. Autophagy. 15:771–784. 2019.
View Article : Google Scholar : PubMed/NCBI
|
|
74
|
Shibue T and Weinberg RA: EMT, CSCs, and
drug resistance: The mechanistic link and clinical implications.
Nat Rev Clin Oncol. 14:611–629. 2017. View Article : Google Scholar : PubMed/NCBI
|
|
75
|
Xu X, Zhang L, He X, Zhang P, Sun C, Xu X,
Lu Y and Li F: TGF-β plays a vital role in triple-negative breast
cancer (TNBC) drug-resistance through regulating stemness, EMT and
apoptosis. Biochem Biophys Res Commun. 502:160–165. 2018.
View Article : Google Scholar : PubMed/NCBI
|
|
76
|
Hata AN, Rowley S, Archibald HL,
Gomez-Caraballo M, Siddiqui FM, Ji F, Jung J, Light M, Lee JS,
Debussche L, et al: Synergistic activity and heterogeneous acquired
resistance of combined MDM2 and MEK inhibition in KRAS mutant
cancers. Oncogene. 36:6581–6591. 2017. View Article : Google Scholar : PubMed/NCBI
|


