Introduction
Non-small cell lung cancer (NSCLC), accounting for
~85% of all cases of lung cancer, remains to be the leading cause
of cancer-related mortality worldwide, despite the availability of
advanced cytotoxic chemotherapies and molecular-targeted therapies,
such as EGFR-tyrosine kinase inhibitors (1,2).
However, recently, agents that target the programmed death-1
(PD-1)/programmed death-ligand 1 (PD-L1) axis, such as
immune-checkpoint inhibitors, have been widely used as a standard
treatment for patients with metastatic NSCLC (3–5).
Pembrolizumab, an anti-PD-1 antibody, has been approved as
monotherapy in patients with tumors that have highly upregulated
expression of PD-L1 on tumor cells (TCs) (4). This finding made PD-L1 testing a
mandatory diagnostic test during treatment planning in patients
with NSCLC. Furthermore, effective clinical response to
atezolizumab, an anti-PD-L1 antibody, is observed not only in
patients with tumors with high PD-L1 expression on TCs, but also in
patients with tumors that expressed high levels of PD-L1 on
tumor-infiltrating immune cells (ICs) (6). These observations suggest that the
PD-L1 expression not only on TCs but also ICs serves an important
role in regulating the anti-tumor T cell response. In addition, the
PD-L1 expression on TCs and ICs is reported to be affected by
microenvironment stimuli, including tumor-infiltrating lymphocytes
(TILs) and M2 tumor-associated macrophages (TAMs) (7,8).
On the other hand, recent clinical studies report
that PD-L2, another PD-1 ligand, is also widely expressed in
numerous types of cancer, including NSCLC (9–14).
Several studies reveal that PD-L2 is also expressed by both TCs and
various ICs, depending on the microenvironment stimuli (15–17).
In addition, experimental studies report that PD-L2-expressing TCs
are resistant to treatment with anti-PD-L1 antibody alone and that
this resistance is overcome by an anti-PD-1 antibody or in
combination with an anti-PD-L2 antibody (18,19).
A clinical study reports that clinical response to pembrolizumab in
patients with head and neck squamous cell carcinoma may be related
partly to blockade of PD-1/PD-L2 interactions (20). However, the clinical significance
of the PD-L2 expression in NSCLC is still controversial (7,9–11).
Taken together, to improve the treatment strategy of
immune-checkpoint inhibitors for patients with NSCLC, a
comprehensive analysis of the biological mechanisms and clinical
significance of PD-L1 and PD-L2 expression was considered to be
clinically important. Therefore, a the present study was performed
to evaluate the expression of PD-L1 and PD-L2 on both TCs and ICs
in patients with NSCLC. In addition, the association between TILs
and M2 TAMs, which are key components of the tumor microenvironment
(TME), on the expression of PD-L1 and PD-L2 was also analyzed.
Materials and methods
Patients
Consecutive 175 patients with NSCLC, who underwent
surgery at the Department of Thoracic Surgery, Kitano Hospital
(Osaka, Japan) between November 2011 and December 2014, were
included. The present study was approved by the Ethics Committee
(approval no. P181200300) and written informed consent was provided
from each patient. Pathological staging was determined using the
8th Tumor Node Metastasis (TNM) classification system (21). The histological type and the grade
of differentiation of the tumors were determined according to the
classification system developed by the World Health Organization
(22). The medical records and
histopathological diagnosis from the patients were fully
documented.
Immunohistochemistry
Immunohistochemical studies were performed to
evaluate the TIL distribution by CD3 staining, the M2 TAM
distribution by CD163 staining (8,23),
PD-L1 expression on TCs and ICs by the Ventana SP263 assay and
PD-L2 expression on TCs and ICs, using the Ventana BenchMark GX
system (Ventana Medical Systems; Roche Diagnostics), according to
the recommended protocol. The following antibodies were used:
Rabbit monoclonal anti-human CD3 (clone 2GV6; prediluted; Ventana
Medical Systems; Roche Diagnostics), PD-L1 (clone SP263;
prediluted; Ventana Medical Systems; Roche Diagnostics) (24) and PD-L2 (cat. no. 18251-1-AP;
1:200; ProteinTech Group, Inc.) and mouse monoclonal anti-human
CD163 (clone 760-4437; prediluted; Ventana Medical Systems; Roche
Diagnostics). The tissues were fixed in 10% neutral-buffered
formalin for 24 h at room temperature. After dehydration in graded
ethanol series followed by xylene at room temperature, the tissues
were embedded in paraffin at 60°C. Formalin-fixed paraffin-embedded
tissue was cut into 4-µm sections and mounted on
poly-L-lysine-coated slides. The sections were deparaffinized and
rehydrated using EZ Prep (Ventana Medical Systems; Roche
Diagnostics) at 75°C. Antigen retrieval was performed using Cell
Conditioner 1 (Ventana Medical Systems; Roche Diagnostics) for 64
min at 100°C against CD3, PD-L1 and PD-L2 and 32 min at 100°C
against CD163. The sections were then incubated with the specific
primary antibody for 16 min at 37°C against CD3, CD163 and PD-L1
and 2 h at 37°C for PD-L2. Subsequently, the sections were treated
with the OptiView HQ Linker (Ventana Medical Systems; Roche
Diagnostics) for 8 min at 37°C and the OptiView HRP Multimer
(Ventana Medical Systems; Roche Diagnostics) for 8 min at 37°C.
Finally, counterstaining was performed with Mayer's hematoxylin and
Scott's tap water bluing reagent at 37°C.
The evaluation of the stained tissue sections was
performed by two investigators (RS and CLH) blinded to the study.
The cases with discrepancies were jointly re-evaluated until a
consensus was reached. For CD3 and CD163 staining, the five most
representative high-power fields (magnification, ×400; 0.0625
mm2) of the tumor stroma were selected. Tumor stroma was
defined as the area where tumor stromal cells accounted for >70%
of the total cells (25). The
number of CD3-positive cells and CD163-positive cells in each area
was counted and the average number of fields in each area was
calculated. Finally, the CD3-positive cell density in the tumor
stroma (TIL density) and the CD163-positive macrophage density in
the tumor stroma (M2 TAM density) were defined as the cell number
per mm2. PD-L1 and PD-L2 expression was calculated as
the percentage of membrane staining on TCs or ICs, respectively, in
the overall area of the tumor, regardless of intensity.
Statistical analysis
The statistical significances regarding continuous
variables were assessed using either a t-test, ANOVA with
Bonferroni/Dunn post hoc test or Pearson's correlation coefficient.
Categorical variables were compared using a χ2 test.
Statistical analyses were performed using SPSS v23.0 for Windows
(IBM Corp.). All P-values were based on the two-sided statistical
analysis and P<0.05 was considered to indicate a statistically
significant difference.
Results
Distribution and clinical significance
of TILs among resected NSCLCs
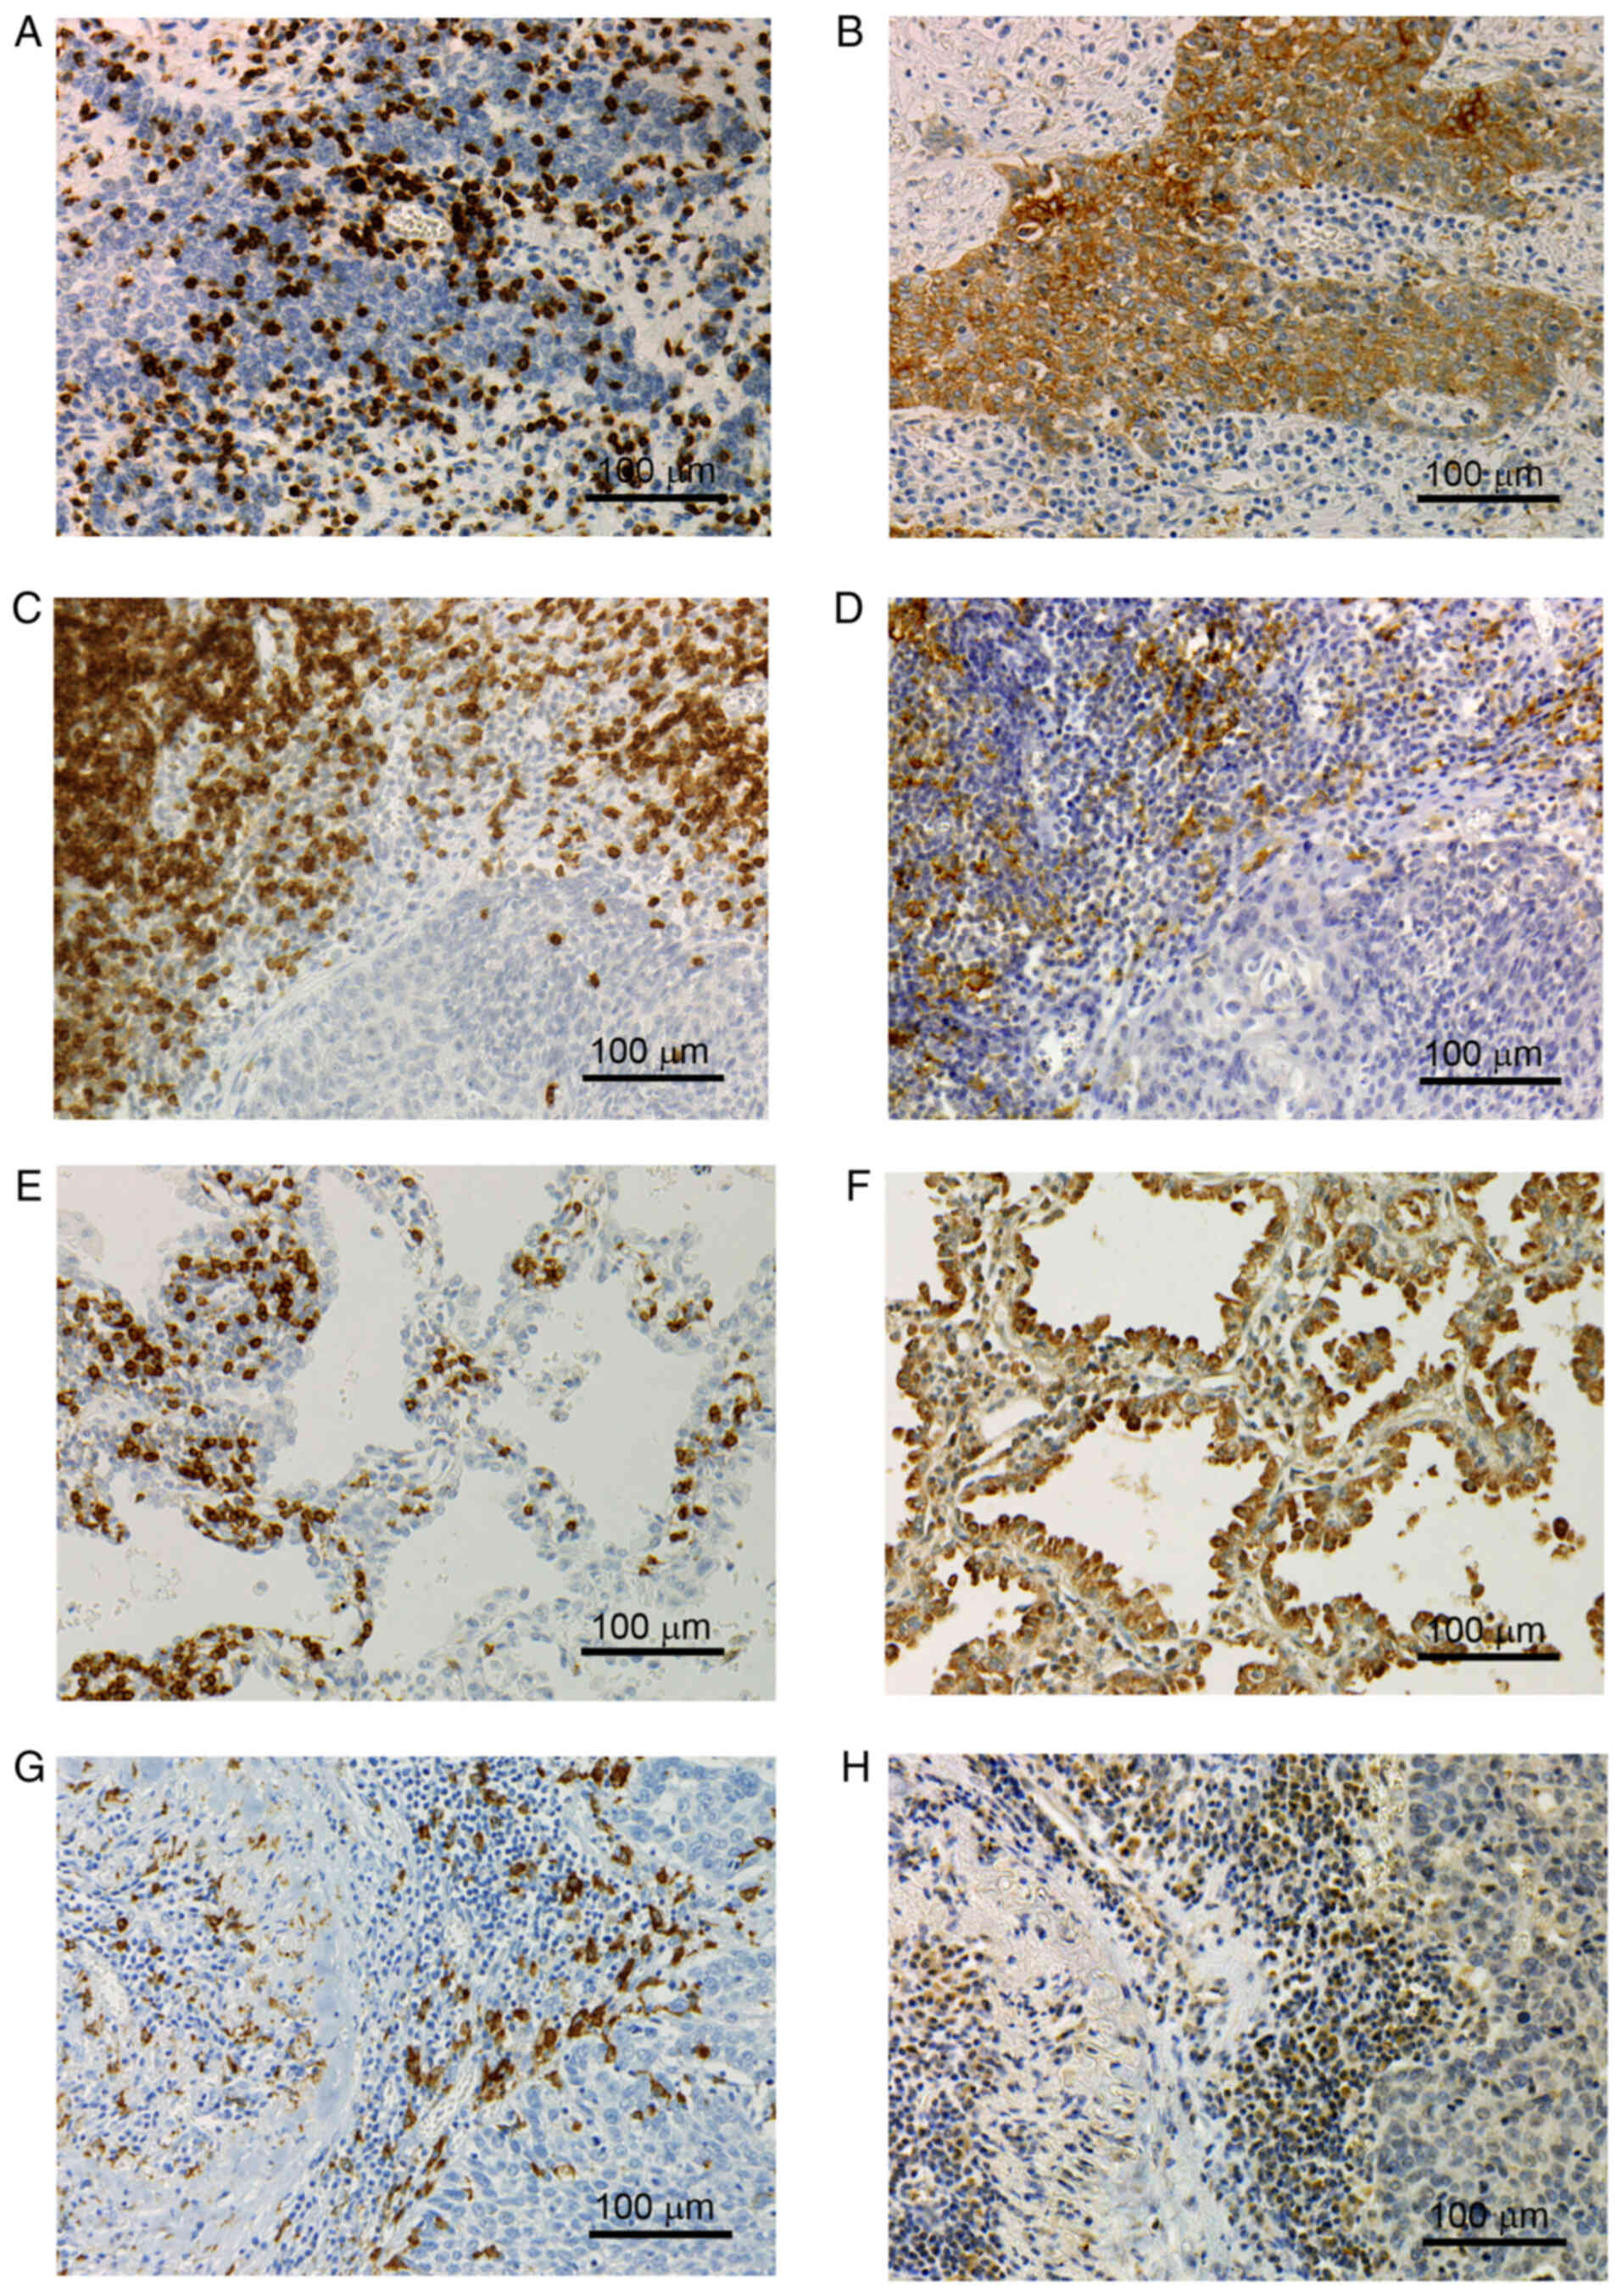
Immunohistochemistry for CD3 exhibited a membranous
and cytoplasmic staining pattern (Fig.
1A, C and E). The TIL density varied among the 175 tumor
tissues (mean ± standard deviation, 948.1±890.6; Table I). As the TIL density cut-off (524)
demonstrated the highest significance with respect to the
percentage of PD-L1-positive TCs and PD-L2-positive TCs, the sample
was classified as TIL-high when the TIL density was >524. A
total of 71 tumors (40.6%) were classified as TIL-low and 104
tumors (59.4%) were classified as TIL-high. With respect to tumor
histology, the TIL density was significantly higher in squamous
cell carcinoma compared with that in adenocarcinoma (P=0.0206). In
addition, with respect to tumor differentiation, the TIL density
was significantly higher in moderately and poorly differentiated
tumors compared with that in well-differentiated tumors
(P=0.0130).
 | Table I.Distributions of TIL and M2 TAM
density among NSCLC patients according to clinicopathological
characteristics. |
Table I.
Distributions of TIL and M2 TAM
density among NSCLC patients according to clinicopathological
characteristics.
|
|
| TIL |
|
| M2 TAM |
|
|
|---|
|
|
|
|
|
|
|
|
|
|---|
|
| n | low | high | Mean ± standard
deviation | P-value | low | high | Mean ± standard
deviation | P-value |
|---|
| Smoking |
|
|
|
|
|
|
|
|
|
|
Non-smoker | 90 | 37 | 53 | 981.2±931.3 | 0.6139a | 59 | 31 | 357.7±362.0 | 0.3782a |
|
Smoker | 85 | 34 | 51 | 913.0±849.6 |
| 49 | 36 | 408.7±402.4 |
|
| Tumor status |
|
|
|
|
|
|
|
|
|
| T0 | 9 | 6 | 3 | 712.7±854.2 | 0.3270b | 8 | 1 | 205.3±308.8 | 0.1526b |
| T1 | 84 | 40 | 44 | 874.8±847.4 |
| 57 | 27 | 353.7±378.5 |
|
| T2, T3,
T4 | 82 | 25 | 57 | 1048.9±934.9 |
| 43 | 39 | 431.4±387.6 |
|
| Nodal status |
|
|
|
|
|
|
|
|
|
| N0 | 137 | 61 | 76 | 890.2±884.1 | 0.1032a | 88 | 49 | 346.2±337.1 | 0.0165a,c |
| N1, N2,
N3 | 38 | 10 | 28 | 1156.5±894.3 |
| 20 | 18 | 513.4±495.7 |
|
| Pathological
stage |
|
|
|
|
|
|
|
|
|
| 0 | 8 | 6 | 2 | 641.6±884.3 | 0.0632b | 8 | 0 | 107.5±102.7 | 0.0388b,c |
| I | 111 | 51 | 60 | 842.8±816.2 |
| 71 | 40 | 358.2±352.2 |
|
| II | 26 | 7 | 19 | 1264.0±1190.4 |
| 12 | 14 | 517.9±427.0 |
|
|
III | 30 | 7 | 23 | 1145.4±790.0 |
| 17 | 13 | 428.2±450.5 |
|
|
Differentiation |
|
|
|
|
|
|
|
|
|
|
Well | 35 | 18 | 17 | 765.4±717.5 | 0.0130b,c | 27 | 8 | 252.5±270.9 | 0.0015b,c |
|
Moderately | 105 | 46 | 59 | 881.0±864.8 |
| 68 | 37 | 363.7±361.7 |
|
|
Poorly | 35 | 7 | 28 | 1331.8±1028.3 |
| 13 | 22 | 568.8±467.5 |
|
| Histology |
|
|
|
|
|
|
|
|
|
| Ad | 141 | 61 | 80 | 857.5±801.0 | 0.0206b,c | 98 | 43 | 336.1±356.2 | 0.0036b,c |
| Sq | 27 | 9 | 18 | 1356.1±1244.2 |
| 10 | 17 | 594.2±474.7 |
|
| La | 7 | 1 | 6 | 1198.6±556.9 |
| 0 | 7 | 499.9±154.0 |
|
| Total number of
patients | 175 | 71 | 104 | 948.1±890.6 |
| 108 | 67 | 382.5±381.9 |
|
Distribution and clinical significance
of M2 TAMs among resected NSCLCs
Immunohistochemistry for CD163 exhibited a
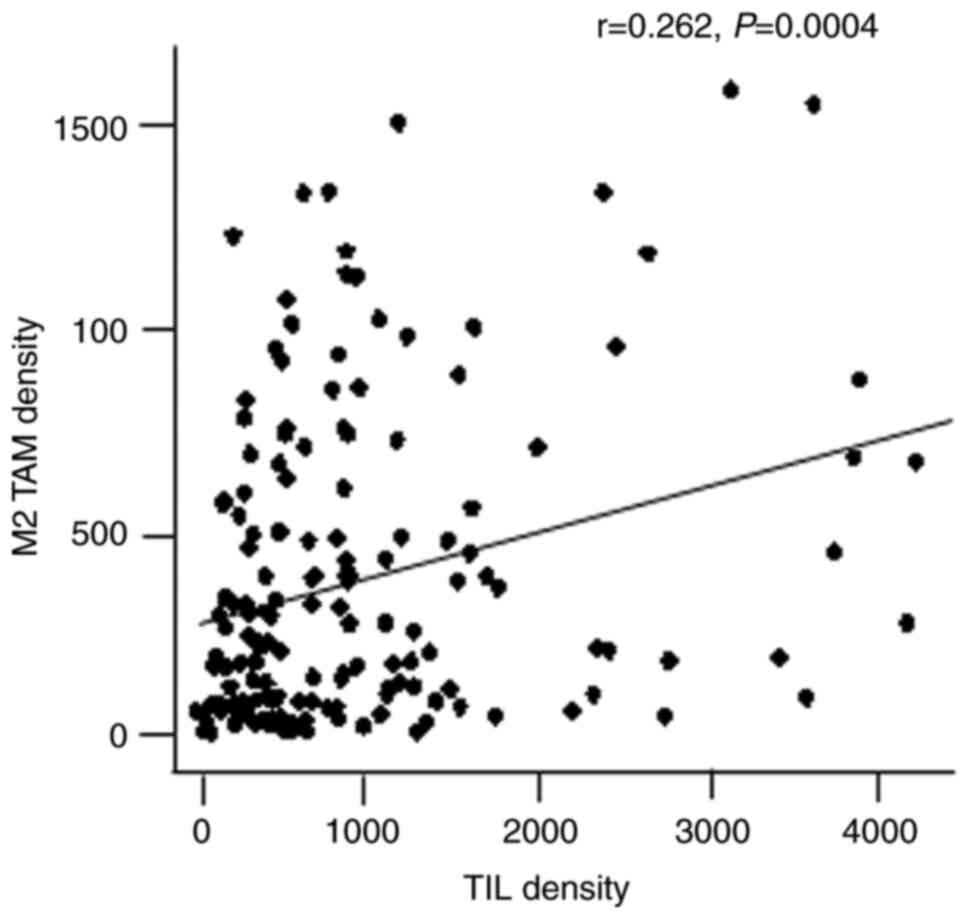
membranous and cytoplasmic staining pattern (Fig. 1G). The M2 TAM density also varied
among the 175 tumor tissues (mean ± standard deviation,
382.5±381.9; Table I). There was a
weak correlation between TIL and M2 TAM densities (r=0.262;
P=0.0004; Fig. 2). The sample was
classified as M2 TAM-high when the M2 TAM density was >380 due
to the highest significance in the level of C-reactive protein, a
marker of the inflammatory response, as previously reported
(23). A total of 108 tumors
(61.7%) were classified as M2 TAM-low and 67 tumors (38.3%) were
classified as M2 TAM-high. The M2 TAM density was also
significantly higher in squamous cell carcinoma compared with that
in adenocarcinoma (P=0.0036). The M2 TAM density was also
significantly higher in poorly differentiated tumors compared with
that in well- and moderately differentiated tumors (P=0.0015).
Furthermore, the M2 TAM density was significantly higher in
node-positive tumors and advanced stage (P=0.0165 and P=0.0388,
respectively).
Expression of PD-L1 on TCs and ICs
with respect to TILs and M2 TAMs
The percentage of PD-L1-positive TCs varied among
the 175 tumor tissues (mean ± standard deviation; 15.6±27.0%;
Fig. 1B). PD-L1 expression on TCs
was significantly higher in squamous cell carcinoma compared with
that in adenocarcinoma (P=0.0001).
The percentage of PD-L1-positive ICs also varied
(mean ± standard deviation, 9.4±10.9%; Fig. 1D). PD-L1 expression on ICs was also
significantly higher in squamous cell carcinoma compared with that
in adenocarcinoma (P=0.0173). Furthermore, PD-L1 expression on ICs
was significantly associated with tumor status, nodal status and
pathological stage (P=0.0104, P=0.0166 and P=0.0027,
respectively).
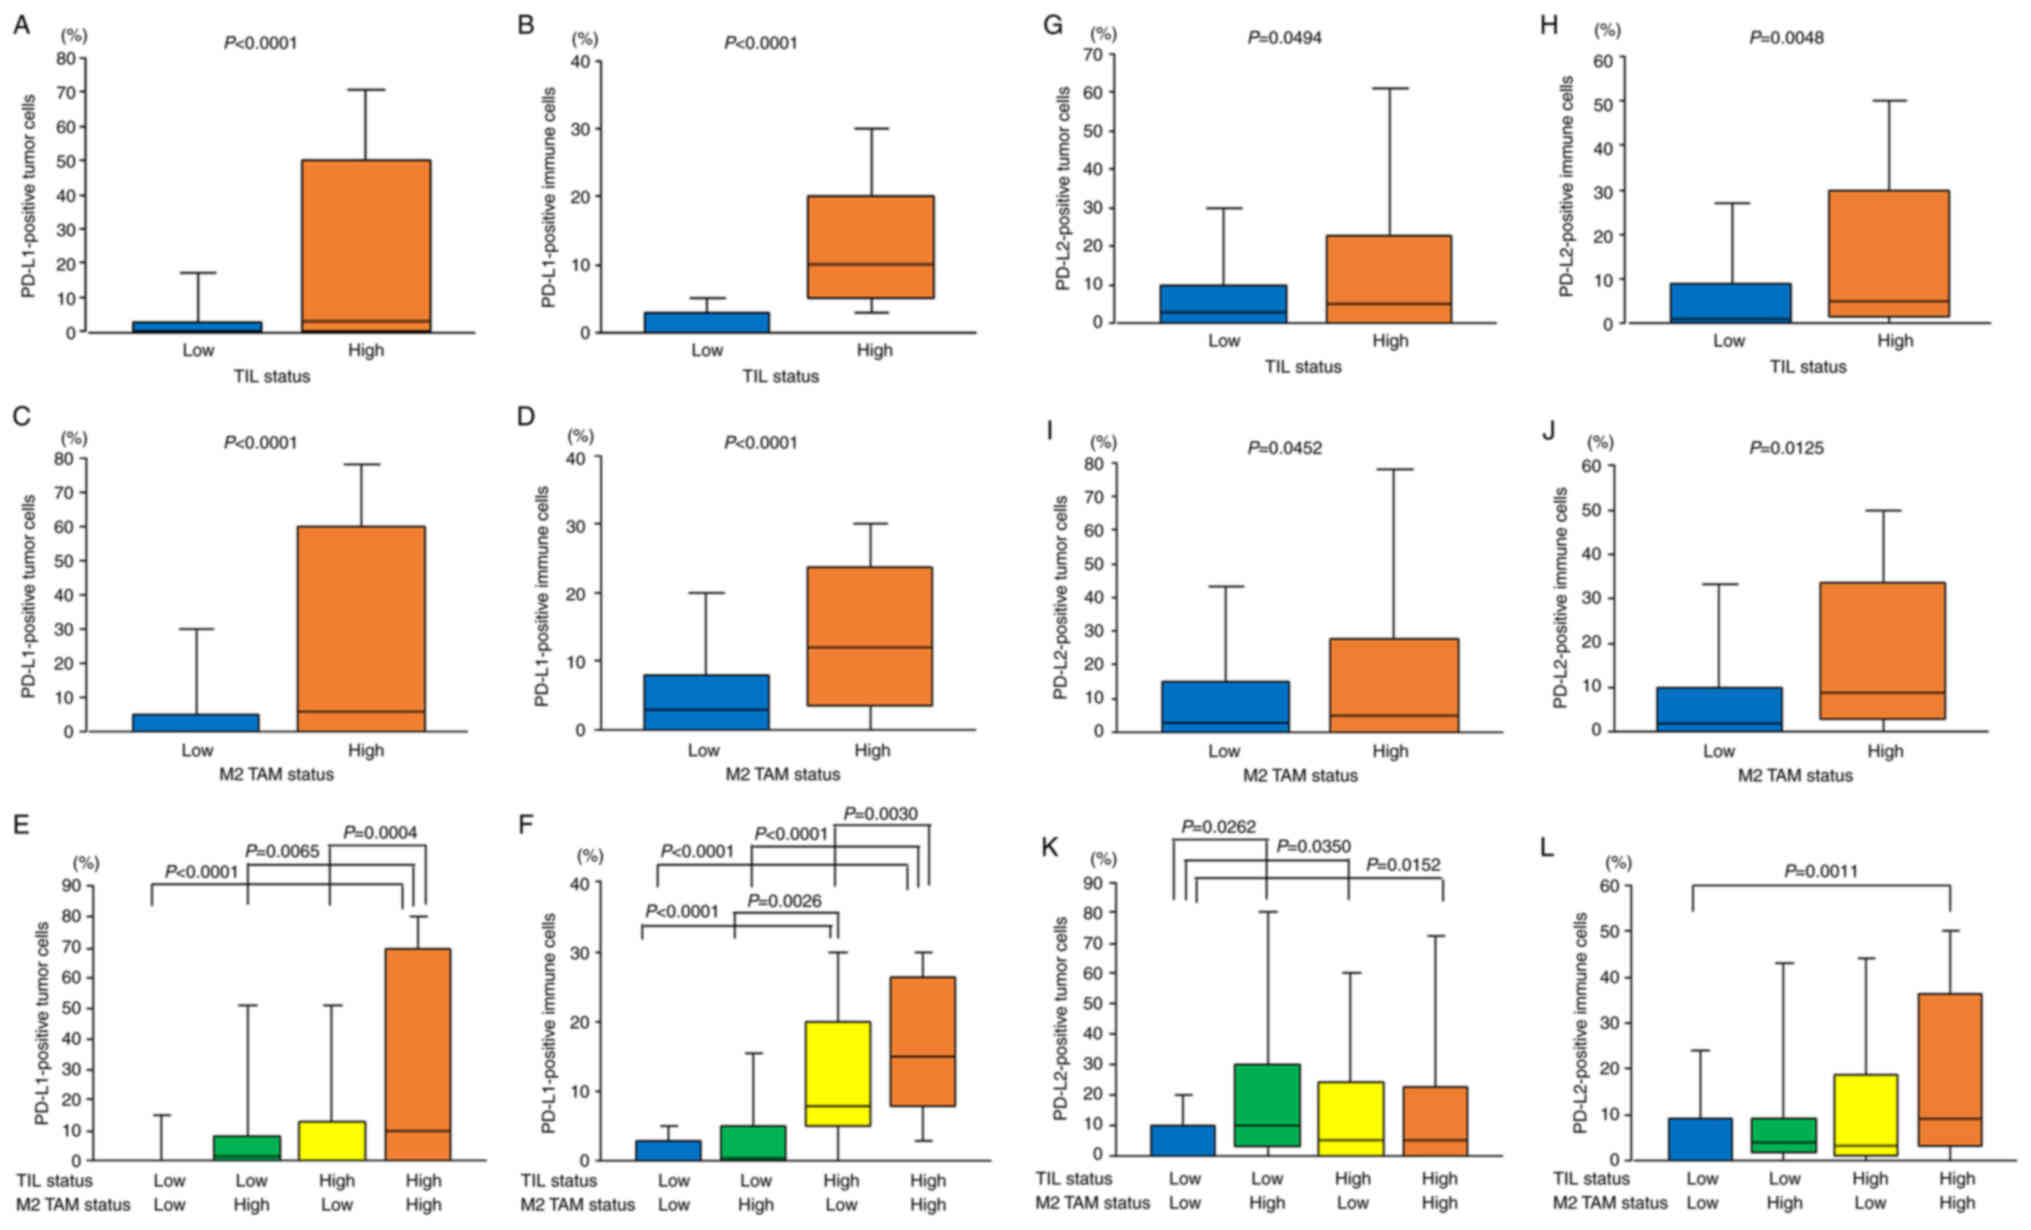
With respect to TILs, the TIL density was
significantly correlated with the percentage of PD-L1-positive TCs
(r=0.365; P<0.001). The percentage of PD-L1-positive TCs was
significantly higher in the TIL-high group compared with that in
the TIL-low group (22.2±30.8% vs. 6.1±16.0%; P<0.0001; Fig. 3A). Furthermore, the TIL density was
also significantly correlated with the percentage of PD-L1-positive
ICs (r=0.751; P<0.001). The percentage of PD-L1-positive ICs was
significantly higher in the TIL-high group compared with that in
the TIL-low group (14.4±11.2% vs. 1.9±3.5%; P<0.0001; Fig. 3B).
As previously reported (8), with respect to M2 TAMs, the M2 TAM
density was significantly correlated with the percentage of
PD-L1-positive TCs (r=0.389; P<0.001). The percentage of
PD-L1-positive TCs was significantly higher in the M2 TAM-high
group compared with that in the M2 TAM-low group (26.5±32.3% vs.
8.9±20.5%; P<0.0001; Fig. 3C).
Furthermore, the M2 TAM density was significantly correlated with
the percentage of PD-L1-positive ICs (r=0.375; P<0.001). The
percentage of PD-L1-positive ICs was significantly higher in the M2
TAM-high group compared with that in the M2 TAM-low group
(14.2±12.0% vs. 6.4±8.8%; P<0.0001; Fig. 3D).
With respect to the combined evaluation of TILs and
M2 TAMs, the percentage of PD-L1-positive TCs was significantly the
highest in both the TIL-high and M2 TAM-high tumors (Fig. 3E). The percentage of PD-L1-positive
ICs was also significantly the highest in both the TIL-high and M2
TAM-high tumors (Fig. 3F).
Expression of PD-L2 on TCs and ICs
with respect to TILs and M2 TAMs
The percentage of PD-L2-positive TCs varied among
the 175 tumor tissues (mean ± standard deviation, 14.6±22.9%;
Fig. 1F) and there were <1% in
70 (40.0%) tumors, 1–49% in 84 (48.0%) tumors and ≥50% in 21
(12.0%) tumors (Table II). The
percentage of PD-L2-positive ICs also varied (mean ± standard
deviation, 12.5±18.4%; Fig. 1H)
and there were <1% in 50 (28.6%) tumors, 1–9% in 69 (39.4%)
tumors and ≥10% in 56 (32.0%) tumors (Table II).
| Table II.Distributions of PD-L1 and PD-L2
expressions among NSCLC patients according to clinicopathological
characteristics. |
Table II.
Distributions of PD-L1 and PD-L2
expressions among NSCLC patients according to clinicopathological
characteristics.
|
|
| PD-L1 expression on
TCs | PD-L1 expression on
ICs | PD-L2 expression on
TCs | PD-L2 expression on
ICs |
|---|
|
|
|
|
|
|
|
|---|
|
| n | <1% | 1-49% | ≥50% | P-value | <1% | 1-9% | ≥10% | P-value | <1% | 1-49% | ≥50% | P-value | <1% | 1-9% | ≥10% | P-value |
|---|
| Smoking |
|
|
|
|
|
|
|
|
|
|
|
|
|
|
|
|
|
|
Non-smoker | 90 | 50 | 25 | 15 | 0.5946a | 27 | 32 | 31 | 0.9917a | 30 | 47 | 13 | 0.1596a | 24 | 35 | 31 | 0.7427a |
|
Smoker | 85 | 51 | 18 | 16 |
| 25 | 31 | 29 |
| 40 | 37 | 8 |
| 26 | 34 | 25 |
|
| Tumor status |
|
|
|
|
|
|
|
|
|
|
|
|
|
|
|
|
|
| T0 | 9 | 6 | 2 | 1 | 0.1414a | 5 | 3 | 1 | 0.0104a,b | 2 | 7 | 0 | 0.0218a,b | 2 | 1 | 6 | 0.1569a |
| T1 | 84 | 56 | 15 | 13 |
| 25 | 38 | 21 |
| 26 | 44 | 14 |
| 22 | 34 | 28 |
|
| T2, T3,
T4 | 82 | 39 | 26 | 17 |
| 22 | 22 | 38 |
| 42 | 33 | 7 |
| 26 | 34 | 22 |
|
| Nodal status |
|
|
|
|
|
|
|
|
|
|
|
|
|
|
|
|
|
| N0 | 137 | 84 | 33 | 20 | 0.0848a | 46 | 51 | 40 | 0.0166a,b | 56 | 64 | 17 | 0.8082a | 44 | 49 | 44 | 0.0852a |
| N1, N2,
N3 | 38 | 17 | 10 | 11 |
| 6 | 12 | 20 |
| 14 | 20 | 4 |
| 6 | 20 | 12 |
|
| Pathological
stage |
|
|
|
|
|
|
|
|
|
|
|
|
|
|
|
|
|
| 0 | 8 | 6 | 2 | 0 | 0.3067a | 5 | 3 | 0 | 0.0027a,b | 2 | 6 | 0 | 0.6336a | 2 | 1 | 5 | 0.2355a |
| I | 111 | 69 | 25 | 17 |
| 38 | 43 | 30 |
| 46 | 50 | 15 |
| 36 | 41 | 34 |
|
| II | 26 | 13 | 8 | 5 |
| 4 | 10 | 12 |
| 12 | 12 | 2 |
| 6 | 14 | 6 |
|
|
III | 30 | 13 | 8 | 9 |
| 5 | 7 | 18 |
| 10 | 16 | 4 |
| 6 | 13 | 11 |
|
|
Differentiation |
|
|
|
|
|
|
|
|
|
|
|
|
|
|
|
|
|
|
Well | 35 | 25 | 9 | 1 | 0.0002a,b | 12 | 17 | 6 |
<0.0001a,b | 7 | 22 | 6 | 0.0260a,b | 8 | 10 | 17 | 0.0326a,b |
|
Moderately | 105 | 63 | 27 | 15 |
| 36 | 39 | 30 |
| 47 | 46 | 12 |
| 34 | 39 | 32 |
|
|
Poorly | 35 | 13 | 7 | 35 |
| 4 | 7 | 24 |
| 16 | 16 | 3 |
| 8 | 20 | 7 |
|
| Histology |
|
|
|
|
|
|
|
|
|
|
|
|
|
|
|
|
|
| Ad | 141 | 84 | 40 | 17 | 0.0001a,b | 45 | 56 | 40 | 0.0173a,b | 53 | 70 | 18 | 0.6431a | 42 | 59 | 40 | 0.2096a |
| Sq | 27 | 15 | 3 | 9 |
| 6 | 6 | 15 |
| 13 | 11 | 3 |
| 6 | 7 | 14 |
|
| La | 7 | 2 | 0 | 5 |
| 1 | 1 | 5 |
| 4 | 3 | 0 |
| 2 | 3 | 2 |
|
| Total number | 175 | 101 | 43 | 31 |
| 52 | 63 | 60 |
| 70 | 84 | 21 |
| 50 | 69 | 56 |
|
With respect to TILs, the percentage of
PD-L2-positive TCs was significantly higher in the TIL-high group
compared with that in the TIL-low group (17.4±25.9% vs. 10.5±17.0%;
P=0.0494; Fig. 3G). In addition,
the TIL density was significantly correlated with the percentage of
PD-L2-positive ICs (r=0.226; P=0.003). The percentage of
PD-L2-positive ICs was significantly higher in the TIL-high group
compared with that in the TIL-low group (15.7±19.7% vs. 7.8±15.3%;
P=0.0048; Fig. 3H).
With respect to M2 TAMs, the percentage of
PD-L2-positive TCs was significantly higher in the M2 TAM-high
group compared with that in the M2 TAM-low group (19.0±27.9% vs.
11.9±18.9%; P=0.0452; Fig. 3I).
Furthermore, the percentage of PD-L2-positive ICs was also
significantly higher in the M2 TAM-high group compared with that in
the M2 TAM-low group (16.9±19.8% vs. 9.8±17.0%; P=0.0125; Fig. 3J).
With respect to the combined evaluation of TILs and
M2 TAMs, the percentage of PD-L2-positive TCs was significantly the
lowest in both the TIL-low and M2 TAM-low tumors (Fig. 3K). The percentage of PD-L2-positive
ICs was significantly lower in both the TIL-low and M2 TAM-low
tumors compared with that in both the TIL-high and M2 TAM-high
tumors (P=0.0011; Fig. 3L).
Correlations between the expression of
PD-L1 and PD-L2 on the TCs and ICs among resected NSCLC
There was no correlation between the percentage of
PD-L1-positive TCs and the percentage of PD-L2-positive TCs
(r=0.019; P=0.8049; Fig. 4A). On
the other hand, the percentage of PD-L1-positive TCs was
significantly correlated with the percentage of PD-L1-positive ICs
(r=0.396; P<0.0001; Fig. 4B).
In addition, the percentage of PD-L2-positive TCs also was
significantly correlated with the percentage of PD-L2-positive ICs
(r=0.488; P<0.0001; Fig.
4C).
Expression of PD-L1 and PD-L2 with
respect to tumor differentiation
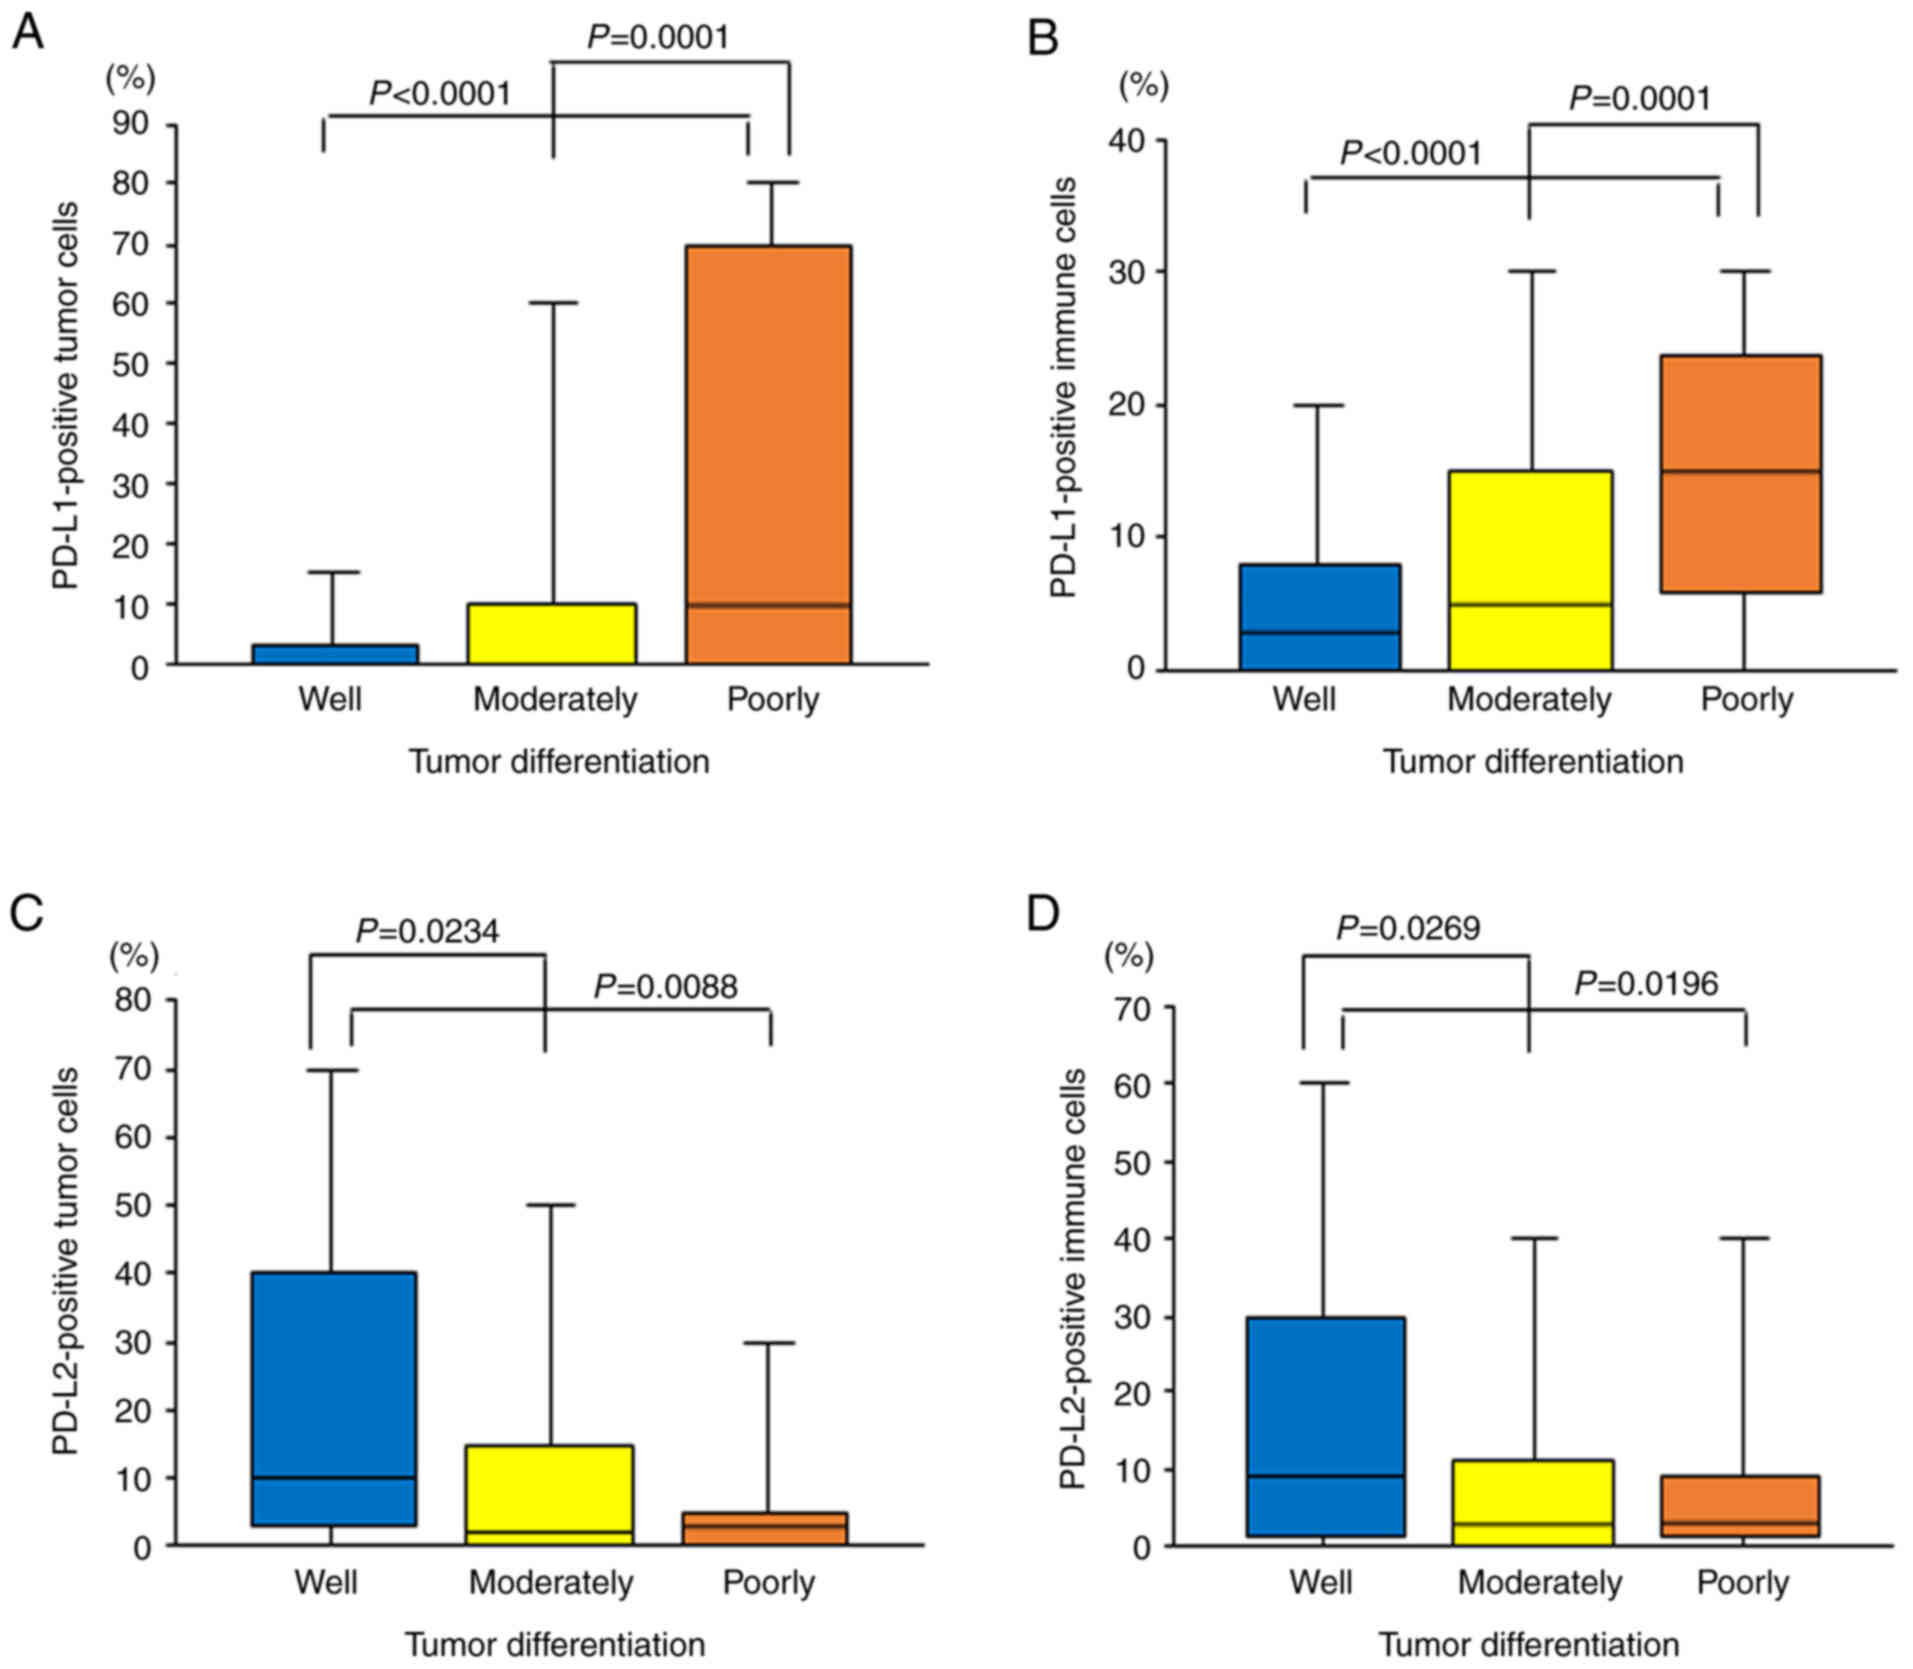
PD-L1 expression on TCs was significantly associated
with tumor differentiation (P=0.0002; Table II), as previously reported
(8). The percentage of
PD-L1-positive TCs was 6.0±17.0% in well-differentiated tumors,
13.1±24.2% in moderately differentiated tumors and 32.8±34.9% in
poorly differentiated tumors. The percentage of PD-L1-positive TCs
was significantly higher in poorly differentiated tumors compared
with that in well- and moderately differentiated tumors
(P<0.0001 and P=0.0001, respectively; Fig. 5A).
Furthermore, PD-L1 expression on ICs was also
significantly associated with tumor differentiation (P<0.0001;
Table II), as previously reported
(8). The percentage of
PD-L1-positive ICs was 5.7±8.6% in well-differentiated tumors,
8.3±10.0% in moderately differentiated tumors and 16.2±12.6% in
poorly differentiated tumors. The percentage of PD-L1-positive ICs
was significantly higher in poorly differentiated tumors compared
with that in well- and moderately differentiated tumors
(P<0.0001 and P=0.0001, respectively; Fig. 5B).
On the other hand, PD-L2 expression on TCs was
inversely associated with tumor differentiation (P=0.0260; Table II). The percentage of
PD-L2-positive TCs was 23.5±25.9% in well-differentiated tumors,
13.4±22.4% in moderately differentiated tumors and 9.2±19.1% in
poorly differentiated tumors. The percentage of PD-L2-positive TCs
was significantly higher in well-differentiated tumors compared
with that in poorly and moderately differentiated tumors (P=0.0088
and P=0.0234, respectively; Fig.
5C).
The PD-L2 expression on ICs was also inversely
associated with tumor differentiation (P=0.0326; Table II). The percentage of
PD-L2-positive ICs was 19.3±22.5% in well-differentiated tumors,
11.4±17.4% in moderately differentiated tumors and 9.1±15.3% in
poorly differentiated tumors. The percentage of PD-L2-positive ICs
was significantly higher in well-differentiated tumors compared
with that in poorly and moderately differentiated tumors (P=0.0196
and P=0.0269, respectively; Fig.
5D).
Discussion
A comprehensive study on PD-L1 and PD-L2 expression
on both TCs and ICs in NSCLC was performed. A recent study reports
that PD-L1 has predominant roles in Th1-type immunity whereas PD-L2
is involved in Th2-type immunity (26). In addition, to elucidate the
biological mechanisms of their regulation, TILs and M2 TAMs, which
are key components of the TME and associated with tumor
progression, were investigated. The evaluation of PD-L1 and PD-L2
on both TCs and ICs is clinically important and
immunohistochemistry is an appropriate method for the design of the
present study. A previous study reports that the Ventana PD-L1
(SP-263) assay is clinically useful for PD-L1 staining on both TCs
and ICs (24). In addition, the
PD-L2 expression using the Ventana system also exhibited a clear
staining on both TCs and ICs in the present study.
Consequently, the present study revealed that the
TIL density was strongly associated with the PD-L1 expression on
both TCs and ICs. On the other hand, PD-L2 was widely expressed not
only on TCs, but also on ICs in NSCLC. In addition, the TIL density
was also associated with PD-L2 expression on both TCs and ICs.
Initially, CD8+ or CD4+ T cells and NK cells
are known to induce PD-L1 expression by producing interferon
(IFN)-γ (27,28). TILs have been reported to be an
important cause of PD-L1 expression on ICs, such as lymphatic
endothelial cells, macrophages and monocytes (29–31).
Numerous clinical studies have also revealed that TILs are
associated with PD-L1 expression in human cancer, including NSCLC
(7,32,33).
In addition, previous studies report that TILs are also associated
with PD-L2 expression in human cancer (33,34).
Based on the physiological or pathological
situation, macrophages can be polarized into various phenotypes
with different biological properties, such as tumor-inhibiting M1
macrophages and tumor-promoting M2 macrophages (35,36).
During tumor progression, Th2-derived cytokines originating from
TCs and stromal cells can induce the production of M2 TAMs in the
TME, which can promote tumor cell proliferation (37). In fact, the M2 TAM density was
associated with nodal status and pathological stage in the present
study. Thus, M2 TAM-high tumors have more aggressive potential in
NSCLC (23).
On the other hand, our previous study found that the
M2 TAM density was strongly associated with PD-L1 expression on
both TCs and ICs (8). In addition,
the present study demonstrated that the M2 TAM density was also
associated with the PD-L2 expression on both TCs and ICs.
Experimental studies report that TCs can induce M2 TAMs with
increased expression of PD-L1 (38,39).
It is also known that PD-L1, induced by IFN-γ from TAMs, promoted
the progression of lung cancer (40). Recent studies show that other
signals derived from macrophages, such as TNF-α, VEGF and CXCL8,
can induce PD-L1 expression (41–43).
In addition, previous studies report that macrophages can induce
not only PD-L1 expression, but also PD-L2 expression (44,45).
From these findings, the TIL and M2 TAM densities
were associated with the expression of PD-L1 and PD-L2 on TCs and
ICs. In the present study, the TIL density was significantly
associated with the preoperative serum albumin level (r=0.269;
P<0.001; Fig. S1A) and the
preoperative peripheral blood lymphocyte count (r=0.209; P=0.006;
Fig. S1B). Therefore, TILs are
considered to be a host-related factor. By contrast, M2 TAMs are
considered to be a tumor-related factor (23). Thus, such complex crosstalk in the
TME, including TILs and M2 TAMs, could affect the expression of
PD-L1 and PD-L2 on TCs and ICs in NSCLC (46).
However, the present study demonstrated the
additional finding of no correlation between PD-L1 expression on
TCs and PD-L2 expression on TCs, despite the possible same
regulations by TILs and M2 TAMs. Several studies also report a high
frequency of discordance between PD-L1 and PD-L2 expression in
human cancer (47,48). By contrast, there were correlations
between PD-L1 expression on TCs and PD-L1 expression on ICs and
between PD-L2 expression on TCs and PD-L2 expression on ICs in the
present study.
The present study revealed that tumor
differentiation was strongly associated with PD-L1 expression on
TCs and ICs. The percentages of PD-L1-positive TCs and
PD-L1-positive ICs were higher in poorly differentiated tumors
compared with that in well- and moderately differentiated tumors. A
meta-analysis on PD-L1 expression in lung cancer also reports the
same results (49). In addition,
an experimental study reveals that PD-L1 could upregulate the
β-catenin signaling pathway to induce epithelial-mesenchymal
transition (50), which is
associated with tumor differentiation in lung cancer (51,52).
By contrast, tumor differentiation was inversely associated with
PD-L2 expression on TCs and ICs in the present study. The
percentages of PD-L2-positive TCs and PD-L2-positive ICs were
higher in well-differentiated tumors compared with that in poorly
and moderately differentiated tumors.
Therefore, the combined evaluation of PD-L1 and
PD-L2 expression could be considered clinically important in the
treatment strategy of immune-checkpoint inhibitors in patients with
NSCLC. In particular, the evaluation of PD-L2 expression may be
necessary for patients with PD-L1-negative NSCLC. Patients with
PD-L2-positive NSCLC could be treated with anti-PD-1 antibodies,
such as Pembrolizumab, and combined treatment with anti-PD-L2
antibodies in the future (18–20).
In fact, in the present study, immune-checkpoint inhibitors were
only used in 7 cases of PD-L1-positive tumors at the time of
disease recurrence, whereas 56 cases had recurrence following
surgery. Further clinical studies are required for patients with
PD-L2-positive NSCLC. In addition, the present study was performed
using a relatively small number of patients at one institution.
Therefore, a further study using more cases is required to
elucidate the clinical significance of PD-L2 expression, especially
with respect to the treatment strategy of immune-checkpoint
inhibitors. Furthermore, the present study was evaluated only by
immunohistochemistry and a further study to investigate their gene
copy numbers may be needed (53).
In conclusion, PD-L1 and PD-L2 expression on TCs and
ICs was associated with TILs and M2 TAMs in NSCLC. However, there
was no correlation between PD-L1 and PD-L2 expression on TCs.
Meanwhile, PD-L1 expression on TCs and ICs was associated with
tumor differentiation, while PD-L2 expression on TCs and ICs was
inversely associated with tumor differentiation. The combined
evaluation of PD-L1 and PD-L2 expression could be considered
clinically important in the treatment strategy of immune-checkpoint
inhibitors in patients with NSCLC. In particular, the evaluation of
PD-L2 expression may be necessary for patients with PD-L1-negative
NSCLC.
Supplementary Material
Supporting Data
Acknowledgements
Not applicable.
Funding
Funding: No funding was received.
Availability of data and materials
The datasets used and/or analyzed during the current
study are available from the corresponding author on reasonable
request.
Authors' contributions
RS, CLH and HD designed the study. RS, CLH and MF
designed and performed the experiments. RS, CLH and HC collected
the data. RS and CLH analyzed and interpreted the data and wrote
the manuscript. RS and CLH confirm the authenticity of all the raw
data. All authors have read and approved the final version of the
manuscript for publication.
Ethics approval and consent to
participate
The current study was approved by the Institutional
Ethics Committee of the Kitano Hospital (approval no. P181200300)
and written informed consent was provided from each patient. The
research was conducted in compliance with the principles outlined
in the Declaration of Helsinki.
Patient consent for publication
Written informed consent for publication of patient
data/accompanying images was obtained.
Competing interests
The authors declare that they have no competing
interests.
References
|
1
|
Ettinger DS, Akerley W, Bepler G, Blum MG,
Chang A, Cheney RT, Chirieac LR, D'Amico TA, Demmy TL, Ganti AK, et
al: Non-small cell lung cancer. J Natl Compr Canc Netw. 8:740–801.
2010. View Article : Google Scholar : PubMed/NCBI
|
|
2
|
Hsu WH, Yang JC, Mok TS and Loong HH:
Overview of current systemic management of EGFR-mutant NSCLC. Ann
Oncol. 29 (Suppl_1):i3–i9. 2018. View Article : Google Scholar : PubMed/NCBI
|
|
3
|
Borghaei H, Paz-Ares L, Horn L, Spigel DR,
Steins M, Ready NE, Chow LQ, Vokes EE, Felip E, Holgado E, et al:
Nivolumab versus docetaxel in advanced nonsquamous non-small-cell
lung cancer. N Engl J Med. 373:1627–1639. 2015. View Article : Google Scholar : PubMed/NCBI
|
|
4
|
Herbst RS, Baas P, Kim DW, Felip E,
Perez-Gracia JL and Han JY: Pembrolizumab versus docetaxel for
previously treated, PD-L1-positive, advanced non-small-cell lung
cancer (KEYNOTE-010): A randomized controlled trial. Lancet.
387:1540–1550. 2016. View Article : Google Scholar : PubMed/NCBI
|
|
5
|
Rittmeyer A, Barlesi F, Waterkamp D, Park
K, Ciardiello F, von Pawel J, Gadgeel SM, Hida T and Kowalski DM:
Atezolizumab versus docetaxel in patients with previously treated
non-small-cell lung cancer (OAK): A phase 3, open-label,
multicenter randomized controlled trial. Lancet. 389:255–265. 2017.
View Article : Google Scholar : PubMed/NCBI
|
|
6
|
Kowanetz M, Zou W, Gettinger SN, Koeppen
H, Kockx M, Schmid P, Kadel EE, Wistuba I, Chaft J, Rizvi NA, et
al: Differential regulation of PD-L1 expression by immune and tumor
cells in NSCLC and the response to treatment with atezolizumab
(anti-PD-L1). Proc Natl Acad Sci USA. 115:E10119–E10126. 2018.
View Article : Google Scholar : PubMed/NCBI
|
|
7
|
Kim MY, Koh J, Kim S, Go H, Jeon YK and
Chung DH: Clinicopathological analysis of PD-L1 and PD-L2
expression in pulmonary squamous cell carcinoma: Comparison with
tumor-infiltrating T cells and the status of oncogenic drivers.
Lung Cancer. 88:24–33. 2015. View Article : Google Scholar : PubMed/NCBI
|
|
8
|
Sumitomo R, Hirai T, Fujita M, Murakami H,
Otake Y and Huang C: PD-L1 expression on tumor-infiltrating immune
cells is highly associated with M2 TAM and aggressive malignant
potential in patients with resected non-small cell lung cancer.
Lung Cancer. 136:136–144. 2019. View Article : Google Scholar : PubMed/NCBI
|
|
9
|
Shinchi Y, Komohara Y, Yonemitsu K, Sato
K, Ohnishi K, Saito Y, Fujiwara Y, Mori T, Shiraishi K, Ikeda K and
Suzuki M: Accurate expression of PD-L1/L2 in lung adenocarcinoma
cells: A retrospective study by double immunohistochemistry. Cancer
Sci. 110:2711–2721. 2019. View Article : Google Scholar : PubMed/NCBI
|
|
10
|
Matsubara T, Takada K, Azuma K, Takamori
S, Toyokawa G, Haro A, Osoegawa A, Tagawa T, Kawahara A, Akiba J,
et al: A clinicopathological and prognostic analysis of PD-L2
expression in surgically resected primary lung squamous cell
carcinoma. Ann Surg Oncol. 26:1925–1933. 2019. View Article : Google Scholar : PubMed/NCBI
|
|
11
|
Takamori S, Takada K, Azuma K, Jogo T,
Shimokawa M, Toyokawa G, Hirai F, Tagawa T, Kawahara A, Akiba J, et
al: Prognostic impact of programmed death-ligand 2 expression in
primary lung adenocarcinoma patients. Ann Surg Oncol. 26:1916–1924.
2019. View Article : Google Scholar : PubMed/NCBI
|
|
12
|
Baptista MZ, Sarian LO, Derchain SFM,
Pinto GA and Vassallo J: Prognostic significance of PD-L1 and PD-L2
in breast cancer. Hum Pathol. 47:78–84. 2016. View Article : Google Scholar : PubMed/NCBI
|
|
13
|
Zhao SG, Lehrer J, Chang SL, Das R, Erho
N, Liu Y, Sjostrom M, Den RB, Freedland SJ, Klein EA, et al: The
immune landscape of prostate cancer and nomination of PD-L2 as a
potential therapeutic target. J Natl Cancer Inst. 111:301–310.
2019. View Article : Google Scholar : PubMed/NCBI
|
|
14
|
Okadome K, Baba Y, Nomoto D, Yagi T,
Kalikawe R, Harada K, Hiyoshi Y, Nagai Y, Ishimoto T, Iwatsuki M,
et al: Prognostic and clinical impact of PD-L2 and PD-L1 expression
in a cohort of 437 oesophageal cancers. Br J Cancer. 122:1535–1543.
2020. View Article : Google Scholar : PubMed/NCBI
|
|
15
|
Okazaki T and Honjo T: PD-1 and PD-1
ligands: From discovery to clinical application. Int Immunol.
19:813–824. 2007. View Article : Google Scholar : PubMed/NCBI
|
|
16
|
Rozali EN, Hato SV, Robinson BW, Lake RA
and Lesterhuis WJ: Programmed death ligand 2 in cancer-induced
immune suppression. Clin Dev Immunol. 2021:6563402012.PubMed/NCBI
|
|
17
|
Zhong X, Tumang JR, Gao W, Bai C and
Rothstein TL: PD-L2 expression extends beyond dendritic
cells/macrophages to B1 cells enriched for V(H)11/V(H)12 and
phosphatidylcholine binding. Eur J Immunol. 37:2405–2410. 2007.
View Article : Google Scholar : PubMed/NCBI
|
|
18
|
Tanegashima T, Togashi Y, Azuma K,
Kawahara A, Ikeguchi K, Sugiyama D, Kinoshita F, Akiba J, Kashiwagi
E, Takeuchi A, et al: Immune suppression by PD-L2 against
spontaneous and treatment-related antitumor immunity. Clin Cancer
Res. 25:4808–4819. 2019. View Article : Google Scholar : PubMed/NCBI
|
|
19
|
Umezu D, Okada N, Sakoda Y, Adachi K,
Ojima T, Yamaue H, Eto M and Tamada K: Inhibitory functions of
PD-L1 and PD-L2 in the regulation of anti-tumor immunity in murine
tumor microenvironment. Cancer Immunol Immunother. 68:201–211.
2019. View Article : Google Scholar : PubMed/NCBI
|
|
20
|
Yearley JH, Gibson C, Yu N, Moon C, Murphy
E, Juco J, Lunceford J, Cheng J, Chow LQM, Seiwert TY, et al: PD-L2
Expression in Human Tumors: Relevance to Anti-PD-1 Therapy in
Cancer. Clin Cancer Res. 23:3158–3167. 2017. View Article : Google Scholar : PubMed/NCBI
|
|
21
|
Amin MB, Edge S and Greene F: AJCC Cancer
Staging Manual. 8th edition. Springer; New York: 2017, View Article : Google Scholar
|
|
22
|
Travis WD, Brambilla E, Burke AP, Marx A
and Nicholson AG: WHO Classification of Tumours of the Lung,
Pleura, Thymus and Heart. 4th edition. International Agency for
Research on Cancer; Lyon, France: 2015
|
|
23
|
Sumitomo R, Hirai T, Fujita M, Murakami H,
Otake Y and Huang C: M2 tumor-associated macrophages promote tumor
progression in non-small-cell lung cancer. Exp Ther Med.
18:4490–4498. 2019.PubMed/NCBI
|
|
24
|
Tsao MS, Kerr KM, Kockx M, Beasley M,
Borczuk AC, Botling J, Budendorf L, Chirieac L, Chen G, Chou T, et
al: PD-L1 immunohistochemistry comparability study in real-life
clinical samples: Results of Blueprint print phase 2 project. J
Thorac Oncol. 13:1302–1311. 2018. View Article : Google Scholar : PubMed/NCBI
|
|
25
|
Li Z, Maeda D, Yoshida M, Umakoshi M,
Nanjo H, Shiraishi K, Saito M, Kohno T, Konno H, Saito H, et al:
The intratumoral distribution influences the prognostic impact of
CD68- and CD204-positive macrophages in non-small cell lung cancer.
Lung Cancer. 123:127–135. 2018. View Article : Google Scholar : PubMed/NCBI
|
|
26
|
Tanaka R, Ichimura Y, Kubota N, Saito A,
Nakamura Y, Ishitsuka Y, Watanabe R, Fujisawa Y, Mizuno S,
Takahashi S, et al: Differential involvement of programmed cell
death ligands in skin immune responses. J Invest Dermatol.
142:145–154.e8. 2022. View Article : Google Scholar : PubMed/NCBI
|
|
27
|
Sanmamed MF and Chen L: Inducible
expression of B7-H1 (PD-L1) and its selective role in tumor site
immune modulation. Cancer J. 20:256–261. 2014. View Article : Google Scholar : PubMed/NCBI
|
|
28
|
Chen J, Feng Y, Lu L, Wang H, Dai L, Li Y
and Zhang P: Interferon-γ-induced PD-L1 surface expression on human
oral squamous carcinoma via PKD2 signal pathway. Immunobiology.
217:385–393. 2012. View Article : Google Scholar : PubMed/NCBI
|
|
29
|
Lane RS, Femel J, Breazeale AP, Loo CP,
Thibault G, Kaempf A, Mori M, Tsujikawa T, Chang YH and Lund AW:
IFNγ-activated dermal lymphatic vessels inhibit cytotoxic T cells
in melanoma and inflamed skin. J Exp Med. 215:3057–3074. 2018.
View Article : Google Scholar : PubMed/NCBI
|
|
30
|
Qian J, Wang C, Wang B, Yang J, Wang Y,
Luo F, Xu J, Zhao C, Liu R and Chu Y: The IFN-γ/PD-L1 axis between
T cells and tumor microenvironment: Hints for glioma
anti-PD-1/PD-L1 therapy. J Neuroinflammation. 15:2902018.
View Article : Google Scholar : PubMed/NCBI
|
|
31
|
Chen S, Crabill GA, Pritchard TS, McMiller
TL, Wei P, Pardoll DM, Pan F and Topalian SL: Mechanisms regulating
PD-L1 expression on tumor and immune cells. J Immunother Cancer.
7:3052019. View Article : Google Scholar : PubMed/NCBI
|
|
32
|
Arrieta O, Montes-Servin E,
Hernandez-Martinez J, Cardona AF, Cases-Ruiz E, Crispin JC, Motola
D, Flores-Estrada D and Barrera L: Expression of PD-1/PD-L1 and
PD-L2 in peripheral T-cells from non-small cell lung cancer
patients. Oncotarget. 8:101994–102005. 2017. View Article : Google Scholar : PubMed/NCBI
|
|
33
|
Kitsou M, Ayiomamitis GD and Zaravinos A:
High expression of immune checkpoints is associated with the TIL
load, mutation rate and patient survival in colorectal cancer. Int
J Oncol. 57:237–248. 2020. View Article : Google Scholar : PubMed/NCBI
|
|
34
|
Zhang Y, Xu J, Hua J, Liu J, Liang C, Meng
Q, Wei M, Zhang B and Yu X: A PD-L2-based immune marker signature
helps to predict survival in resected pancreatic ductal
adenocarcinoma. J Immunotherapy Cancer. 7:2332019. View Article : Google Scholar : PubMed/NCBI
|
|
35
|
Mei J, Xiao Z, Guo C, Pu Q, Ma L, Liu C,
Lin F, Liao H, You Z and Liu L: Prognostic impact of
tumor-associated macrophage infiltration in non-small cell lung
cancer: A systemic review and meta-analysis. Oncotarget.
7:34217–34228. 2016. View Article : Google Scholar : PubMed/NCBI
|
|
36
|
Jackute J, Zemaitis M, Pranys D,
Sitkauskiene B, Miliauskas S, Vaitkiene S and Sakalaukas R:
Distribution of M1 and M2 macrophages in tumor islets and stroma in
relation to prognosis of non-small cell lung cancer. BMC Immunol.
19:32018. View Article : Google Scholar : PubMed/NCBI
|
|
37
|
Mantovani A, Sozzani S, Locati M, Allavena
P and Sica A: Macrophage polarization: Tumor-associated macrophages
as a paradigm for polarized M2 mononuclear phagocytes. Trends
Immunol. 23:549–555. 2002. View Article : Google Scholar : PubMed/NCBI
|
|
38
|
Gabrusiewicz K, Li X, Wei J, Hashimoto Y,
Marisetty AL, Ott M, Wang F, Hawke D, Yu J, Healy LM, et al:
Glioblastoma stem cell-derived exosomes induce M2 macrophages and
PD-L1 expression on human monocytes. Oncoimmunology.
7:e14129092018. View Article : Google Scholar : PubMed/NCBI
|
|
39
|
Wen ZF, Liu H, Gao R, Zhou M, Ma J, Zhang
Y, Zhao J, Chen Y, Zhang T, Huang F, et al: Tumor cell-released
autophagosomes (TRAPs) promote immunosuppression through induction
of M2-like macrophages with increased expression of PD-L1. J
Immunother Cancer. 6:1512018. View Article : Google Scholar : PubMed/NCBI
|
|
40
|
Zhang X, Zeng Y, Qu Q, Zhu J, Liu Z, Ning
W, Zeng H, Zhang N, Du W, Chen C and Huang JA: PD-L1 induced by
IFN-γ from tumor-associated macrophages via the JAK/STAT3 and
PI3K/AKT signalling pathways promoted progression of lung cancer.
Int J Clin Oncol. 22:1026–1033. 2017. View Article : Google Scholar : PubMed/NCBI
|
|
41
|
Tsukamoto M, Imai K, Ishimoto T, Komohara
Y, Yamashita Y, Nakagawa S, Umezaki N, Yamao T, Kitano Y, Miyata T,
et al: PD-L1 expression enhancement by infiltrating
macrophage-derived tumor necrosis factor-α leads to poor pancreatic
cancer prognosis. Cancer Sci. 110:310–320. 2019.PubMed/NCBI
|
|
42
|
Lai YS, Wahyuningtyas R, Aui SP and Chang
KT: Autocrine VEGF signalling on M2 macrophages regulates PD-L1
expression for immunomodulation of T cells. J Cell Mol Med.
23:1257–1267. 2019.PubMed/NCBI
|
|
43
|
Lin C, He H, Liu H, Li R, Chen Y, Qi Y,
Jiang Q, Chen L, Zhang P, Zhang H, et al: Tumor-associated
macrophage-derived CXCL8 determines immune evasion through
autonomous PD-L1 expression in gastric cancer. Gut. 68:1764–1773.
2019. View Article : Google Scholar : PubMed/NCBI
|
|
44
|
Horlad H, Ma C, Yano H, Pan C, Ohnishi K,
Fujiwara Y, Endo S, Kikukawa Y, Okuno Y, Matsuoka M, et al: An
IL-27/Stat3 axis induces expression of programmed death ligands
(PD-L1/2) on infiltrating macrophages in lymphoma. Cancer Sci.
107:1696–1704. 2016. View Article : Google Scholar : PubMed/NCBI
|
|
45
|
Cai X, Yuan F, Zhu J, Yang J, Tang C, Cong
Z and Ma C: Glioma-associated stromal cells stimulate glioma
malignancy by regulating the tumor immune microenvironment. Front
Oncol. 11:6729282021. View Article : Google Scholar : PubMed/NCBI
|
|
46
|
Wang J, Li D, Cang H and Guo B: Crosstalk
between cancer and immune cells: Role of tumor-associated
macrophages in the tumor microenvironment. Cancer Med. 8:4709–4721.
2019. View Article : Google Scholar : PubMed/NCBI
|
|
47
|
Menguy S, Prochazkova-Carlotti M,
Beylot-Barry M, Saltel F, Vergier B, Merlio J and Pham-Ledard A:
PD-L1 and PD-L2 are differentially expressed by macrophages or
tumor cells in primary cutaneous diffuse large B-cell lymphoma, Leg
type. Am J Surg Pathol. 42:326–334. 2018. View Article : Google Scholar : PubMed/NCBI
|
|
48
|
Pinato DJ, Vallipuram A, Evans JS, Wong C,
Zhang H, Brown M, Dina RE, Trivedi P, Akarca AU, Marafioti T, et
al: Programmed cell death ligand expression drives immune
tolerogenesis across the diverse subtypes of neuroendocrine tumors.
Neuroendocrinology. 111:465–474. 2021. View Article : Google Scholar : PubMed/NCBI
|
|
49
|
Li H, Xu Y, Wan B, Song Y, Zhan P, Hu Y,
Zhang Q, Zhang F, Liu H, Li T, et al: The clinicopathological and
prognostic significance of PD-L1 expression assessed by
immunohistochemistry in lung cancer: A meta-analysis of 50 studies
with 11,383 patients. Transl Ling Cancer Res. 8:429–449. 2019.
View Article : Google Scholar : PubMed/NCBI
|
|
50
|
Yu W, Hua Y, Qiu H, Hao J, Zou Z, Li Z, Hu
S, Guo P, Chen M, Sui S, et al: PD-L1 promotes tumor growth and
progression by activating WIP and β-catenin signaling pathways and
predicts poor prognosis in lung cancer. Cell Death Dis. 11:5062020.
View Article : Google Scholar : PubMed/NCBI
|
|
51
|
Sato M, Shames DS and Hasegawa Y: Emerging
evidence of epithelial-to-mesenchymal transition in lung
carcinogenesis. Respirology. 17:1048–1059. 2012. View Article : Google Scholar : PubMed/NCBI
|
|
52
|
Brabletz S, Schuhwerk H, Brabletz T and
Stemmler MP: Dynamic EMT: A multi-tool for tumor progression. EMBO
J. 40:e1086472021. View Article : Google Scholar : PubMed/NCBI
|
|
53
|
Inoue Y, Yoshimura K, Nishimoto K, Inui N,
Karayama M, Yasui H, Hozumi H, Suzuki Y, Furuhashi K, Fujisawa T,
et al: Evaluation of programmed death ligand 1 (PD-L1) gene
amplification and response to nivolumab monotherapy in non-small
cell lung cancer. JAMA Netw Open. 3:e20118182020. View Article : Google Scholar : PubMed/NCBI
|